Attached files
| file | filename |
|---|---|
| 8-K - FORM 8-K - Strategic Realty Trust, Inc. | d395309d8k.htm |
| EX-99.1 - LETTER TO STOCKHOLDERS - Strategic Realty Trust, Inc. | d395309dex991.htm |
 SRT Property Portfolio
1
July 18, 2012
Exhibit 99.2 |
 SRT Portfolio
2
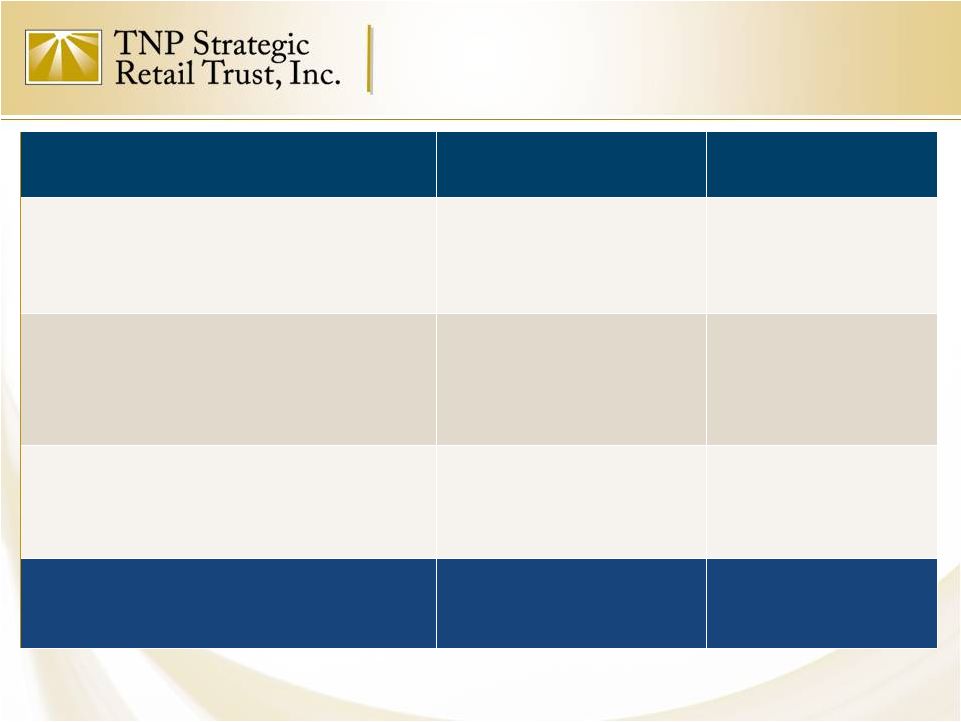
SRT PORTFOLIO ASSETS (As of June 30, 2012)
TOTAL
Purchase Price
$258,686,000
Current Cap Rate
8.31%
Total Rentable Square Feet
2,074,980
Occupancy (% of SF)
87.1%
Current Vacancy (SF)
274,631
Portfolio Debt
$184,427,000
Total Properties
20
Additional Acreage
49.8 Acres*
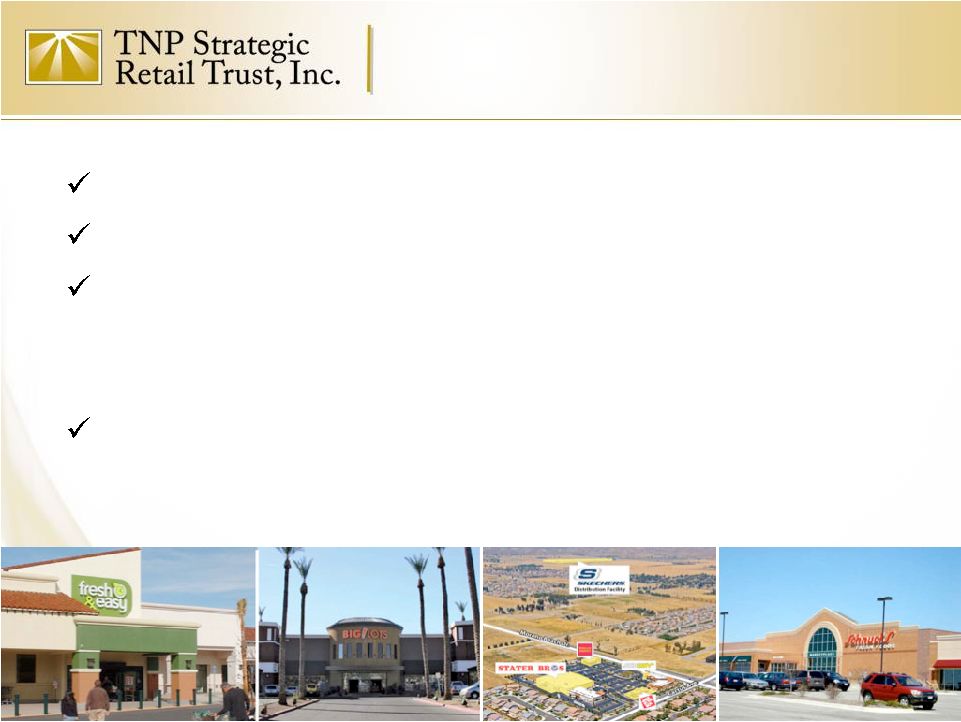
Anchor Tenants
Publix, Tom Thumb (Safeway), Stater Bros., Longs Drugs,
Wal-Mart, Ralphs, Fresh & Easy
* Approximate rentable square footage that may be built is 476,000 sq. ft. depending
upon use. CURRENT PORTFOLIO
Percent of Revenues from Anchor Tenants
41.73%
Percent of Square Feet Occupied by Anchor Tenants
48.87%
Average Remaining Lease Term of Anchor Tenants
11 Years, 1 Month (2023) |
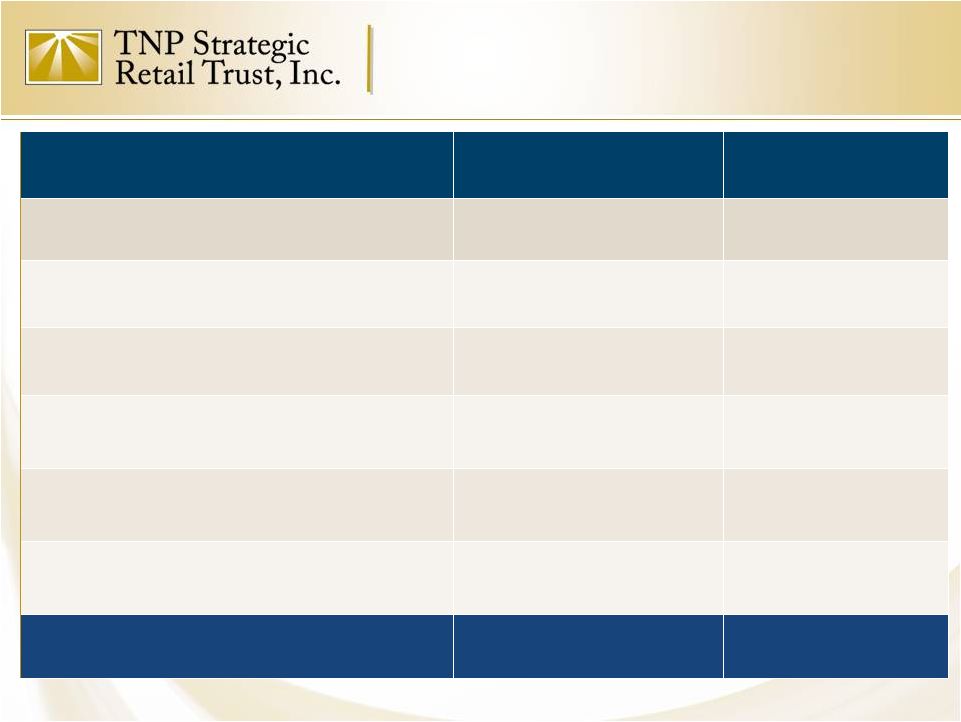
 SRT PORTFOLIO
METRICS TOTAL
Estimated Annual Revenue
$35,159,510
Estimated Annual Net Operating Income*
$21,141,367
Estimated Annual Interest Expense
($10,938,641)
Estimated Annual General Administration Expenses
($2,170,850)
Net Operating Income* after Interest Expense +
General Administration Expenses
$8,304,181
SRT Portfolio
3
*
Estimated
Annual
Net
Operating
Income
(NOI)
figures
are
based
on
2012
Budgets
and
are annualized for full
year operation.
EXPIRING
LEASES
FOR
SRT
PORTFOLIO
(Including
Visalia
Marketplace)
2012
2013
2014
2015
2016+
Number of Expiring Leases
56
48
54
42
124
Expiring Lease Square Footage
110,399
110,353
111,702
150,339
1,597,629
% of Expiring Leases
6.10%
6.10%
6.20%
8.40%
73.2% |
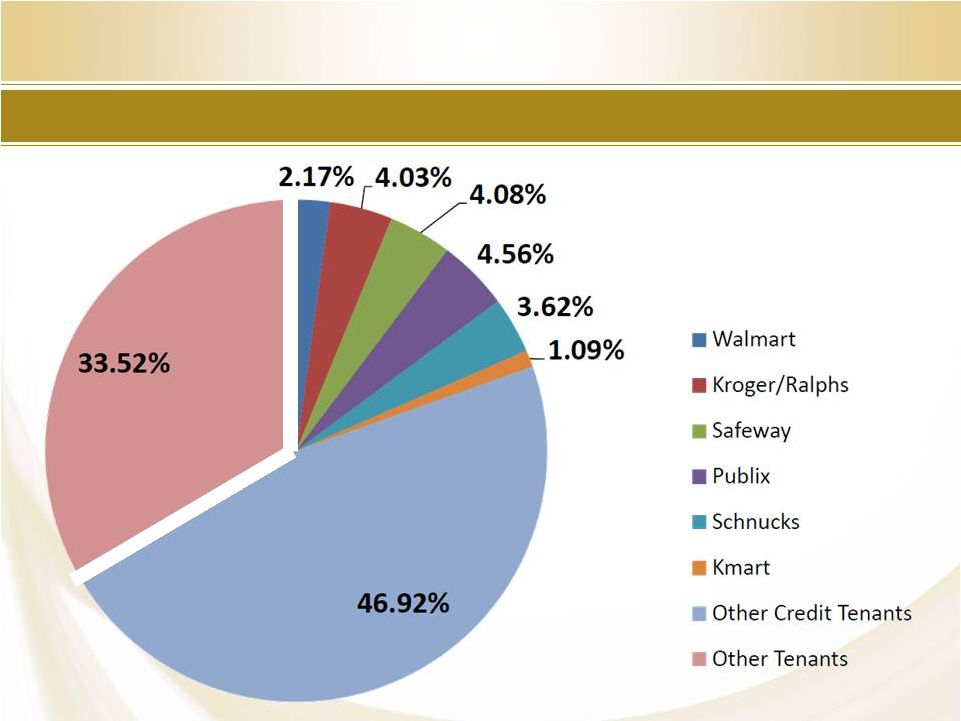 Credit Tenants as a Percentage Revenue
4
66% of Revenue is from Credit Tenants
OTHER
TENANTS |
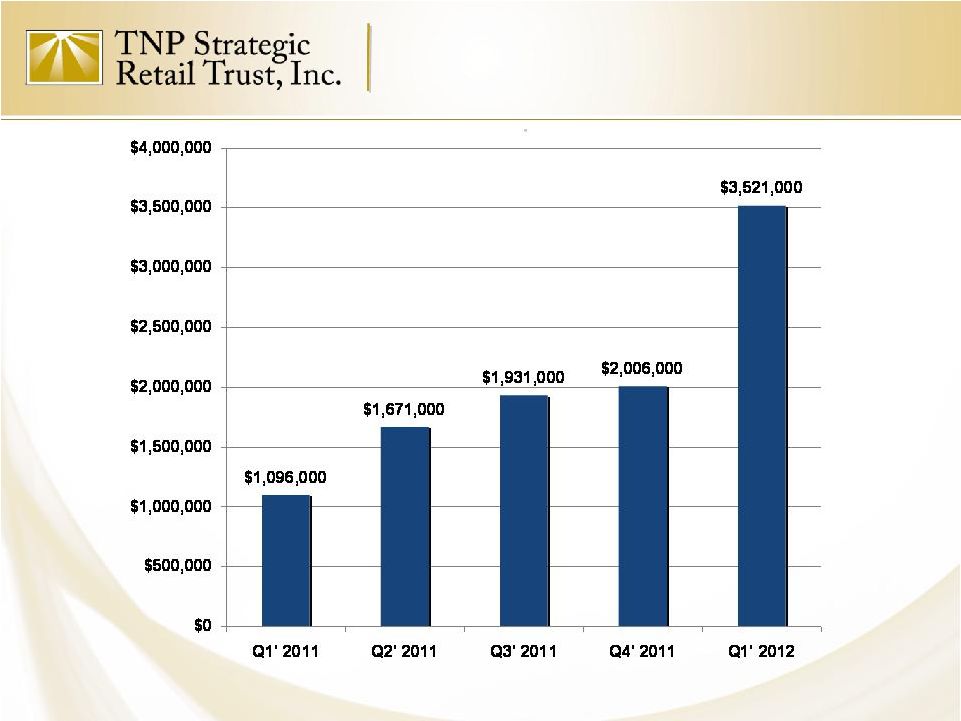 Property NOI*
5
*
Reconciliation of net income to net operating income can be found on the
Appendix to this presentation. |
 SRT PAD Sale Review |
 Craig Promenade
(North Las Vegas, Nevada) |
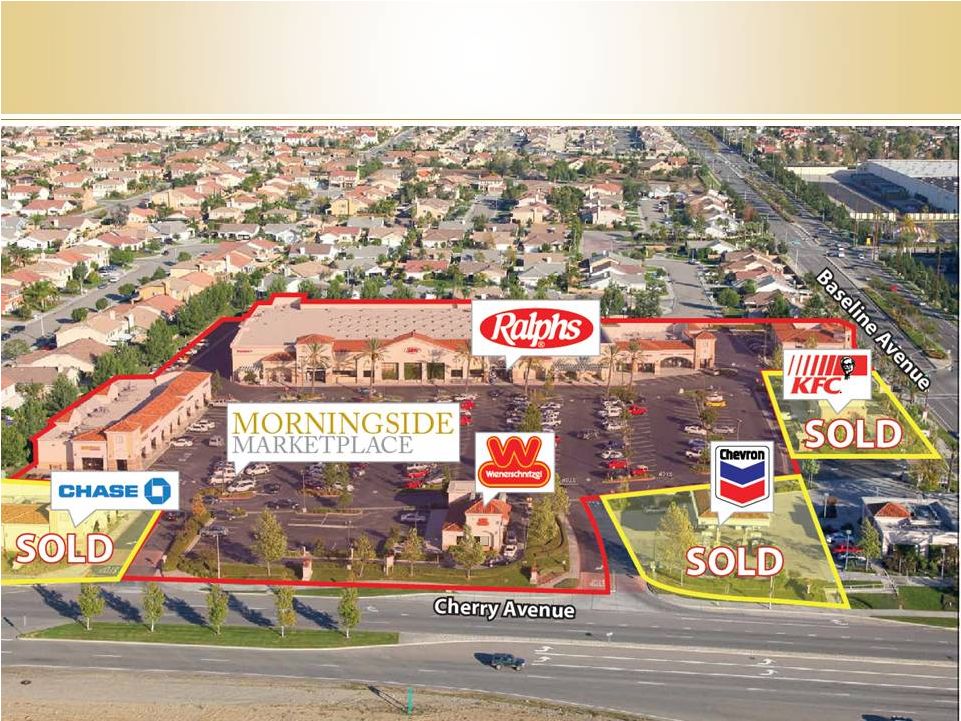 Morningside Marketplace
(Fontana, California) |
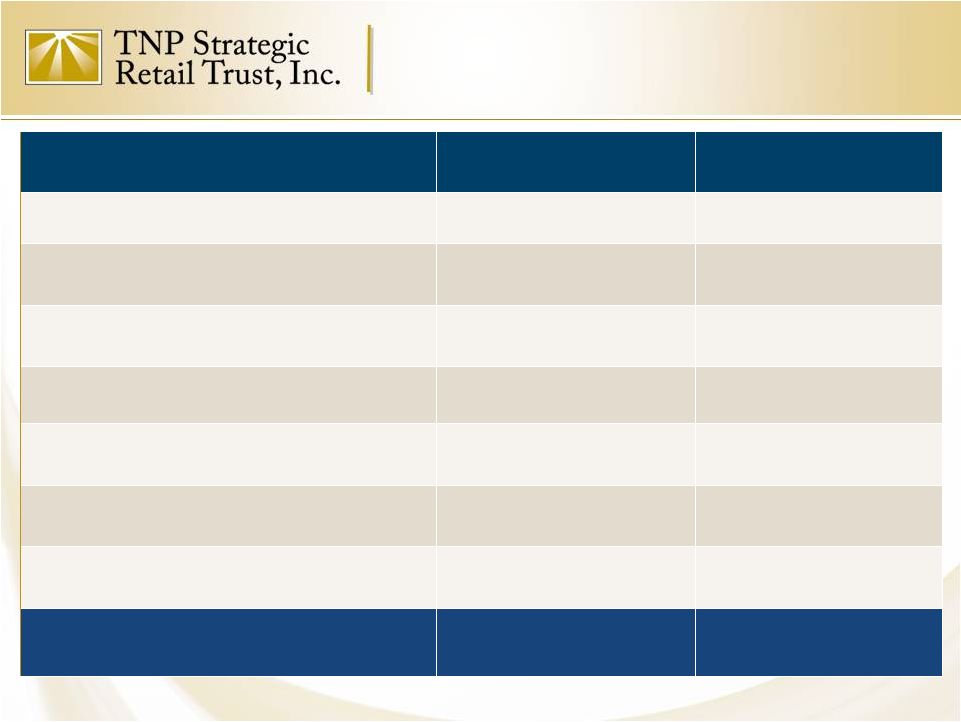
 SRT Completed PAD Sales
PROPERTY
CAP RATE
SALE PRICE
NET PROCEEDS
REINVESTED
CAP RATE
San Jacinto
JACK IN THE BOX
6.12%
$1,225,000
Reinvested in Summit
Point
7.56%
Craig Promenade
POPEYES
6.81%
$1,187,000
Reinvested in Topaz
Marketplace
8.27%
Craig Promenade
CARL’S JR.
7.30%
$2,015,000
Reinvested in Osceola
Village
6.18%
Morningside Marketplace
CHASE/CHEVRON
6.10%
$4,098,000
$1,864,000 Proceeds
Reinvested in
Florissant Marketplace
8.38%
Morningside Marketplace
KFC
5.55%
$1,200,000
$624,000 Proceeds
Reinvested in
Ensenada Square
8.92%
TOTAL
$9,725,000 |
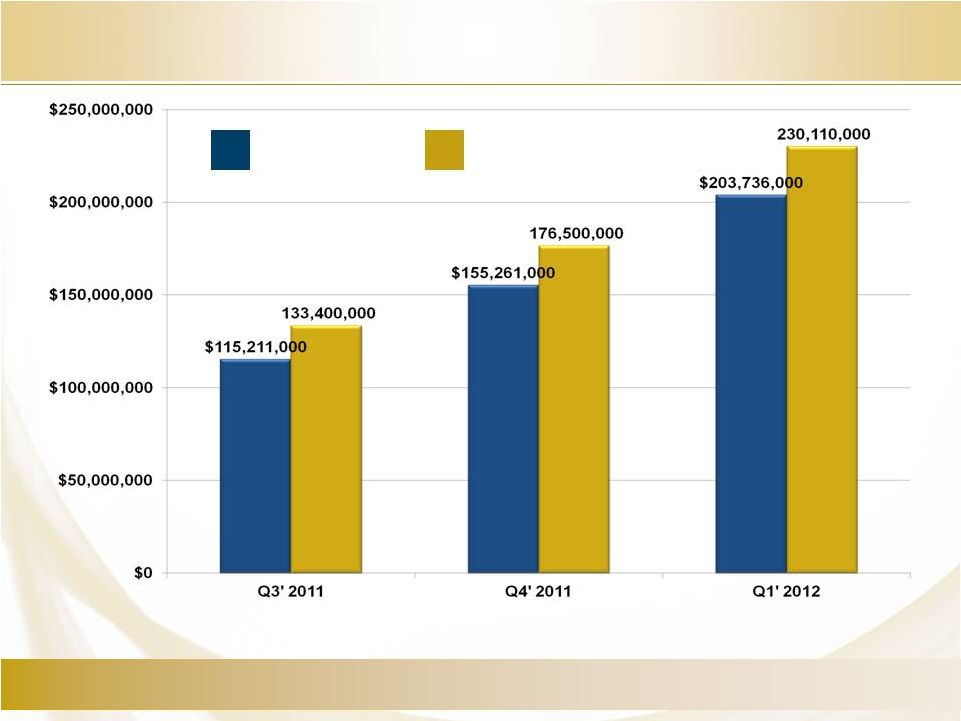 SRT Portfolio Value Summary
Property Value
Cost
$10.08
NAV Per Share
$10.14
$10.18
10
9 SRT PROPERTIES
11 SRT PROPERTIES
16 SRT PROPERTIES |
 Portfolio Management
SRT Value Added Advantages
•
Ability To Acquire Assets At Below Replacement
Cost
•
Acquisition Price Based On Existing NOI Allows
For Significant Upside Through Lease Up Of
Vacancies
From
87.1%
To
Stabilization
•
Sale
Or
Lease
Of
476,000
SF
Of
Undeveloped
Pad
Buildings
On
49.8
Acres
11 |
 Note: As of June 30, 2012
12
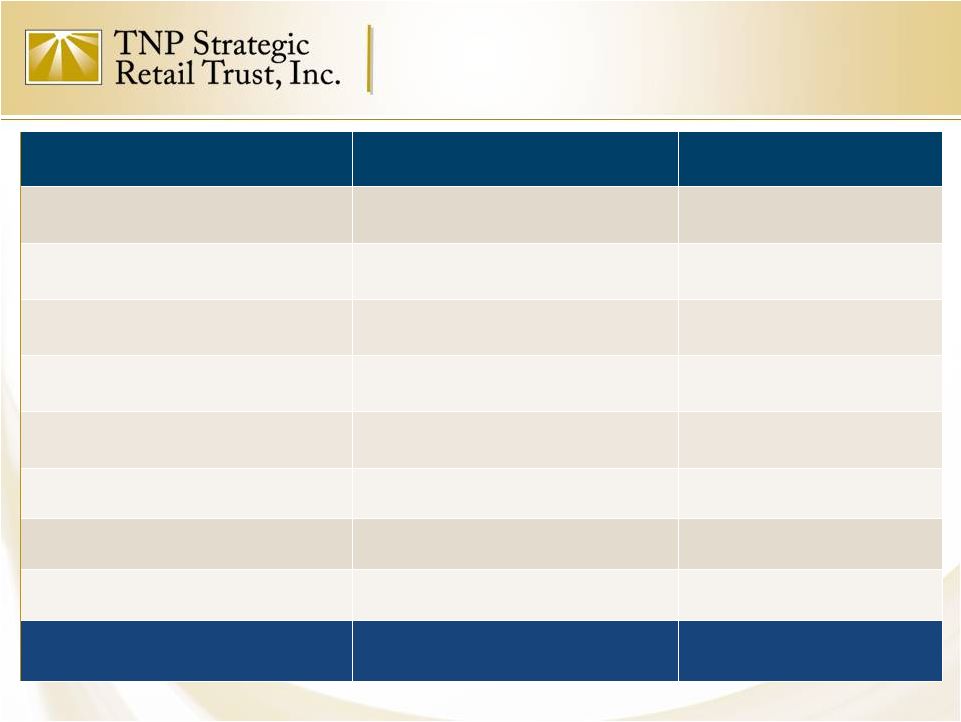
SRT Portfolio Summary
Property Name
Rentable Sq. Ft.
Occupancy
Acq. Cost
(in thousands)
CAP Rate
Excess Land
Moreno Marketplace
78,321
79.4%
$ 12,500
9.68%
1.74
Waianae Mall
170,275
78.2%
$25,688
8.89%
--
Northgate Plaza
103,492
92.0%
$8,050
10.04%
--
San Jacinto
53,777
71.6%
$ 7,088
5.01%
3.62
Craig Promenade
86,395
77.2%
$12,800
6.28%
4.15
Pinehurst Square East
114,292
91.6%
$ 15,000
9.61%
--
Constitution Trail
199,139
73.0%
$18,000
10.46%
--
BI-LO
45,817
100.0%
$2,585
9.13%
28.5
Topaz Marketplace
50,319
100.0%
$13,500
7.41%
0.82
Osceola Village
116,645
77.8%
$21,800
5.41%
8.1
Summit Point
111,970
86.5%
$18,250
6.78%
--
Morningside Marketplace
78,693
90.9%
$18,050
5.57%
--
Woodland West
176,414
86.2%
$13,950
9.03%
--
Ensenada Square
62,612
93.3%
$5,175
8.08%
--
Shops @ Turkey Creek
16,324
100.0%
$4,300
8.49%
--
Aurora Commons
89,211
92.6%
$7,000
10.11%
--
Florissant Marketplace
146,257
100.0%
$15,250
8.31%
--
Willow Run
95,791
87.9%
$11,550
7.51%
--
Bloomingdale Hills
78,442
100.0%
$9,300
6.75%
2.83
Visalia Marketplace
200,794
93.3%
$19,000
9.28%
--
Portfolio Total
2,074,980
87.1%
$258,686
8.31%
49.8 |
 Upside Portfolio Opportunity
49.8
acres of Developable Land at No Cost
Potential
to
Construct
476,000
SF
of
New
Buildings
Potential Annual Ground Lease Revenue of up to
$1,634,000
or…
Potential Annual Building Rental Revenue of up to
$7,300,000
13 |
 Leasing Summary
14
2011
SQUARE FOOTAGE LEASED
NEW
8,420
RENEWAL
62,952
TOTAL
71,372
2012
SQUARE FOOTAGE LEASED
NEW
27,594
RENEWAL
84,512
VACATE
1,712
TOTAL
110,394
TOTAL
181,766 |
 New Leasing –
2011 YTD
PROPERTY NAME
NEW SQUARE
FOOTAGE LEASED
CURRENT
OCCUPANCY*
Moreno Marketplace
3,060
79.4%
Pinehurst Square East
1,885
91.6%
Waianae Mall
3,475
78.2%
Total
8,420
15
* As of June 30, 2012 |
 Renewal Leasing -
2011 YTD
PROPERTY NAME
SQUARE FOOTAGE
RENEWED
CURRENT
OCCUPANCY*
Waianae Mall
10,704
78.2%
Northgate Plaza
13,657
92.0%
San Jacinto
4,130
71.6%
Craig Promenade
9,000
77.2%
Pinehurst Square East
2,935
91.6%
Extensions, Options & Other
22,526
Total
62,952
16
* As of June 30, 2012 |
 New Leasing –
2012 YTD
PROPERTY NAME
NEW SQUARE
FOOTAGE LEASED
CURRENT OCCUPANCY*
Moreno Marketplace
4,559
79.4%
San Jacinto Esplanade
1,184
71.6%
Craig Promenade
4,474
77.2%
Constitution Trail
14,506
73.0%
Morningside Marketplace
972
90.9%
Aurora Commons
566
92.6%
Pinehurst Square East
1,333
91.6%
Total
27,594
17
* As of June 30, 2012 |
 Renewal Leasing -
2012 YTD
PROPERTY NAME
SQUARE FOOTAGE RENEWED
CURRENT OCCUPANCY*
Waianae Mall
23,635
78.2%
Northgate Plaza (Tucson)
11,964
92.0%
Craig Promenade
13,616
77.2%
Pinehurst Square East
16,364
91.6%
Topaz Marketplace
3,943
100%
Woodland West
8,950
86.2%
Ensenada Square
3,500
93.3%
San Jacinto Esplanade
2,540
71.6%
Total
84,512
18
* As of June 30, 2012 |
 www.tnpsrt.com
SRT PROPERTY PORTFOLIO JULY 18,
2012 SUMMARY OF RISK FACTORS
AN INVESTMENT WITH TNP STRATEGIC RETAIL TRUST, INC. INVOLVES A HIGH
DEGREE OF RISK AND THERE CAN BE NO ASSURANCE THAT THE INVESTMENT
OBJECTIVES OF THIS PROGRAM WILL BE OBTAINED. AN INVESTOR SHOULD CAREFULLY CONSIDER THE RISKS DESCRIBED BELOW AND
IN CONJUNCTION WITH THE PROSPECTUS BEFORE PURCHASING OUR COMMON
STOCK. -
Viability of the sponsor.
-
We commenced operations on November 19, 2009, and therefore have a
limited operating history. There is no assurance that we will be able to successfully achieve our investment
objectives.
-
No public trading market exists for our shares and we are not required
to effectuate a liquidity event by a certain date. As a result, it will be difficult for you to sell your shares. If you
are able to sell your shares, you will likely sell them at a
substantial discount. -
The amount of any distributions we may make is uncertain.
Our distributions may exceed our earnings, particularly during the period before we have substantially invested the net
proceeds from this offering. Generally, distributions paid using
offering proceeds will constitute a return of capital, meaning a return of all or a portion of your original investment. To
the extent our distributions are funded from offering proceeds, we will
have less funds to use for investments which may lower your overall return. All distributions paid to date have
been paid with offering proceeds.
-
This is a “best effort” offering and if we are unable to
raise substantial funds then we will be limited in the number and type of investments we may make.
-
We currently have a limited number of properties in our real estate
portfolio. As a result, this is considered a “blind pool” offering and you will not have the opportunity to evaluate
our future investments prior to purchasing shares of our common stock.
-
This is the first non-listed REIT offering sold by our
dealer-manager. Our ability to raise money and achieve our investment objectives depends on the ability of our dealer manager to
successfully market our offering.
-
We rely on our advisor and its affiliates for our day-to-day
operations and the selection of our investments. We will pay substantial fees to our advisor, which were not determined on
an arm’s-length basis.
-
Our advisor and other affiliates will face conflicts of interest as a
result of compensation arrangements, time constraints and competition for investments.
-
We are the first publicly-offered investment program sponsored by
our sponsor. You should not assume that the prior performance of programs managed or sponsored by our sponsor
or its affiliates will be indicative of our future performance.
-
Our use of leverage increases the risk of loss on our investments.
-
We are subject to risks generally incident to the ownership of real
property. -
Economic downturns and disruptions in financial markets could have an
adverse impact on our tenants’ ability to make rental payments and the demand in retail space, result in
disruptions in the commercial mortgage market and adversely effect our
ability to obtain financing on favorable terms, if at all. - We have elected to be taxed as a
REIT for federal income tax purposes. However, if we lose our tax status as a REIT, we will be subject to increased taxes which will reduce the
amount of cash we have available to make distributions to our
stockholders. -
We have operated at a net loss for the last two years.
-
The methodologies used to determine the estimated value per share as of
September 30, 2011, December 31, 2011 and March 31, 2012 were based upon a number of assumptions,
estimates and judgments that may not be accurate or complete. The
estimated value per share does not represent the fair value of our assets less liabilities in accordance with U.S.
GAAP and is not a representation or indication that: a stockholder
would be able to realize the estimated share value if he or she attempts to sell shares; a stockholder would ultimately
realize distributions per share equal to the estimated value per share
upon liquidation of assets and settlement of our liabilities or upon a sale of our company; shares of our common
stock would trade at the estimated value per share on a national
securities exchange; or a third party would offer the estimated value per share in an armslength transaction to purchase
all or substantially all of our shares of common stock.
|
 www.tnpsrt.com
SRT PROPERTY PORTFOLIO JULY 18,
2012 APPENDIX
TNP Strategic Retail Trust, Inc.
Net Income to NOI –
reconciliation (in thousands)
Q1 2011
Q2 2011
Q3 2011
Q4 2011
Q1 2012
Net Income/(Loss)
$ (1,217)
$ (1,804)
$ (1,378)
$ 6,709
$ (4,365)
General and administrative
418
566
799
389
631
Depreciation and amortization
725
913
1,259
1,487
2,100
Interest Income
(1)
(133)
(407)
(57)
-
Interest expense
680
828
1,677
2,215
3,099
Income (Loss) attributable to non-controlling interests
1
136
23
(348)
212
Gain on sale of real estate
-
-
(310)
(653)
-
Net income from discontinued operations
-
-
(125)
-
(56)
Other extraordinary item – bargain purchase gain
-
-
-
(9,617)
-
Asset management fee
80
123
(415)
(1)
-
Acquisition expense
410
1,042
808
1,887
1,900
NOI
$1,096
$1,671
$1,931
$2,006
$3,521
Net Operating Income (NOI):
Reported net income (or loss) is computed in accordance with GAAP. In contrast,
net operating income (NOI) is a non-GAAP measure consisting of the
revenue and expense attributable to the real estate properties that we own and operate.
Although
NOI
is
considered
a
non-GAAP
measure,
we
present
NOI
on
a
“GAAP
basis”
by
using
property
revenues
and
expenses
calculated
in
accordance
with
GAAP.
The
most
directly
comparable
GAAP
measure
to
NOI
is
net
income
(or
loss),
adjusted
to
exclude
general and administrative expense, depreciation and amortization expense, interest
income, interest expense, income (and certain fees paid to affiliates loss)
attributable to noncontrolling interests, gains on sale of real estate, net income from discontinued operations, other
extraordinary items and certain fees paid to affiliates. We use NOI as a
supplemental performance measure because, in excluding real estate
depreciation
and
amortization
expense
and
gains
(or
losses)
from
property
dispositions,
it
provides
a
performance
measure
that,
when compared year over year, captures trends in occupancy rates, rental rates and
operating costs. We also believe that NOI will be useful to investors as a
basis to compare our operating performance with that of other REITs. However, because NOI excludes
depreciation and amortization expense and captures neither the changes in the value
of our properties that result from use or market conditions, nor the level
of capital expenditures and leasing commissions necessary to maintain the operating performance of our
properties (all of which have real economic effect and could materially impact our
results from operations), the utility of NOI as a measure of our performance
is limited. Other equity REITs may not calculate NOI in a similar manner and, accordingly, our NOI may not be
comparable
to
such
other
REITs’
NOI.
Accordingly,
NOI
should
be
considered
only
as
a
supplement
to
net
income
as
a
measure
of
our
performance. NOI should not be used as a measure of our liquidity, nor is it
indicative of funds available to fund our cash needs, including our ability
to pay distributions. NOI should not be used as a substitute for cash flow from operating activities computed in accordance with
GAAP. |