Attached files
| file | filename |
|---|---|
| 8-K - 20120814 8K ROSE INVESTOR RELATIONS PRESENTATION - NBL Texas, LLC | rose8k_irpresentation.htm |

REDEFINED
BUILDING VALUE IN UNCONVENTIONAL RESOURCES
Investor Presentation
AUGUST 2012

This presentation includes forward-looking statements, which give the Company's current expectations or forecasts of future
events based on currently available information. Forward-looking statements are statements that are not historical facts,
such as expectations regarding drilling plans, including the acceleration thereof, production rates and guidance, resource
potential, incremental transportation capacity, exit rate guidance, net present value, development plans, progress on
infrastructure projects, exposures to weak natural gas prices, changes in the Company's liquidity, changes in acreage
positions, expected expenses, expected capital expenditures, and projected debt balances. The assumptions of
management and the future performance of the Company are subject to a wide range of business risks and uncertainties
and there is no assurance that these statements and projections will be met. Factors that could affect the Company's
business include, but are not limited to: the risks associated with drilling of oil and natural gas wells; the Company's ability to
find, acquire, market, develop, and produce new reserves; the risk of drilling dry holes; oil and natural gas price volatility;
derivative transactions (including the costs associated therewith and the abilities of counterparties to perform thereunder);
uncertainties in the estimation of proved, probable, and possible reserves and in the projection of future rates of production
and reserve growth; inaccuracies in the Company's assumptions regarding items of income and expense and the level of
capital expenditures; uncertainties in the timing of exploitation expenditures; operating hazards attendant to the oil and
natural gas business; drilling and completion losses that are generally not recoverable from third parties or insurance;
potential mechanical failure or underperformance of significant wells; availability and limitations of capacity in midstream
marketing facilities, including processing plant and pipeline construction difficulties and operational upsets; climatic
conditions; availability and cost of material, supplies, equipment and services; the risks associated with operating in a limited
number of geographic areas; actions or inactions of third-party operators of the Company's properties; the Company's ability
to retain skilled personnel; diversion of management's attention from existing operations while pursuing acquisitions or
dispositions; availability of capital; the strength and financial resources of the Company's competitors; regulatory
developments; environmental risks; uncertainties in the capital markets; general economic and business conditions
(including the effects of the worldwide economic recession); industry trends; and other factors detailed in the Company's
most recent Form 10-K, Form 10-Q and other filings with the Securities and Exchange Commission. If one or more of these
risks or uncertainties materialize (or the consequences of such a development changes), or should underlying assumptions
prove incorrect, actual outcomes may vary materially from those forecasted or expected. The Company undertakes no
obligation to publicly update or revise any forward-looking statements except as required by law.
Forward-Looking Statements and Terminology Used
2

For filings reporting year-end 2011 reserves, the SEC permits the optional disclosure of probable and possible
reserves. The Company has elected not to report probable and possible reserves in its filings with the SEC. We use the
term “net risked resources” to describe the Company’s internal estimates of volumes of natural gas and oil that are not
classified as proved reserves but are potentially recoverable through exploratory drilling or additional drilling or recovery
techniques. Estimates of unproved resources are by their nature more speculative than estimates of proved reserves and
accordingly are subject to substantially greater risk of actually being realized by the Company. Estimates of unproved
resources may change significantly as development provides additional data, and actual quantities that are ultimately
recovered may differ substantially from prior estimates. We use the term “BFIT NPV10” to describe the Company’s
estimate of before income tax net present value discounted at 10 percent resulting from project economic evaluation. The
net present value of a project is calculated by summing future cash flows generated by a project, both inflows and
outflows, and discounting those cash flows to arrive at a present value. Inflows primarily include revenues generated
from estimated production and commodity prices at the time of the analysis. Outflows include drilling and completion
capital and operating expenses. Net present value is used to analyze the profitability of a project. Estimates of net
present value may change significantly as additional data becomes available, and with adjustments in prior estimates of
actual quantities of production and recoverable reserves, commodity prices, capital expenditures, and/or operating
expenses.
Forward-Looking Statements and Terminology Used (cont.)
3
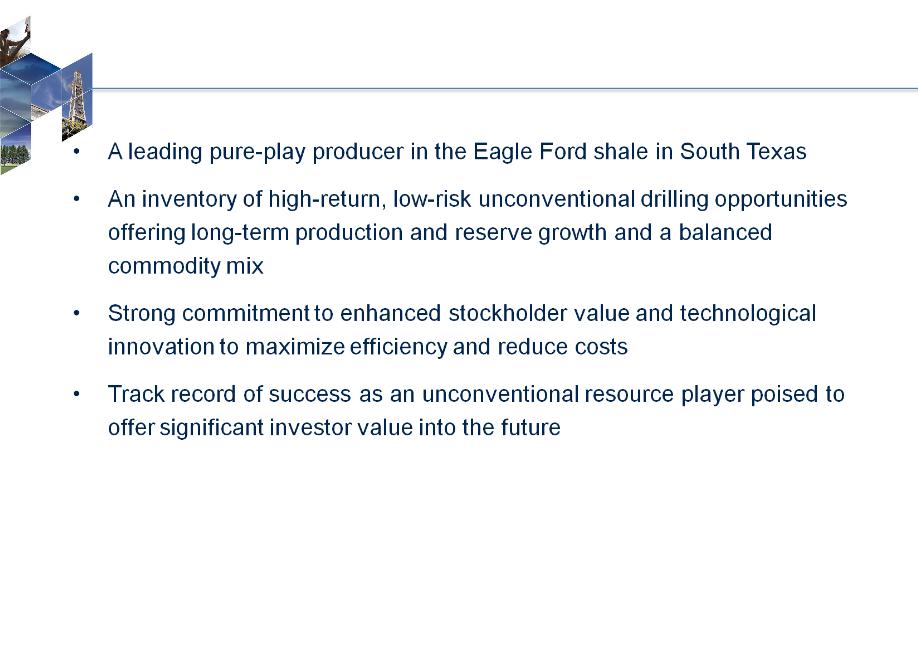
Company Profile
4

• Leverage high-graded asset base
• Strengthen position as a leading pure Eagle Ford shale player
• Develop and convert inventory of over 500 MMBoe with 15 years of drilling ahead
• Expand production base with less than 10% of inventory developed
• Successfully execute business plan
• Grow total production and liquids volumes
• Lower overall cost structure and improve margins
• Capture firm transportation and processing capacity
• Test future growth opportunities
• Evaluate previously untested Eagle Ford acreage
• Continue testing optimal Eagle Ford well spacing
• Pursue new growth targets through blend of acquisitions and new ventures
• Financial strength and flexibility
• Low leverage
• Sizable liquidity
Company Strategy
5

LEVERAGE HIGH-GRADED ASSET BASE
6
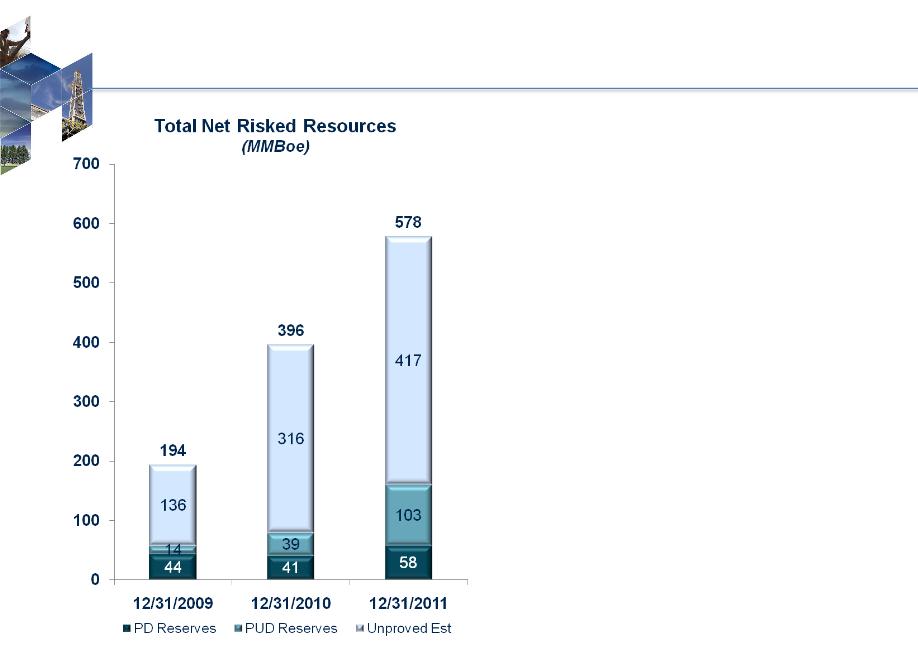
• Since 2009, proved reserves more
than doubled; total risked resources
nearly tripled
than doubled; total risked resources
nearly tripled
• Total project inventory, including
PUDs, grew from 150 MMBoe to
520 MMBoe
PUDs, grew from 150 MMBoe to
520 MMBoe
• Less than 10% of inventory
developed and on production
developed and on production
• Growth driven by Eagle Ford Shale
• Total proved liquids mix transformed
• 2009: 15%
• 2010: 40%
• 2011: 54%
• From 2009 through 2011, divested
25 MMBoe of proved reserves for
properties that no longer fit operating
model; divested another 11 MMBoe
non-core in first half 2012
25 MMBoe of proved reserves for
properties that no longer fit operating
model; divested another 11 MMBoe
non-core in first half 2012
Significant Growth in Asset Net Resources
7
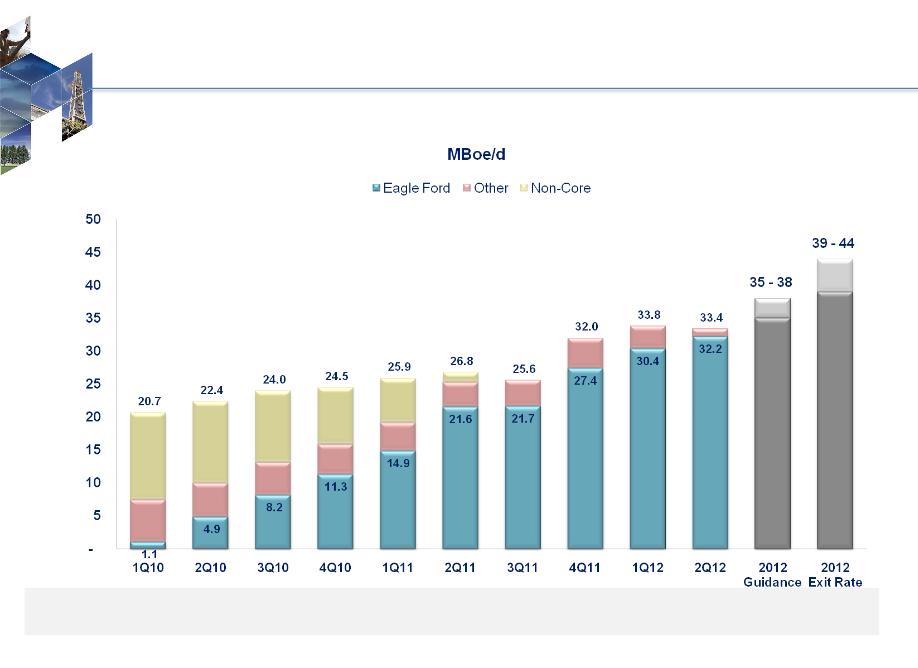
Quarterly Production Performance
% Liquids: 14 19 24 29 33 46 51 49 52 59 60 61
% Oil: 5 7 10 12 15 18 19 22 22 24
8

SUCCESSFULLY EXECUTE BUSINESS PLAN
9
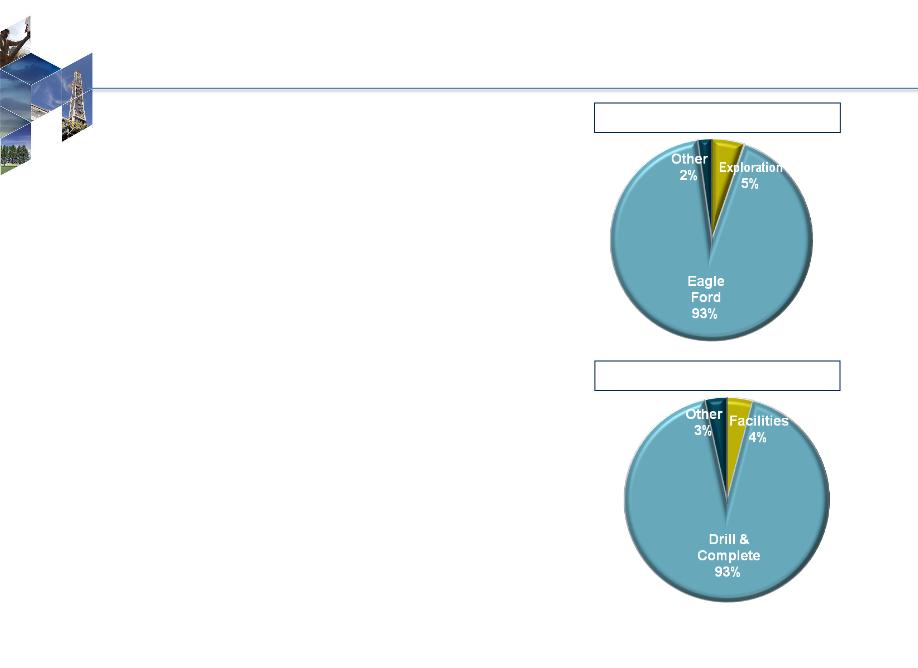
Includes capitalized interest and other corporate costs
Excludes New Ventures and A&D
By Region
By Category
2012E Capital - $640 Million
10
• Run four- to five-rig program in Eagle Ford area
• 60 completions for year
• Liquids-rich development
• Additional focus on Karnes Trough area and
Briscoe Ranch
Briscoe Ranch
• Fund base capital program from internally-
generated cash flow supplemented by
borrowings under current credit facility and
divestitures
generated cash flow supplemented by
borrowings under current credit facility and
divestitures
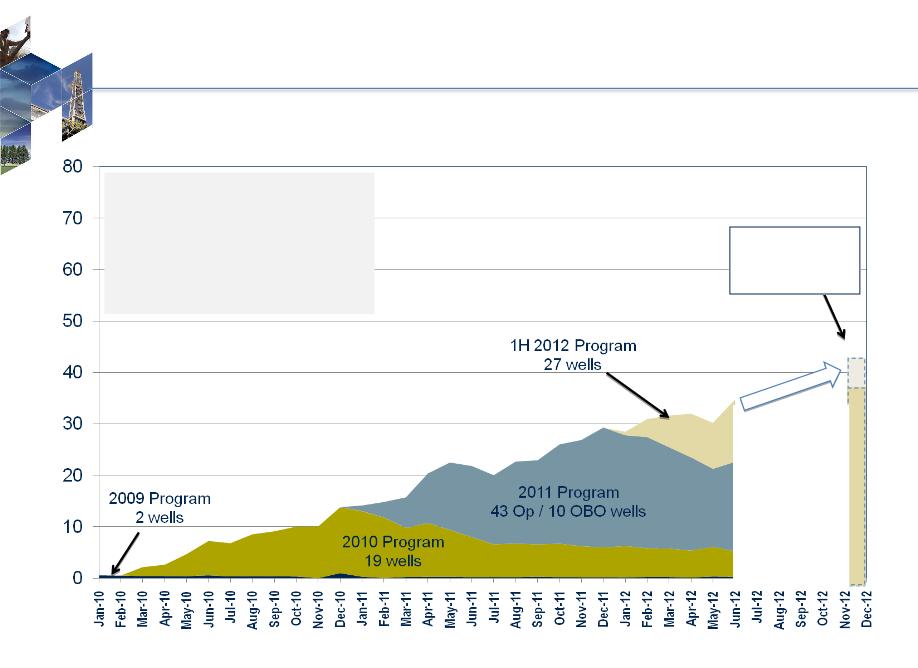
Eagle Ford Growth Profile
11
Eagle Ford production averaged
32.2 MBoe/d (96% of Rosetta’s
total production) during 2Q 2012
32.2 MBoe/d (96% of Rosetta’s
total production) during 2Q 2012
- 60% total liquids
- 24.3% oil / 35.6% NGLs
MBoe/d
Exit Rate
Guidance
Guidance
39 - 44 MBoe/d
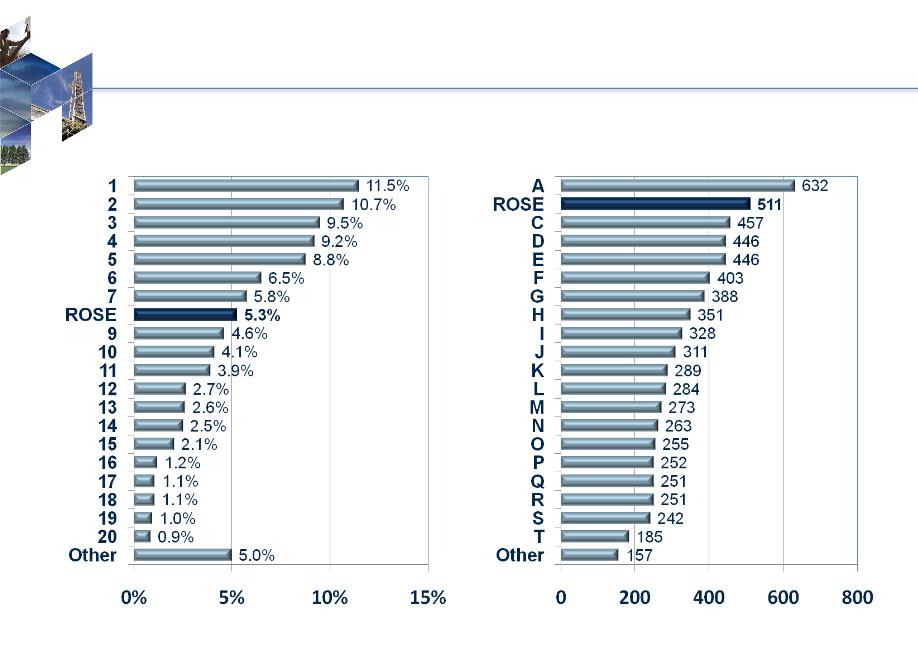
Top 20 Eagle Ford Operators
% of Eagle Ford Shale Production
Gross Boe/d per Well
12
Data Source: IHS, Inc., majority of reported February 2012 production (as of 5/30/2012); gross 8/8ths production.
Top 20 Eagle Ford Operators include APC, BHP, CHK, COP, CRK, CRZO, EP, EOG, GeoSouthern, Lewis, MRO, MUR, PVA, PXD, PXP, ROSE, SFY, SM, TLM, XOM.
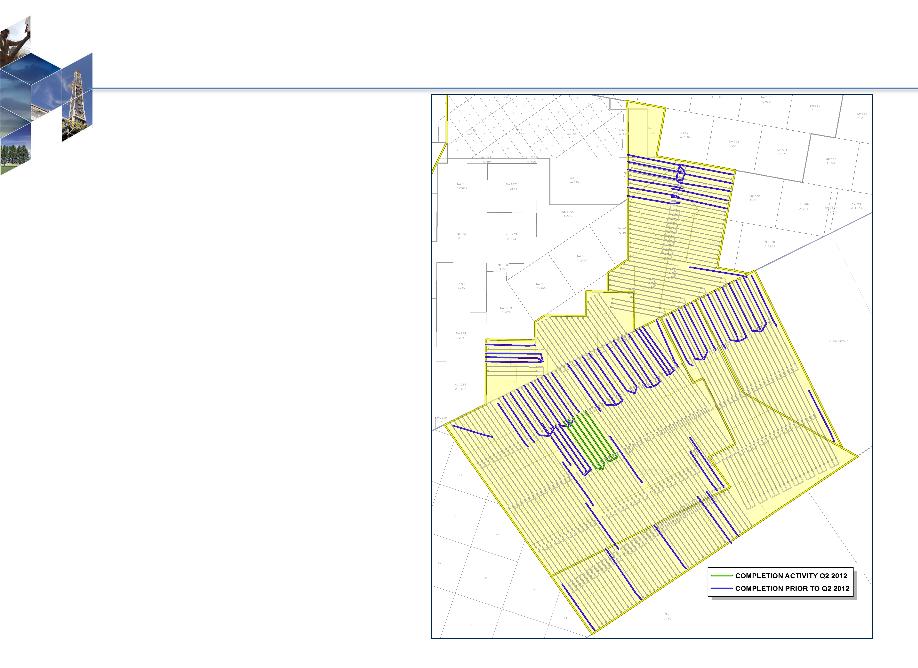
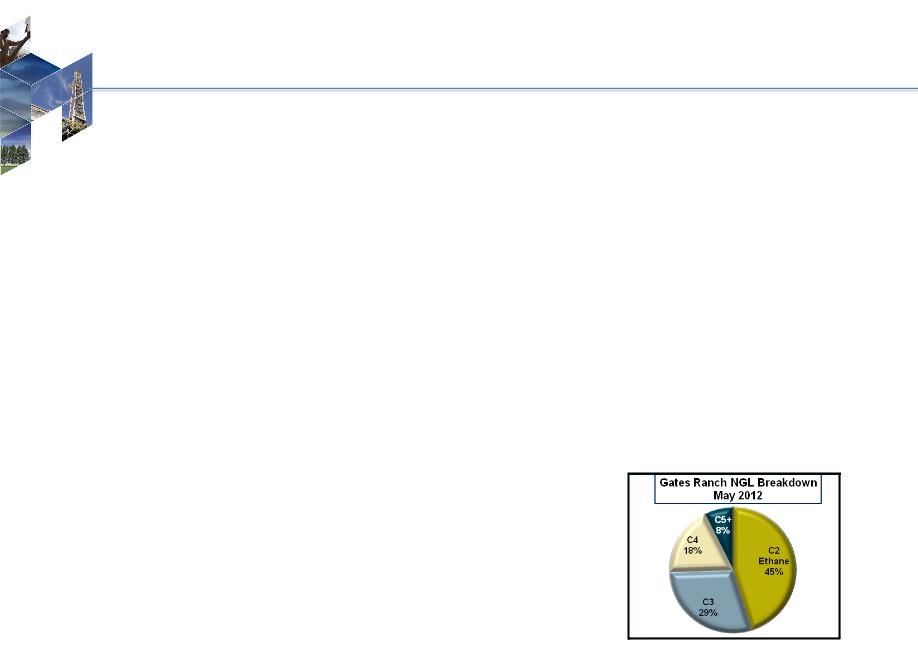
Gates Ranch
13
Summary
• 26,500 net acres in Webb County
• 72 completions as of 6/30/2012
• 1Q 2012: 10 completions
• 2Q 2012: 6 completions
• 356 well locations remaining under current
spacing assumptions
spacing assumptions
Average Well Characteristics
• Well Costs: $7.5 - $8.0 million
• Spacing: 475 feet apart or 55 acres
• Composite EUR: 1.67 MMBoe
• F&D Costs: $4.65/Boe
• Condensate Yield = 64 Bbls/MMcf
• NGL Yield = 100 Bbls/MMcf
• Shrinkage = 20%
• Mix: Oil 23%, NGLs 32%
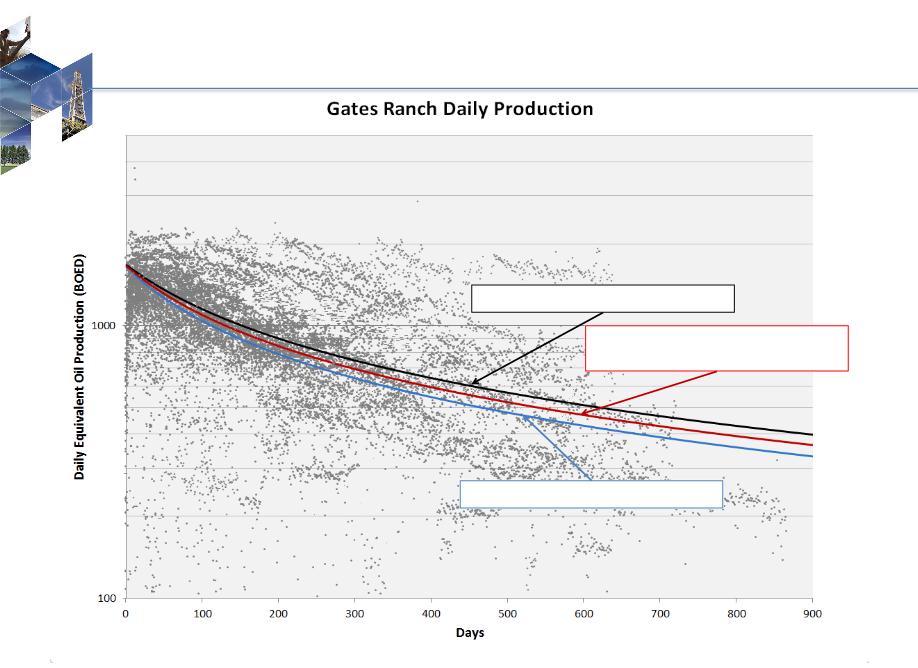
Composite Type Curve - 1.7 MMBoe
(23% Oil / 32% NGLs)
South Type Curve - 1.9 MMBoe
North Type Curve - 1.4 MMBoe
Gates Ranch Well Performance - North and South Areas
14
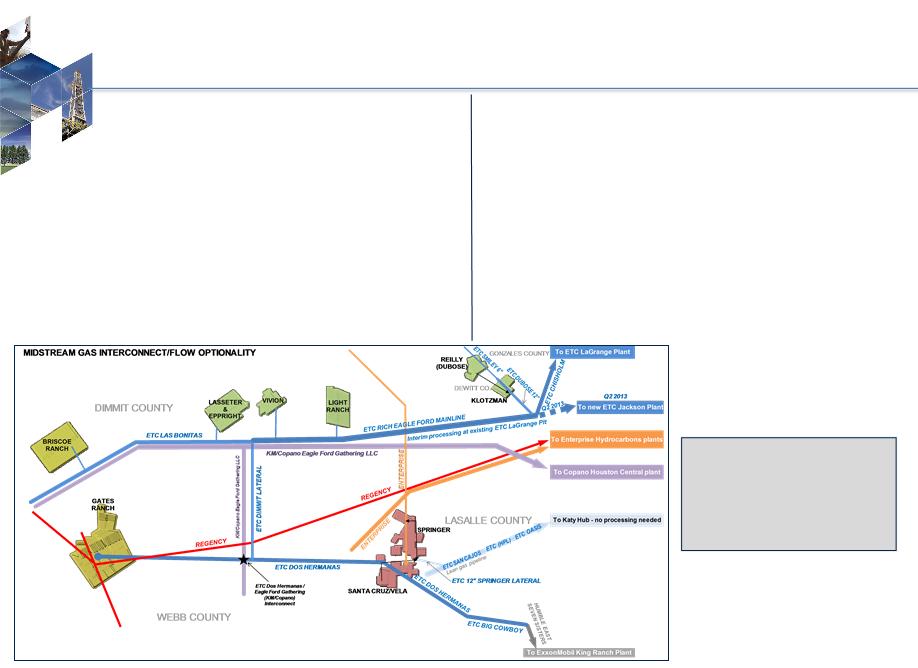
Eagle Ford Multiple Takeaway Options
15
Gas Transportation Capacity
Firm gross wellhead gas takeaway
• 195 MMcf/d today
• 245 MMcf/d in April 2013
Four processing options - Gathering (Plant)
• Regency (Enterprise Plants)
• Energy Transfer “ETC” Dos Hermanas (King Ranch)
• Eagle Ford Gathering (Copano Houston Central)
• ETC Rich Eagle Ford Mainline (LaGrange/Jackson)
Net 3-stream takeaway increases with higher
contribution of oil-weighted volumes
Oil Transportation Capacity
Gates Ranch, Briscoe Ranch and Central Dimmit Co.
• Plains Crude Gathering - Firm gathering capacity of
25,000 Bbls/d to Gardendale hub with up to 60,000 Bbls
storage; started operation in April 2012
25,000 Bbls/d to Gardendale hub with up to 60,000 Bbls
storage; started operation in April 2012
• Access to truck and rail loading and pipeline
connections
connections
Karnes Trough
• Rosetta-owned oil truck-loading facility began operation
in late July 2012
in late July 2012
• Trucking readily available
Pricing assumptions included in Appendix
Well-positioned to move
new production to
market with access to
multiple midstream
service providers
new production to
market with access to
multiple midstream
service providers

TEST FUTURE GROWTH OPPORTUNITIES
16
|
Area
|
Window
|
Net
Acreage |
|
Gates Ranch
|
Liquids
|
26,500
|
|
Non-Gates Ranch
|
Liquids
|
23,500
|
|
Encinal Area
|
Dry Gas
|
15,000
|
|
TOTAL
|
|
65,000
|
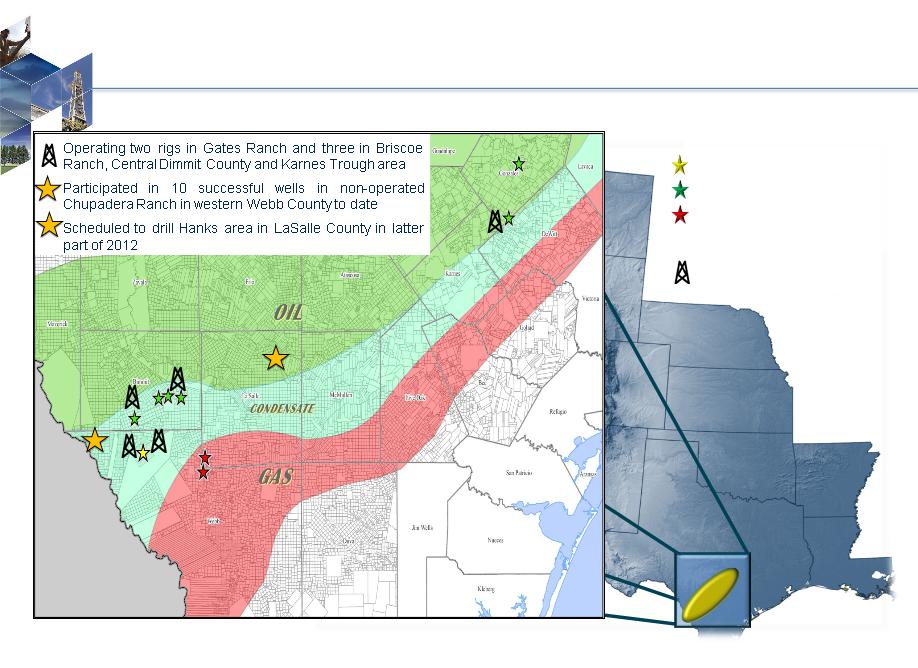
17
Eagle Ford Shale Activity
Current Drilling Activity Area
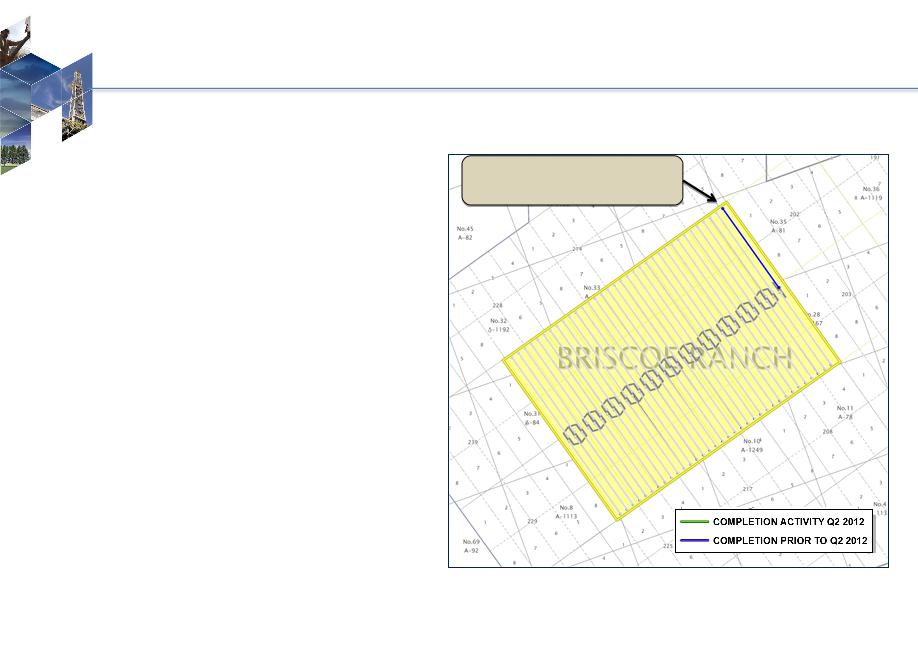
18
Briscoe Ranch
Summary
• 3,545 net acres in southern Dimmit
County
County
• 1 completion as of 6/30/2012
• 67 well locations remaining
Average Well Characteristics
• Well Costs: $7.5 - $8.0 million
• Spacing: 425 feet apart or 50 acres
• Condensate Yield: 76 Bbls/MMcf
• NGL Yield: 121 Bbls/MMcf
• Shrinkage: 20%
Future Activity
• Completion of first 3-well pad ongoing in
3Q 2012
3Q 2012
• Planned full development activity will last
well into 2016
well into 2016
Discovery Well Initial Rate* - 10/2011
1,990 Boe/d, 68% Liquids
(850 Bo/d, 490 B/d NGLs, 3,900 Mcf/d)
*Seven-day stabilized rate
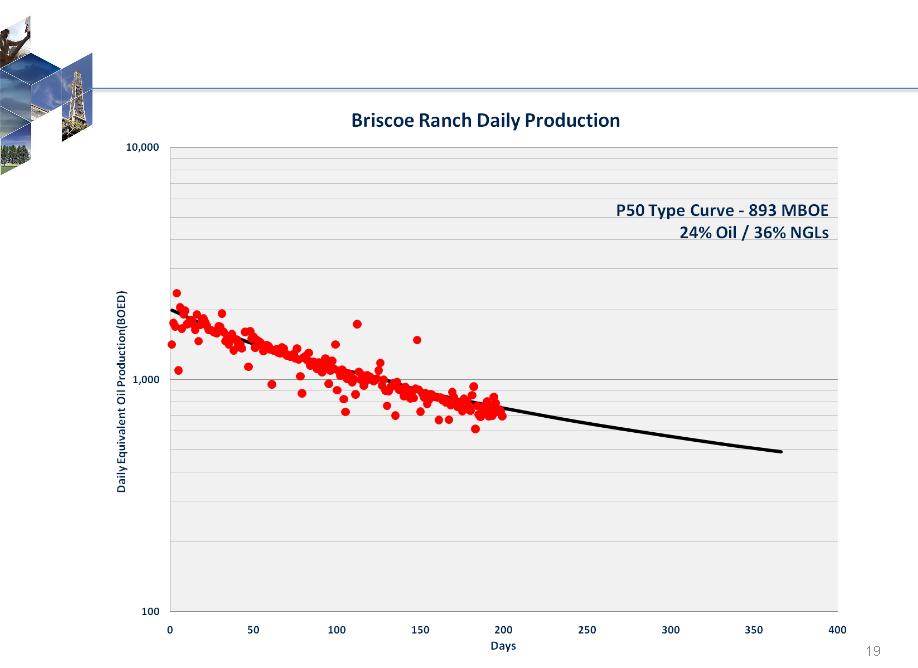
Briscoe Ranch Type Curve
20
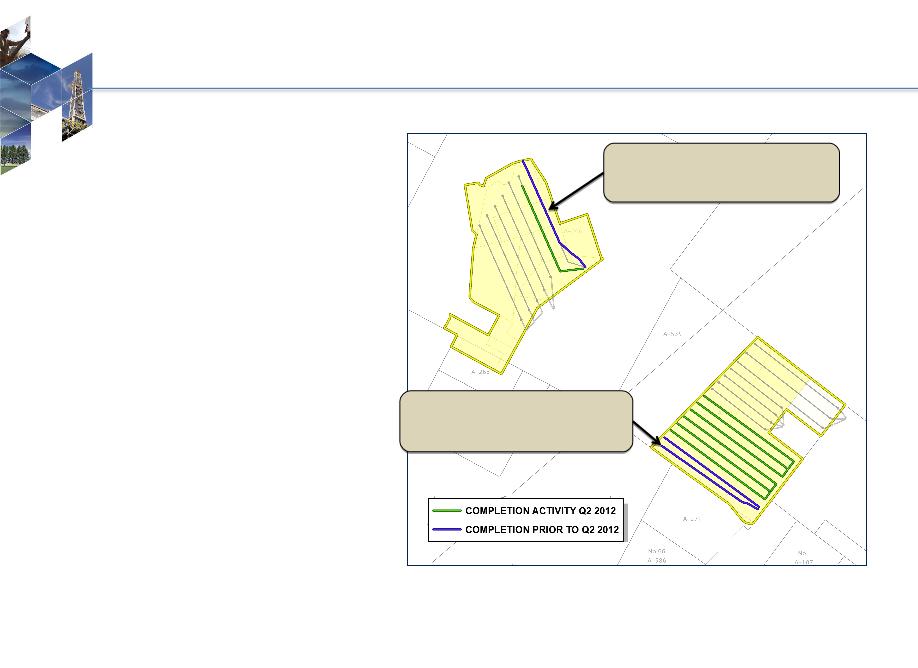
Karnes Trough Area
SUMMARY
• 1,900 net acres; located in oil window
• 10 total completions as of 6/30/2012
• 1Q 2012: 2 completions
• 2Q 2012: 7 completions
• 12 well locations remaining
• Well Costs: $8.5 - $9.0 million
• Activity planned through 2013
Klotzman (Dewitt County)
• 8 total completions as of 6/30/2012
• 1Q 2012: 1 completion
• 2Q 2012: 6 completions
• Rosetta-owned oil truck terminal started
operation in late July
operation in late July
Reilly (Gonzales County)
• 2 completions as of 6/30/2012
• 1Q 2012: 1 completion
• 2Q 2012: 1 completion
Klotzman 1H
Discovery Well Initial Rate* - 11/2011
3,033 Boe/d, 81% Oil
(2,450 Bo/d, 250 B/d NGLs, 2,000 Mcf/d)
Adele Dubose 1H
Delineation Well Initial Rate* - 2/2012
1,463 Boe/d, 76% Oil
(1,109 Bo/d, 153 B/d NGLs, 1,200 Mcf/d)
*Seven-day stabilized rate
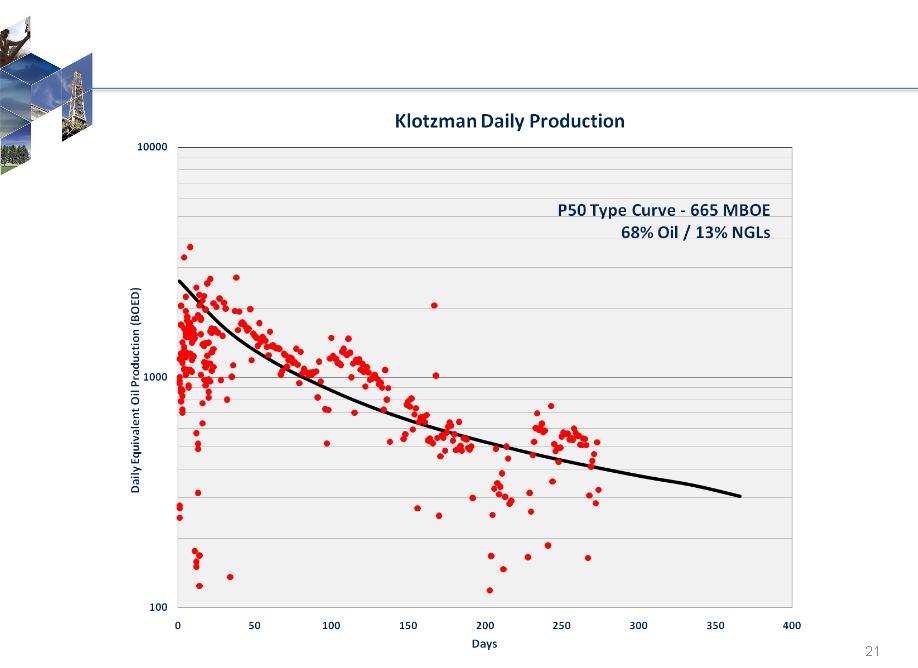
Klotzman Type Curve
22
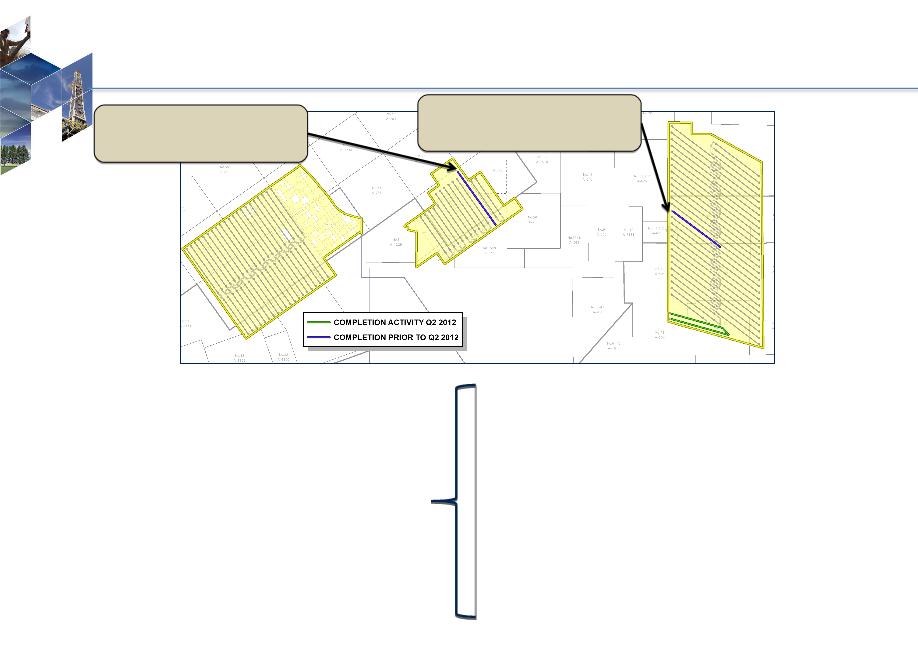
Central Dimmit County Area
Summary
• 8,100 net acres in Dimmit County
• 4 completions as of 6/30/2012
• 2Q 2012: 2 completions
• 123 well locations remaining
• Well Costs: $7.5 - $8.0 million
Light Ranch 1H
Discovery Well Initial Rate* - 10/2010
987 Boe/d, 78% Liquids
(510 Bo/d, 260 B/d NGLs, 1,300 Mcf/d)
Vivion 1H
Discovery Well Initial Rate* - 9/2011
680 Boe/d, 89% Liquids
(506 Bo/d, 102 B/d NGLs, 436 Mcf/d)
Light Ranch
• 3 total completions as of 6/30/2012
• 2Q 2012: 2 completions
Vivion
• 1 completion as of 6/30/2012
Lasseter & Eppright
• 3Q 2012: 1 well in progress
*Seven-day stabilized rate
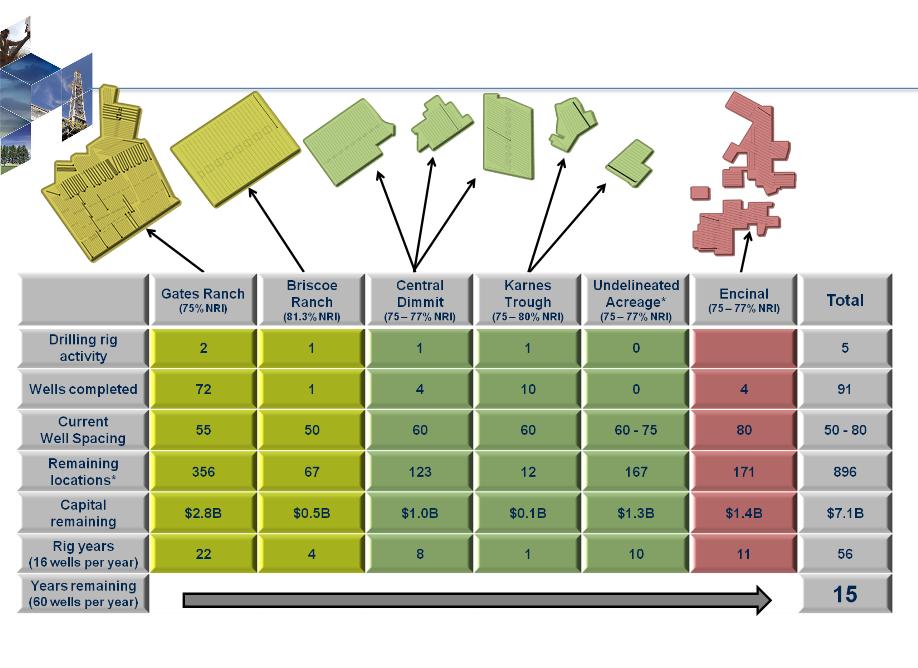
Eagle Ford Inventory
+/- 900 net wells remaining as of 6/30/2012
+/- 900 net wells remaining as of 6/30/2012
* Denotes roughly 10,000 net acres in the liquids window of the play in Webb (~3,000), LaSalle (~3,500), and Gonzales (~3,000) counties.
23

FINANCIAL STRENGTH
AND FLEXIBILITY
AND FLEXIBILITY
24
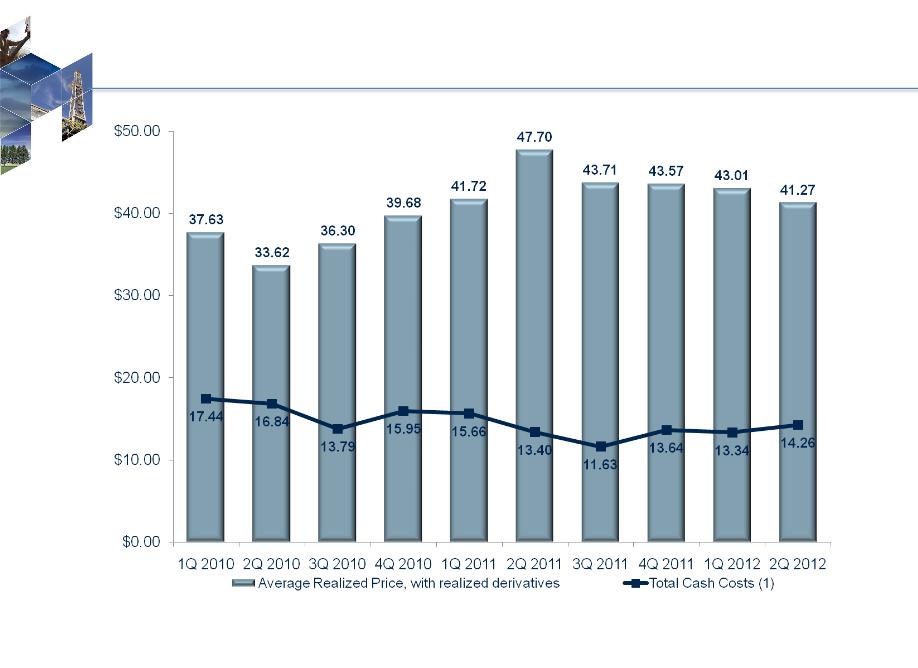
Margin Expansion
25
1. Total cash costs (a non-GAAP measure) is calculated as the sum of all average costs per Boe, excluding DD&A and stock-based compensation. Management believes this
presentation may be helpful to investors as it represents average cash costs incurred by our oil, NGL and natural gas producing activities. This measure is not intended to
replace GAAP statistics but rather to provide additional information that may be helpful in evaluating trends and performance.
presentation may be helpful to investors as it represents average cash costs incurred by our oil, NGL and natural gas producing activities. This measure is not intended to
replace GAAP statistics but rather to provide additional information that may be helpful in evaluating trends and performance.
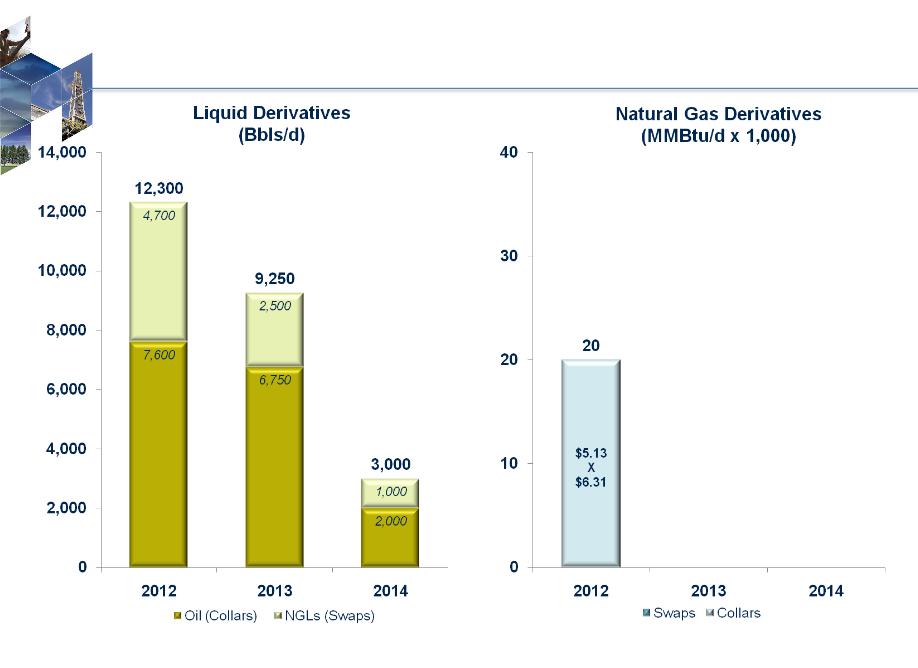
Commodity Derivatives Position - June 30, 2012
Note: NGL derivatives exclude the Ethane component; fixed price is based on weighted average of remaining components of the NGL barrel.
$63.77
$63.00
$64.48
$81.58
X
$117.78
$81.01
X
$118.86
$82.50
X
$111.95
26
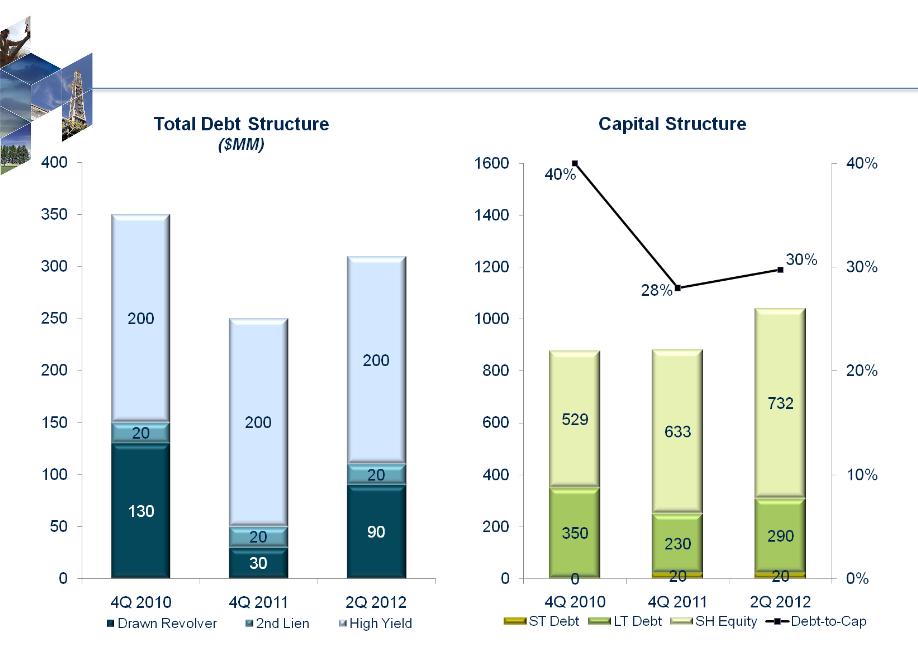
Debt and Capital Structure
350
250
883
879
27
310
1042
Note: As of August 1, 2012, total debt is $340 million.
($MM)
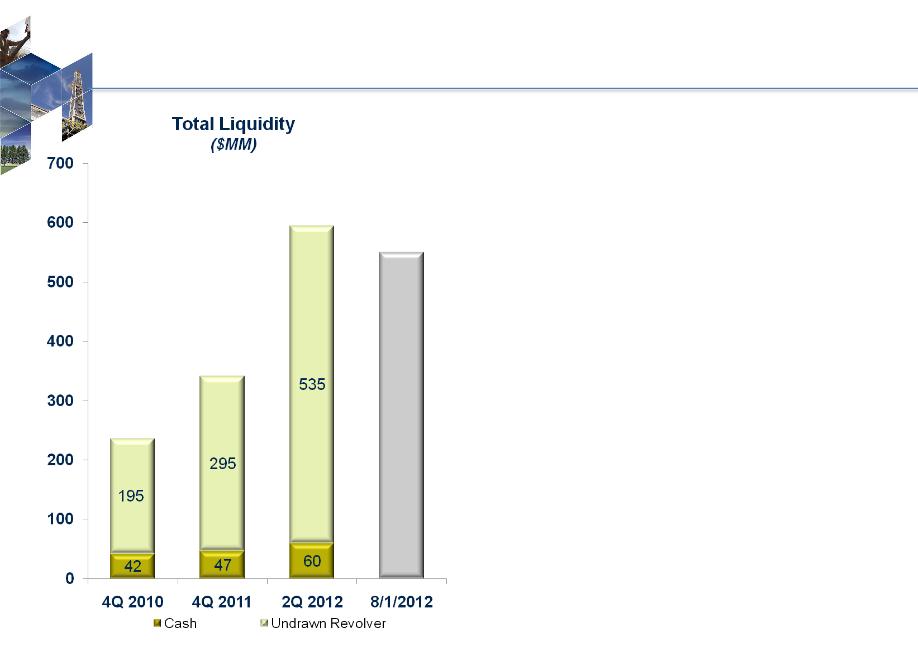
Adequate liquidity available to fund 2012
$640 million capital program
$640 million capital program
- Borrowing base raised in April, 2012 based
on performance
- $505 million of $625 million borrowing base
available as of August 1st
- Lobo and Olmos divestiture ($83 million, net
proceeds collected as of June 30th)
In low-price environment, $250 million in
capital required to maintain 2012
production level flat versus 2011 exit
rate
capital required to maintain 2012
production level flat versus 2011 exit
rate
Liquidity
28
342
237
595
550

Asset Base High-Graded
• Focused on liquids-rich targets in Eagle Ford with significant project inventory
• Completed divestiture program; redeployed proceeds
Executing Business Plan
• Doubled proved reserves since 12/31/2010
• Increased Gates Ranch recoveries
• Increased firm take-away capacity
• Projected strong 2012 growth and exit rates
Testing Growth Opportunities
• Increased Gates Ranch well density
• Three discoveries in other Eagle Ford areas
• Pursue new growth targets through blend of acquisitions and new ventures
Financial Strength and Flexibility
• Debt-to-capitalization ratio around 30%
• Approximately $550 million in liquidity as of early August 2012
Summary
29

APPENDIX
30

|
|
|
2012 Full Year
|
|||
|
|
|
|
|||
|
Production, MBoe/d (60% liquids)
|
|
35
|
-
|
38
|
|
|
Exit Rate, MBoe/d (61% liquids)
|
|
39
|
-
|
44
|
|
|
|
|
|
|
|
|
|
$/BOE
|
|
|
|
|
|
|
Direct Lease Operating Expense
|
|
$ 2.15
|
-
|
$ 2.20
|
|
|
Workover Expenses
|
|
|
-
|
|
|
|
Insurance
|
|
0.10
|
-
|
0.11
|
|
|
Ad Valorem Tax
|
|
0.75
|
-
|
0.85
|
|
|
Treating and Transportation
|
|
3.85
|
-
|
4.25
|
|
|
Production Taxes
|
|
1.20
|
-
|
1.25
|
|
|
DD&A
|
|
11.30
|
-
|
12.00
|
|
|
G&A, excluding Stock-Based Compensation
|
|
3.60
|
-
|
4.00
|
|
|
Interest Expense
|
|
1.90
|
-
|
1.95
|
|
31
Annual Guidance
• Volumes (Full Year 35 - 38 MBoe/d)
• 2Q 2012: 33.4 MBoe/d with 32.2 MBoe/d from Eagle Ford
• “Lumpy” quarterly production
• Back-end loaded oil production ramp-up to match timing of start-up of Klotzman oil facilities
• Product Mix (Full Year 60% total liquids)
• 2Q 2012: Oil 24%, NGLs 35% (Eagle Ford only - Oil 24%, NGLs 36%)
• Oil percentage ramp-up back-end loaded to 3rd and 4th quarters; timing of oilier production
contributions from Karnes Trough area and Briscoe Ranch
contributions from Karnes Trough area and Briscoe Ranch
• Treating & Transportation fees impacted by mix changes
• Crude Oil Pricing
• 2012E: 70% WTI less 5-10% for gravity & transportation / 30% LLS less 10%
• NGL pricing (Mount Belvieu Benchmark)
• Firm fractionation capacity
• Adjust for fractionation fees approximately $3 to $4 per barrel
• Adjust for reported derivative activity, excluding ethane
• Pricing estimates based on % of WTI not as correlative
Annual Guidance - Framing For Quarterly Models
32

|
|
1st Half 2012
|
2011
|
2010
|
|
Daily rate (MBoe/d)
|
33.6
|
27.6
|
22.9
|
|
Oil% / NGLs%
|
23% / 32%
|
18% / 26%
|
9% / 13%
|
|
|
$/Boe
|
$/Boe
|
$/Boe
|
|
Average realized price (without realized derivatives)
|
$40.64
|
$42.45
|
$32.98
|
|
Average realized price (with realized derivatives)
|
$42.15
|
$44.18
|
$36.85
|
|
Direct lease operating expense
|
$2.20
|
$2.72
|
$4.52
|
|
Workovers / Insurance / Ad valorem tax
|
0.86
|
0.75
|
1.58
|
|
Lease operating expense
|
$3.06
|
$3.47
|
$6.10
|
|
Treating and transportation
|
4.01
|
2.22
|
0.83
|
|
Production taxes
|
1.00
|
1.20
|
0.71
|
|
General and administrative costs¹
|
3.76
|
4.59
|
5.04
|
|
Interest expense
|
1.96
|
2.11
|
3.23
|
|
Total cash costs2
|
$13.79
|
$13.59
|
$15.91
|
|
Cash Margin2 (without realized derivatives)
|
$26.85
|
$28.86
|
$17.07
|
|
Cash Margin2 (with realized derivatives)
|
$28.36
|
$30.59
|
$20.94
|
Margin Improvement
33
1. Excludes stock-based compensation expense
2. Total cash costs (a non-GAAP measure) is calculated as the sum of all average costs per Boe, excluding DD&A and stock-based compensation. Cash Margin (a non-GAAP measure) is
calculated as the difference between average realized equivalent price and total cash costs. Management believes this presentation may be helpful to investors as it represents average
cash costs incurred by our oil, NGL and natural gas producing activities as compared to average realized price based on revenue generated. These measures are not intended to replace
GAAP statistics but rather to provide additional information that may be helpful in evaluating trends and performance.

REDEFINED
BUILDING VALUE IN UNCONVENTIONAL RESOURCES