Attached files
| file | filename |
|---|---|
| 8-K - FORM 8-K - LOCAL Corp | d395742d8k.htm |
 Corporate Overview
3Q2012
Exhibit 99.1 |
 CORPORATE OVERVIEW | 3Q2012
2
………………..…………………………………….
Forward looking statements |
 CORPORATE OVERVIEW | 3Q2012
3
..……………………………..…………………………………….
Local Corporation
Agenda
1. Business Overview
2. Growth & Momentum
3. Growth Opportunities
4. Financial Update |
 CORPORATE OVERVIEW | 3Q2012
4
.………………………………….
Business Overview: Executive Summary
Founded 1999, IPO 2004: NASDAQ: LOCM
1.
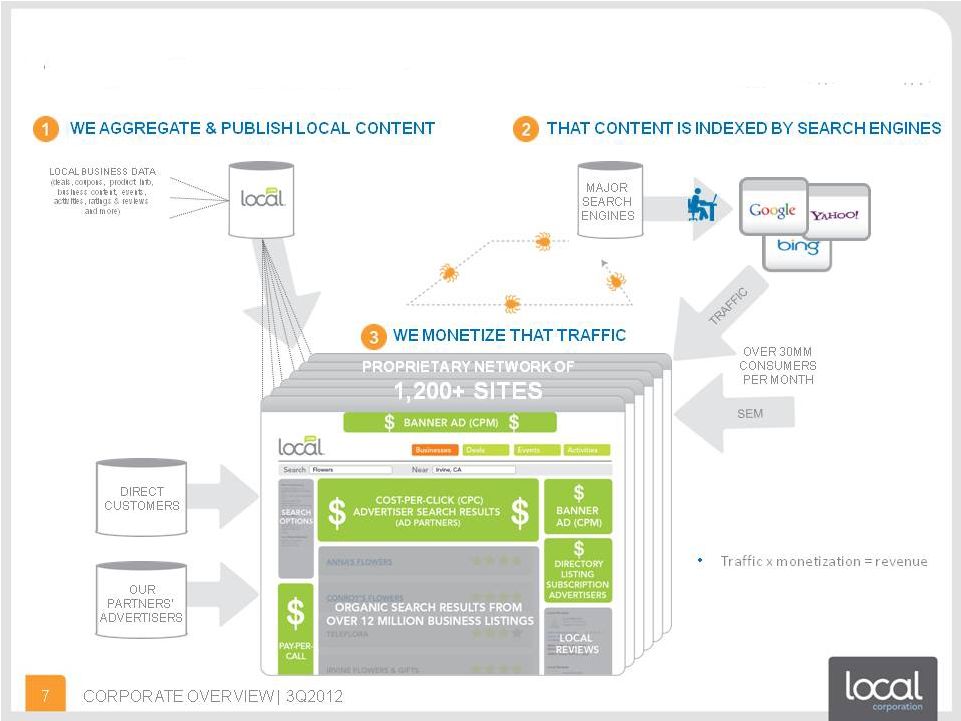
We connect local businesses with online consumers and generate revenue from
ads 2.
Ads mostly from third-parties like Google/Yahoo/ATTi etc, with an increased
focus on direct customers 3.
We serve over a million consumers a day across a proprietary network of 1,200
sites (web & mobile) 4.
We recently completed four acquisitions to expand our platform &
product suite, and have 9 patents issued
and 11 pending
5.
Forecasting ~35% revenue growth 2011-2012 with $0.10/share Adjusted Net Income*
*
We cannot project the non-cash gain or loss in connection with the warrant
liability, and therefore cannot reasonably project our GAAP net income. See
reconciliation of Adjusted Net Income to GAAP net income at slide 22.
|
 CORPORATE OVERVIEW | 3Q2012
5
..………………….
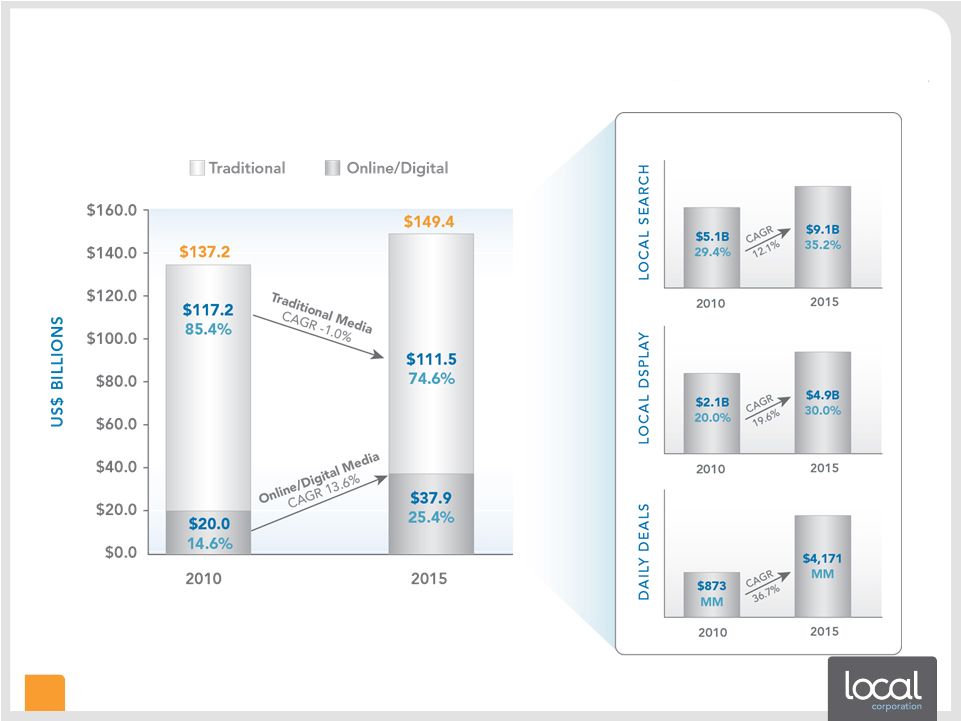
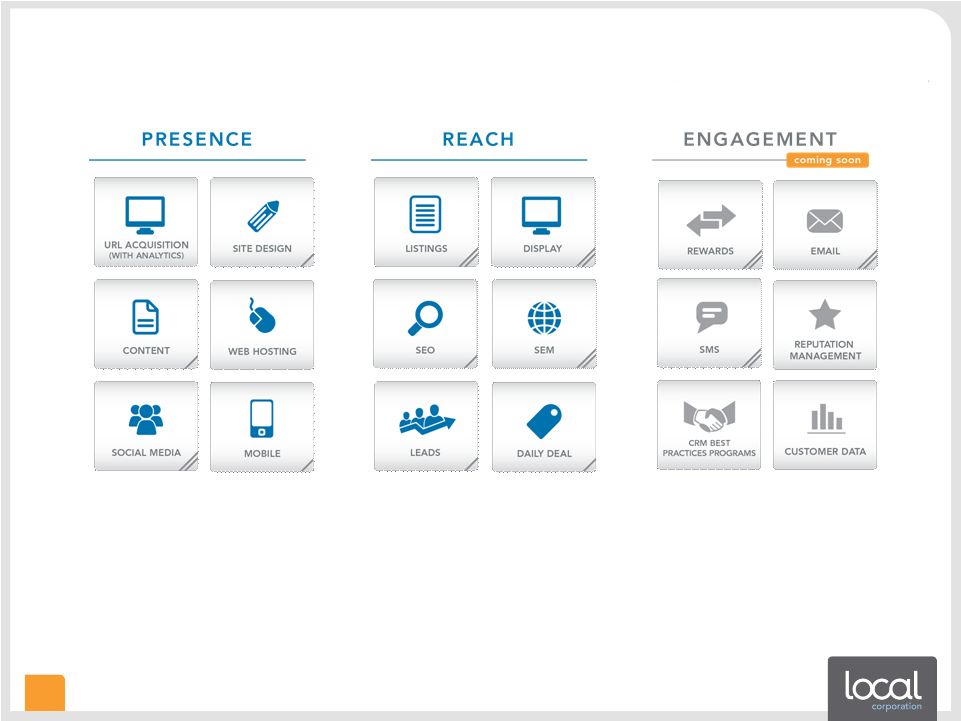
Business Overview: Beneficiary of Secular Trends
Digital media is going local....
…& we have assets in all areas |
 CORPORATE OVERVIEW | 3Q2012
6
………….……….
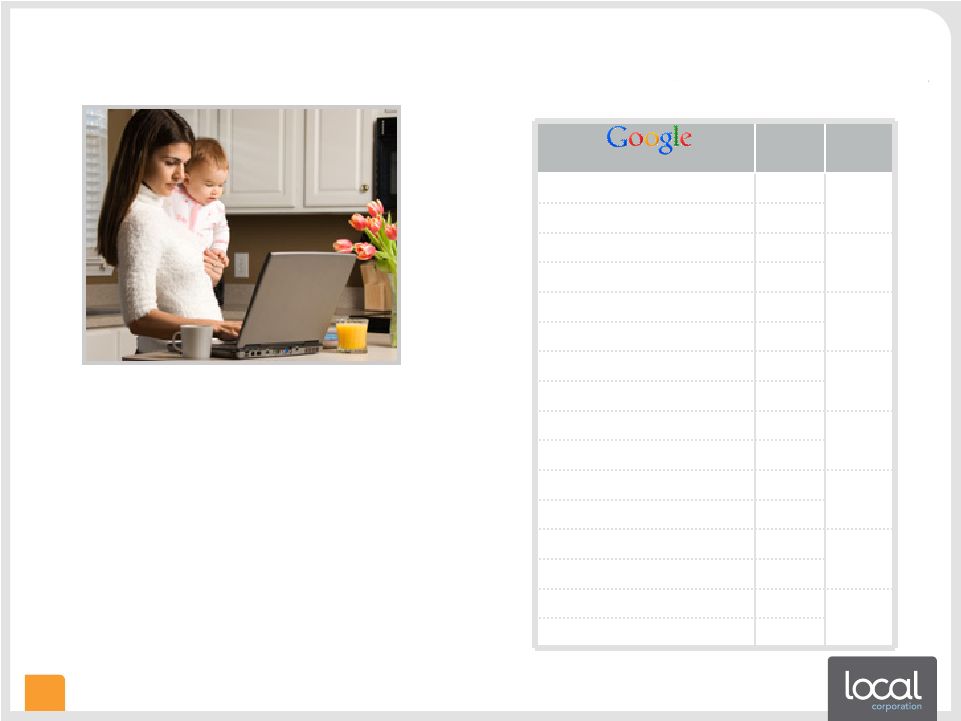
•
The ‘Soccer Mom’
demo
»
Aged between 25-45 with one or more child at home
»
Controls significant portion of the household spend
»
Typically spends 80% of that money within 20 miles of home
•
89% of in-store purchasers in key categories have conducted
online research**
•
82% of people visiting local search sites follow-up with offline
action (store visit/call)**
•
Soccer mom + local + commercial = ad sponsors
»
~70% of revenue is CPC; 20% subscriptions; 10% display
•
57% of Local.com and 80% of Spreebird traffic is this demo
Search Term
Click
Bids*
Premium
Plumber
$9.55
282%
Plumber
Los Angeles
$26.91
Credit Union
$0.91
235%
Seattle
Credit Union
$2.14
Restaurant
$1.39
139%
San Francisco
Restaurant
$1.93
Moving Company
$10.82
114%
Denver
Moving Company
$12.38
Divorce Attorney
$11.51
209%
Divorce Attorney Las Vegas
$24.02
Auto Repair
$4.18
153%
Dallas
Auto Repair
$6.41
Wedding Florist
$1.92
147%
Orlando Wedding Florist
$2.82
Hotel
$1.80
200%
New York City Hotel
$3.60
Pay-per-click rates for local versus national keyword terms…
Business Overview –
Why Local Consumers Matter
* Bids as of June 25, 2012 **
TMP/Yahoo-comScore study – 2007 |
 7
Business Overview: Our Model
…………………………………..…….……….
|
 CORPORATE OVERVIEW | 3Q2012
8
..……………..…………………………………….
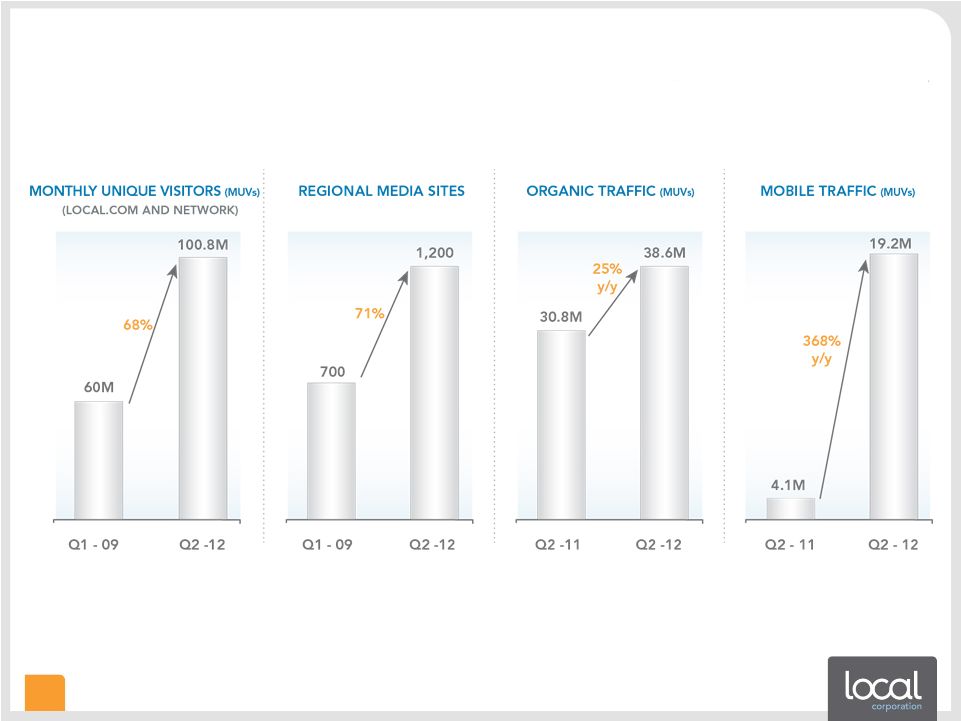
Growth & Momentum: Traffic |
 CORPORATE OVERVIEW | 3Q2012
9
..…..…………………………………….
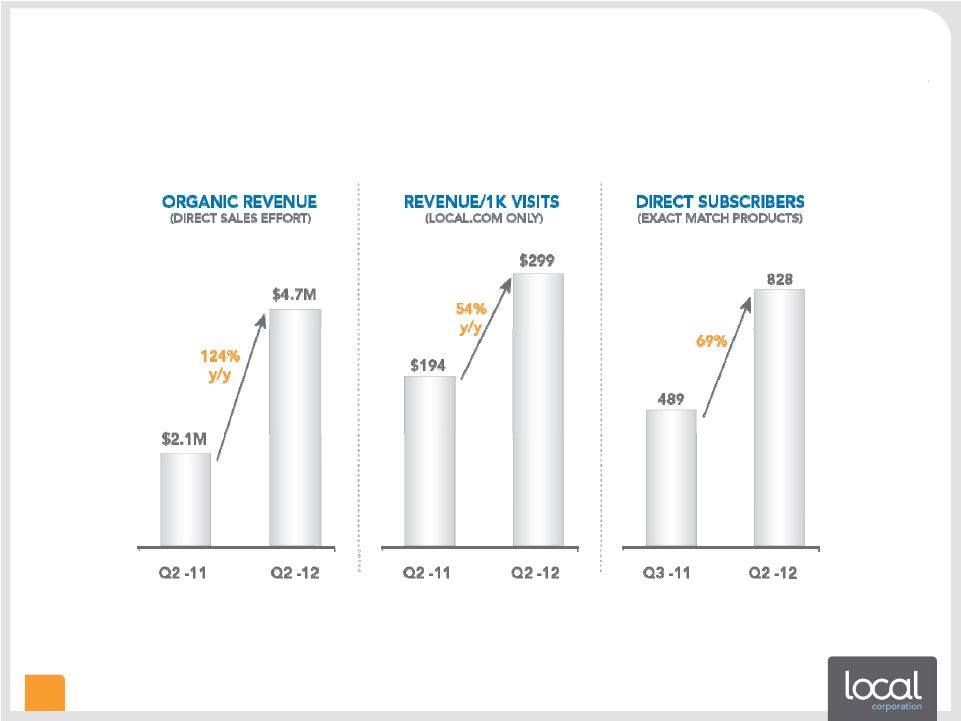
Growth & Momentum: Monetization |
 CORPORATE OVERVIEW | 3Q2012
10
…………..……….……….
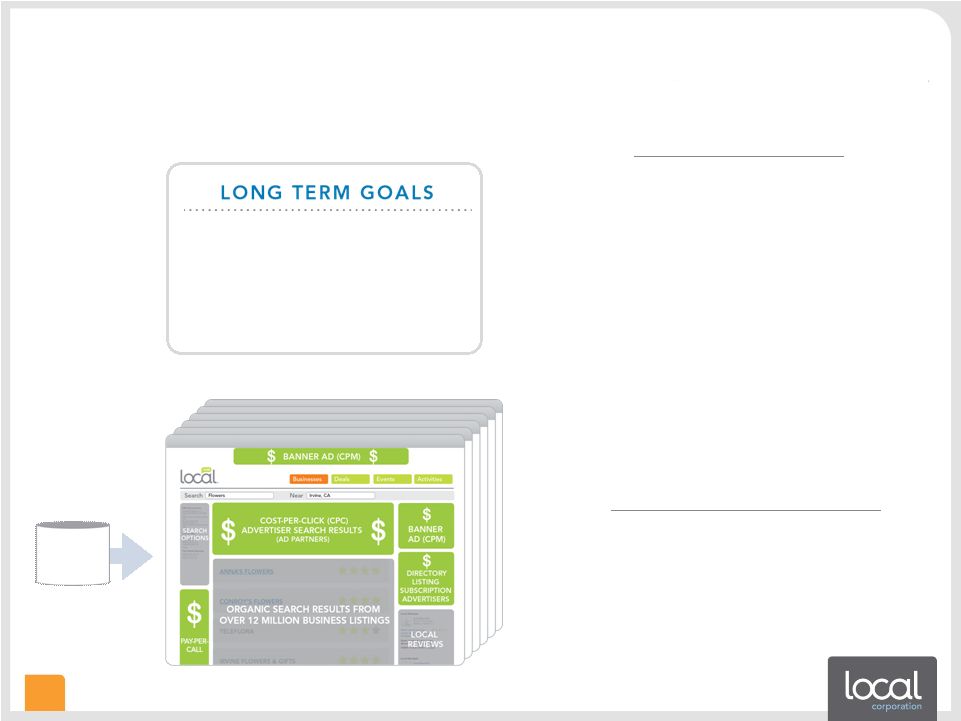
Growth Opportunities: Traffic & Monetization
•
Increase monetization of traffic
»
Optimize yield from ads via better analytics
»
Optimize marketing spend
»
Increase yield with more direct customers
–
Sell more products
–
Compete with better products…
•
Grow traffic
»
Expand network from 1,200 sites via
business development
»
Increase volume of traffic per site
–
New channel products e.g. real-time
product directory from Krillion acquisition
–
Refine SEO to increase organic traffic
»
Continue mobile expansion
–
New mobile products coming in 3Q12
1.
Grow organic traffic to at least
50% of overall traffic
2.
Grow organic (direct) revenues to
at least 50% of overall revenues
Traffic x monetization = revenue
DIRECT
CUSTOMERS
PROPRIETARY NETWORK OF
1,200+ SITES |
 CORPORATE OVERVIEW | 3Q2012
11
...……….
Growth Opportunities: A Complete Digital Media Solution
•
Sold to small and medium sized business for $249 per month
»
Sold via our own online marketing consultants today
–
Ramping each month
»
An incredibly flexible channel solution
–
Channel sales of certain modules starting 3Q12 |
 CORPORATE OVERVIEW | 3Q2012
12
..…….……….
Growth Opportunities: Case Study: Fabi’s Hair Studio
Facebook and Twitter pages engage
customers and increase awareness
Mobile-optimized site
features directions and
click-to-call
Beautiful site design and web
hosting with geo-targeted URL
and custom content
A consistent brand
and user experience
across multiple channels
add to business credibility |
 CORPORATE OVERVIEW | 3Q2012
13
…..….……….
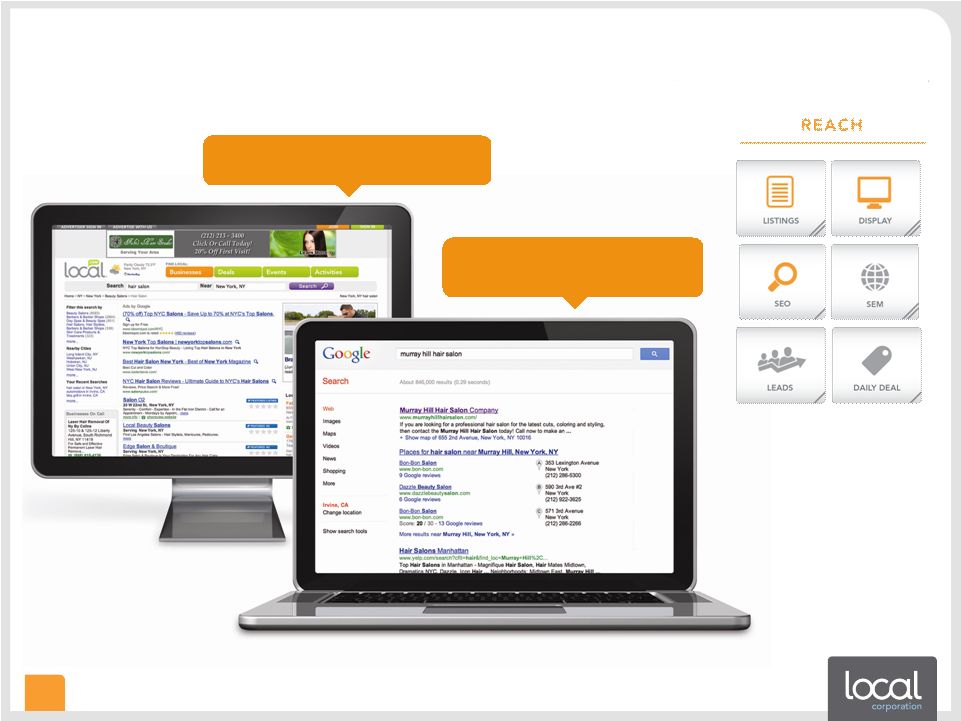
Growth Opportunities: Case Study: Fabi’s Hair Studio
Display ad and enhanced listing on
Local.com raise awareness in local markets
Search engine optimization ensures top
placement on major search engines
•
More direct customers =
»
Better monetization
»
Greater margins
»
Greater defensibility
»
More visibility |
 CORPORATE OVERVIEW | 3Q2012
14
…………………..……….
Proprietary Technologies Power Our Platform
12 million SMB listings across multiple
databases to validate and enhance
business information
daily deals
personalization engine
highly scalable geo-category
domain acquisition based on
consumer usage analysis
real-time product
inventory directly from
manufacturers, retailers
9 patents issued, 11
pending in local, mobile,
data & display
feed syndication
real-time ad and data integration from multiple partners
web-based drag & drop rich
media production
product-based search feeds
integrated into multiple ad types
data aggregation and normalization technologies
web crawlers
content marketplace
Keyword DNA™
technology
display ad production, management and serving
Our powerful platform incorporates a unique combination of technologies that provide an
increasingly differentiated
suite
of
digital
media
solutions
for
a
wide
range
of
customers
web hosting
search engine
optimization
daily deals
geo-targeted
display and
subscription ads
private label solutions
search engine marketing
content procurement and
management |
 CORPORATE OVERVIEW | 3Q2012
15
………………….……….
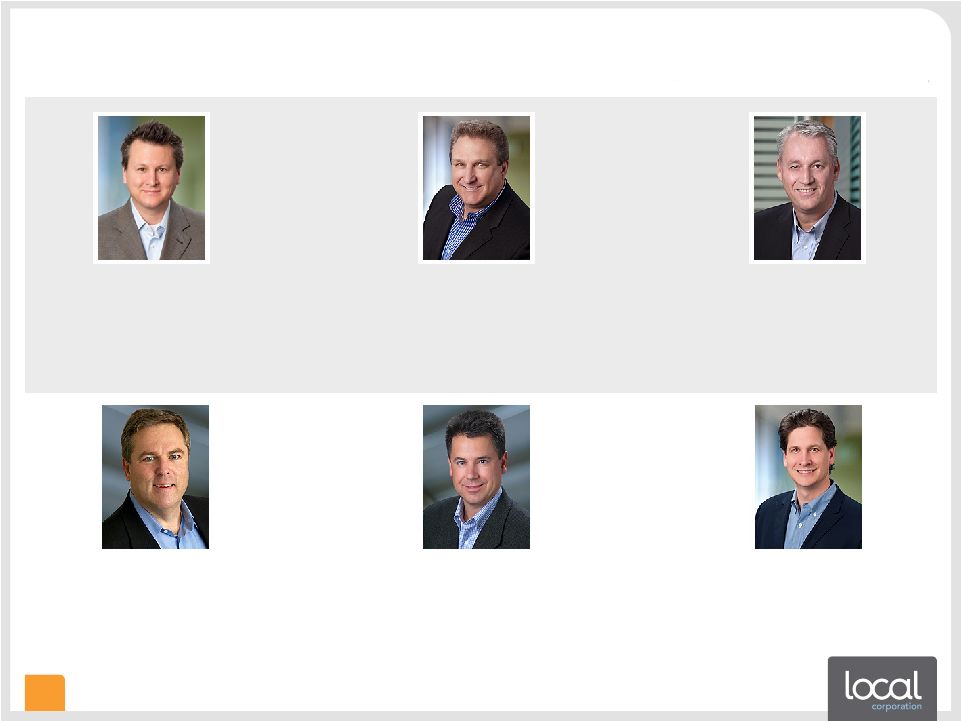
An Experienced Team with Strategy Discipline
Heath Clarke
Founder, Chairman & CEO
20+ yrs exp
Founded Local in ’99
VP eCommerce LanguageForce
CEO/Founder AFP (Australia)
Erick Herring
SVP Technology
Founder Townloop
CTO Feedback.com
CTO, VP Product Webvisible
CTO Adapt Technologies
Ken Cragun
CFO
20+ yrs exp
CFO Modtech
SVP MIVA
CFO ImproveNet
CFO NetCharge.com
CPA; Big 4 Exp.
Malcolm Lewis
SVP, GM Social Buying
Founder, Fablistic
SVP/GM, Local Corporation
Sr. Management, Oracle Corporation
Mike Sawtell
President & COO
20+ yrs exp
Chairman & CEO, DigitalPost Interactive
Pres. & COO , Interchange Corp. (now
Local Corporation)
COO & VP of Sales, Informative Research
Peter Hutto
SVP, Corporate Development
Co-Founder, ZeroDegrees
Managing Director, EDS & MCI
Systemhouse |
 CORPORATE OVERVIEW | 3Q2012
16
………………………….…….……….
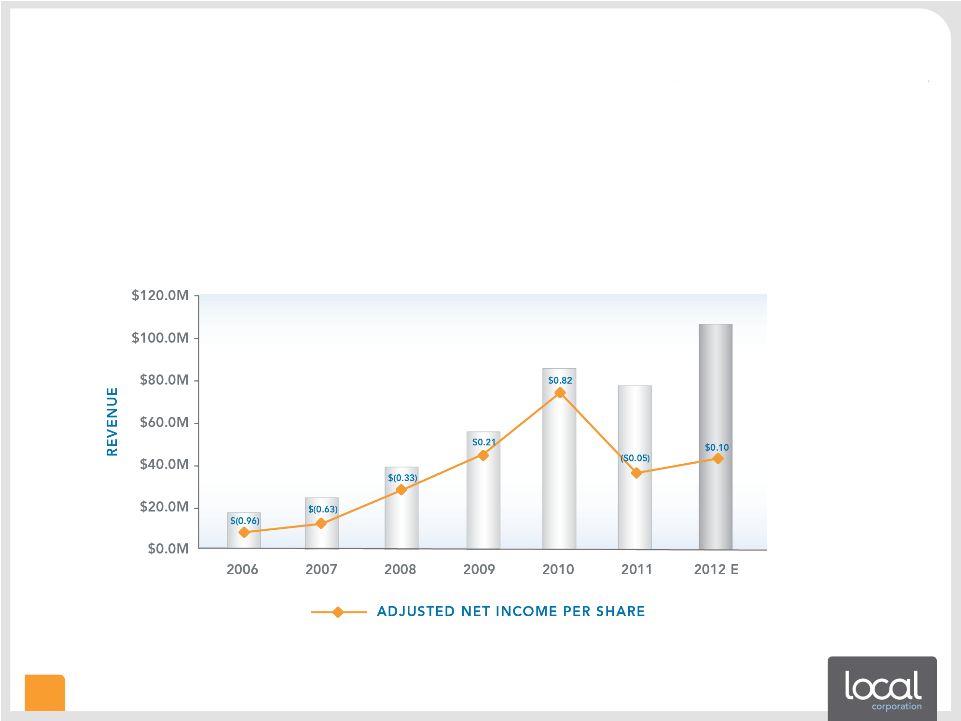
Financial Update: Long Term Growth
•
75% YoY revenue growth (Q2’12 over Q2’11)
•
~40% CAGR 2006-2012
•
3Q12 Guidance: $24.5MM revenues and Breakeven Adjusted Net Income
•
FY12 Guidance: $106MM revenues: 35% higher than 2011 and $2.2MM Adjusted Net
Income Note: See reconciliation of Adjusted Net Income to GAAP net income at
slide 22. |
 CORPORATE OVERVIEW | 3Q2012
17
………………..….……….
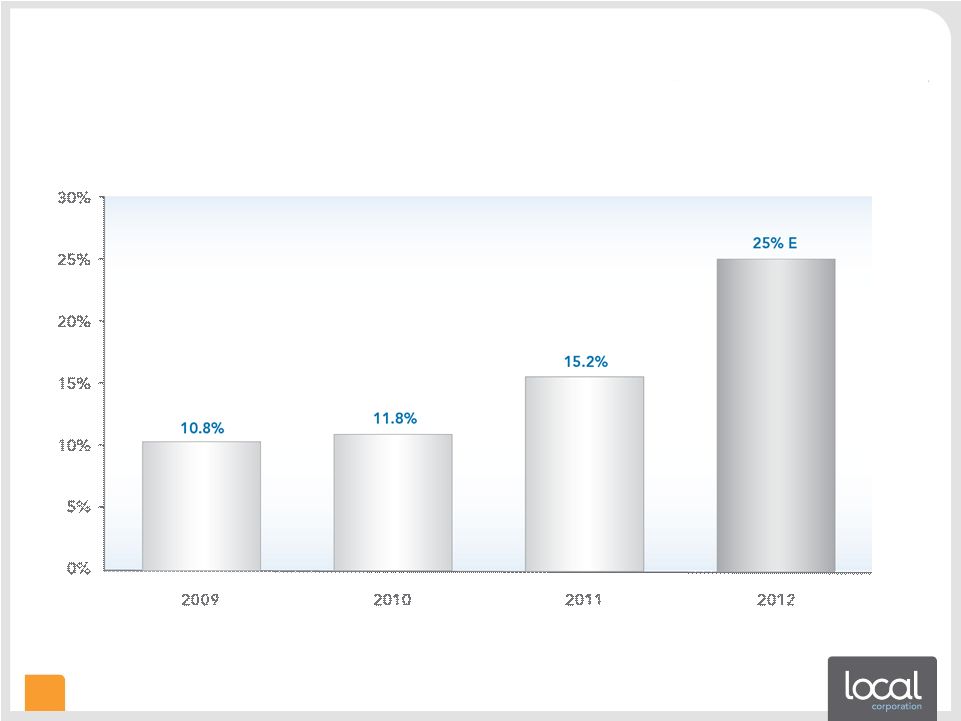
Financial Update: Organic/Direct Revenue %
Near Term Target: 25% of revenue organically |
 CORPORATE OVERVIEW | 3Q2012
18
………...……….
Financial Update: 2Q12 Balance Sheet & Cap. Table
Key Balance Sheet Items
(in thousands)
June 30, 2012
Cash
$7,103
Accounts Receivable
15,224
Total Assets
65,621
Total Debt
8,000
Total Liabilities
26,983
Shareholders Equity
$38,638
June 30, 2012
Common stock
22,088
Options
(Avg.
Strike
$4.28)
4,508
Warrants
(Avg.
Strike
$7.48)
1,239
RSUs
384
PSUs
94
Fully Diluted
28,313
1.
Options and warrants represent approximately $29MM in cash
Additional
Data:
I.
In August 2011 the Company closed on a $12 million credit facility
II.
Total authorized shares 65,000,000 common and 10,000,000 preferred
III.
In January 2011 the Company completed a public offering of 4.6 million shares at a
price of $4.25 per share. Net proceeds of $18.2 million 1
1 |
 CORPORATE OVERVIEW | 3Q2012
19
…………………………..…….……….
Why Invest in Local Corporation?
•
Rapidly growing company in a rapidly growing market
•
Beneficiary of secular trend towards online ad spend by SMBs
•
Extensive technology platform and differentiated product portfolio
An Attractive Position
in Fast Growing Markets
•
Growing revenue streams with considerable future growth potential
•
Proprietary products that improve operating leverage over time
•
Experienced executive team focused on execution with strategy discipline
Strong Operating Model
with Experienced
Leadership Team
•
Yahoo/Bing dependency mitigated
•
Not just a search engine –
a media business
•
Returned to strong growth with greater revenue diversification
Completed a Business
Transformation |
 CORPORATE OVERVIEW | 3Q2012
20
Thank You
Heath Clarke
Founder, Chairman & Chief Executive Officer
hclarke@local.com
Ken Cragun
Chief Financial Officer
kcragun@local.com
949.784.0800
http://www.localcorporation.com |
 CORPORATE OVERVIEW | 3Q2012
21
……………………………………………………………….……….……….
P&L Trend
Actual
Actual
Forecast
Description
FY-10
FY-11
FY-12
Revenue
$ 84,137
$ 78,259
$ 106,000
Sequential revenue growth
49%
-8%
35%
Gross Margin
37,620
29,001
Gross Margin %
45%
37%
Other Operating Expenses
33,908
43,629
Operating income (loss)
3,712
(14,628)
Interest and other income (expense)
(275)
(413)
Change in fair value of warrant liability
887
2,633
Income (Loss) before income taxes
4,324
(12,408)
Provision for income taxes
102
178
Net income (loss) from continuing operations
$ 4,222
$ (12,586)
Income (loss) from discontinued operations
(1,972)
Net income (loss)
$ 4,222
$ (14,558)
Adjusted Net income (loss)
$ 13,775
$ (1,090)
$ 2,200
Weighted average shares
16,788
21,384
23,000
Net income (loss) per share from discontinued operations
$ 0.25
$ (0.68)
Adjusted Net income (loss) per share
$ 0.82
$ (0.05)
$ 0.10
Note: See reconciliation of Adjusted Net Income to GAAP net income at slide
22. (in thousands, except per share amounts) |
 CORPORATE OVERVIEW | 3Q2012
22
……..……….
Reconciliation: Adjusted Net Income to GAAP Net Inc
Actual
Actual
Forecast
Description
FY-10
FY-11
FY-12
Adjusted Net income (loss)
$ 13,775
$ (1,090)
$ 2,200*
Plus interest and other income (expense), net
(275)
(413)
(400)
Less provision for income taxes
(102)
(178)
(150)
Less amortization of intangibles
(5,734)
(5,136)
(3,500)
Less depreciation
(1,418)
(3,277)
(3,900)
Less stock-based compensation
(2,911)
(3,663)
(3,400)
Less revaluation of warrants
887
2,633
unknown
Less non-recurring charges
-
(1,461)
(609)
Less impairment charge
(6,500)
Less Rovion assets held for sale
(1,972)
(900)
GAAP Net income (loss)
$ 4,222
$(14,558)
unknown
Weighted Avg Shares -
Adjusted Net income (loss)
16,788
21,384
23,000*
Weighted Avg Shares -
GAAP Net income (loss)
16,788
21,384
23,000*
Adjusted Net income (loss) per share
$ 0.82
$ (0.05)
$ 0.10*
GAAP Net income (loss) per share
$ 0.25
$ (0.68)
unknown
(in thousands, except per share amounts) |