Attached files
| file | filename |
|---|---|
| 8-K - FORM 8-K - Griffin Capital Essential Asset REIT, Inc. | d396064d8k.htm |
| EX-99.1 - PRESENTATION MATERIALS - Griffin Capital Essential Asset REIT, Inc. | d396064dex991.htm |
| EX-99.2 - PRESENTATION SCRIPT - Griffin Capital Essential Asset REIT, Inc. | d396064dex992.htm |
Exhibit 99.3
SECOND QUARTER 2012 INVESTOR UPDATE
LETTER FROM THE CHAIRMAN JUNE 30, 2012
Dear Fellow Shareholder:
I am very pleased to report 2012 got off to a great start and we continued to build on that momentum through the second quarter. Through June, we added four Outstanding assets to our portfolio with tenants that represent the historic core of the Dow Jones 30 Industrials: AT&T, Westinghouse, GE and Traveler’s Indemnity. These acquisitions tilt over 2/3rds of our portfolio rental revenue to investment grade-rated credit status, which, given our current declared 6.75% distribution rate, represents an outstanding return given the credit quality of our portfolio. Our portfolio has grown nearly 64% since the beginning of the year providing greater
Diversification and stability to our portfolio cash flow.
We finished the quarter with an approximate leverage ratio of 53% relative to total REIT capitalization with a weighted average interest rate of 4.3%. This compares to our weighted average initial acquisition capitalization rate (our initial yield at the time of acquisition) of approximately 8.i% . As such, our shareholders benefit from very effective and accretive leverage that is conservatively applied.
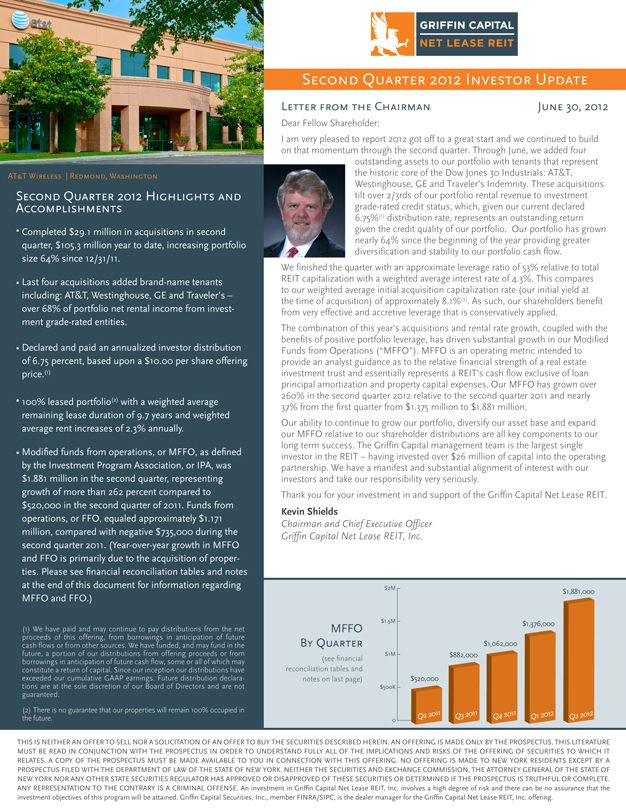
The combination of this year’s acquisitions and rental rate growth, coupled with the benefits of positive portfolio leverage, has driven substantial growth in our Modified Funds from Operations (“MFFO”). MFFO is an operating metric intended to provide an analyst guidance as to the relative financial strength of a real estate investment trust and essentially represents a REIT’s cash flow exclusive of loan principal amortization and property capital expenses. Our MFFO has grown over 260% in the second quarter 2012 relative to the second quarter 2011 and nearly 37% from the first quarter from $1375 million to $i.88i million.
Our ability to continue to grow our portfolio, diversify our asset base and expand our MFFO relative to our shareholder distributions are all key components to our long term success. The Griffin Capital management team is the largest single investor in the REIT — having invested over $26 million of capital into the operating partnership. We have a manifest and substantial alignment of interest with our investors and take our responsibility very seriously.
Thank you for your investment in and support of the Griffin Capital Net Lease REIT.
Kevin Shields
Chairman and Chief Executive Officer
Griffin Capital Net Lease REIT, Inc.
MEFO
B QUARTER
(See financial
Reconciliation tables and notes on last page)
Si 881000
$2M
$i.5M $1376000
$1M $882000
Si 062000
$520,000
$500K
THIS IS NEITHER AN OFFER TO SELL NOR A SOLICITATION OF AN OFFER TO BUY THE SECURITIES DESCRIBED HEREIN.AN OFFERING IS MADE ONLY BYTHE PROSPECTUS. THIS LITERATURE MUST BE READ IN CONJUNCTION WITH THE PROSPECTUS IN ORDER TO UNDERSTAND FULLYALL OF THE IMPLICATIONS AND RISKS OF THE OFFERING OF SECURITIES TO WHICH IT RELATES. A COPY OF THE PROSPECTUS MUST BE MADE AVAILABLE TO YOU IN CONNECTION WITH THIS OFFERING. NO OFFERING IS MADE TO NEW YORK RESIDENTS EXCEPT BY A PROSPECTUS FILED WITH THE DEPARTMENT OF LAW OF THE STATE OF NEWYORK. NEITHER THE SECURITIESAND EXCHANGE COMMISSION, THEATTORNEY GENERAL OF THE STATE OF NEWYORK NORANY OTHER STATE SECURITIES REGULATOR HASAPPROVED OR DISAPPROVED OF THESE SECURITIES OR DETERMINED IF THE PROSPECTUS IS TRUTHFUL OR COMPLETE. ANY REPRESENTATION TO THE CONTRARY IS A CRIMINAL OFFENSE. An investment in Griffin Capital Net Lease REIT, Inc. involves a high degree of risk and there can be no assurance that the investment objectives of this program will be attained. Griffin Capital Securities, Inc., member FINRA/SIPC, is the dealer manager for the Griffin Capital Net Lease REIT, Inc. offering.
AT&T WIRELESS IREDM0ND, WASHINGT0N
SECOND QUARTER 2012 HIGHLIGHTS AND ACCOMPLISHMENTS
• Completed $29.1 million in acquisitions in second quarter; $105.3 million year to date, increasing portfolio size 64% since 12/31/11.
• Last four acquisitions added brand-name tenants including: AT&1 Westinghouse, GE and Traveler’s — over 68% of portfolio net rental income from investment grade-rated entities.
• Declared and paid an annualized investor distribution of 6.75 percent, based upon a $io.oo per share offering price)
• 1oo% leased portfolio() with a weighted average remaining lease duration of9.7 years and weighted average rent increases of2.3% annually.
• Modified funds from operations, or MFFO, as defined by the Investment Program Association, or IPA, was $i.88i million in the second quarter; representing growth of more than 262 percent compared to $520,000 in the second quarter of 2011. Funds from operations, or FF0, equaled approximately $i .1 71 million, compared with negative $735,000 during the second quarter 2011. (Year-over-year growth in MFFO and FF0 is primarily due to the acquisition of properties. Please see financial reconciliation tables and notes at the end of this document for information regarding MFFO and FF0.)
(i) We have paid and may continue to pay distributions from the net proceeds of this offering, from borrowings in anticipation of future cash flows or from other sources. We have funded, and may fund in the future, a portion of our distributions from offering proceeds or from borrowings in anticipation of future cash flow, some or all of which may constitute a return of capital. Since our inception our distributions have exceeded our cumulative GAAP earnings. Future distribution declarations are at the sole discretion of our Board of Directors and are not guaranteed.
| (2) |
There is no guarantee that our properties will remain 10000 occupied in the future. |

PORTFOLIO AT-A-GLANCE
As of June 3o, 2o12
Size of Portfolio: 2.82 million square feet
Occupancy :(2) 100%
Remaining average lease term: Approximately 9.7 yrs. Weighted average purchase cap rate:1 8.i %
Current average debt rate: 4.3%
Cap rate spread: 11 3.8% (380 bps)
Weighted average annual rental increase: 2.31%
(3) The estimated going-in capitalization rate is determined by dividing the projected net rental payment for the first fiscal year we own the property by the acquisition price (exclusive of closing and offering costs). Generally, pursuant to each lease, if the tenant is directly responsible for the payment of all property operating expenses, insurance and taxes, the net rental payment by the tenant to the landlord is equivalent to the base rental payment. The projected net rental payment includes assumptions that may not be indicative of the actual future performance of a property, including the assumption that the tenant will perform its obligations under its lease agreement during the neat i 2 months.
(4) The cap rate spread is the difference between the weighted average purchase cap rate and the current average debt rate on the outstanding loans within the portfolio. However, bear in mind a positive cap rate spread does not ensure a positive investment result.
TENANT BUSINESS DIVERSITY5
Apparel
Engineering
1%
Kitchenware
Consumer Produces
Education
Printing
Biotechnology
• Wireless
Telecommunications
Nuclear Energy
Aerospace
Property & Casualty Insurance
(5) As of June 30, 2012 our five largest tenants, based on rental income, were Life Technologies corporation (approximately 18.7%), AT&T Services, lnc. (Approximately 13.9%), Westinghouse Electric company (approximately 13.1%), Chicago Bridge & Iron company (Delaware) (approximately 12.2%), and World Kitchen, LLC (apprssimatelyro.5%).
PROPERTY MAP
| 1 |
Life Technologies Corporation Global Headquarters Campus Carlsbad, California |
| 2 |
ITT Technical Institute I Los Angeles Campus |
Sylmar (Los Angeles), California
| 3 |
AT&T Wireless I National Network Operations Center |
Redmond, Washington
| 4 |
Quad Graphics Regional Directory Printing Facility Loveland, Colorado |
| 5 |
The Travelers Indemnity Company I Regional Headquarters Facility Greenwood Village (Denver), Colorado |
| 6 |
Hopkins Manufacturing Corporation I Headquarters & Production/Distribution Facility |
Emporia, Kansas
| 8 |
World Kitchen Principal Distribution Facility Monee, Illinois |
9 Renfro Corporation Regional Distribution Facility Clinton, South Carolina
Westinghouse Electric Company Headquarters Campus Location
Cranberry, Pennsylvania
11 GE Aviation Systems Component Manufacturing Facility Whippany, New jersey
Q Chicago Bridge & Iron I Engineering Headquarters Plainfield, Illinois

PORTFOLIO OVERVIEW
Representative Properties
AT&T Wireless
National Network Operations Center
Redmond, Washington
Tenant: AT&T Wireless, Inc. (Lessee is AT&T Services,
Inc. wholly-owned subsidiary ofAT&1 Inc.)
Type of Lease: Triple Net
Occupancy: 1oo%
Square Footage: 155,830
Property Description: This property serves as the national network operations center and next-generation’ research and development facility for AT&T Wireless, Inc. The tenant has invested more than $50 million of its own capital into the building and has plans to invest additional monies in the near future.
Occupancy: 1oo%
Square Footage: 328,655
Property Description: The Life Technologies property represents the only facility within the global headquarters campus that contains laboratory, research and development and manufacturing capabilities. tenant has invested over $57 million of its own capital in the building with plans to invest additional funds in the future.
Tenant: Life Technologies Corporation
Type of Lease:
Absolute Net
GE Aviation Systems; Lease guaranteed by General Electric Company
Type of Lease: Triple Net
Occupancy: 1oo%
Square Footage: 114,265
Property Description: Within the facility, GE Aviation Systems designs, assembles and repairs mission critical airplane components for every major aircraft manufacturer (Airbus, Lockheed Martin, Boeing). as well as missile weapons systems and other precision components for the Department of Defense. GE Aviation Systems has fully occupied the property since acquiring the original tenant, Smiths Aerospace, in 2007 and in March 2011 elected to renew the lease through March 2018.
GE AVIATION SYSTEMS
Component Manufacturing Facility
Whippany, New Jersey
Tenant:
The Travelers Indemnity Company
Triple Net
Occupancy: 1oo%
Square Footage: 130,998
Property Description: The regional headquarters facility near Denver is the third largest office location for Travelers Indemnity. The property houses over 500 essential personnel that perform a full complement of functions critical to the tenant’s business operations including claims processing, marketing services and legal review.
THE TRAVELERS INDEMNITY COM
Regional Headquarters Facility
Greenwood Village (Denver), Colorado
Tenant:
Type of Lease:

WORLD KITCHEN
Principal Distribution Facility
Monee, Illinois
Type of Lease:
Occupancy:
Square Footage:
World Kitchen, LLC
Absolute Net
700,200
Property Description: The World Kitchen principal distribution facility was developed in the late 1990’s as a build-to-suit for the tenant as part of a strategic plan to consolidate multiple smaller warehouse locations into a state-of-the-art, 32 foot ceiling clear height, institutional-quality warehouse.
Tenant:
Type of Lease:
Occupancy:
Square Footage:
Westinghouse Electric Company; Lease guaranteed by Westinghouse Electric UK Holdings Limited and TSB Nuclear Energy USA Group, Inc., wholly-owned subsidiaries of Toshiba Corporation
Triple Net
117,968
Property Description: The property was constructed in 2010 as a build-to-suit on Westinghouse’s international headquarters campus outside Pittsburgh, PA, which houses over 4,000 employees. This property houses the engineering group responsible for its Nuclear Fuel and Nuclear Services businesses.
WESTING HOUSE ELECTRIC COMPANY
Headquarters Campus Location Cranberry, Pennsylvania
Tenant:
RISK FACTORS
The following is a summary of some of the risks of Griffin Capital Net Lease REIT, Inc. A more detailed description of the risks are included in the Form 10-K and current Form 10-Q.
•We have limited operating history and, as of June 30, 2012, we owned ii properties. We are a “blind pool” because we have not identified any additional investments we will make with proceeds from this offering. Thus, you will not have the opportunity to evaluate your own investments before we market them, which makes your investment in our shares speculative.
• We have no employees and must depend on our advisor to conduct our operations, and there is no guarantee that our advisor will devote adequate time or resources to us.
• Payment of substantial fees to our advisor and its affiliates will reduce cash available for investment and distribution.
• There are substantial conflicts among us and our sponsor, advisor, dealer manager and property manager.
• If distributions are paid from sources other than cash flow from operations, then there may be less money for acquisitions. Additionally, the overall return may be lower.
• Distributions are dependent upon the REIT’s ability to collect rental income. Many of our properties will depend upon a single tenant for a majority of their rental income and their ability to pay their rent may be affected by adverse economic conditions, a downturn in their business, bankruptcy or insolvency.
• We may borrow funds, issue new securities or sell assets to make distributions, some of which may constitute a return of capital, and there are no current limits on the amount of distributions to be paid from such funds.
• Distributions of current or accumulated earnings and profits will be taxable to stockholders as ordinary income, but to the extent distributions exceed current or accumulated earnings and profits, a stockholder’s basis in our stock will be reduced, and, a stockholder may recognize a capital gain to the extent distributions exceed the stockholder’s basis.
• We may fail to qualify as a REIT, which could adversely affect our operations and our ability to make distributions.
• We may use substantial debt to acquire our properties, especially in the early years, which could hinder our ability to pay distributions to our stockholders or could decrease the value of your investment.
• We have funded, and may fund in the future, a portion of our distributions from offering proceeds or from borrowings in anticipation of future cash flow, some or all of which may constitute a return of capital. Since our inception our distributions have exceeded our cumulative GAAP earnings.
• Future distribution declarations are at the sole discretion of our Board of Directors and are not guaranteed.
• If we breach covenants under our loans with KeyBank National Association or other lenders, we could be held in default under such loans, which could accelerate our repayment date and materially adversely affect the value of our stockholders’ investment in us.
949.270.9300 WWW.GRIFFINCAPITAL.COM
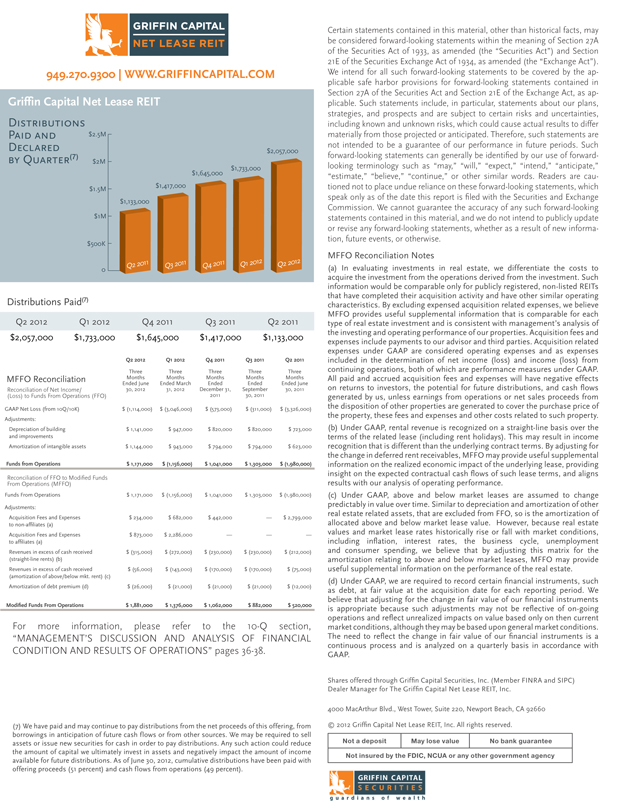
Griffin Capital Net Lease REIT
DISTRIBUTIONS “
PAID AND
DECLARED
BY QUARTER7)
$1,733 000
$1, 645,000
$2,057,000
Distributions Paid
Q2 2012 Qi 2012 Q4 2011 Q3 2011 Q2 2011
$2,057,000 $1,733,000 $1,645,000 $1,417,000 $1133000
Q22o12 Qi 2012 Q42oi1 Q3o11 Q22o11
Three Three Three Three Three
M FF0 Reconciliation Months Months Months Months Months
Ended June Ended March Ended Ended Ended June
Reconciliation of Net lncome/ 30, 2012 31, acia December31, September 30,2011
(Loss) to Funds From operatioris (FF0) 2011 30 2011
GMP Net Loss (fromioQfioK) $)11i4000) $(3,o.6ooo) $)573000) $)311,000) $)3326,00)
Adjustments
Depreciation of building $ 1,141,000 $947,000 S820,000 $ 820,000 $ 723000
and improvements
Amortization o f intangible assets 1,144,000 $ 943,000 $ 794,000 $ 794,000 $ 623,000
Funds from Operations $1,171,000 $(1,156,000) $1,041,000 $1,303,000 $(1,980,000)
Reconciliation of FF0 to Modified Funds
From Operations (MFFO)
Funds From Operations $ 1,171,000 $ (1,156,000) 1,041,000 $ 1,303,000 $ (1,98o,000)
Ad1ustments
Acquisition Fees and Expenses ZM,000 $ 682,000 $ 442,000
to non-affiliates (a)
Acquisition Fees and Expenses $ 873,000 $ 2,286,000
to affiliates )a)
Revenues in excess of cash received (315,000) $ (272,000) (230,000) $ (230,000) (ziz,ooo)
(straight-line rents) )b)
Revenues in excess of cash received $ (6,ooo) $ (143,000) $ (170,000) $ )17o,000) $ )75,000)
(amortization of above/below mkt rent( )c(
Amortization of debt premium (d) $ (z6,ooo) (zi,ooo) (zi,ooo) (21,000) (12,000)
Modified funds from operaiions Si,88iooo $1376000 $1,062,000 $ 882,000 $ 520,000
—
For more information, please refer to the 10-Q section,
“MANAGEMENT’ S DISCUSSION AND ANALYSIS OF FINANCIAL
CONDITION AND RESULTS OF OPERATIONS” pages 36-38.
() We have paid and may continue to pay distributions from the net proceeds of this offering, from borrowings in anticipation of future cash flows or from other sources. We may be required to sell assets or issue new securities for cash in order to pay distributions. Any such action could reduce the amount of capital we ultimately invest in assets and negatively impact the amount of income available for future distributions. As of June 30, 2012, cumulative distributions have been paid with offering proceeds (i percent) and cash flows from operations (49 percent).
Shares offered through Griffin Capital Securities, Inc. (Member FINRA and SIPC) Dealer Manager for The Griffin Capital Net Lease REIT, Inc.
4000 MacArthur Blvd., West Tower; Suite 220, Newport Beach, CA 92660
Certain statements contained in this material, other than historical facts, may be considered forward-looking statements within the meaning of Section 27A of the Securities Act of 1933, as amended (the ‘Securities Act”) and Section 21E of the Securities Exchange Act of1934, as amended (the “Exchange Act”). We intend for all such forward-looking statements to be covered by the applicable safe harbor provisions for forward-looking statements contained in Section 27A of the Securities Act and Section 21 E of the Exchange Act, as applicable. Such statements include, in particular, statements about our plans, strategies, and prospects and are subject to certain risks and uncertainties, including known and unknown risks, which could cause actual results to differ materially from those projected or anticipated. Therefore, such statements are not intended to be a guarantee of our performance in future periods. Such forward-looking statements can generally be identified by our use of forward- looking terminology such as ‘may’ ”will” expect,’ ”intend”“anticipate”“estimate,” “ believe,” “continue,” or other similar words. Readers are cautioned not to place undue reliance on these forward-looking statements, which speak only as of the date this report is filed with the Securities and Exchange Commission. We cannot guarantee the accuracy of any such forward-looking statements contained in this material, and we do not intend to publicly update or revise any forward-looking statements, whether as a result of new information, future events, or otherwise.
MFFO Reconciliation Notes
| (a) |
In evaluating investments in real estate, we differentiate the costs to acquire the investment from the operations derived from the investment Such information would be comparable only for publicly registered, non-listed REITs that have completed their acquisition activity and have other similar operating characteristics. By excluding expensed acquisition related expenses, we believe MFFO provides useful supplemental information that is comparable for each type of real estate investment and is consistent with management’s analysis of the investing and operating performance ofour properties. Acquisition fees and expenses include payments to our advisor and third parties. Acquisition related expenses under GAAP are considered operating expenses and as expenses included in the determination of net income (loss) and income (loss) from continuing operations, both of which are performance measures under GAAP. All paid and accrued acquisition fees and expenses will have negative effects on returns to investors, the potential for future distributions, and cash flows generated by us, unless earnings from operations or net sales proceeds from the disposition of other properties are generated to coverthe purchase price of the property, these fees and expenses and other costs related to such property. |
| (b) |
Under GAAP, rental revenue is recognized on a straight-line basis over the terms of the related lease (including rent holidays). This may result in income recognition that is different than the underlying contract terms. By adj usting for the change in deferred rent receivables, M FF0 may provide useful supplemental information on the realized economic impact ofthe underlying lease, providing insight on the expected contractual cash flows of such lease terms, and aligns results with our analysis of operating performance. (I Under GAAP, above and below market leases are assumed to change predictably in value overtime. Similarto depreciation and amortization ofother real estate related assets, that are excluded from FF0, so is the amortization of allocated above and below market lease value. However, because real estate values and market lease rates historically rise or fall with market conditions, including inflation, interest rates, the business cycle, unemployment and consumer spending, we believe that by adjusting this matrix for the amortization relating to above and below market leases, MFFO may provide useful supplemental information on the performance ofthe real estate. |
| (d) |
Under GAAP, we are required to record certain financial instruments, such as debt, at fair value at the acquisition date for each reporting period. We believe that adjusting for the change in fair value of our financial instruments is appropriate because such adjustments may not be reflective of on-going Operations and reflect unrealized impacts on value based only on then current Market conditions, although they may be based upon general market conditions. The need to reflect the change in fair value of our financial instruments is a Continuous process and is analyzed on a quarterly basis in accordance with CAAP. |
Shares offered through Griffin Capital Securities, Inc. (Member FINRA and SIPC) Dealer Manager for The Griffin Capital Net Lease REIT, Inc.
4000 MacArthur Blvd., West Tower; Suite 220, Newport Beach, CA 92660
© 2012 Griffin Capital Net Lease REIT, Inc. All rights reserved.
Not a deposit May lose value No bank guarantee
Not insured by the FDIC, NCUA or any other government agency
GRIFFIN CAPITAL
SECURITIES
guardians of wealth