Attached files
| file | filename |
|---|---|
| 8-K - AMERICAN REALTY INVESTORS - AMERICAN REALTY INVESTORS INC | ari8k081512.htm |

|
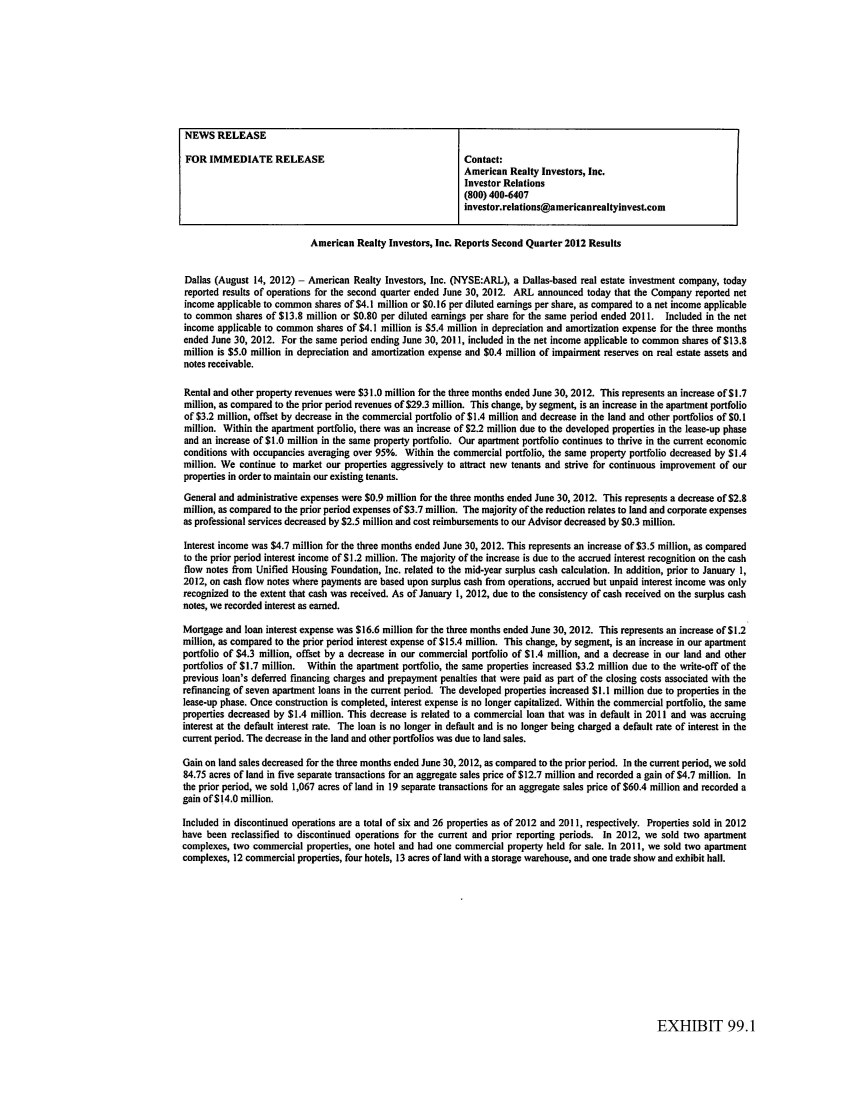
AMERICAN REALTY INVESTORS, INC.
|
||||||||||||||||
|
CONSOLIDATED STATEMENTS OF OPERATIONS
|
||||||||||||||||
|
(unaudited)
|
||||||||||||||||
|
For the Three Months Ended
|
For the Six Months Ended
|
|||||||||||||||
|
June 30,
|
June 30,
|
|||||||||||||||
|
2012
|
2011
|
2012
|
2011
|
|||||||||||||
|
(dollars in thousands, except share and per share amounts)
|
||||||||||||||||
|
Revenues:
|
||||||||||||||||
|
Rental and other property revenues (including $167 and $0 for the three months and
$335 and $0 for the six months ended 2012 and 2011 respectively from affiliates and
related parties)
|
$ | 31,016 | $ | 29,306 | $ | 60,598 | $ | 56,480 | ||||||||
|
Expenses:
|
||||||||||||||||
|
Property operating expenses (including $258 and $383 for the three months and $550
and $631 for the six months ended 2012 and 2011 respectively from affiliates and
related parties)
|
15,674 | 15,407 | 31,087 | 30,667 | ||||||||||||
|
Depreciation and amortization
|
5,393 | 4,958 | 10,821 | 10,162 | ||||||||||||
|
General and administrative (including $937 and $1,241 for the three months and
$1,817 and $2,429 for the six months ended 2012 and 2011 respectively from
affiliates and related parties)
|
935 | 3,692 | 3,507 | 6,915 | ||||||||||||
|
Provision on impairment of notes receivable and real estate assets
|
- | 444 | - | 5,622 | ||||||||||||
|
Advisory fee to affiliate
|
2,700 | 3,462 | 5,359 | 6,984 | ||||||||||||
|
Total operating expenses
|
24,702 | 27,963 | 50,774 | 60,350 | ||||||||||||
|
Operating income (loss)
|
6,314 | 1,343 | 9,824 | (3,870 | ) | |||||||||||
|
Other income (expense):
|
||||||||||||||||
|
Interest income (including $4,624 and $1,104 for the three months and $7,865 and
$1,603 for the six months ended 2012 and 2011 respectively from affiliates and
related parties)
|
4,723 | 1,203 | 8,063 | 1,871 | ||||||||||||
|
Other income (including $1,500 and $0 for the three months and $3,000 and $0
for the six months ended 2012 and 2011 respectively from affiliates and
related parties)
|
2,171 | 551 | 3,800 | 1,765 | ||||||||||||
|
Mortgage and loan interest (including $931 and $1,275 for the three months and
$1,853 and $1,580 for the six months ended 2012 and 2011 respectively from
affiliates and related parties)
|
(16,641 | ) | (15,439 | ) | (34,219 | ) | (29,897 | ) | ||||||||
|
Loss on sale of investments
|
- | - | (362 | ) | - | |||||||||||
|
Earnings from unconsolidated subsidiaries and investees
|
33 | 22 | 150 | (73 | ) | |||||||||||
|
Total other expenses
|
(9,714 | ) | (13,663 | ) | (22,568 | ) | (26,334 | ) | ||||||||
|
Loss before gain on land sales, non-controlling interest, and taxes
|
(3,400 | ) | (12,320 | ) | (12,744 | ) | (30,204 | ) | ||||||||
|
Gain on land sales
|
4,738 | 14,029 | 3,716 | 19,373 | ||||||||||||
|
Income (loss) from continuing operations before tax
|
1,338 | 1,709 | (9,028 | ) | (10,831 | ) | ||||||||||
|
Income tax benefit
|
1,537 | 1,942 | 2,548 | 2,351 | ||||||||||||
|
Net income (loss) from continuing operations
|
2,875 | 3,651 | (6,480 | ) | (8,480 | ) | ||||||||||
|
Discontinued operations:
|
||||||||||||||||
|
Loss from discontinued operations
|
(277 | ) | (2,130 | ) | (975 | ) | (5,099 | ) | ||||||||
|
Gain on sale of real estate from discontinued operations
|
4,668 | 7,679 | 8,256 | 11,816 | ||||||||||||
|
Income tax expense from discontinued operations
|
(1,537 | ) | (1,942 | ) | (2,548 | ) | (2,351 | ) | ||||||||
|
Net income from discontinued operations
|
2,854 | 3,607 | 4,733 | 4,366 | ||||||||||||
|
Net income (loss)
|
5,729 | 7,258 | (1,747 | ) | (4,114 | ) | ||||||||||
|
Net (income) loss attributable to non-controlling interest
|
(1,064 | ) | 7,175 | 112 | 9,345 | |||||||||||
|
Net income (loss) attributable to American Realty Investors, Inc.
|
4,665 | 14,433 | (1,635 | ) | 5,231 | |||||||||||
|
Preferred dividend requirement
|
(613 | ) | (613 | ) | (1,226 | ) | (1,230 | ) | ||||||||
|
Net income (loss) applicable to common shares
|
$ | 4,052 | $ | 13,820 | $ | (2,861 | ) | $ | 4,001 | |||||||
|
Earnings per share - basic
|
||||||||||||||||
|
Income (loss) from continuing operations
|
$ | 0.10 | $ | 0.89 | $ | (0.66 | ) | $ | (0.03 | ) | ||||||
|
Income from discontinued operations
|
0.25 | 0.31 | 0.41 | 0.38 | ||||||||||||
|
Net income (loss) applicable to common shares
|
$ | 0.35 | $ | 1.20 | $ | (0.25 | ) | $ | 0.35 | |||||||
|
Earnings per share - diluted
|
||||||||||||||||
|
Income (loss) from continuing operations
|
$ | 0.05 | $ | 0.59 | $ | (0.66 | ) | $ | (0.03 | ) | ||||||
|
Income from discontinued operations
|
0.11 | 0.21 | 0.41 | 0.38 | ||||||||||||
|
Net income (loss) applicable to common shares
|
$ | 0.16 | $ | 0.80 | $ | (0.25 | ) | $ | 0.35 | |||||||
|
Weighted average common share used in computing earnings per share
|
11,525,389 | 11,525,389 | 11,525,389 | 11,509,341 | ||||||||||||
|
Weighted average common share used in computing diluted earnings per share
|
25,679,951 | 17,394,553 | 11,525,389 | 11,509,341 | ||||||||||||
|
Amounts attributable to American Realty Investors, Inc.
|
||||||||||||||||
|
Income (loss) from continuing operations
|
$ | 1,811 | $ | 10,826 | $ | (6,368 | ) | $ | 865 | |||||||
|
Income from discontinued operations
|
2,854 | 3,607 | 4,733 | 4,366 | ||||||||||||
|
Net income (loss)
|
$ | 4,665 | $ | 14,433 | $ | (1,635 | ) | $ | 5,231 | |||||||
|
AMERICAN REALTY INVESTORS, INC.
|
||||||||
|
CONSOLIDATED BALANCE SHEETS
|
||||||||
|
(unaudited)
|
||||||||
|
June 30,
|
December 31,
|
|||||||
|
2012
|
2011
|
|||||||
|
(dollars in thousands, except share and
par value amounts)
|
||||||||
|
Assets
|
||||||||
|
Real estate, at cost
|
$ | 1,066,094 | $ | 1,120,122 | ||||
|
Real estate held for sale at cost, net of depreciation ($3,290 for 2012 and $1,752 for 2011)
|
2,329 | 15,015 | ||||||
|
Real estate subject to sales contracts at cost, net of depreciation ($15,042 and $9,790 in 2012 and 2011)
|
48,515 | 49,982 | ||||||
|
Less accumulated depreciation
|
(154,499 | ) | (158,489 | ) | ||||
|
Total real estate
|
962,439 | 1,026,630 | ||||||
|
Notes and interest receivable
|
||||||||
|
Performing (including $114,613 and $104,969 in 2012 and 2011 from affiliates and related parties)
|
118,710 | 110,136 | ||||||
|
Non-performing (including $0 and $0 in 2012 and 2011 from affiliates and related parties)
|
5,908 | 4,787 | ||||||
|
Less allowance for estimated losses (including $18,962 and $8,962 in 2012 and 2011 from affiliates and related parties)
|
(23,383 | ) | (13,383 | ) | ||||
|
Total notes and interest receivable
|
101,235 | 101,540 | ||||||
|
Cash and cash equivalents
|
18,090 | 20,312 | ||||||
|
Investments in unconsolidated subsidiaries and investees
|
7,437 | 10,746 | ||||||
|
Other assets (including $21 in 2012 and $11 in 2011 from affiliates and related parties)
|
71,044 | 76,243 | ||||||
|
Total assets
|
$ | 1,160,245 | $ | 1,235,471 | ||||
|
Liabilities and Shareholders’ Equity
|
||||||||
|
Liabilities:
|
||||||||
|
Notes and interest payable
|
$ | 800,162 | $ | 855,619 | ||||
|
Notes related to assets held for sale
|
3,868 | 13,830 | ||||||
|
Notes related to subject to sales contracts
|
55,503 | 44,516 | ||||||
|
Stock-secured notes payable and margin debt
|
26,133 | 26,898 | ||||||
|
Affiliate payables
|
13,816 | 10,294 | ||||||
|
Deferred gain (including $75,727 and $71,964 in 2012 and 2011 from sales to related parties)
|
77,572 | 78,750 | ||||||
|
Accounts payable and other liabilities (including $1,925 and $1,822 in 2012 and 2011 to affiliates and related parties)
|
91,921 | 110,307 | ||||||
| 1,068,975 | 1,140,214 | |||||||
|
Shareholders’ equity:
|
||||||||
|
Preferred stock, Series A: $2.00 par value, authorized 15,000,000 shares, issued and outstanding 3,353,954 shares in
2012 and 2011 (liquidation preference $10 per share), including 900,000 shares in 2012 and 2011 held by subsidiaries
|
4,908 | 4,908 | ||||||
|
Common stock, $.01 par value, authorized 100,000,000 shares; issued 11,941,174 shares and outstanding 11,525,389
shares in 2012 and 2011
|
115 | 115 | ||||||
|
Treasury stock at cost; 415,785 shares in 2012 and 2011 and 229,214 and 236,587 shares held by TCI as of 2012 and 2011.
|
(6,395 | ) | (6,395 | ) | ||||
|
Paid-in capital
|
107,092 | 105,388 | ||||||
|
Retained earnings
|
(49,121 | ) | (47,486 | ) | ||||
|
Accumulated other comprehensive income
|
(786 | ) | (786 | ) | ||||
|
Total American Realty Investors, Inc. shareholders' equity
|
55,813 | 55,744 | ||||||
|
Non-controlling interest
|
35,457 | 39,513 | ||||||
|
Total equity
|
91,270 | 95,257 | ||||||
|
Total liabilities and equity
|
$ | 1,160,245 | $ | 1,235,471 | ||||