Attached files
| file | filename |
|---|---|
| 8-K - FORM 8-K - PUBLIC SERVICE ELECTRIC & GAS CO | d396787d8k.htm |
 PSEG Public Service Enterprise Group Goldman
Sachs Power & Utility Conference New York, NY
August 14, 2012
EXHIBIT 99 |
 2
Forward-Looking Statement
• adverse changes in the demand for or price of the capacity and energy that we
sell into wholesale electricity markets, • adverse changes in energy
industry law, policies and regulation, including market structures and a potential shift away from competitive markets toward subsidized market mechanisms,
transmission planning and cost allocation rules, including rules regarding how
transmission is planned and who is permitted to build transmission in the future, and reliability standards,
• any inability of our transmission and distribution businesses to obtain
adequate and timely rate relief and regulatory approvals from federal and state regulators,
• changes in federal and state environmental regulations that could increase our
costs or limit our operations, • changes in nuclear regulation and/or
general developments in the nuclear power industry, including various impacts from any accidents or incidents experienced at our facilities
or by others in the industry, that could limit operations of our nuclear generating
units, • actions or activities at one of our nuclear units located on a
multi-unit site that might adversely affect our ability to continue to operate that unit or other units located at the same site,
• any inability to balance our energy obligations, available supply and trading
risks, • any deterioration in our credit quality, or the credit quality of
our counterparties, including in our leveraged leases, •
availability of capital and credit at commercially reasonable terms and conditions and our ability to meet cash needs,
• changes in the cost of, or interruption in the supply of, fuel and other
commodities necessary to the operation of our generating units, • delays
in receipt of necessary permits and approvals for our construction and development activities,
• delays or unforeseen cost escalations in our construction and development
activities, • any inability to achieve or continue to sustain, our
expected levels of operating performance, • increase in competition in
energy supply markets as well as competition for certain rate-based transmission projects,
• any inability to realize anticipated tax benefits or retain tax credits,
• challenges associated with recruitment and/or retention of a qualified
workforce, • adverse performance of our decommissioning and defined
benefit plan trust fund investments and changes in discount rates and funding requirements, and
• changes in technology and customer usage patterns.
Readers are cautioned that statements contained in this presentation about our future
performance, including future revenues, earnings, strategies, prospects, consequences and all other statements that
are not purely historical, are forward-looking statements for purposes of the safe
harbor provisions under The Private Securities Litigation Reform Act of 1995. When used herein, the words “anticipate”,
“intend”, “estimate”, “believe”, “expect”,
“plan”, “should”, “hypothetical”, “potential”, “forecast”, “project”, variations of such words and similar expressions are intended to identify forward-looking statements.
Although we believe that our expectations are based on reasonable assumptions, they
are subject to risks and uncertainties and we can give no assurance they will be achieved. The results or
developments projected or predicted in these statements may differ materially from
what may actually occur. Factors which could cause results or events to differ from current expectations include, but are
not limited to:
For further information, please refer to our Annual Report on Form 10-K, including
Item 1A. Risk Factors, and subsequent reports on Form 10-Q and Form 8-K filed with the Securities and Exchange
Commission. These documents address in further detail our business, industry
issues and other factors that could cause actual results to differ materially from those indicated in this presentation. In
addition, any forward-looking statements included herein represent our
estimates only as of today and should not be relied upon as representing our estimates as of any subsequent date. While we may
elect to update forward-looking statements from time to time, we specifically
disclaim any obligation to do so, even if our internal estimates change, unless otherwise required by applicable securities laws.
|
 3
GAAP Disclaimer
PSEG presents Operating Earnings in addition to its Net Income reported in
accordance
with
generally
accepted
accounting
principles
in
the
United
States (GAAP). Operating Earnings is a non-GAAP financial measure that
differs from Net Income because it excludes gains or losses associated with
Nuclear Decommissioning Trust (NDT), Mark-to-Market (MTM)
accounting, and other material one-time items. PSEG presents
Operating Earnings because management believes that it is appropriate for
investors to
consider results excluding these items in addition to the results reported in
accordance with GAAP. PSEG believes that the non-GAAP financial
measure of Operating Earnings provides a consistent and comparable
measure of performance of its businesses to help shareholders understand
performance trends. This information is not
intended to be viewed as an
alternative to GAAP information. The last page in this presentation (Page A)
includes a list of items excluded from Income from Continuing Operations to
reconcile to Operating Earnings, with a reference to that slide included on
each of the slides where the non-GAAP information appears.
|
 PSEG – The Business of
PSEG Caroline Dorsa
Executive Vice President and Chief Financial Officer |
 5
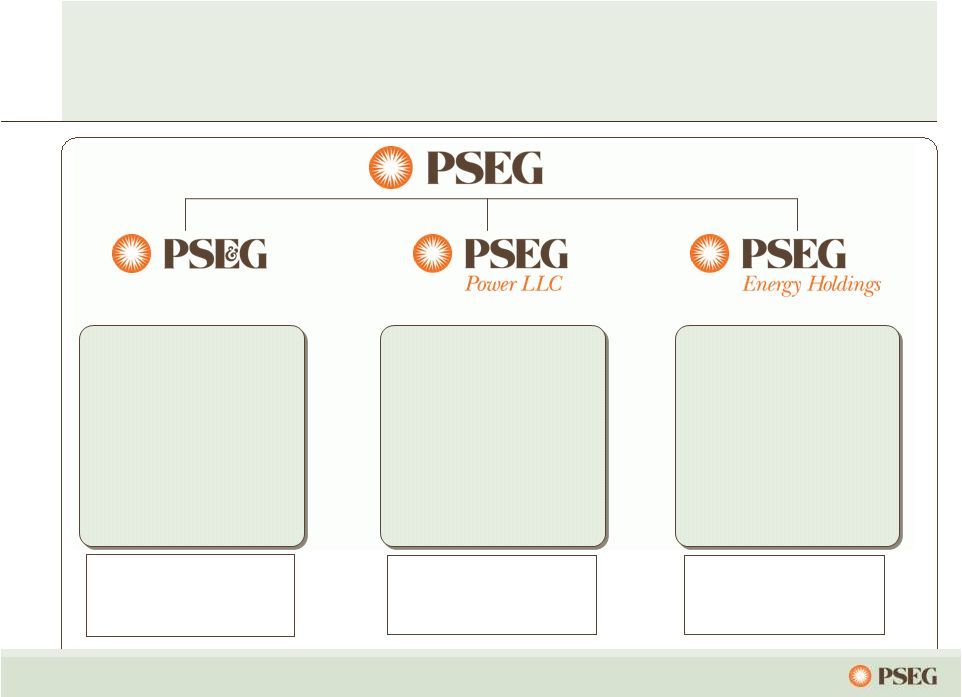
Growing an operationally excellent, integrated
generation, transmission and distribution business
PSE&G positioned
to meet NJ’s
energy policy and
economic growth
objectives
with a $5.4 billion
investment program
through 2014
PSEG Power’s
low-cost, base load
and load following fleet
is geographically well
positioned and
environmentally
responsible
PSEG Energy Holdings
positioned to pursue
attractive renewable
generation
opportunities
Assets $17.5B
Operating Earnings
$521M
Assets $11.1B
Operating Earnings
$845M
Assets $1B
Operating Earnings
$5M
Assets and operating earnings are for the year ended 12/31/2011.
* See page A for Items excluded from Income from Continuing Operations to
reconcile to Operating Earnings. Electric & Gas Delivery
and Transmission
Regional Wholesale Energy
Renewable Investments |
 6
2012 –
A year of significant accomplishment
•
NJBPU approved North
Central Grid
transmission line
•
Proposing up to $883
million solar energy
investment through
Solar 4 All and Solar
Loan programs
•
Improved to 2
place
(from
10
)
on
the
2012
J.D. Power Electric
Utility Residential
Customer Satisfaction
Study-East Region
•
Improved availability
of gas-fired CCGT
fleet and strong
nuclear performance
•
O&M under control
•
400 MW of new
peaking generation
for summer 2012
•
Continued de-risking
of legacy portfolio
•
Denver building sold
•
IRS settlement on
LILO/SILO tax
matters
•
IRS audit resolution
•
25 MW Solar project
in Arizona
th
nd |
 7
Focused program to improve operating efficiency and
direct capital investment to PSE&G reduced the impact
of lower energy prices on operating earnings
•
O&M Growth per year
•
Transmission Rate Base
•
Utility Cap Stimulus Spending
•
Utility Solar & EE Cap Exp
•
EFORd Rate
CCGT
Coal
•
Nuclear Generation
•
Holdings Solar Investment
•
2.4% (planned)
•
$866
•
$0
•
$0
•
1.6%
•
8.4%
•
29.3TWh
•
$0
•
0.4% (actual)
•
$1,600
•
$760
•
$687
•
1.1%
•
6.6%
•
30.1TWh
•
$120
2008
PSEG Focus
($ millions, except as noted)
2011
$2.91
$2.74
Operating Earnings Per Share
$69.85
$43.57
PJM West RTC ($/MWh)
*See page A for Items excluded from Income from Continuing Operations to reconcile
to Operating Earnings; All periods reflect Texas in Discontinued Operations. |
 8
Our business mix has changed with PSE&G
forecast to grow to 45% of 2012 operating earnings
Operating Earnings by Subsidiary*
*See page A for Items excluded from Income from Continuing Operations to reconcile
to Operating Earnings; All periods reflect Texas in Discontinued
Operations. E = Estimate. $3.09
$3.12
$2.74
PSE&G
Power
Other
Guidance
$2.25-$2.50
$1.13
to
$1.31
$1.05
to
$1.10
$0.07 to $0.09
$0.04
$1.67
$1.03
$2.15
$0.12
$0.85
$0.11
$2.35
$0.63 |
 9
First-Half 2012 Operating Earnings by Subsidiary
–
In Line with Expectations
Operating Earnings
Earnings per Share
$ millions (except EPS)
2011
2012
2011
2012
PSEG Power
$ 452
$ 306
$ 0.89
$ 0.60
PSE&G
268
298
0.53
0.59
PSEG Energy Holdings/Enterprise
12
43
0.02
0.09
Operating Earnings*
$ 732
$ 647
$ 1.44
$ 1.28
Six Months ended June 30
* See Page A for Items excluded from Income from Continuing Operations to
reconcile to Operating Earnings. |
 10
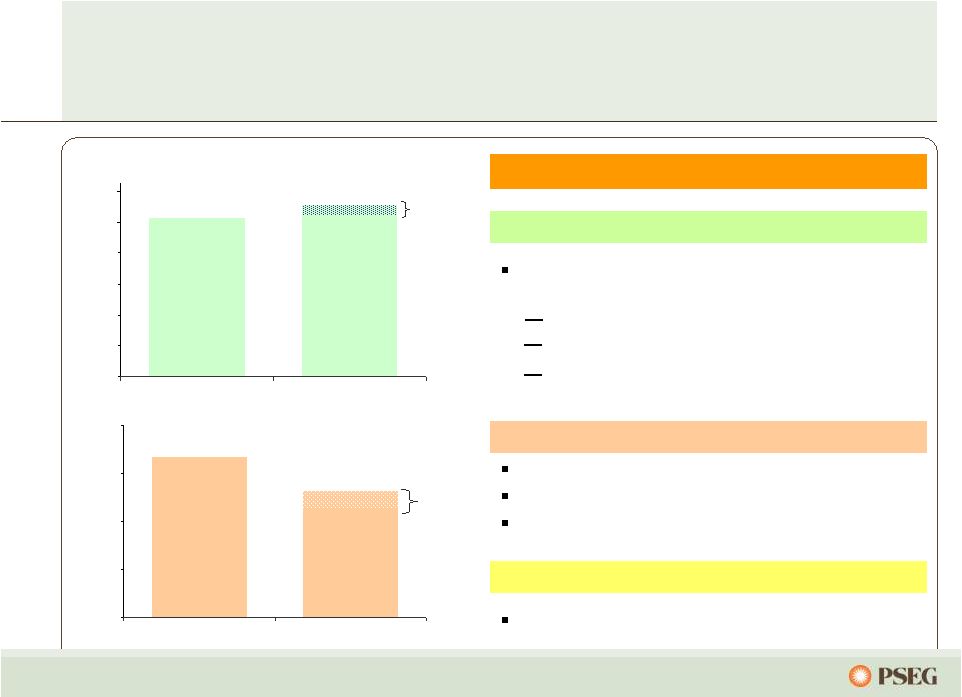
Guidance
$1.31
$1.13
PSEG’s 2012 earnings guidance of $2.25 to $2.50
reflects continued improvement at PSE&G and a
decline in margins at Power
$0.00
$0.20
$0.40
$0.60
$0.80
$1.00
$1.20
2011 Operating Earnings*
2012E Earnings Guidance*
PSE&G Earnings Per Share
2012 Assumptions
PSE&G
Growth in investments that provide
contemporaneous returns
Transmission
Distribution economic stimulus programs
Programs supporting NJ’s Energy Master
Plan
Power
Impacted by lower energy prices
Near term effects minimized by hedges in place
~400MW new Peaking capacity in-service mid
2012
Energy Holdings / Parent
Operating earnings guidance of $0.07 to $0.09
$0.00
$0.50
$1.00
$1.50
$2.00
2011 Operating Earnings*
2012E Earnings Guidance*
Power Earnings Per Share
Guidance
$1.10
$1.05
*See page A for Items excluded from Income from Continuing Operations to reconcile to Operating
Earnings; 2011 reflects Texas in Discontinued Operations. E = Estimate
|
 11
PSEG’s long-term outlook is influenced by Power’s
hedge position and increased investment at
PSE&G
2013
2014
Each $1/mcf Change in Natural Gas
Each $2/Mwh Change in Spark Spread
Each $2/Mwh Change in Dark Spread
Each 1% Change in Nuclear Capacity Factor
Each 3% Change in Depreciation Rate
Segment EPS Drivers
$0.01
$0.01
$0.01
$0.01
$0.01
$0.01
$0.01
$0.01
$0.01
$0.01
$0.12
-
$0.15
$0.04
$0.01
$0.01
$0.01
$0.01
-
$0.04
$0.04
$0.01
$0.01
$0.01
Note:
EPS
impacts
assume
normal
market
commodity
correlation
and
demand.
Each $100 Million of Incremental Investment
Each 1% Change in Sales:
Electric
Gas
Each 1% Change in O&M
Each 10 bp Change in ROE |
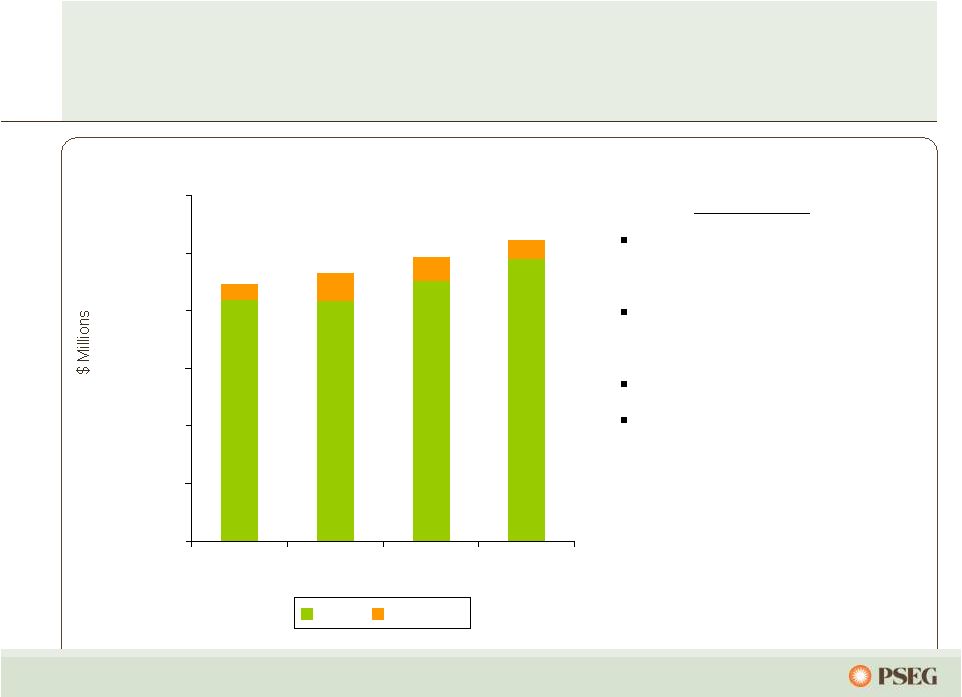 12
$1,000
$1,250
$1,500
$1,750
$2,000
$2,250
$2,500
2011
2012E
2013E
2014E
O&M
Pension
PSEG Consolidated O&M
(1)
CAGR (’11-’14) = 2.9%
(1)
Excludes O&M related to PSE&G clauses. E = Estimate.
Focus on business drivers supports overall cost
control
2012 –
2014:
Cyclical maintenance
expenses at Power
Growth in transmission &
appliance service
Headcount relatively flat
Total fringe costs declining |
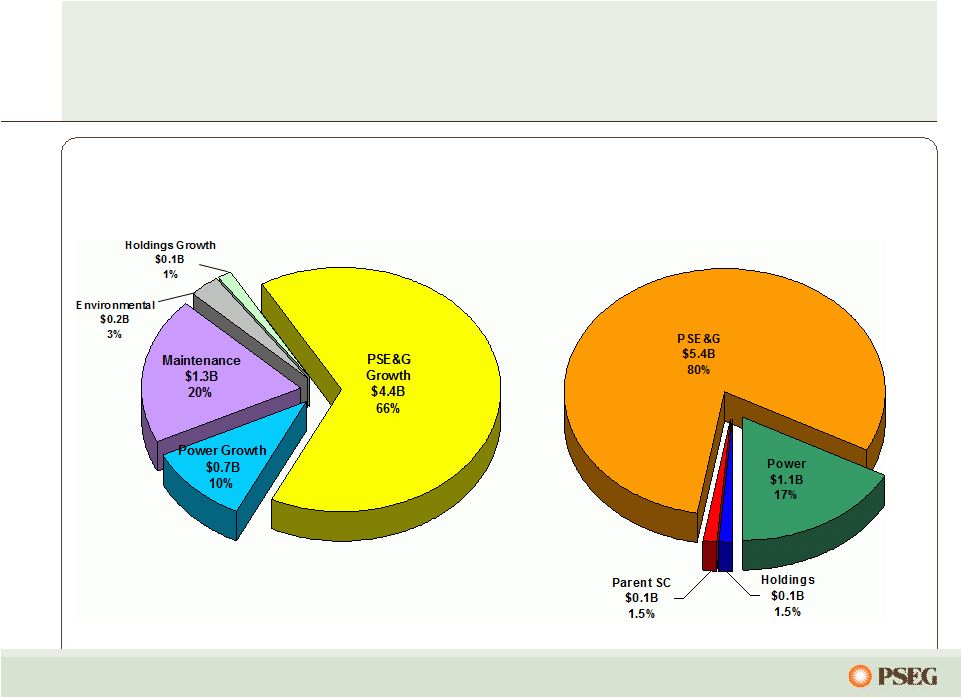 13
Investments focused on growth to meet
customer requirements
PSEG 2012-2014E Capital Spending*
$6.7 Billion
by Subsidiary
PSEG 2012-2014E Capital Spending*
$6.7 Billion
Growth / Environmental / Maintenance
E = Estimate; Capital excludes IDC and AFUDC. *This forecast does not reflect
the impact of new proposals recently filed with the NJBPU. |
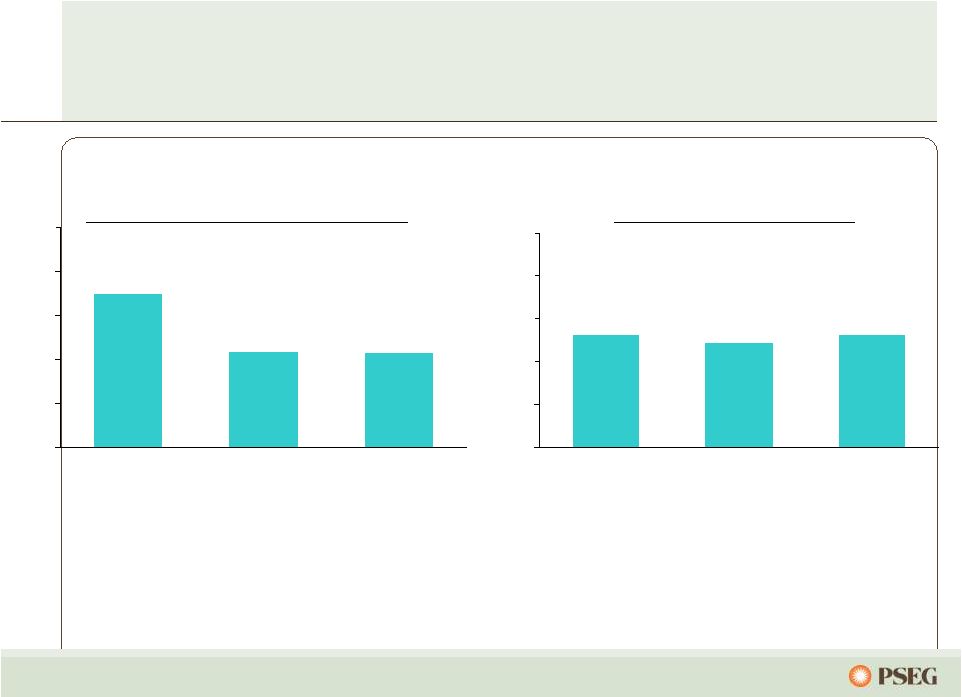 14
30%
35%
40%
45%
50%
55%
2012E
2013E
2014E
30%
35%
40%
45%
50%
55%
2012E
2013E
2014E
PSEG Power
Funds from Operations / Total Debt
PSEG
Debt as Percent of Capital
•
Credit metrics remain above our floor levels, notwithstanding near-term
power market expectations
•
Investment Capacity exceeds $700 million in all years even with large capital
expenditures at PSE&G
•
PSEG maintains its capital structure throughout the forecast period
A
solid
financial
strategy
–
balance
sheet
strength
to direct investments to the areas of greatest
growth and value potential |
 15
PSEG’s strong credit profile provides the financial flexibility
for over $1B of additional capital investment in the
regulated business
2012-2014E PSEG Sources & Uses
Sources
Uses
Power Cash
from Ops
PSE&G Cash
from Ops
(1)
Debt
Redeemed
PSE&G Capital
Investment
Power Capital
Investment
Shareholder
Dividend
Debt
Issuances
Holdings
& Other
Net Cash
Flow
Cash
(1)
PSE&G Cash from Operations adjusts for securitization principal repayments of
~$680 Million in 2012-2014. E=Estimate. B=Billion. |
 16
PSEG is working with the state to advance energy policy,
build infrastructure, and develop jobs …
helping to make
Governor Christie’s vision a reality
Photo:
PSEG
Hackensack,
NJ
Solar
Farm
Groundbreaking
–
July
31,
2012 |
 17
In addition to new reliability based transmission projects and future
dividend growth, PSEG has the potential to increase its investment in
PSE&G through several multi-year programs under review
Potential Investment ($ millions)
Per Year Potential
Gas Infrastructure
$250-$300
Energy Efficiency
$35-$40
Total Potential Investment (Per Year)
$285-$340 Million
PSE&G
filed
proposals
with
the
BPU
to
increase
its
investment
in
solar
by
up
to
$883 million through existing programs over a multi-year period of time
… Program Investment
($ millions)
Solar 4 All Extension (over 5 years)
Up to $690
Solar Loan (over 3 years)
Up to $193
Total Potential Investment
Up to $883 Million
and is evaluating the potential for increased investment in energy efficiency
and gas infrastructure … |
 18
18
18
The
business
of
PSEG:
Returning
cash
to
investors
through common dividends and preserving flexibility to
invest for future growth
PSEG Annual Dividend Rate
$1.08
$1.08
$1.10
$1.12
$1.14
$1.17
$1.29
$1.33
$1.37
$1.37
$1.42
2002
2003
2004
2005
2006
2007
2008
2009
2010
2011
2012
Payout
Ratio
111%
62%
70%
63%
66%
43%
44%
43%
44%
50%
60%*
5-year Rate of Growth 3.95%
10-year Rate of Growth 2.78%
*Based on mid-point of 2012 operating earnings guidance.
|
 19
PSEG Value Proposition
Operating
Excellence
Regulatory/
Market
Drivers
Financial
Strength
Disciplined
Investment
•
•
•
–
Environmental compliance costs and low natural gas prices to force
retirements of 11 to 25 GW of existing generation in PJM
–
Infrastructure upgrades/reliability requirements driving regulated
investment •
•
•
•
power and 13% CAGR in regulated rate base
in position to benefit from higher market prices for
PSEG
Clean, low cost Nuclear, CCGT, and Coal generating fleet
Large, reliable electric and gas distribution operations
Energy markets in midst of transformational change
finance growth opportunities
Meaningful 2012 dividend increase and revised dividend
policy
Management long-term incentive leveraged to
shareholder value creation
Strong balance sheet provides flexibility and liquidity to
|
 The
Business
of
PSE&G
Ralph LaRossa
President and Chief Operating Officer |
 21
PSE&G is the largest electric and gas distribution
and transmission utility company in New Jersey
providing renewable and energy efficiency solutions
* Weather
normalized
-
estimated
annual
growth
per
year
over
forecast
period.
** Specific projects approved for incentive rate treatment with additional
ROE. *** Energy
Efficiency
Annualized
Savings
(includes
conversion
of
gas
savings).
Electric
Gas
Customers
Growth
(2007 –
2011)
2.2 Million
0.7%
1.8 Million
0.7%
Electric Sales and Gas Sold and Transported
42,506 GWh
3,527 M Therms
Projected
Annual
Load
Growth
(2012
–
2014)
0.8%*
0.1%*
Historical
Annual
Peak
Load
Growth
Transmission
(2007
–
2011)
1.7%
Projected
Annual
Load
Growth
Transmission
(2012
–
2014)
1.4%
Sales Mix
Residential
33%
60%
Commercial
57%
36%
Industrial
10%
4%
Transmission
Electric
Gas
Approved Rate of Return
11.68% ROE**
10.3% ROE
10.3% ROE
Renewables and Energy Efficiency
2009-2011
Total Program
Plan
Solar Loan
38 MW
81 MW
Solar 4 All
59 MW
80 MW
Energy Efficiency Initiative (annualized equivalent)***
282 GWh
402 GWh |
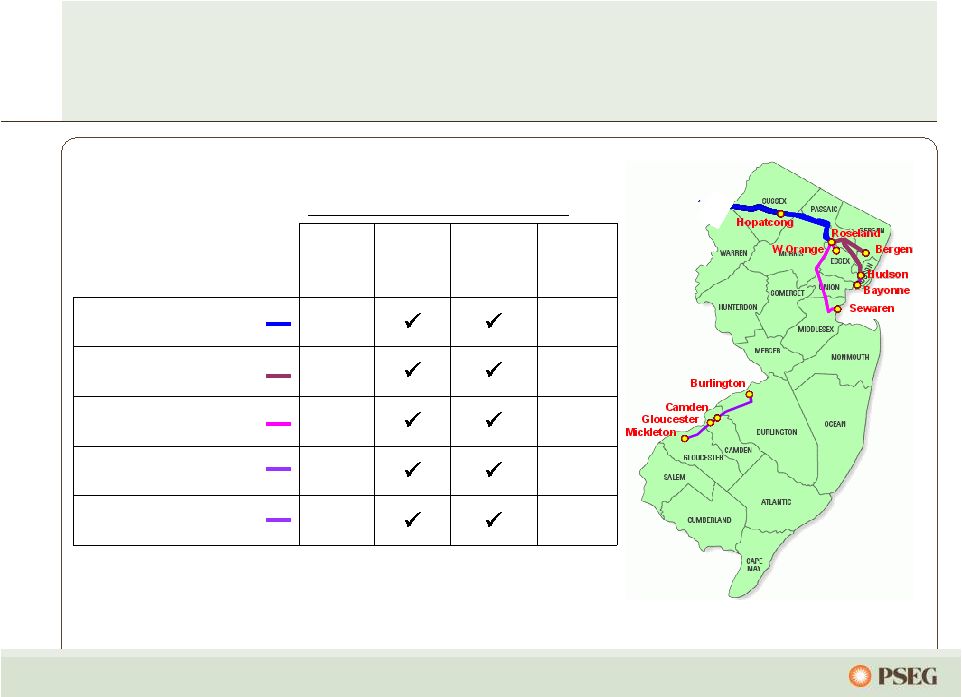 22
Approved
ROE
Inclusion of
CWIP in
Rate Base
100%
Recovery of
Costs Due to
Abandonment
Total
Estimated
Project
Costs
Susquehanna-Roseland
12.93%
$790
Northeast Grid Reliability
11.93%
$895
North Central Reliability
11.68%
$390
Burlington –
Camden 230kV
11.68%
$381
Mickleton –
Gloucester 230kV
11.68%
$435
Major
Transmission
Projects
FERC and PJM support for transmission investment has
created substantial opportunities for PSE&G to improve
reliability while earning contemporaneous returns |
 23
PSE&G is replacing aging distribution infrastructure
to improve reliability at a reasonable return
0
250
500
750
1,000
2009
2010
2011
2012E
2013E
2014E
Dist. Capital Infrastructure
Programs
Distribution New Business
Distribution Base
•
Capital Infrastructure Program II was approved in 2011 with spending through
2012
•
Recent incidents in the gas industry have led to enhanced focus on safety of
natural gas pipeline systems
•
Utility storm response in NJ is under review by the Board of Public Utilities
Capital Expenditures |
 24
PSE&G is proactively and aggressively
investing in infrastructure
Potential Investment ($ millions)
Per Year Potential
Gas Infrastructure
$250-$300
Energy Efficiency
$35-$40
Total Potential Investment (Per Year)
$285-$340 Million
PSE&G
filed
proposals
with
the
BPU
to
increase
its
investment
in
solar
by
up
to
$883 million through existing programs over a multi-year period of time
… Program Investment
($ millions)
Solar 4 All Extension (over 5 years)
Up to $690
Solar Loan (over 3 years)
Up to $193
Total Potential Investment
Up to $883 Million
and is evaluating the potential for increased investment in energy efficiency
and gas infrastructure … |
 25
as filed –
could grow to $1.5 billion over 5 years …
($ in Millions)
Investment
as of 6/30/12
Approved
Investment
Under
Existing
Programs
New
Proposals*
Total
Solar Loan
I & II
$177
$248
$193
$441
Solar 4 All
$401
$456
$690
$1,146
Total
$578
$704
$883
$1,587
+
=
*On July 31, 2012, PSE&G filed with the NJBPU to invest up to $883 million in
additional solar energy projects over the next three to five years. PSE&G investment in solar
energy – if approved |
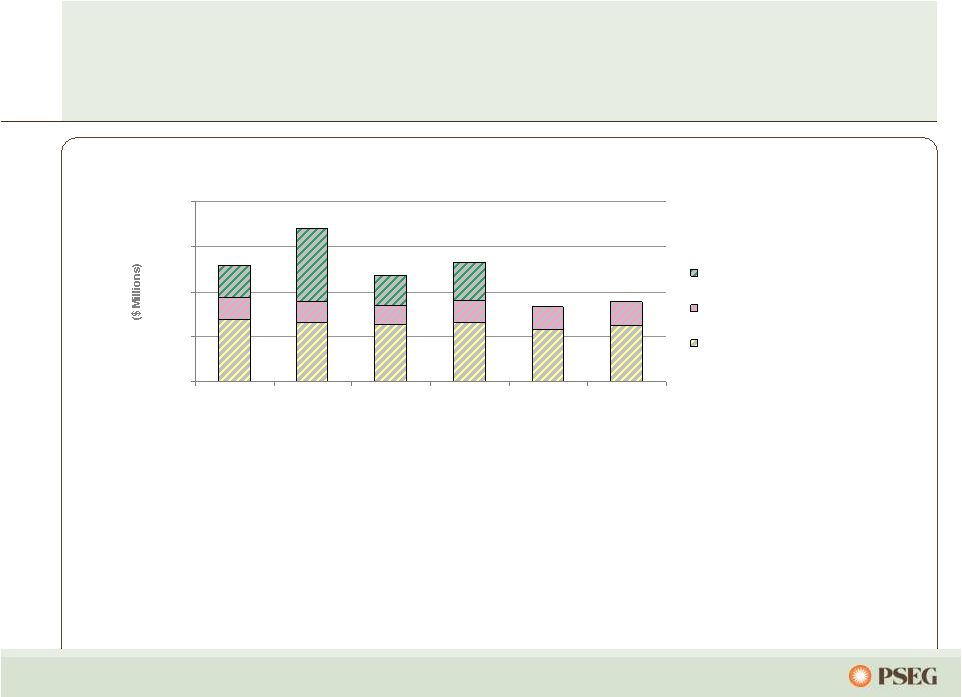
 26
Providing solutions to New Jersey’s energy and
economic development goals
0
100
200
300
400
2009
2010
2011
2012E
2013E
2014E
Energy Efficiency
Renewables
($ Millions)
Approval Date
Total
Amount
Spending
Thru 2011
Remaining
Spending
Renewables
Solar Loan I & II
April 2008/
November 2009
$248
$127
$121
Solar 4 All
July 2009
456
361
95
Energy Efficiency
Carbon Abatement
December 2008
46
40
6
Energy Efficiency Economic Stimulus
July 2009
166
144
22
Demand Response
July 2009
45
15
30
Energy Efficiency Economic Stimulus
Extension
July 2011
95
-
95
Total
$1,056
$687
$369
Capital Expenditures*
*This forecast does not reflect the impact of new proposals recently filed with
the NJBPU. |
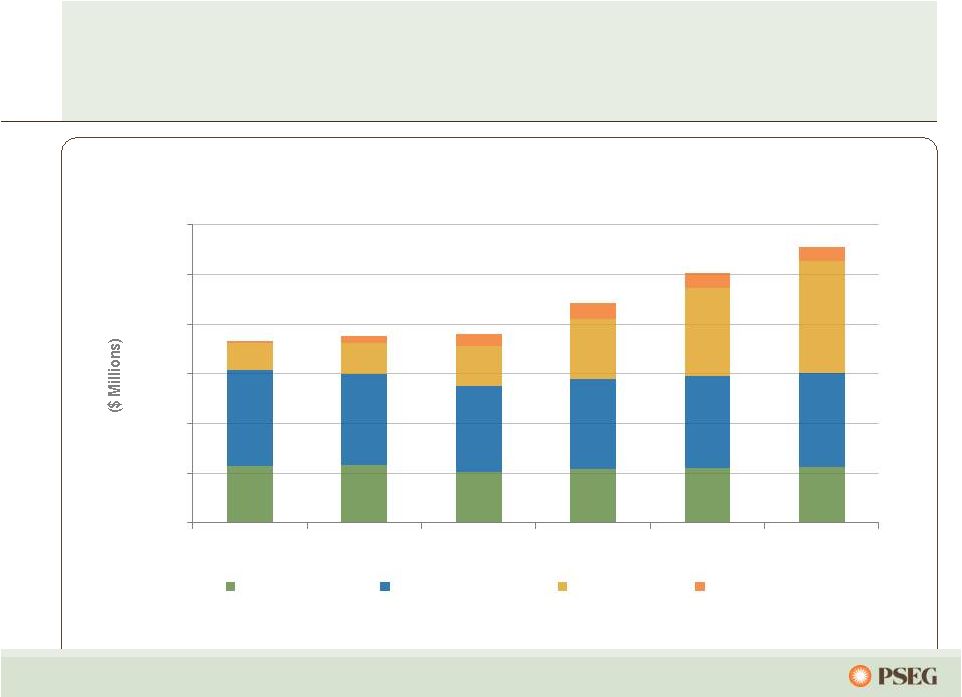 27
PSE&G’s investment program provides opportunity
for ~13% annualized growth in rate base from
2011*
PSE&G Projected Rate Base
*Starting from 2011 year-end Rate Base of $7.6 billion. This forecast
does not reflect the impact of new proposals recently filed with the NJBPU.
0
2,000
4,000
6,000
8,000
10,000
12,000
2009
2010
2011
2012
2013
2014
Gas Distribution
Electric Distribution
Transmission
Solar/Energy Efficiency |
 The
Business
of
PSEG
Power |
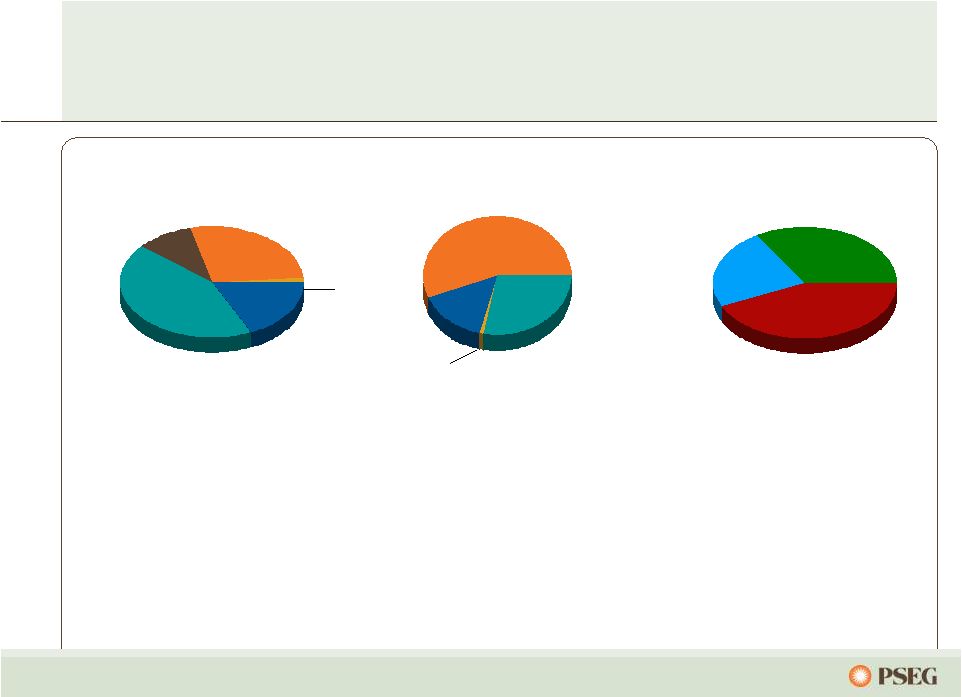 29
Asset diversity enables fleet optimization in
response to changing market dynamics
18%
44%
8%
Fuel Diversity
Coal
Gas
Oil
Nuclear
Pumped
Storage
1%
Energy Produced*
Total GWh: 53,980
56%
15%
Pumped Storage
& Oil <1%
Nuclear
Coal
Gas
Total MW: 13,060
28%
9%
* 2011
•
Well suited to serve load shaped
products
•
Market knowledge and experience to
maximize the value of our assets
•
Multiple emission controls installed
Intermediate
Energy Market Served
Total MW: 13,060
28%
23%
34%
43%
Baseload
Peaking
•
Low-cost portfolio
•
Fuel flexibility
•
Regional focus in competitive, liquid markets
•
Assets favorably located near customers/load
centers |
 30
$0
$1
$2
$3
$4
$5
$6
PPL
RECO
METED
PECO
JCPL
PEPCO
AECO
DPL
PSEG
BGE
$40
$42
$44
$46
$48
$50
WESTERN
HUB
PPL
RECO
METED
PECO
JCPL
PEPCO
AECO
DPL
PSEG
BGE
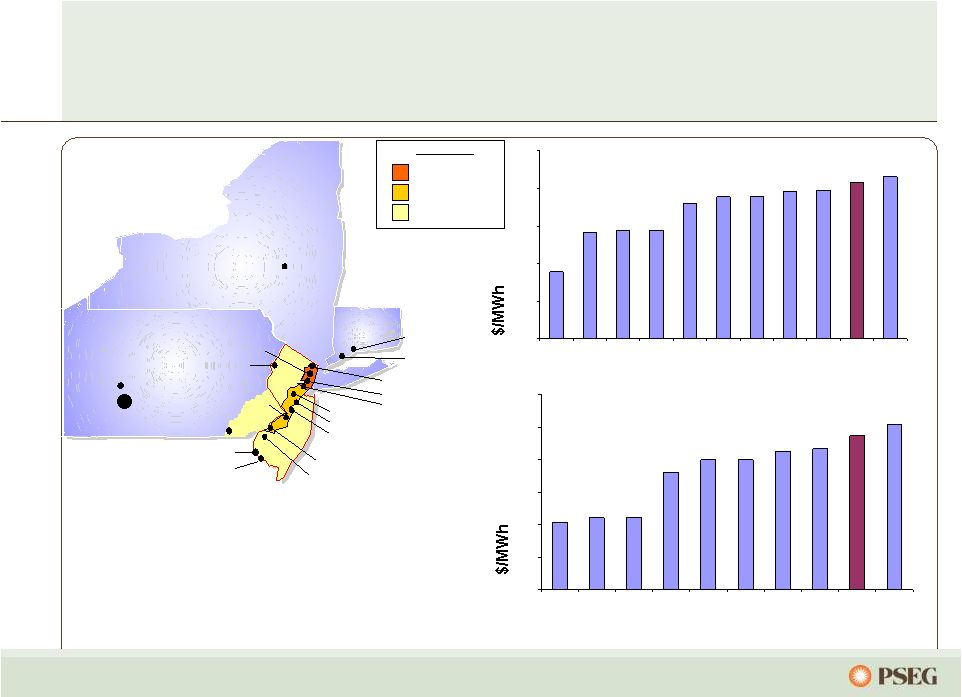
A well positioned fleet
Note: Reflects prices of original PJM load zones.
•
PSEG Power 2011 basis ~$5/MWhr RTC
•
While 5 year average has declined, volatile
periods help to maintain pricing
•
Premium pricing also seen in capacity
markets
2011 RTC LMPs
2011 Basis to PJM West RTC
Current plant locations
New Haven
Bridgeport
Bethlehem Energy Center
(Albany)
Conemaugh
Keystone
Peach Bottom
Bergen
Kearny
Essex
Sewaren
Edison
Linden
Mercer
Burlington
National Park
Hudson
Hope Creek
Salem
Yards Creek
PSEG North
PSEG Zone
Eastern MAAC
RPM Zones |
 31
Conclusion of major environmental spend places
Power in good position to meet CSAPR and MATS
Current Regulations and Compliance Measures
Description
Hudson
(NJ)
Mercer
(NJ)
Keystone
(PA)
`Bridgeport
(CT)
Conemaugh
(PA)
Status
NO
x
SCR
SCR
SCR
Low No
x
Burners
SCR
2014
Power is well
positioned for
CSAPR & MATS
SO
2
Scrubber
Scrubber
Scrubber
Ultra-low
Sulfur Coal
Scrubber
Mercury/
Particulate
Baghouse &
Activated
Carbon
Baghouse
& Activated
Carbon
Scrubber &
SCR, ESP
Baghouse &
Activated
Carbon
Scrubber &
SCR, ESP
Capital Spend Planned
No Additional Capital Spend Planned |
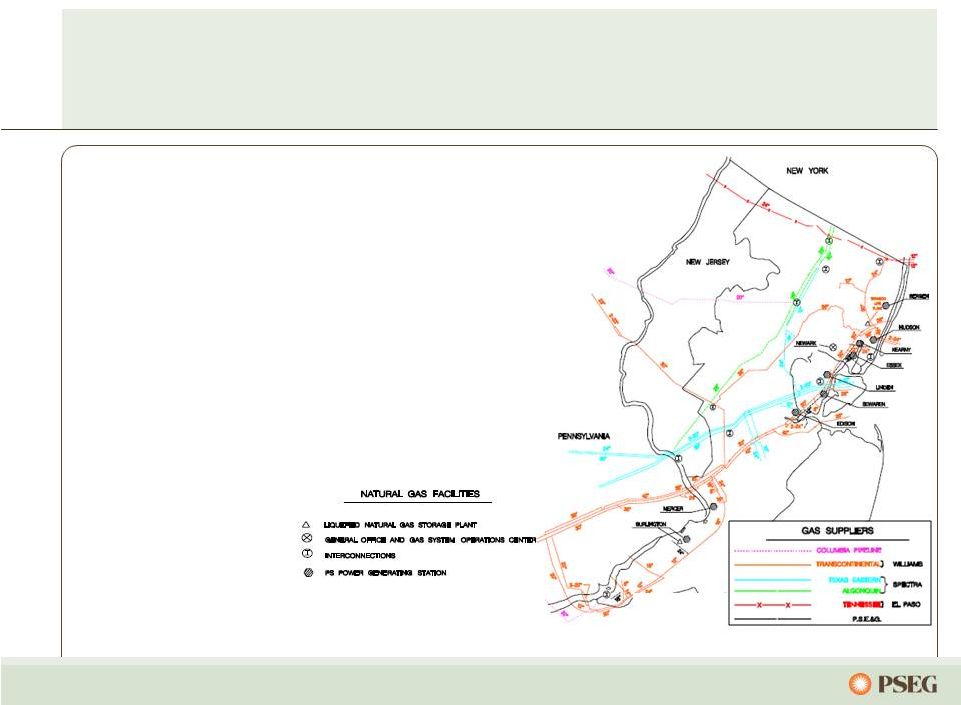 32
An active gas management strategy providing
economic value to customers and our fleet
•
Large portfolio of gas transportation & storage assets
•
Manage gas supply needs of PSE&G and PSEG Power
•
Responsible for over 400 bcf of gas supply in 2011
•
126 bcf consumed by Power’s gas fired assets in 2011;
NJ units used 11% of total PJM gas
•
Well positioned to access Marcellus supplies; nearly
40% of pipeline capacity is adjacent to the region
•
Residential rates decreased eight times since January,
2009; total savings $614, or 35% |
 33
33
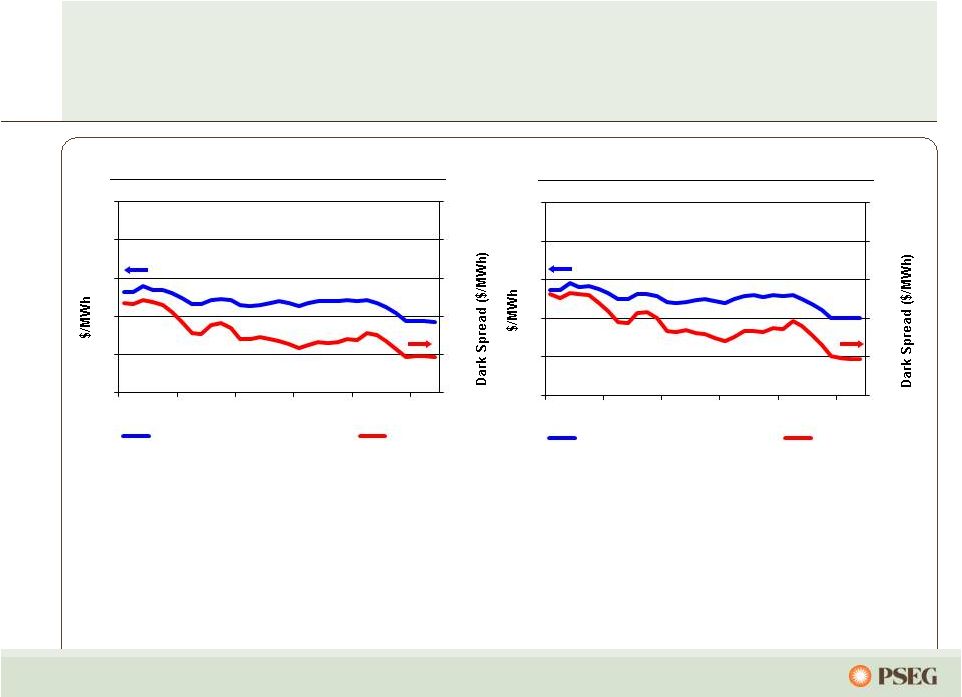
Actively managing our fleet in a volatile commodity
market, with an asset profile that provides diverse
opportunities for value creation
•
Steep natural gas decline has had a major impact on US power prices and Dark
Spreads •
Coal prices have been supported by long-term contracting and international
demand •
Decline in Dark Spread has led to reduced coal-fired generation in the last 15
months •
Power’s investments in dual-fuel capability at Hudson and Mercer coal
units have made them more attractive than many other coal units in this
environment, and we have switched to gas generation as economics
dictate 2014 Forward Prices & Dark Spread*
2013 Forward Prices & Dark Spread*
* As of April 27, 2012.
-
10
20
30
40
50
0
20
40
60
80
100
Aug-09
Feb-10
Aug-10
Feb-11
Aug-11
Feb-12
Western Hub RTC Forward 2013
Dark Spread
-
10
20
30
40
50
0
20
40
60
80
100
Aug-09
Feb-10
Aug-10
Feb-11
Aug-11
Feb-12
Western Hub RTC Forward 2014
Dark Spread |
 34
34
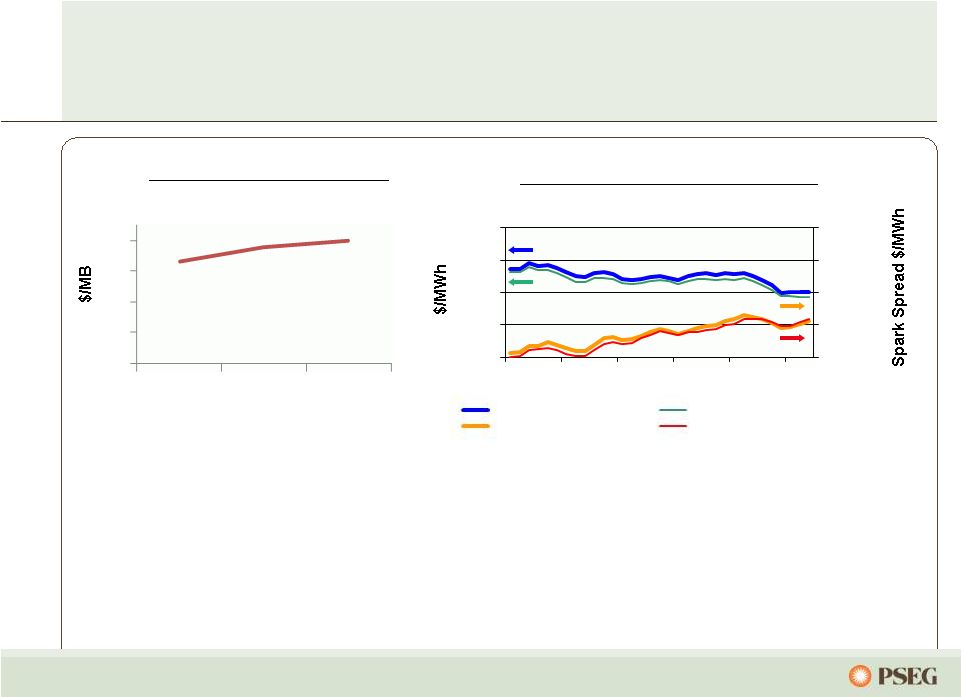
•
Low power prices are not a good environment for any merchant generator, although
Power is more of a hybrid with long-term contracting through BGS sales
as well as forward hedging •
Forward markets signal continued strength in Spark Spreads and Heat Rates
•
Strong spark spreads in the Northeast have benefitted our gas-fired
fleet •
Power is well positioned with hedged nuclear output and efficient combined cycle
margin contribution
Henry Hub Gas Forwards*
2013 and 2014 RTC
Forward Prices & Spark Spread*
Managing our fleet to capitalize on volatility
* As of April 27, 2012.
0
1
2
3
4
2013
2014
2015
-
10
20
30
40
0
20
40
60
80
Aug
-09
Feb-10
Aug
-10
Feb-11
Aug
-11
Feb-12
Western Hub RTC Forward 2014
Western Hub RTC Forward 2013
2014 Spark Spread
2013 Spark Spread |
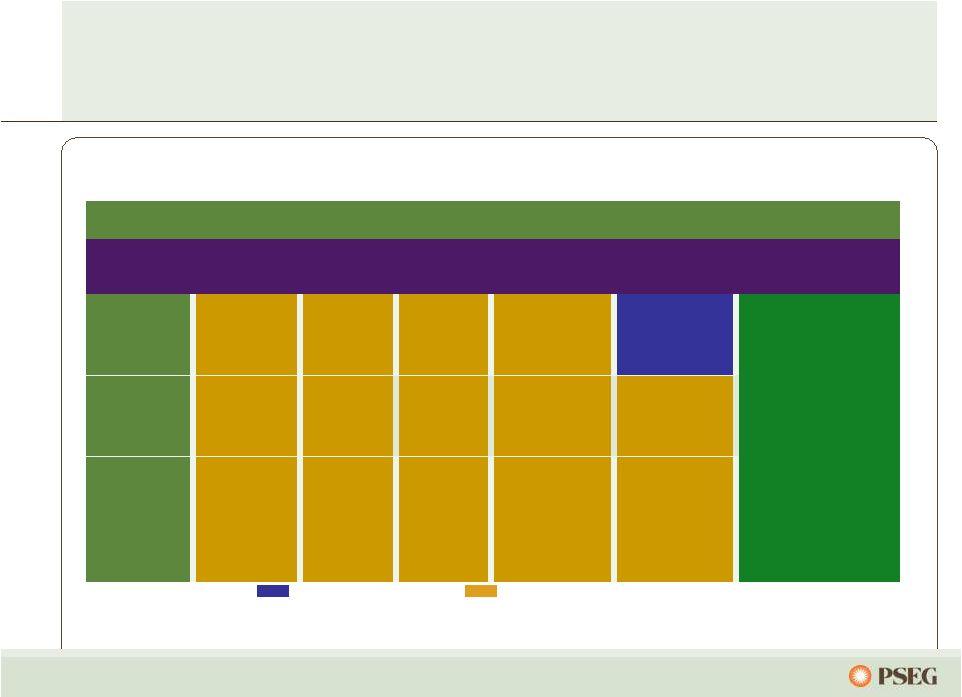
 35
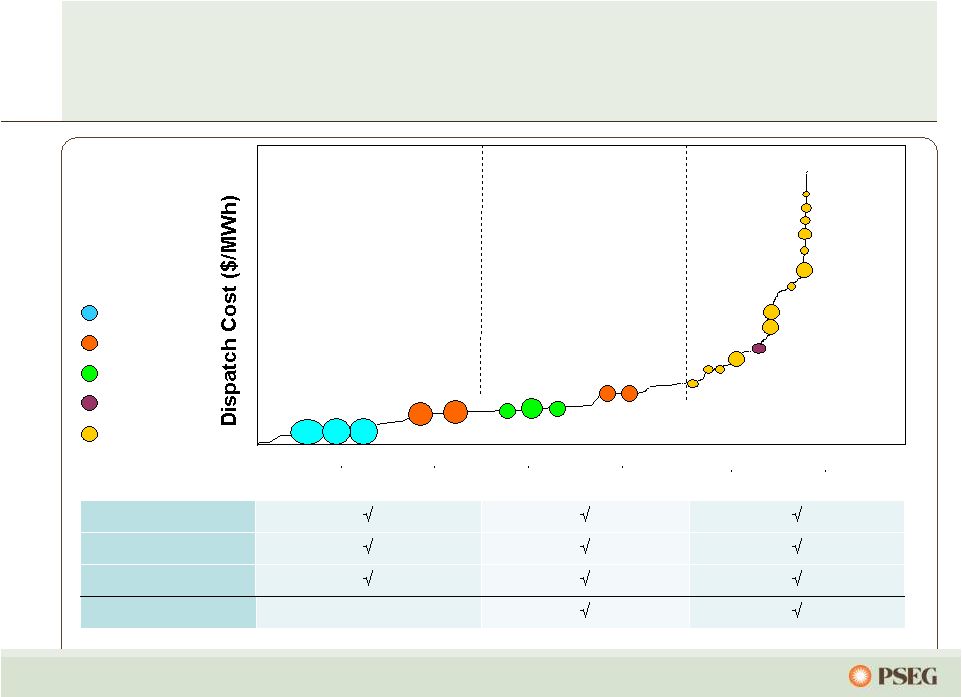
PJM assets are well positioned along the dispatch curve
and maintain fuel optionality while also reducing the risk of
serving full requirements contracts
Energy Revenue
Capacity Revenue
Ancillary Revenue
Dual Fuel
Peaking units*
Load following units
Nuclear
Coal
Combined Cycle
Steam
Peaking
Baseload units
Illustrative
Salem
Hope
Creek
Keystone
Conemaugh
Hudson 2
Linden 1,2
Burlington 8-9-11
Edison 1-2-3
Essex 10-11-12
Bergen 1
Sewaren 1-4
Mercer 1, 2
Bergen 2
Sewaren 6
Mercer 3
Kearny 10-11
Linden 5-8 / Essex 9
Burlington 12 / Kearny 12
Peach
Bottom
Yards
Creek
National Park
Salem 3
Bergen 3
* Some units have been announced for future retirements. |
 36
2008
2009
2010
2011
Dark Spread
Spark Spread
PSEG Zone LMP's
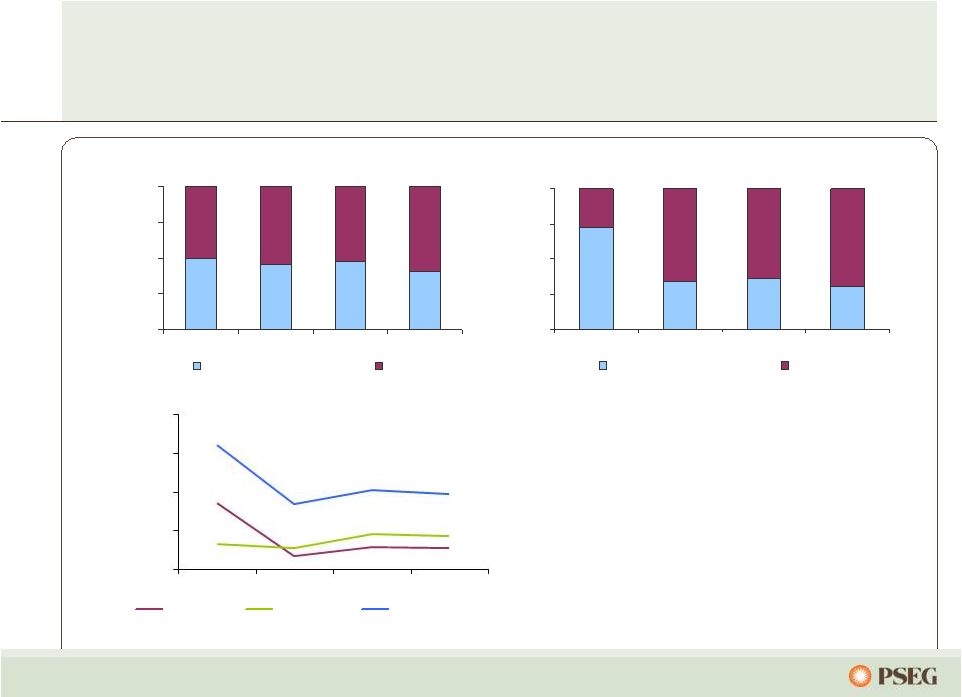
Maximizing the dispatch of our coal and gas fleet to
maintain unit margins
$/MWh
•
Market prices have declined since 2008
•
Although dark spreads have declined, spark
spreads have increased
•
Since 2008 there has been active coal/gas
switching in our fleet
•
Coal generation and margin percentage
have been replaced by our combined cycle
output
50%
45%
47%
41%
50%
55%
53%
59%
0%
25%
50%
75%
100%
2008
2009
2010
2011
Coal
Gas
72%
34%
36%
30%
28%
66%
64%
70%
0%
25%
50%
75%
100%
2008
2009
2010
2011
Coal
Gas
% PSEG’s PJM Coal/Gas Generation
% PSEG’s PJM Coal/Gas Energy Margin
$0
$25
$50
$75
$100 |
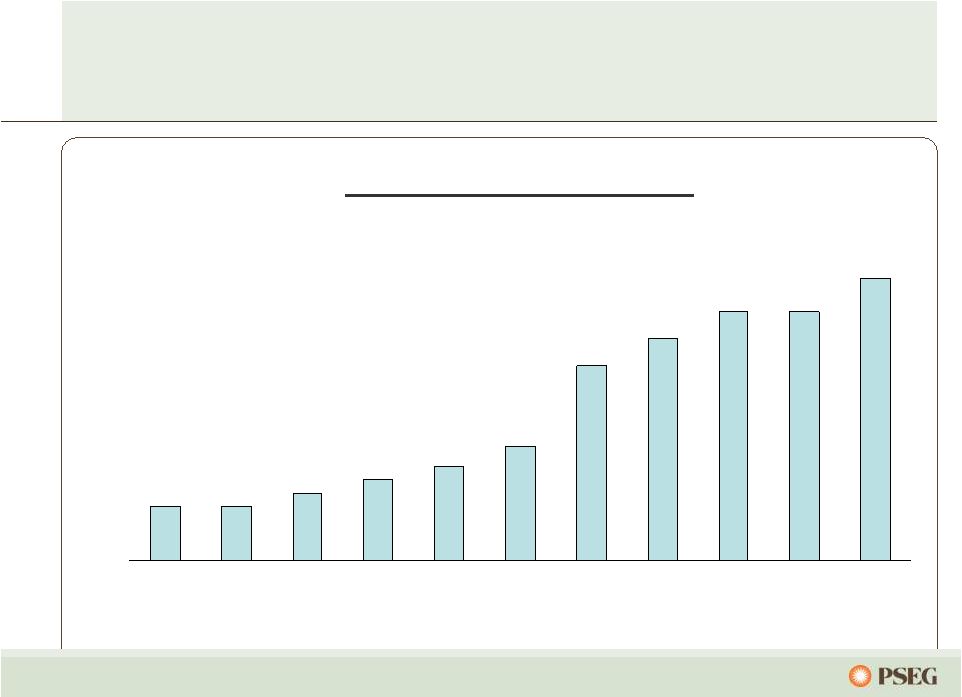
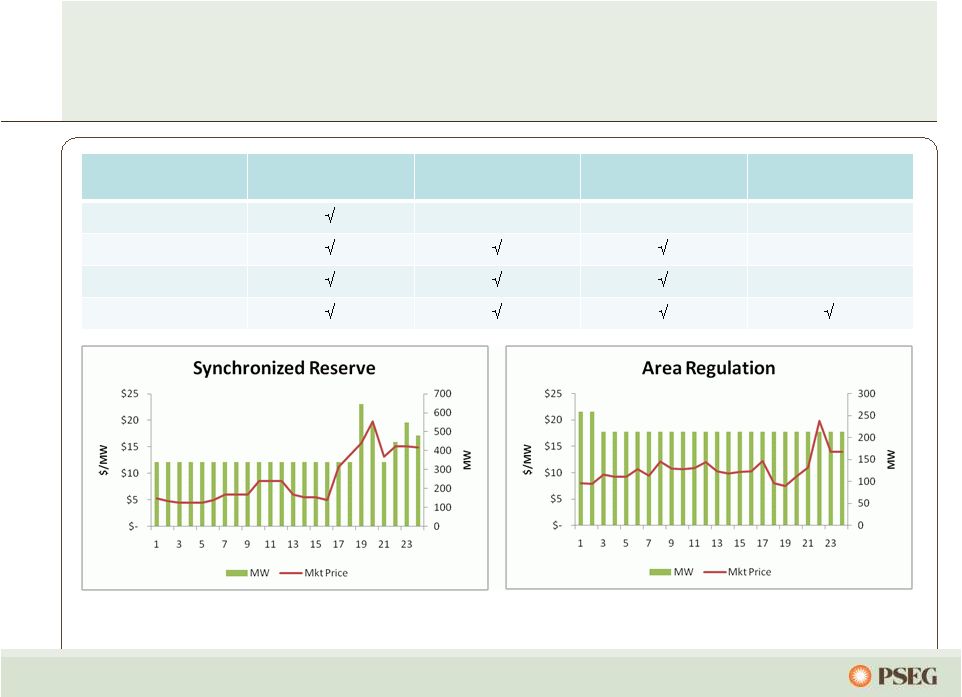 37
Managing our ancillary revenue stream, which contributes
$100M in annual margin for Power, with potential to expand
services as dependence on intermittent resources grows
Reactive
Regulation
Sync/Non-sync
Reserves
Black Start
Nuclear
Coal
Combined Cycle
CT |
 38
Note: PJM totals do not include ATSI and DEOK regions; announced retirement
totals inclusive of retirements from 1/1/2010. The EPA is in the process of
implementing Clean Air Act rules which will impact supply
Region
Total Capacity
(GW)
Total Coal Capacity
(GW)
Unscrubbed
Capacity
(GW)
Announced Coal
Retirements
(GW)
Announced Coal
Retirements
(as % of total)
PJM
180
79
30
14
8%
NY ISO
37
2.6
0.6
0.8
2%
ISO-NE
32
2.8
2.1
0.4
1%
U.S. Total
1,036
320
129
43
4%
Cross State Air Pollution Rule (CSAPR)
•
Final rule issued July 2011, having effective date January 2012
•
Rule
would
institute
new,
more
stringent
trading
program
for
NO
x
and
SO
2
emissions
•
US DC Circuit Court ruled to stay implementation on 12/30/11 pending judicial
review •
Final decision expected in 2012
Mercury and Air Toxics Standards (MATS)
•
Final rule released December 2011
•
Will require coal and oil-fired units to meet strict emissions limits, or
retire •
Effective early 2015; provides case-by-case extensions where needed to
comply Source: MJB&A Tracking, Ventyx Velocity, EPA NEEDS v4.10,
PJM, NYISO, ISO-NE. As of 4/27/2012. |
 39
PSEG Power’s Position
Criteria Pollutants
(CSAPR)
•
Well positioned on NO
X
and SO
2
, net of anticipated allowances
Mercury & Air Toxics
(MATS)
•
Generally well positioned on Hg, particulate matter, and HCl
•
Comprehensive coal controls (SCR planned at Conemaugh)
High Electric Demand
Days (HEDD)
•
Compliance strategy under review (retirements or investments)
Coal Combustion
Byproducts
•
Power uses dry ash systems
•
Coal ash and scrubber waste tested as non-hazardous
316(b) Cooling Water
Regulations
•
Power shares general industry exposure on capital expenditure
•
Ongoing, positive industry dialogue with EPA
•
Power has over $150M in estuary enhancement program at Salem
Market uplift expected as a result of environmental rules (due to retirements,
derates, higher VO&M costs or higher emission allowances prices)
Estimated energy impact of CSAPR and MATS: $2-$5/MWh, not fully reflected in
current forward prices Retirements (MATS and HEDD) will provide strong support
to capacity markets Power is generally well positioned to meet the anticipated
requirements: Positioned to benefit from environmental leadership
|
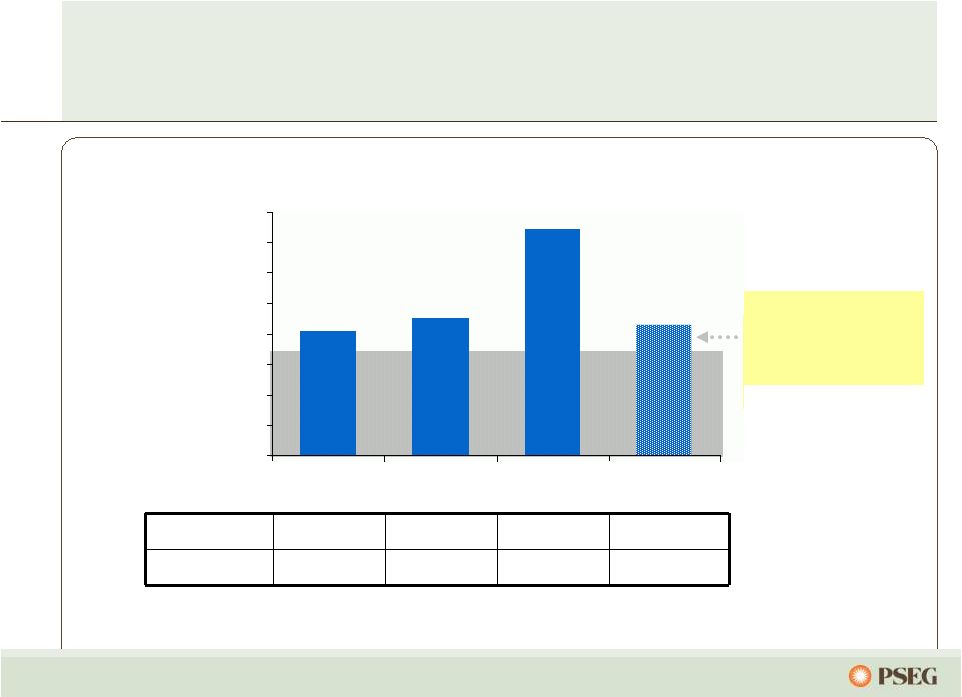
 40
$/MW-day
2011 / 2012
2012 / 2013
2013 / 2014
2014 / 2015
2015 / 2016
Power’s
Average Prices
$110
$153
$244
$162
$167
Rest of Pool Prices
$110
$16
$28
$126
$136
PSEG Power Cleared Approximately 9,000 MW
•
No New PSEG Power Generation Cleared the Auction
•
Preserving Optionality of HEDD Sites
2015/2016 RPM Auction Influenced By:
•
Updated
Demand
Curve
•
Updated
Transfer
Capabilities
•
Environmental
Retirements
•
New Build •
Below MOPR Bids
The Reliability Pricing Model has recognized the
locational value of Power’s generating fleet with
sites in the eastern part of PJM
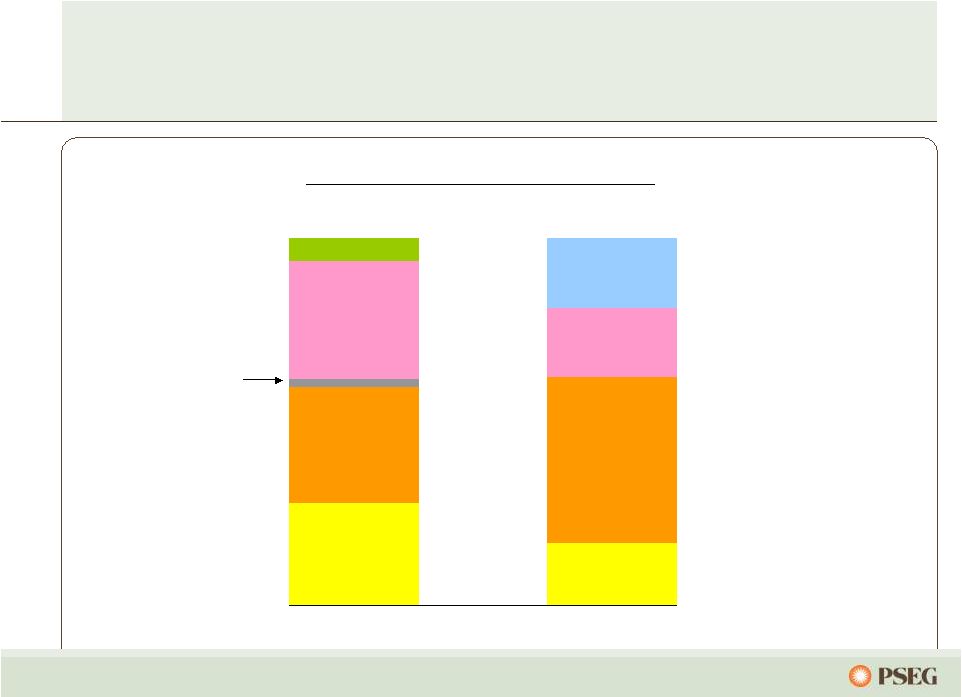
PJM Cleared Approximately 4,900 MW of New Generation |
 41
Full Requirements Component
Capacity Markets/RPM
Growing Renewable Energy Requirements
Component for Market Risk
Favorably hedging our generation at customer/load
centers through Power’s participation in each of the
BGS auctions
Market Perspective –
BGS Auction Results
3 Year Average
Round the Clock
PJM West Forward
Energy Price
Capacity
Load shape
Transmission
Congestion
Ancillary services
Risk premium
Green
Note: BGS prices reflect PSE&G Zone.
2005
2006
2007
2008
2009
2010
2011
2012
$44 -
$46
$67 -
$70
$58 -
$60
$68 -
$71
$56 -
$58
$48 -
$50
$65.41
~ $21
$102.51
~ $32
$98.88
~ $41
$111.50
~ $43
$103.72
~ $47
$95.77
~ $47
$45 -
$47
~ $48
$94.30
~ $46
$37 -
$38
$83.88 |
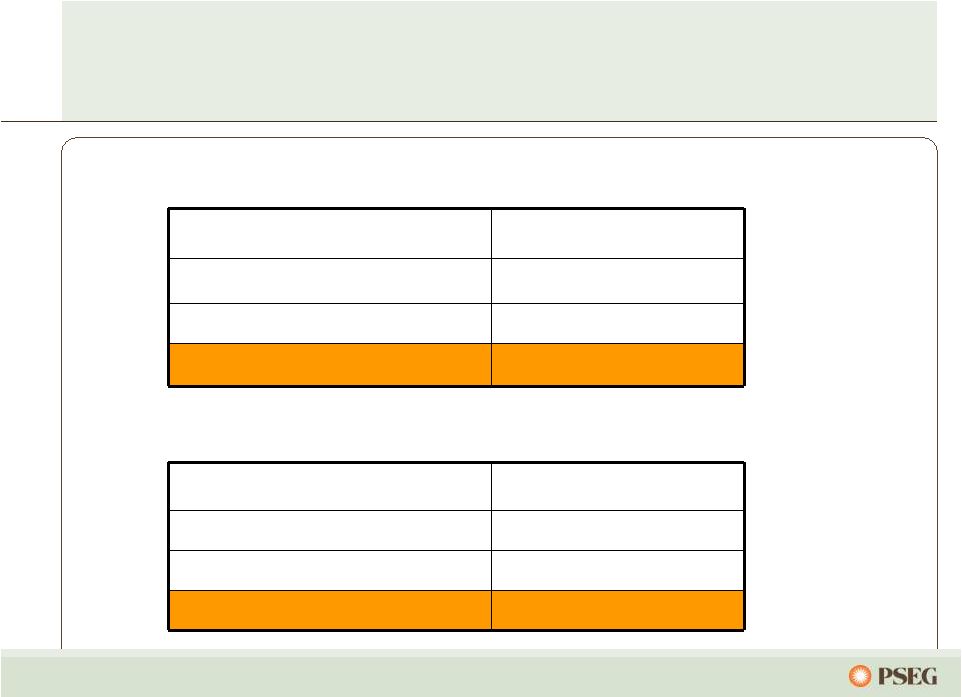
 42
Contracting longer term hedges and other products
provides medium term financial stability
Contracted Energy*
Volume TWh
17
35
35
Base Load
% Hedged
100%
85-90%
45-50%
(Nuclear and Base Load Coal)
Price $/MWh
$58
$54
$54
Volume TWh
10
18
19
Intermediate Coal, Combined
% Hedged
30-35%
0%
0%
Cycle, Peaking
Price $/MWh
$58
$54
$54
Volume TWh
28-30
52-54
53-55
Total
% Hedged
70-75%
55-60%
25-30%
Price $/MWh
$58
$54
$54
Jul -Dec
2012
2014
2013
*
Hedge percentages and prices as of June 30, 2012. Revenues of full requirement load deals based
on contract price, including renewable energy credits, ancillary, and transmission components but excluding capacity. Hedges include positions with
MTM accounting treatment and options.
|
 The
Business
of
PSEG
Holdings |
 44
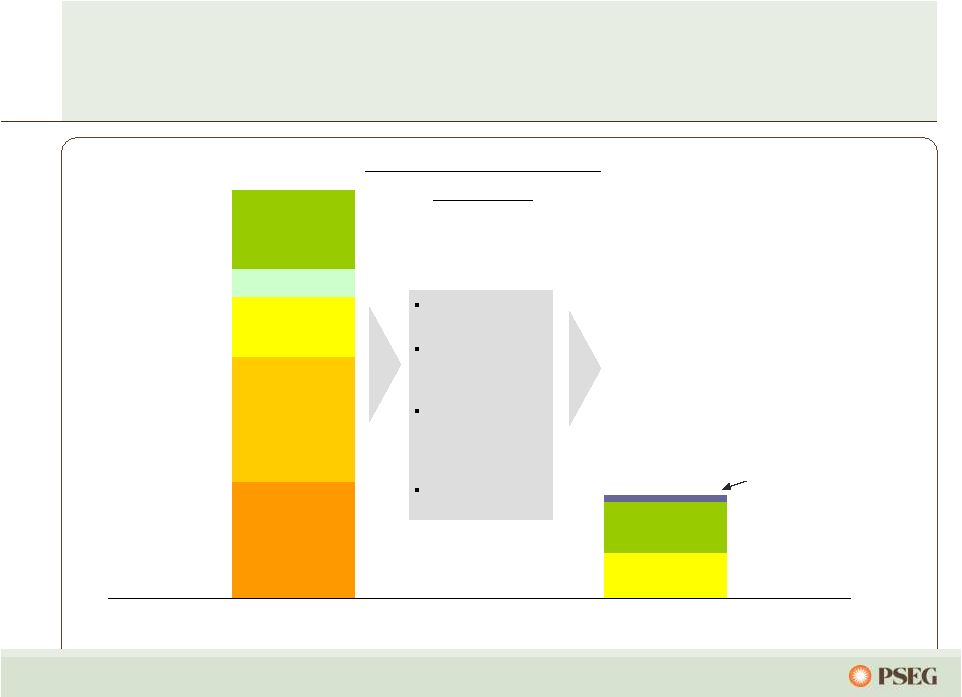
Holdings has significantly reduced its portfolio and
will continue to monetize legacy assets
Solar
Investments
Regulated
Energy
Leases &
Other
Merchant
Energy
Leases
LILO/SILO
Leases
International
Investments
Holdings Investment
Portfolio
$4.9B
$1.2B
Merchant
Energy Leases
Regulated
Energy Leases
& Other
Texas
Texas Transfer &
Sale ~$600M
LILO/SILO Lease
Terminations
~$1.2B
International &
Other Global
Asset Sales
~$2.1B
Dynegy Lease
Reserve ~$0.2B
2006
2011
Transactions
reflect
market
values
for
asset
dispositions
or,
in
the
case
of
Dynegy,
Note:
2006
and
2011
data
reflect
book
values
of
assets.
book value reserve taken in 2011. |
 45
LIPA, a New York State agency, owns T&D and generation assets (formerly LILCO)
–
1.1 million electric customers
–
Public / private business model:
•
T&D owned by LIPA
•
Privately operated
–
Sound T&D operations, but ongoing rate concerns, challenged storm restoration
efforts, low customer satisfaction ratings
December
2011
–
PSEG
and
partner
Lockheed
Martin
selected
to
manage
T&D
system
–
10-year LIPA Management Services agreement approved by New York State Office of
the Comptroller, NYS Attorney General and IRS
–
Transition period: 2012
–
2013
–
Contract operating period:
2014
-
2023
–
Economic terms:
•
Fixed fee escalating at regional CPI
•
Up to 15% incentive fee for certain performance metrics
The
business
of
PSEG:
Finding
opportunities
to
extend and profit from our operational excellence |
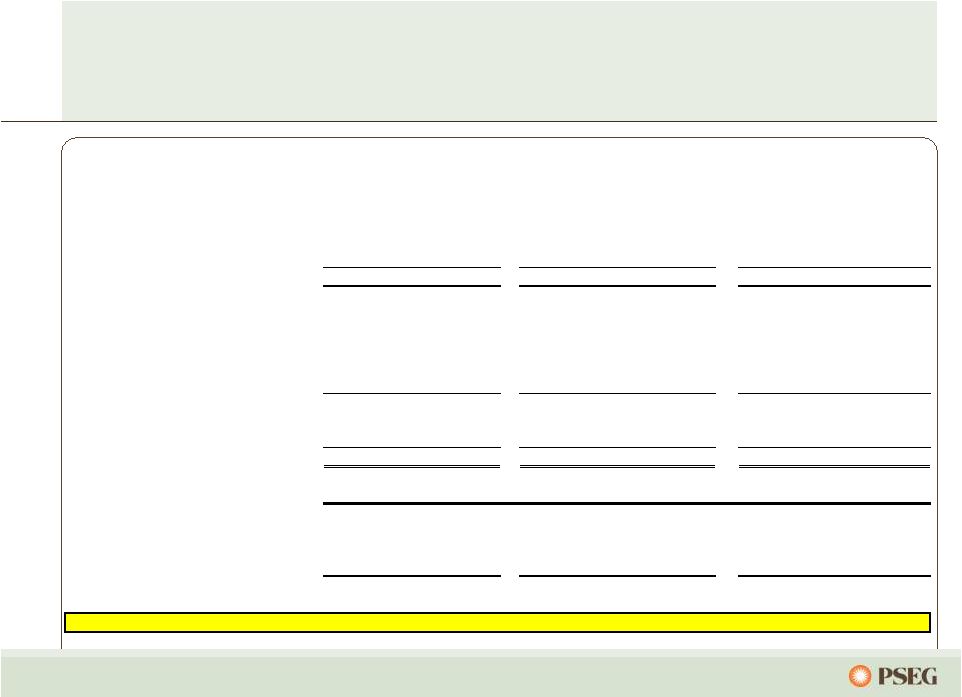
 46
PSEG Resources Leveraged Lease Portfolio
Lessee
Equipment
6/30/12
Invested
(millions)
S&P
Credit
Rating*
REMA (GenOn)
Keystone, Conemaugh & Shawville (PA)
3 coal fired plants (1,162
equity MW)
$ 335
B-
Dynegy Holdings
Danskammer & Roseton Generating Station (NY)
370 MW coal fired and 1,200 MW oil/gas fired
-
-
Edison Mission
Energy (EME)
Powerton & Joliet Generating Stations (IL)
2 coal-fired generating facilities (1,640 equity MW)
218
CCC
Merrill Creek –
(PECO, MetEd,
Delmarva P&L)
Reservoir in NJ
131
BBB,
BBB-,
BBB+
Grand Gulf
Nuclear station in Mississippi (154 equity MW)
66
A+
Renaissance Ctr.
Office towers located in Detroit, MI leased to GM
41
BB+
Wal-Mart
Portfolio of 6 Wal-Mart stores
12
AA
E-D Centers
Portfolio of 8 shopping centers
23
NR
Total Leases
$ 826
*Indicative recent rating as of 8/9/2012 reflecting either Lessee, additional
equity collateral support or parent company unsecured debt rating.
|
 Appendix |
 48
PSEG 2012 Operating Earnings Guidance
-
By Subsidiary
$ millions (except EPS)
2012E
2011
PSEG Power
$575 –
$665
$ 845
PSE&G
$530 –
$560
$ 521
PSEG Energy Holdings/Parent
$35 –
$45
$ 23
Operating Earnings*
$1,140 –
$1,270
$ 1,389
Earnings per Share
$ 2.25 –
$ 2.50
$2.74
* See page A for Items excluded from Income from Continuing Operations to reconcile
to Operating Earnings. |
 49
PSEG Q2 2012 –
Cash Update and Financing
Activities
Cash position at June 30 was in excess of $750 million
PSEG’s debt as a percent of capital was 41% as of June 30
Power’s debt as a percent of capital was 34% as of June 30
Moody’s upgraded PSE&G’s secured debt rating to A1 with a Stable
outlook and affirmed ratings of PSEG and Power (Baa1) with Stable
outlooks
Fitch upgraded PSE&G’s secured debt rating to A+ with a Stable
outlook and affirmed ratings of PSEG and Power (BBB+) with Stable
outlooks |
 50
Power and Parent available liquidity totaled
approximately $4.2 billion at June 30, 2012
Company
Facility
Date
Facility
Usage
Liquidity
($Millions)
PSE&G
5-year Credit Facility
Apr-16
$600
$16
$584
5-Year Credit Facility (Power)
Mar-17
$1,600
$121
$1,479
5-Year Credit Facility (Power)
Apr-16
$1,000
$0
$1,000
5-Year Bilateral - Credit Suisse (Power)
Sep-15
$100
$100
$0
5-year Credit Facility (PSEG)
Mar-17
$500
$12
$488
5-year Credit Facility (PSEG)
Apr-16
$500
$0
$500
Total
$4,300
$249
$4,051
$704
PSE&G ST Investment
$0
Total Liquidity Available
$4,755
Total Parent / Power Liquidity
$4,171
PSEG /
Power
PSEG Money Pool ST Investment |
 51
PSEG Consolidated Debt / Capitalization
(1)
Long-Term Debt includes Debt due within one year; excludes Securitization Debt
and Non-Recourse Debt. (2)
Power includes Texas Non-recourse Debt
December 31, 2010
December 31, 2011
June 30, 2012
PSE&G Short-term Debt
PSEG Money Pool Short-term Debt
Total Short-term Debt
Long-term Debt (1)
Power(2)
PSE&G
Holdings
Parent/Services
Total Long-term Debt
Total Common Stockholders' Equity
9,633
10,270
10,644
TOTAL CAPITALIZATION
$17,445
$17,330
$18,086
December 31, 2010
December 31, 2011
June 30, 2012
Debt
$7,812
9,633
$7,060
10,270
$7,442
10,644
Total Common Stockholders' Equity
Debt Plus Equity
$17,445
$17,330
$18,086
Debt Ratio
44.8%
40.7%
41.1%
PSEG Consolidated ($ Millions)
0
64
64
3,455
4,283
0
10
7,748
$0
0
0
16
0
16
2,751
4,270
0
39
7,060
2,686
4,696
0
44
7,426
$
$ |
 52
PSEG Consolidated Debt / Capitalization
(1)
Includes debt due within one year and short-term debt; excludes Securitization
Debt and Non-Recourse Debt. Debt
7,812
7,060
7,442
Common Shareholders Equity
9,633
10,270
10,644
Debt plus Equity
17,445
17,330
18,086
Debt Ratio
44.8%
40.7%
41.1%
(in $Millions)
6/30/2012
12/31/2010
12/31/2011
$0
$2
$4
$6
$8
$10
$12
$14
$16
$18
Debt (1)
Equity |
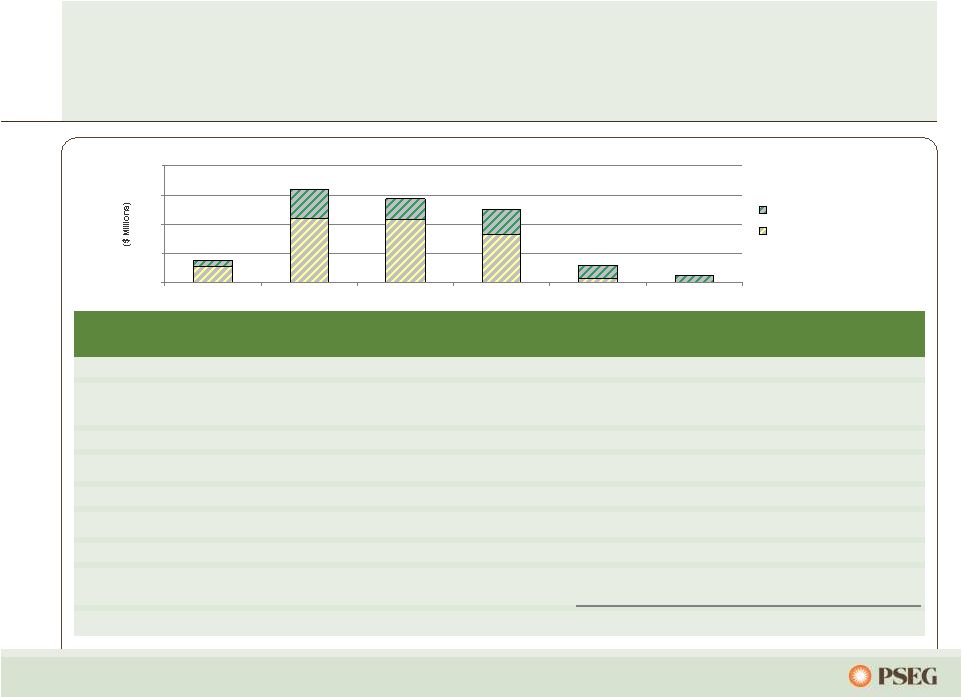
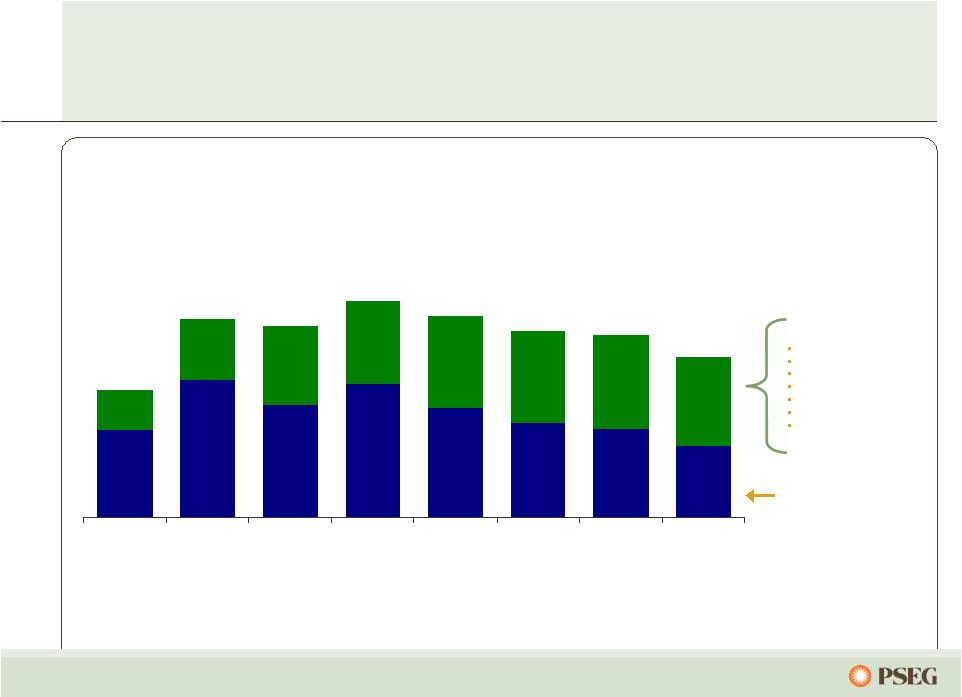
 53
PSEG Power
Funds from Operations / Total Debt
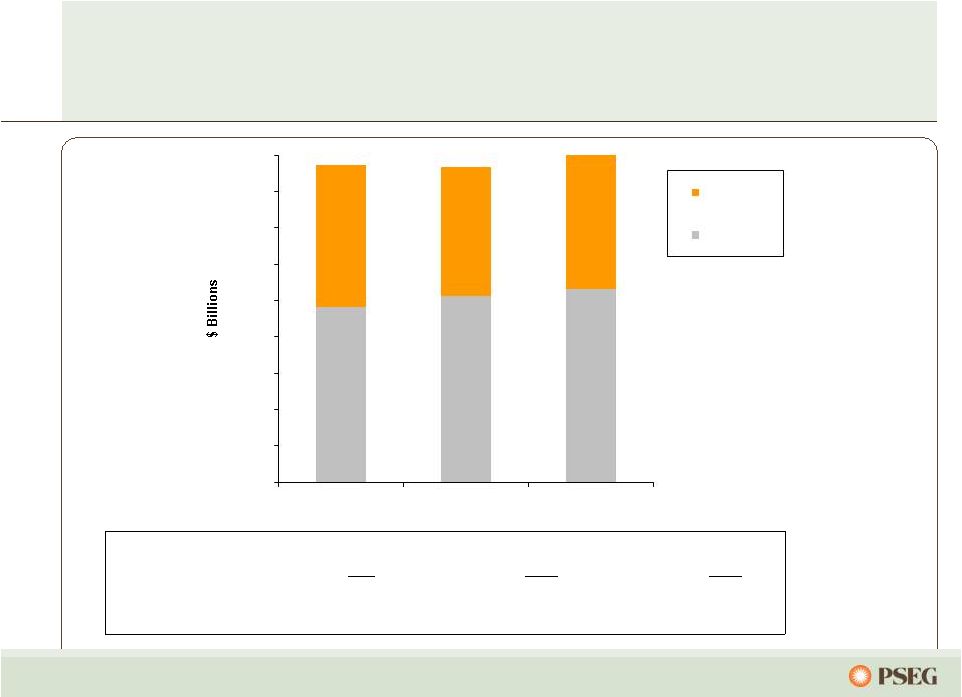
Our focus on building a strong balance sheet
places us in an advantageous position to capitalize
on selected new opportunities
Power’s free cash flow
produces solid credit
measures despite low
natural gas prices
Free Cash Flow
(1)
~950
~750
~1,725
Average: ~415
Dividends to Parent
850
(2)
549
500
Average: ~525
(in $Millions)
(1)
Free Cash Flow represents cash from operations less cash used for Capital
investment; E = Estimate. (2)
Excludes dividend to Parent associated with transfer of Texas assets to PSEG
Power. 80%
70%
60%
50%
40%
30%
20%
10%
0%
2009
2010
2011
2012-2014E
Average |
 54
Tax Update
Definitive agreement reached with the IRS that settles the tax
treatment for challenged lease transactions (LILO/SILO) for all
tax years
Settlement reached with the IRS for all federal audit issues for
tax years 1997-2006
Expected net refund of ~$170M |
 55
Operated by PSEG Nuclear
PSEG Ownership: 100%
Technology: Boiling Water Reactor
Total Capacity: 1,173 MW
Owned Capacity: 1,173 MW
License Expiration: 2046
License renewal approved
July 2011
Next Refueling
Fall 2013
Operated by PSEG Nuclear
PSEG Ownership: 57%,
Exelon –
43%
Technology: Pressurized Water Reactor
Total Capacity: 2,326 MW
Owned Capacity: 1,336 MW
License Expiration: 2036 and 2040
License renewal approved
June 2011
Next Refueling
Unit 1 --
Spring 2013
Unit 2 --
Fall 2012
Operated by Exelon
PSEG Ownership: 50%
Technology: Boiling Water Reactor
Total Capacity: 2,247 MW
Owned Capacity: 1,123 MW
License Expiration: 2033 and 2034
Next Refueling
Unit 2 –
Fall 2012
Unit 3 –
Fall 2013
Hope Creek
Salem Units 1 and 2
Peach Bottom Units 2 and 3
Our five unit nuclear fleet is a critical element of
Power’s success |
 56
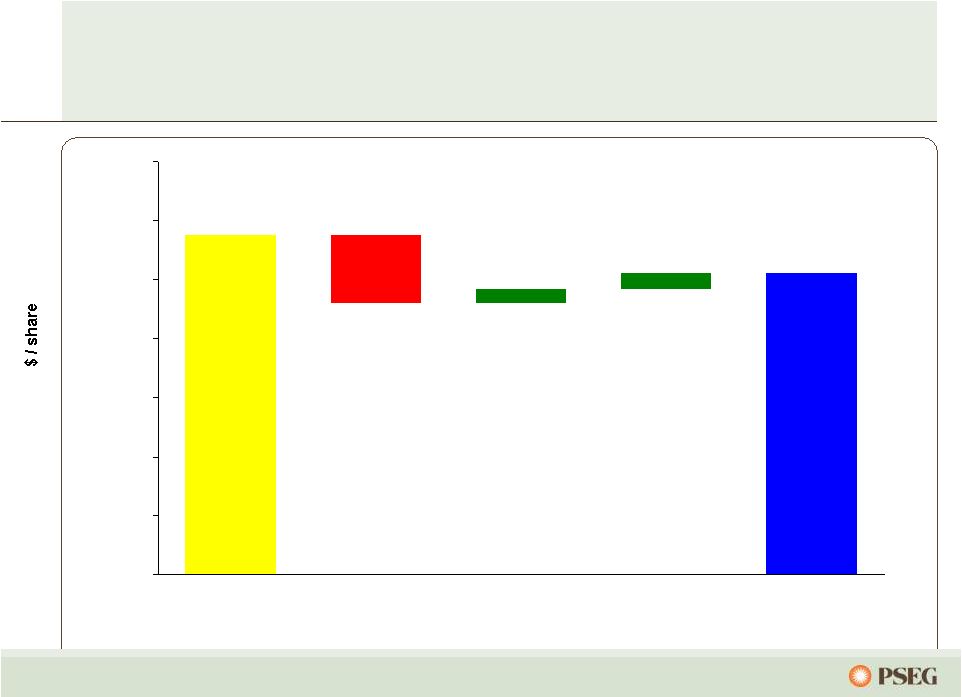
$1.28
.07
.06
(.29)
$1.44
0.00
0.25
0.50
0.75
1.00
1.25
1.50
1.75
YTD 2012
Operating
Earnings*
YTD 2011
Operating
Earnings*
PSEG Power
PSE&G
PSEG Energy
Holdings/
Enterprise
PSEG EPS Reconciliation –
YTD 2012 versus
YTD 2011
Lower Pricing (.16)
Lower Volume (.03)
Lower Capacity (.11)
Financing Costs .03
O&M .02
Weather (.01)
Other (.03)
Transmission .05
Renewables
and Other
Investments .01
O&M (.04)
Weather and
Demand (.02)
D&A (.02)
Taxes .07
Other .01
Tax settlement
* See Page A for Items excluded from Income from Continuing Operations to reconcile
to Operating Earnings. |
 57
Items Excluded from Income from Continuing
Operations to Reconcile to Operating Earnings
Please see Page 3 for an explanation of PSEG’s use of Operating Earnings as a
non-GAAP financial measure and how it differs from Net Income. Public
Service Enterprise Group Reconciling Items Excluded from Continuing Operations
to Compute Operating Earnings (Unaudited)
Pro-forma Adjustments, net of tax
2012
2011
2011
2010
2009
2008
Earnings Impact ($ Millions)
Gain (Loss) on Nuclear Decommissioning Trust (NDT)
Fund Related Activity (PSEG Power)
9
$
42
$
50
$
46
$
9
$
(71)
$
Gain
(Loss)
on
Mark-to-Market
(MTM)
(a)
(PSEG Power)
42
8
107
(1)
(11)
14
Lease Related Activity (PSEG Energy Holdings)
6
-
(173)
-
29
(490)
Market Transition Charge Refund (PSE&G)
-
-
-
(72)
-
-
Gain (Loss) on Asset Sales and Impairments (Energy Holdings)
-
-
34
-
-
(13)
Total Pro-forma adjustments
57
$
50
$
18
$
(27)
$
27
$
(560)
$
Fully Diluted Average Shares Outstanding (in Millions)
507
507
507
507
507
508
Per Share Impact (Diluted)
Gain (Loss) on NDT Fund Related Activity (PSEG Power)
0.02
$
0.08
$
0.10
$
0.09
$
0.02
$
(0.14)
$
Gain
(Loss)
on
MTM
(a)
(PSEG Power)
0.08
0.02
0.21
-
(0.02)
0.03
Lease Related Activity (PSEG Energy Holdings)
0.01
-
(0.34)
-
0.05
(0.96)
Market Transition Charge Refund (PSE&G)
-
-
-
(0.14)
-
-
Gain (Loss) on Asset Sales and Impairments (Energy Holdings)
-
-
0.06
-
-
(0.03)
Total Pro-forma adjustments
0.11
$
0.10
$
0.03
$
(0.05)
$
0.05
$
(1.10)
$
(a) Includes the financial impact from positions with forward delivery
months. Years Ended
December 31,
Six Months Ended
June 30, |