Attached files
| file | filename |
|---|---|
| 8-K - 8-K - Laredo Petroleum, Inc. | a12-18270_18k.htm |
Exhibit 99.1
|
|
EnerCom’s The Oil & Gas Conference August 14, 2012 NYSE: LPI www.laredopetro.com |
|
|
[LOGO] |
|
|
This presentation (which includes oral statements made in connection with this presentation) contains forward-looking statements within the meaning of Section 27A of the Securities Act of 1933 and Section 21E of the Securities Exchange Act of 1934. All statements, other than statements of historical fact, included in this presentation that address activities, events or developments that Laredo Petroleum Holdings, Inc. (the “Company”, “Laredo” or “LPI”) assumes, plans, expects, believes or anticipates will or may occur in the future are forward-looking statements. The words “believe,” “expect,” “may,” “estimates,” “will,” “anticipate,” “plan,” “intend,” “foresee,” “should,” “would,” “could,” or other similar expressions are intended to identify forward-looking statements, which are generally not historical in nature. However, the absence of these words does not mean that the statements are not forward-looking. Without limiting the generality of the foregoing, forward-looking statements contained in this presentation specifically include the expectations of plans, strategies, objectives and anticipated financial and operating results of the Company, including as to the Company’s drilling program, production, hedging activities, capital expenditure levels and other guidance included in this presentation. These statements are based on certain assumptions made by the Company based on management’s expectations and perception of historical trends, current conditions, anticipated future developments and other factors believed to be appropriate. Such statements are subject to a number of assumptions, risks and uncertainties, many of which are beyond the control of the Company, which may cause actual results to differ materially from those implied or expressed by the forward-looking statements. These include risks relating to financial performance and results, current economic conditions and resulting capital restraints, prices and demand for oil and natural gas, availability of drilling equipment and personnel, availability of sufficient capital to execute the Company’s business plan, impact of compliance with legislation and regulations, successful results from our identified drilling locations, the Company’s ability to replace reserves and efficiently develop and exploit its current reserves and other important factors that could cause actual results to differ materially from those projected as described in the Company’s Annual Report on Form 10-K for the year ended December 31, 2011, Quarterly Report on Form 10-Q for the quarter ended June 30, 2012 and other reports filed with the Securities and Exchange Commission (“SEC”). Any forward-looking statement speaks only as of the date on which such statement is made and the Company undertakes no obligation to correct or update any forward-looking statement, whether as a result of new information, future events or otherwise, except as required by applicable law. The SEC generally permits oil and gas companies, in filings made with the SEC, to disclose proved reserves, which are reserve estimates that geological and engineering data demonstrate with reasonable certainty to be recoverable in future years from known reservoirs under existing economic and operating conditions and certain probable and possible reserves that meet the SEC’s definitions for such terms. In this presentation, the Company may use the terms “unproved reserves” , “estimated ultimate recovery”, “EUR” or other descriptions of volumes of reserves which the SEC guidelines restrict from being included in filings with the SEC without strict compliance with SEC definitions. The Company does not choose to include unproved reserve estimates in its filings with the SEC. “Unproved reserves” refers to the Company’s internal estimates of hydrocarbon quantities that may be potentially discovered through exploratory drilling or recovered with additional drilling or recovery techniques. Estimated ultimate recovery, or “EUR”, refers to the Company’s internal estimates of per well hydrocarbon quantities that may be potentially recovered from a hypothetical future well completed as a producer in the area. Unproved reserves and EURs may not constitute reserves within the meaning of the Society of Petroleum Engineer’s Petroleum Resource Management System or SEC rules and do not include any proved reserves. Actual quantities that may be ultimately recovered from the Company’s interests will differ substantially. Factors affecting ultimate recovery include the scope of the Company’s ongoing drilling program, which will be directly affected by the availability of capital, drilling and production costs, availability of drilling services and equipment, drilling results, lease expirations, transportation constraints, regulatory approvals and other factors, as well as actual drilling results, including geological and mechanical factors affecting recovery rates. Estimates of unproved reserves and EURs may change significantly as development of the Company’s core assets provide additional data. In addition, the Company’s production forecasts and expectations for future periods are dependent upon many assumptions, including estimates of production decline rates from existing wells and the undertaking and outcome of future drilling activity, which may be affected by significant commodity price declines or drilling cost increases. This presentation includes financial measures that are not in accordance with generally accepted accounting principles (“GAAP”), including Adjusted EBITDA. While management believes that such measures are useful for investors, they should not be used as a replacement for financial measures that are in accordance with GAAP. For a reconciliation of Adjusted EBITDA to the nearest comparable measure in accordance with GAAP, please see the Appendix. Forward-Looking / Cautionary Statements |
|
|
Company Overview Permian: Vertical Wolfberry, Horizontal Wolfcamp, Cline Shales 188,000 net acres 2, Oil and liquids-rich natural gas Midland Office Dallas Office Tulsa Headquarters 31,385 Boe/d average daily production during Q2 2012 1 156.5 MMBoe proved reserves at December 31, 20111 538,000 gross / 404,000 net acres 2 Drilling inventory of greater than 10 years Currently operating 13 drilling rigs Total Company Anadarko: Granite Wash 38,000 net acres 2, Liquids-rich natural gas Other Areas 178,000 net acres 2 NYSE: LPI Market Cap: ~$3.1 Billion Shares Outstanding: 128.2 MM Share Price (8/9/12): $24.09/share Total Enterprise Value: ~$4.0 B 1 Production and proved reserves reported on a two-stream basis. Proved reserves are gas price adjusted to reflect NGL benefit. Proved reserves and value per Ryder Scott evaluation at 12/31/11, at SEC pricing. 2 Acreage figures rounded as of 6/30/12 |
|
|
Demonstrated Consistent Growth: Reserves > 52% 3-year CAGR Current drilling program concentrated on exploring and exploiting high-potential acreage in the Permian Basin Multi-year PUD-to-PDP conversion Opportunity rich inventory of potential drilling locations to convert to PDP 2011 NET PROVED RESERVES (MMBOE) PD PUD Total Proved % DEV Oil / Condensate (MMBbl) 21.8 34.5 56.3 39% Natural Gas (MMcf) 248.6 352.5 601.1 41% Total (MMBOE) 63.2 93.3 156.51 40% Developed Undeveloped Gas Oil Proved reserves reported on a two-stream basis. Gas price is adjusted to reflect NGL benefit. Proved reserves and value per Ryder Scott evaluation at 12/31/11, at SEC pricing. |
|
|
Demonstrated Consistent Growth: Production 57% Liquids-rich gas 43% Oil >78% 3-year CAGR Permian-driven, oil-focused growth Vertical Wolfberry Horizontal Wolfcamp Horizontal Cline Permian 65% Granite Wash 27% Other 8% Q2-2012 Production: 31,385 BOE/D 1 Production data includes production from Broad Oak Energy, Inc. on a combined basis |
|
|
Two-Stream vs. Three-Stream 2Q-2012 Production 2Q-2012 Revenue Two-Stream Three-Stream ~ 20% Increase No impact Laredo reports on a two-stream basis to match its ownership in the products Q2-2012 Production: 31,385 BOE/D Q2-2012 Revenue: $141 million |
|
|
Permian Basin: Large, Quality Position Interest in >490 sections with ~188,000 net acres concentrated in Glasscock and Reagan Counties ~ 94% average working interest ~ 25% average royalty interest Multiple targets intervals include Vertical Wolfberry, Horizontal Wolfcamp Shale (Upper, Middle, Lower) and Horizontal Cline Shale Energen Range El Paso COP Exco EOG Petrohawk / BHP Apache Approach Devon Pioneer Laredo Laredo Acreage illustrated in map above represents publicly released leasehold positions |
|
|
Permian Basin: Multiple Targets of Opportunity MULTIPLE IDENTIFIED HORIZONTAL TARGETS & STACKED VERTICAL PAYS 1 Well counts as of 8/9/12 Formation depths are approximate Additional potential future targets Wells (1) 12 1 1 > 30 |
|
|
Permian Basin: Shale Characteristics Laredo’s Shale Plays Compare Favorably to Other Top Shale Plays Other Industry Shales Laredo Permian Shales Wolfcamp & Cline shale properties from proprietary LPI core analysis; analog play properties from various industry sources Wolfcamp Bakken Barnett Oil Combo Eagle Ford Cline Upper Middle Lower Basin Williston Fort Worth South Texas Midland Midland Midland Midland Age L Devonian/ E. Miss. Mississippian Cretaceous Permian Permian Permian Pennsylvanian Depth (Ft) 8000-10500 6500-8500 7000-12000 7000-7500 7300-7900 7900-8500 9000-9500 Thickness (Ft) 10-120 150-600 150-300 300-400 400-550 475-575 200-350 TOC (%) 5.0-20.0 3.0-7.0 2.0-6.5 2.0-9.0 2.0-5.0 2.0-5.0 2.0-7.5 Thermal Maturity (%RO) 0.5-1.0 0.8-1.7 0.8-1.4 0.7-0.8 0.8-0.9 0.8-0.9 0.85-1.1 Total Porosity (%) 3.0-12.0 4.0-6.0 5.0-12.0 5.0-7.0 4.0-7.5 5.0-8.0 5.0-8.0 Pressure Gradient (Psi/ft) 0.60-0.80 0.45-0.53 0.55-0.65 0.45-0.50 0.45-0.50 0.45-0.50 0.55-0.65 OOIP (MMBoe/Section) 5-10 10-20 25-55 25-45 25-40 20-30 25-35 |
|
|
Permian Basin: Moving Towards Inflection Points Early Stage Exploration Late Stage Exploration Early Stage Development Late Stage Development Exploration / Development Phases Formation depths are approximate |
|
|
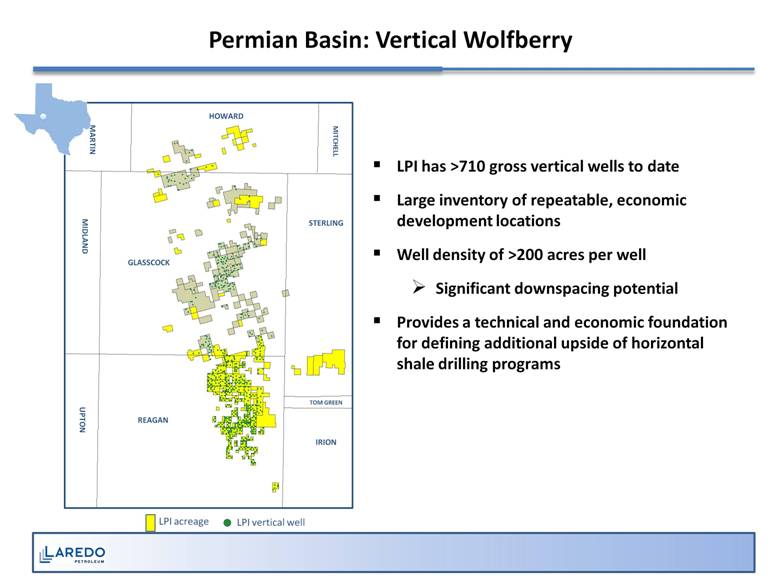
Permian Basin: Vertical Wolfberry LPI has >710 gross vertical wells to date Large inventory of repeatable, economic development locations Well density of >200 acres per well Significant downspacing potential Provides a technical and economic foundation for defining additional upside of horizontal shale drilling programs LPI acreage GLASSCOCK HOWARD STERLING IRION REAGAN TOM GREEN MARTIN MITCHELL LPI vertical well MIDLAND UPTON |
|
|
Permian Basin: Vertical Wolfberry Economics Gross EUR (MBOE) 138 30-day IP (BOE/D) 143 Drill & Complete Capex ($MM) $2.2 Key Assumptions: 40-Acre Spacing 25% Royalty Interest Constant $4 gas price Economic Analysis at Oil Price Sensitivity Bbl Bbl Bbl |
|
|
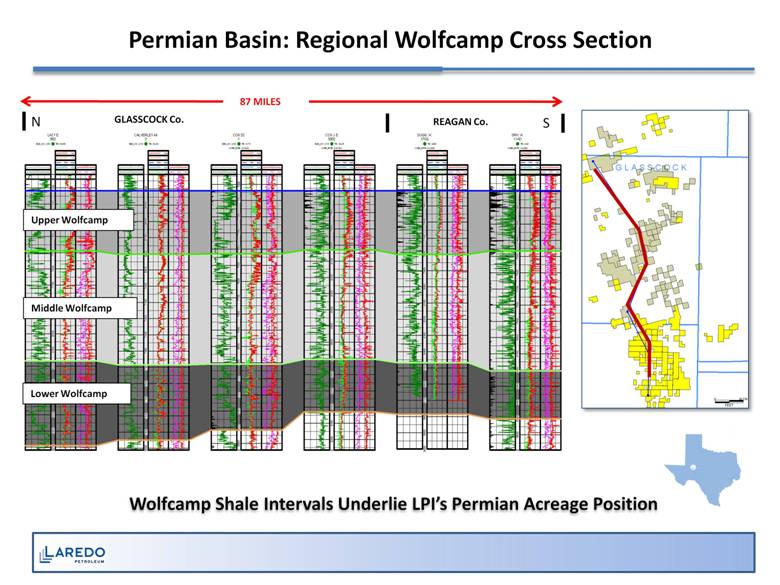
Permian Basin: Regional Wolfcamp Cross Section N S GLASSCOCK Co. REAGAN Co. Upper Wolfcamp Middle Wolfcamp Lower Wolfcamp 87 MILES Wolfcamp Shale Intervals Underlie LPI’s Permian Acreage Position G L A S S C O C K 11AD 170G 3302 0 1 0 2 5 902 0 FEET 0 26,724 |
|
|
Permian Basin: Horizontal Wolfcamp Shale LPI has drilled and completed 12 gross horizontal wells1 in the Upper Wolfcamp Shale Upside potential in Middle and Lower Wolfcamp identified based on petro-physical data and extensive vertical well control Drilling first wells in each formation Significant industry activity on trend by Pioneer, EOG, Approach, El Paso, and others is indicative of industry interest in the play LPI acreage LPI Horizontal Upper Wolfcamp Well EARLY STAGE EXPLORATION LATE STAGE EXPLORATION EARLY STAGE DEVELOPMENT Industry Horizontal Wolfcamp Activity 1,300 Upper & Middle Wolfcamp Shales Horizontal Identified Potential Locations IRION STERLING MARTIN HOWARD MITCHELL GLASSCOCK MIDLAND UPTON REAGAN TOM GREEN 1 Well counts as of 8/9/12 |
|
|
Permian Basin: Horizontal Upper Wolfcamp Economics Lateral Length 4,000’ 6,000‘ 7,500’ Number of Stages 15 22 28 Gross EUR (MBOE) 450 660 840 30-day IP (BOE/D) 450 660 840 Drill & Complete Capex ($MM) $6.8 $8.6 $10.0 Key Assumptions: 160 to 240-Acre Spacing 25% Royalty Interest 69% oil Gross EUR 77% oil 30-Day IP Constant $4.00 Gas Price Beginning tests of Middle & Lower Wolfcamp |
|
|
Permian Basin: Horizontal Cline Shale Repeatable horizontal resource play in the Cline Shale We have been drilling and gathering data on Cline Shale since 2008 >30 horizontal wells have been drilled and completed in the Cline Shale, provides a baseline of historical well performance 1 Well performance continues to support our Cline model We are currently optimizing our horizontal Cline play by drilling longer laterals with increased frac stages Late stage exploration Early stage development Cline whole core Laredo Cline hz well (30+) LPI acreage Early stage exploration GLASSCOCK HOWARD STERLING IRION REAGAN TOM GREEN MARTIN MITCHELL More than 900 Horizontal Cline Shale Identified Potential Locations 1 Well counts as of 6/30/12 |
|
|
Permian Basin: Regional Cline Cross Section Cline Shale Across LPI’s Acreage Position GLASSCOCK Co. REAGAN Co. N S CLINE HIGH QUALITY SOURCE ROCK (TOC) G L A S S C O C K I R I O N M I D L A N D R E A G A N U P T O N S T E R L I N G |
|
|
Permian Basin: Horizontal Cline Economics Lateral Length 4,000’ 6,000‘ 7,500’ Number of Stages 15 22 28 Gross EUR (MBOE) 420 616 784 30 day IP (BOE/D) 525 770 980 Drill & Complete Capex ($MM) $7.7 $9.5 $11.1 Key Assumptions: 160 to 240-Acre Spacing 25% Royalty Interest 60% oil Gross EUR 73% oil 30-Day IP Constant $4.00 Gas Price |
|
|
Anadarko Granite Wash: Multiple Porosity Trends Stacked, Liquids-Rich Porosity Trends Extend Across Laredo Acreage Land position consists of 55,000 gross; 38,000 net acres 1 Drilled and completed > 20 horizontal Granite Wash wells in the play 2 Approximately 100 potential horizontal Granite Wash locations identified Horizontal well locations technically defined by geology and reservoir characteristics Majority of the Laredo Granite Wash program will have 2 horizontal wells or less per zone per section Our average well performance continues to meet or exceed expectations Detailed geological mapping and engineering have resulted in high ROR, high-rate completions 1 Acreage figures rounded as of 6/30/12 2 Well counts as of 6/30/12 |
|
|
Granite Wash Horizontal Economics - Texas 0 10 20 30 40 50 60 70 80 90 100 4.40 4.70 5.00 5.30 5.60 5.90 Rate of Return, % Well EUR (BCFE) Economic Analysis at Gas Price Sensitivity $6.00 / MCF $4.00 / MCF $2.00 / MCF Key Assumptions: 2 or less laterals / zone/section 25% Royalty Interest Constant $90 Oil Price Gross EUR (Bcfe) 5.2 30 day IP (MMcfe/D) 10.5 Drill & Complete Capex ($MM) $8.0 |
|
|
Granite Wash Horizontal Economics - Oklahoma 0 10 20 30 40 50 60 70 80 90 100 4.40 4.70 5.00 5.30 5.60 5.90 Rate of Return, % Well EUR (BCFE) Economic Analysis at Gas Price Sensitivity $6.00 / MCF $4.00 / MCF $2.00 / MCF Gross EUR (Bcfe) 5.2 30 day IP (MMcfe/D) 10.5 Drill & Complete Capex ($MM) $9.0 Key Assumptions: 2 or less laterals / zone/section 20% Royalty Interest Constant $90 Oil Price |
|
|
2012 Guidance 2H-2012 Guidance Price Realizations (pre-hedge, two-stream basis, % of NYMEX): Crude oil 90% - 94% Natural gas, including natural gas liquids 150% - 160% Operating Costs & Expenses Lease operating expenses ($/BOE) $5.50 - $6.00 Production taxes (% of oil and natural gas revenues) 7.5% General and administrative expenses ($/BOE) $5.75 - $6.25 Depreciation, depletion and amortization ($/BOE) $20.50 - $21.50 Annual production >11.2 MMBOE Capital expenditures of approximately $900 million (excluding acquisitions) |
|
|
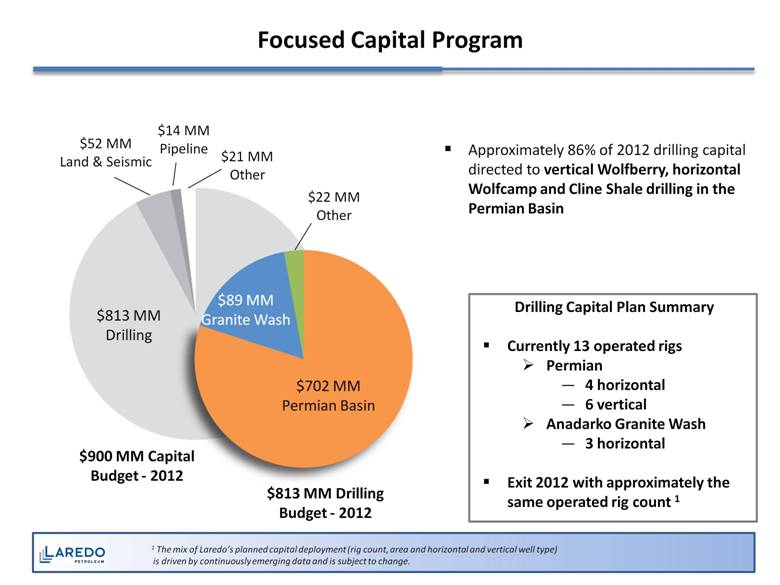
Focused Capital Program $900 MM Capital Budget - 2012 $813 MM Drilling Budget - 2012 $702 MM Permian Basin $89 MM Granite Wash $22 MM Other $813 MM Drilling $52 MM Land & Seismic $14 MM Pipeline $21 MM Other Drilling Capital Plan Summary Currently 13 operated rigs Permian 4 horizontal 6 vertical Anadarko Granite Wash 3 horizontal Exit 2012 with approximately the same operated rig count 1 Approximately 86% of 2012 drilling capital directed to vertical Wolfberry, horizontal Wolfcamp and Cline Shale drilling in the Permian Basin 1 The mix of Laredo’s planned capital deployment (rig count, area and horizontal and vertical well type) is driven by continuously emerging data and is subject to change. |
|
|
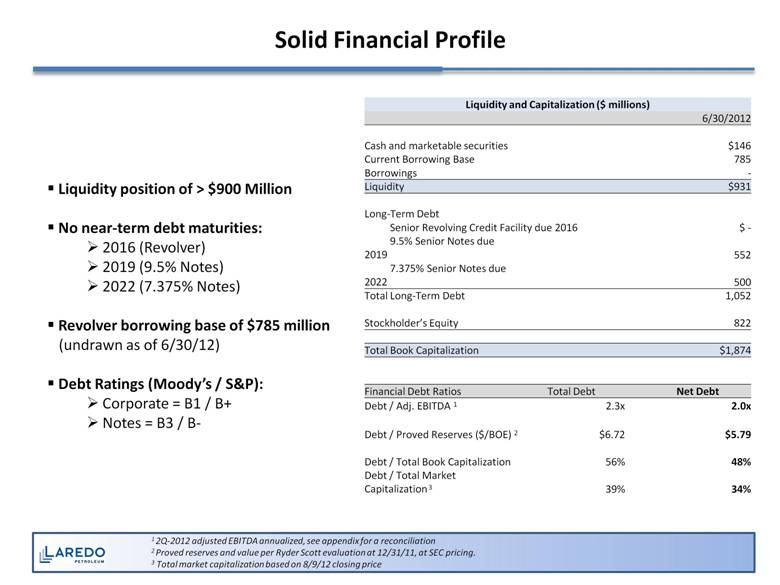
Solid Financial Profile Liquidity position of > $900 Million No near-term debt maturities: 2016 (Revolver) 2019 (9.5% Notes) 2022 (7.375% Notes) Revolver borrowing base of $785 million e (undrawn as of 6/30/12) Debt Ratings (Moody’s / S&P): Corporate = B1 / B+ Notes = B3 / B- 1 2Q-2012 adjusted EBITDA annualized, see appendix for a reconciliation 2 Proved reserves and value per Ryder Scott evaluation at 12/31/11, at SEC pricing. 3 Total market capitalization based on 8/9/12 closing price Liquidity and Capitalization ($ millions) 6/30/2012 Cash and marketable securities $146 Current Borrowing Base 785 Borrowings - Liquidity $931 Long-Term Debt Senior Revolving Credit Facility due 2016 $ - 9.5% Senior Notes due 2019 552 7.375% Senior Notes due 2022 500 Total Long-Term Debt 1,052 Stockholder’s Equity 822 Total Book Capitalization $1,874 Financial Debt Ratios Total Debt Net Debt Debt / Adj. EBITDA 1 2.3x 2.0x Debt / Proved Reserves ($/BOE) 2 $6.72 $5.79 Debt / Total Book Capitalization 56% 48% Debt / Total Market Capitalization 3 39% 34% |
|
|
Flexibility to Continue Consistent Growth Funding flexibility for 2012 and beyond Rapidly growing cash flow from operations Availability under revolver should continue to grow Proven ability to access multiple capital market sources Flexible capital program 2012 capital program focused on liquids-rich plays Drilling program provides high economic returns Annualized Annualized |
|
|
2012 2013 2014 2015 Total Total volume hedged by ceiling (Bbl) 969,000 1,368,000 726,000 252,000 3,315,000 Weighted average price ($/Bbl) $108.81 $110.55 $129.09 $135.00 $115.96 Total volume hedged by floor (Bbl) 1,305,000 2,448,000 1,266,000 708,000 5,727,000 Weighted average price ($/Bbl) $79.90 $77.19 $75.26 $75.00 $77.11 % PDP hedged by floor 2 80% 107% 73% 50% 69% 2012 2013 2014 2015 Total Total volume hedged by ceiling (MMBtu) 5,140,000 16,060,000 18,120,000 15,480,000 54,800,000 Weighted average price ($/Mcf) 3 $6.71 $7.01 $7.38 $7.27 $7.18 Total volume hedged by floor (MMBtu) 7,300,000 22,600,000 18,120,000 15,480,000 63,560,000 Weighted average price ($/Mcf) 3 $5.57 $4.34 $4.10 $3.64 $4.24 % PDP hedged by floor 2 35% 69% 67% 66% 51% Hedging: Protect and Stabilize Cash Flows Oil Hedges Natural Gas Hedges As of August 2, 20121 1) Includes all hedges through 8/2/12 2) Based on 7/1/12 internal PDP forecast 3) $/Mcf is converted based upon Company average Btu content of 1.2124; prices include basis swaps |
|
|
Summary Demonstrated consistent growth in reserves and production Large, quality asset base in Permian Basin and Anadarko Granite Wash Multiple identified potential stacked horizontal targets on Permian Basin acreage Granite Wash acreage targeting liquids-rich natural gas Solid financial position Moving toward inflection points to maximize value |
|
|
Appendix |
|
|
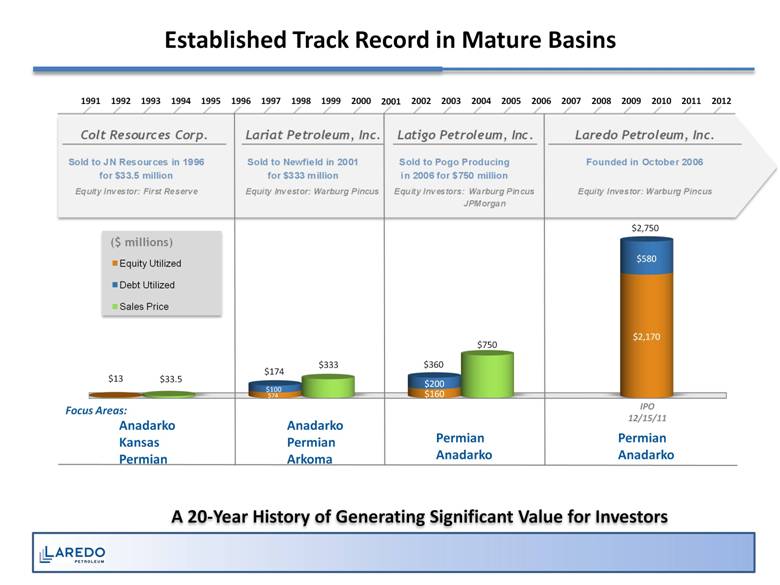
Established Track Record in Mature Basins A 20-Year History of Generating Significant Value for Investors ($ millions) Anadarko Kansas Permian Anadarko Permian Arkoma Permian Anadarko Permian Anadarko Focus Areas: Colt Resources Corp. Lariat Petroleum, Inc. Latigo Petroleum, Inc. Laredo Petroleum, Inc. Sold to JN Resources in 1996 for $33.5 million Sold to Newfield in 2001 for $333 million Sold to Pogo Producing in 2006 for $750 million Founded in October 200 6 Equity Investor: First Reserve Equity Investor: Warburg Pincus Eq uity Investor s : Warburg Pincus JPMorgan Equity Investor: Warburg Pincus |
|
|
Permian Basin: Identified Potential Drilling Locations 1 PUD Locations as identified in third-party reserve report prepared by Ryder Scott for 12/31/11 2 IPD Locations are recognized based on a combination of available geological, production and engineering data 3 Booked % represents PUD Locations as a proportion of Total IPD Locations 4 Vertical wells assume 40-acre spacing 5 Horizontal wells assume 160-acre spacing and 4,000-foot laterals |
|
|
Anadarko Granite Wash: Identified Potential Drilling Locations 1 PUD Locations as identified in third-party reserve report prepared by Ryder Scott for 12/31/11 2 IPD Locations are recognized based on a combination of available geological, production and engineering data 3 Booked % represents PUD Locations as a proportion of Total IPD Locations 4 Locations assume 40-acre spacing for the Granite Wash Vertical Program 5 The majority of the technically identified horizontal locations have 2 or less wells/zone/section and assumes 4,000-foot laterals |
|
|
Financial & Operating Data $ millions, except per unit data 1 Prices include realized hedge revenue 2 See following slide for a reconciliation of adjusted EBITDA 2010 2011 Q1 2012 Q2 2012 Key data: Realized oil price ($/Bbl) 1 $77.26 $88.62 $95.37 $85.45 Realized natural gas price ($/Mcf) 1 $6.32 $6.67 $5.84 $4.85 Average daily production (BOE/D) 14,278 23,709 27,995 31,385 Adjusted EBITDA 2 $194.5 $388.4 $113.9 $113.9 Capital expenditures ($460.5) ($706.8) ($252.2) ($233.6) Per unit metrics ($/BOE): Lease operating expenses $4.16 $5.00 $5.88 $5.48 Production & ad valorem taxes $3.01 $3.70 $3.50 $2.56 Depreciation, depletion and amortization $18.69 $20.38 $20.20 $21.25 General & administrative $5.69 $5.19 $6.00 $5.05 |
|
|
Adjusted EBITDA Reconciliation ($ thousands, unaudited) For the years ended December 31, For the quarters ended June 30, 2010 2011 2011 2012 Net income $86,248 $105,554 $41,072 $30,975 Plus: Interest expense 18,482 50,580 11,736 21,674 Depreciation, depletion & amortization 97,411 176,366 43,439 60,697 Impairment of long-lived assets – 243 37 – Write-off of deferred loan costs – 6,195 – – Loss on disposal of assets 30 40 18 8 Unrealized losses (gains) on derivative financial instruments 11,648 (20,890) (20,312) (20,263) Realized losses on interest rate derivatives 5,238 4,873 1,255 835 Non-cash stock-based compensation 1,257 6,111 557 2,588 Income tax expense (benefit) (25,812) 59,374 23,140 17,424 Adjusted EBITDA $194,502 $388,446 $100,942 $113,938 |
|
|
NYSE: LPI www.laredopetro.com |