Attached files
| file | filename |
|---|---|
| EX-32.1 - CERTIFICATION - China Carbon Graphite Group, Inc. | f10q0612ex32i_chinacarbon.htm |
| EX-31.1 - CERTIFICATION - China Carbon Graphite Group, Inc. | f10q0612ex31i_chinacarbon.htm |
| EX-31.2 - CERTIFICATION - China Carbon Graphite Group, Inc. | f10q0612ex31ii_chinacarbon.htm |
| EX-32.2 - CERTIFICATION - China Carbon Graphite Group, Inc. | f10q0612ex32ii_chinacarbon.htm |
United States
Securities and Exchange Commission
Washington, D.C. 20549
FORM 10-Q
x QUARTERLY REPORT PURSUANT TO SECTION 13 OR 15 (D) OF THE SECURITIES AND EXCHANGE ACT OF 1934
For the quarterly period ended June 30, 2012
o TRANSITION REPORT PURSUANT TO SECTION 13 OR 15 (D) OF THE SECURITIES EXCHANGE ACT OF 1934
For the transition period from _______________ to _______________
Commission File Number: 333-114564
(Exact Name of Registrant as specified in its charter)
|
Nevada
|
98-0550699
|
|
|
(State or other jurisdiction of
incorporation of organization) |
(I.R.S. Employer Identification No.)
|
c/o Xinghe Yongle Carbon Co., Ltd.
787 Xicheng Wai
Chengguantown
Xinghe County
Inner Mongolia, China
(Address of principal executive offices)
(86) 474-7209723
(Registrant’s telephone number, including area code)
Indicate by check mark whether the registrant (1) has filed all reports required to be filed by Section 13 or 15(d) of the Securities Exchange Act of 1934 during the preceding 12 months (or for such shorter period that the registrant was required to file such reports), and (2) has been subject to such filing requirements for the past 90 days. Yes x No o
Indicate by check mark whether the registrant has submitted electronically and posted on its corporate Web site, if any, every Interactive Data File required to be submitted and posted pursuant to Rule 405 of Regulation S-T (§232.405 of this chapter) during the preceding 12 months (or for such shorter period that the registrant was required to submit and post such files).
Yes x No o
Indicate by check mark whether the registrant is a large accelerated filer, an accelerated filer, a non-accelerated filer, or a smaller reporting company. See the definitions of "large accelerated filer," "accelerated filer" and "smaller reporting company" in Rule 12b-2 of the Exchange Act.
|
Large accelerated filer
|
o
|
Accelerated filer
|
o
|
|
Non-accelerated filer
(Do not check if smaller reporting company)
|
o |
Smaller reporting company
|
x
|
Indicate by check mark whether the registrant is a shell company (as defined in Rule 12b-2 of the Exchange Act) Yes o No x
Indicate the number of shares outstanding of each of the issuer's classes of common stock, as of the latest practicable date: 24,231,708 shares of common stock are issued and outstanding as of August 14, 2012.
CHINA CARBON GRAPHITE GROUP, INC. AND SUBSIDIARIES
FORM 10-Q
June 30, 2012
TABLE OF CONTENTS
|
PART I - FINANCIAL INFORMATION
|
Page No.
|
|
|
Item 1.
|
Financial Statements:
|
1
|
|
Condensed Consolidated Balance Sheets at June 30, 2012 (unaudited) and December 31, 2011
|
1
|
|
|
Unaudited Condensed Consolidated Statements of Income and Comprehensive Income for the Three and Six months ended June 30, 2012 and 2011
|
2
|
|
|
Unaudited Condensed Consolidated Statements of Cash Flows for the Six months ended June 30, 2012 and 2011
|
3
|
|
|
Notes to Unaudited Condensed Consolidated Financial Statements
|
4
|
|
|
Item 2.
|
Management's Discussion and Analysis of Financial Condition and Results of Operations
|
26
|
|
Item 3.
|
Quantitative and Qualitative Disclosures About Market Risk
|
44
|
|
Item 4.
|
Controls and Procedures
|
44
|
|
PART II - OTHER INFORMATION
|
||
|
Item 1.
|
Legal Proceedings
|
45
|
|
Item 1A.
|
Risk Factors
|
46
|
|
Item 2.
|
Unregistered Sales of Equity Securities and Use of Proceeds
|
46
|
|
Item 3.
|
Defaults Upon Senior Securities
|
47
|
|
Item 4.
|
Mine Safety Disclosures
|
47
|
|
Item 5.
|
Other Information
|
47
|
|
Item 6.
|
Exhibits
|
47
|
|
Signatures
|
48
|
|
|
Item 1.
|
Financial Statements.
|
China Carbon Graphite Group, Inc. and subsidiaries
Condensed Consolidated Balance Sheets
|
June 30,
2012 |
December 31,
2011 |
|||||||
|
(Unaudited)
|
(Audited)
|
|||||||
|
ASSETS
|
||||||||
|
Current Assets
|
||||||||
|
Cash and cash equivalents
|
$ | 1,350,890 | $ | 521,450 | ||||
|
Restricted cash
|
10,703,200 | 11,694,820 | ||||||
|
Accounts receivable, Net
|
13,095,700 | 12,541,321 | ||||||
|
Notes receivable
|
444,895 | 188,880 | ||||||
|
Advance to suppliers
|
2,410,409 | 5,921,970 | ||||||
|
Inventories
|
44,151,224 | 37,430,248 | ||||||
|
Prepaid expenses
|
234,917 | 452,730 | ||||||
|
Other receivables, net of allowance of $24,397
|
544,646 | 513,000 | ||||||
|
Total current assets
|
72,935,881 | 69,264,419 | ||||||
|
Property And Equipment, Net
|
35,742,753 | 36,719,595 | ||||||
|
Construction In Progress
|
7,518,640 | 6,220,451 | ||||||
|
Land Use Rights, Net
|
10,359,654 | 10,699,059 | ||||||
|
Total Assets
|
$ | 126,556,928 | $ | 122,903,524 | ||||
|
LIABILITIES AND STOCKHOLDERS' EQUITY
|
||||||||
|
Current Liabilities
|
||||||||
|
Accounts payable and accrued expenses
|
$ | 3,866,990 | $ | 1,340,498 | ||||
|
Advance from customers
|
1,552,654 | 1,360,989 | ||||||
|
Short term bank loans
|
38,720,400 | 45,488,600 | ||||||
|
Notes payable
|
17,786,200 | 16,763,100 | ||||||
|
Other payables
|
2,951,364 | 3,032,671 | ||||||
|
Loan from unrelated parties
|
185,610 | - | ||||||
|
Dividends payable
|
37,742 | 28,099 | ||||||
|
Total current liabilities
|
65,100,960 | 68,013,957 | ||||||
|
Amount Due To A Related Party
|
5,432,675 | 5,542,855 | ||||||
|
Long term bank loan
|
4,690,520 | - | ||||||
|
Warrant Liabilities
|
208,605 | 174,805 | ||||||
|
Total Liabilities
|
75,432,760 | 73,731,617 | ||||||
|
Redeemable convertible series B preferred stock,$0.001 par value;
|
||||||||
|
3,000,000 shares authorized; 305,810 and 426,110 shares issued
|
||||||||
|
and outstanding at June 30, 2012 and December 31, 2011, respectively.
|
366,972 | 511,332 | ||||||
|
Stockholders' Equity
|
||||||||
|
Common stock, $0.001 par value; 100,000,000 shares authorized
|
||||||||
|
24,231,708 and 22,981,408 shares issued and outstanding at
|
||||||||
|
June 30, 2012 and December 31, 2011, respectively
|
24,231 | 22,981 | ||||||
|
Additional paid-in capital
|
18,044,688 | 17,054,045 | ||||||
|
Accumulated other comprehensive income
|
7,933,485 | 7,943,542 | ||||||
|
Retained earnings
|
24,754,792 | 23,640,007 | ||||||
|
Total stockholders' equity
|
50,757,196 | 48,660,575 | ||||||
|
Total Liabilities and Stockholders' Equity
|
$ | 126,556,928 | $ | 122,903,524 | ||||
The accompanying notes are an integral part of these condensed consolidated financial statements.
1
|
China Carbon Graphite Group, Inc and subsidiaries
|
|||||||||||
|
Condensed Consolidated Statements of Operations and Comprehensive Income
|
|||||||||||
|
For the Three Months and Six Months Ended June 30, 2012 and 2011
|
|||||||||||
|
(Unaudited)
|
|
Three months ended June 30,
|
Six months ended June 30,
|
|||||||||||||||
|
2012
|
2011
|
2012
|
2011
|
|||||||||||||
|
Sales
|
$ | 11,877,543 | $ | 12,145,024 | $ | 21,938,753 | $ | 23,608,359 | ||||||||
|
Cost of Goods Sold
|
8,985,125 | 9,456,762 | 16,128,731 | 18,340,023 | ||||||||||||
|
Gross Profit
|
2,892,418 | 2,688,262 | 5,810,022 | 5,268,336 | ||||||||||||
|
Operating Expenses
|
||||||||||||||||
|
Selling expenses
|
29,152 | 57,312 | 75,950 | 107,175 | ||||||||||||
|
General and administrative
|
1,170,462 | 1,049,666 | 2,021,861 | 2,603,728 | ||||||||||||
|
Depreciation and amortization
|
46,826 | 47,152 | 103,830 | 93,754 | ||||||||||||
|
Total operating expenses
|
1,246,440 | 1,154,130 | 2,201,641 | 2,804,657 | ||||||||||||
|
Operating Income Before Other Income (Expense)
|
1,645,978 | 1,534,132 | 3,608,381 | 2,463,679 | ||||||||||||
|
Other Income (Expense)
|
||||||||||||||||
|
Interest expense
|
(1,220,173 | ) | (693,274 | ) | (2,449,918 | ) | (1,406,804 | ) | ||||||||
|
Interest income
|
21 | - | 43 | - | ||||||||||||
|
Other expense
|
(215,468 | ) | (765 | ) | (215,468 | ) | (766 | ) | ||||||||
|
Other income, net
|
215,190 | 15,670 | 215,190 | 76,550 | ||||||||||||
|
Change in fair value of warrants
|
445,763 | 26,540 | (33,800 | ) | 82,692 | |||||||||||
|
Total other expense
|
(774,667 | ) | (651,829 | ) | (2,483,953 | ) | (1,248,328 | ) | ||||||||
|
Net Income
|
$ | 871,311 | $ | 882,303 | $ | 1,124,428 | $ | 1,215,351 | ||||||||
|
Dividend Distribution
|
(4,625 | ) | (6,985 | ) | (9,643 | ) | 17,882 | |||||||||
|
Net Income Available To Common Shareholders
|
$ | 866,686 | $ | 875,318 | $ | 1,114,785 | $ | 1,233,233 | ||||||||
|
Other Comprehensive Income (Loss)
|
||||||||||||||||
|
Foreign currency translation gain (loss)
|
(433,954 | ) | 553,200 | (10,057 | ) | 821,448 | ||||||||||
|
Total Comprehensive Income
|
$ | 437,357 | $ | 1,435,503 | $ | 1,114,371 | $ | 2,036,799 | ||||||||
|
Share Data
|
||||||||||||||||
|
Basic earnings per share
|
$ | 0.04 | $ | 0.04 | $ | 0.05 | $ | 0.05 | ||||||||
|
Diluted earnings per share
|
$ | 0.04 | $ | 0.04 | $ | 0.05 | $ | 0.05 | ||||||||
|
Weighted average common shares outstanding,
|
||||||||||||||||
|
basic
|
23,948,851 | 22,350,263 | 23,632,248 | 21,993,435 | ||||||||||||
|
Weighted average common shares outstanding,
|
||||||||||||||||
|
diluted
|
24,254,661 | 23,194,542 | 23,938,058 | 22,671,285 | ||||||||||||
The accompanying notes are an integral part of these condensed consolidated financial statements.
2
China Carbon Graphite Group, Inc. and subsidiaries
Condensed Consolidated Statements of Cash Flows
For the Six Months Ended June 30, 2012 and 2011
(Unaudited)
|
Six months ended June 30,
|
||||||||
|
2012
|
2011
|
|||||||
|
Cash flows from operating activities
|
||||||||
|
Net Income
|
$ | 1,124,428 | $ | 1,215,351 | ||||
|
Adjustments to reconcile net cash provided by operating activities
|
||||||||
|
Depreciation and amortization
|
1,360,692 | 870,310 | ||||||
|
Related party interest expenses contribution
|
222,860 | - | ||||||
|
Stock compensation
|
374,333 | 623,450 | ||||||
|
Change in fair value of warrants
|
33,800 | (82,692 | ) | |||||
|
Change in operating assets and liabilities
|
||||||||
|
Accounts receivable
|
(557,196 | ) | (4,308,178 | ) | ||||
|
Notes receivable
|
(257,316 | ) | 173,556 | |||||
|
Other receivable
|
(31,808 | ) | (1,107,235 | ) | ||||
|
Advance to suppliers
|
3,529,409 | (889,008 | ) | |||||
|
Inventories
|
(6,755,136 | ) | (4,121,825 | ) | ||||
|
Prepaid expenses
|
(2,719 | ) | 226,703 | |||||
|
Accounts payable and accrued liabilities
|
2,684,917 | (141,785 | ) | |||||
|
Advance from customers
|
192,640 | 2,807,114 | ||||||
|
Taxes payable
|
(444,341 | ) | 1,476,262 | |||||
|
Other payables
|
353,241 | 90,132 | ||||||
|
Net cash provided by (used in) operating activities
|
1,827,804 | (3,167,845 | ) | |||||
|
Cash flows from investing activities
|
||||||||
|
Acquisition of property and equipment
|
(37,756 | ) | (27,088 | ) | ||||
|
Construction in progress
|
(1,109,403 | ) | (2,459,521 | ) | ||||
|
Net cash used in investing activities
|
(1,147,159 | ) | (2,486,609 | ) | ||||
|
Cash flows from financing activities
|
||||||||
|
Proceeds from issuing common stock
|
472,000 | - | ||||||
|
Proceeds from warrants exercise
|
- | 371,714 | ||||||
|
Dividends paid for series B preferred stock
|
- | (32,996 | ) | |||||
|
Proceeds from short-term bank loans
|
11,074,000 | 11,176,300 | ||||||
|
Payment to short-term bank loans
|
(17,876,600 | ) | (6,047,450 | ) | ||||
|
Proceeds from long-term bank loans
|
4,714,360 | |||||||
|
Proceeds from loans from unrelated parties
|
9,162,944 | - | ||||||
|
Payment of loans from unrelated parties
|
(9,162,944 | ) | ||||||
|
Payments to an related party
|
(142,380 | ) | - | |||||
|
Proceeds from an related party
|
31,640 | - | ||||||
|
Proceeds from stock not yet issued
|
(145,000 | ) | - | |||||
|
Restricted cash
|
996,660 | (6,491,440 | ) | |||||
|
Proceeds from notes payable
|
17,876,600 | 10,410,800 | ||||||
|
Payment to notes payable
|
(16,848,300 | ) | - | |||||
|
Net cash provided by financing activities
|
152,980 | 9,386,928 | ||||||
|
Effect of exchange rate fluctuation
|
(4,185 | ) | 42,368 | |||||
|
Net increase in cash
|
829,440 | 3,774,842 | ||||||
|
Cash and cash equivalents at beginning of period
|
521,450 | 296,312 | ||||||
|
Cash and cash equivalents at end of period
|
$ | 1,350,890 | $ | 4,071,154 | ||||
|
Supplemental disclosure of cash flow information
|
||||||||
|
Interest paid
|
$ | 1,643,371 | $ | 1,406,804 | ||||
|
Non-cash activities:
|
||||||||
|
Preferred stock conversion to common stock
|
$ | 144 | $ | 753 | ||||
|
Reclassfication of warrant liability with equity
|
$ |
-
|
$ | 14,993 | ||||
|
Issuance of common stock for compensation
|
$ | 153,800 | $ | 1,787,600 | ||||
The accompanying notes are an integral part of these condensed consolidated financial statements.
3
China Carbon Graphite Group, Inc. and Subsidiaries
Notes to Condensed Consolidated Financial Statements
For The Three and Six Months Ended June 30, 2012
(Unaudited)
(1) Organization and Business
China Carbon Graphite Group, Inc. (the “Company”), through its subsidiaries, is engaged in the manufacture of graphite-based products in the People’s Republic of China (“China” or the “PRC”). The Company’s products are used in the manufacturing process of other products, particularly non-ferrous metals and steel, and are incorporated in various types of products or processes, such as atomic reactors. The Company manufactures and sells three types of products throughout China and internationally: graphite electrodes; fine grain graphite; and high purity graphite.
The Company was incorporated on February 13, 2003 in Nevada under the name Achievers Magazine Inc. In connection with the reverse merger transaction described below, the Company’s corporate name was changed to China Carbon Graphite Group, Inc. on January 30, 2008.
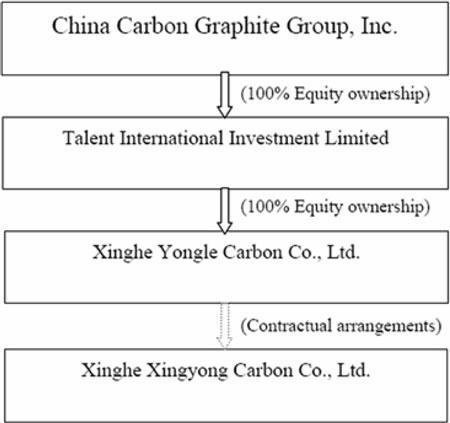
On December 17, 2007, the Company completed a share exchange pursuant to a share exchange agreement with Sincere Investment (PTC), Ltd. (“Sincere”), a British Virgin Islands corporation. Sincere was the sole stockholder of Talent International Investment Limited (“Talent”), a British Virgin Islands corporation, which is the sole stockholder of Xinghe Yongle Carbon Co., Ltd. (“Yongle”), a company organized under the laws of the PRC. Pursuant to the share exchange agreement, the Company issued 9,388,172 shares of common stock to Sincere in exchange for all of the outstanding common stock of Talent, and Talent became a wholly-owned subsidiary of the Company. Upon completion of the reverse merger, the Company’s business became the business of Talent, its subsidiaries and its affiliated variable interest entities.
Talent owns 100% of the stock of Yongle, which is a wholly foreign-owned enterprise organized under the laws of the PRC. Yongle is party to a series of contractual agreements with Xinghe Xingyong Carbon Co., Ltd. (“Xingyong”), a corporation organized under the laws of the PRC. These agreements allow the Company to operate its business in the PRC and to control the management of Xingyong and receive economic remuneration from Xingyong’s business. As a result, Xingyong is a variable interest entity and the operations of Xingyong are consolidated with those of the Company for financial reporting purposes. Xingyong’s principal stockholder is Mr. Denyong Jin, the General Manager of the Company’s China operations.
4
The relationship among the above companies is as follows:
ASC 810-10-45-25 calls for balance sheet disclosure of (a) assets of a consolidated variable interest entity (VIE) that can be used only to settle obligations of the consolidated VIE, and (b) liabilities of a consolidated VIE for which creditors (or beneficial interest owners) do not have recourse to the general credit of the primary beneficiary. The entire operating business of the Company is conducted by Xingyong and the balance sheet of the Company reflects Xingyong’s balance sheet. There are no such assets or liabilities on the balance sheet of Xingyong. The Operating Agreement dated December 7, 2007 provides that Yongle is a full-recourse guarantor of all obligations of Xingyong, and Xingyong has pledged all of its assets to Yongle. The Consulting Agreement of that date includes an assignment of all of the revenues of Xingyong to Yongle. Yongle is 100% owned by Talent and Talent is 100% owned by the Company. Accordingly, there are no assets or liabilities of Xingyong that in which the Company does not share.
The financial statements presented herein consolidate the financial statements of China Carbon Graphite, Inc. with the financial statements of its subsidiaries, Talent and Yongle. Also consolidated are the financial statements of an entity, Xingyong. The financial statements of Xingyong are consolidated with our financial statements because Xingyong is a variable interest entity. The entire operating business operations of the Company are located in the VIE, therefore the financial position and results of operations and cash flows are significantly influenced by the results of Xingyong, the VIE. Talent is party to 4 agreements dated December 7, 2007 with the owners of the registered equity of Xingyong .The agreements transfer to Talent benefits and all of the risk arising from the operations of Xingyong, as well as complete managerial authority over the operations of Xingyong.
5
The following paragraphs briefly describe the key provisions of each contractual agreement that proscribes our relationship with Xingyong:
Exclusive Technical Consulting and Services Agreement. Technical consulting and services agreement entered into on December 7, 2007 between Xinghe Yongle Carbon Co., Ltd. (also referred to as Yongle) and Xinghe Xingyong Carbon Co., Ltd. (also referred to as Xingyong), Yongle has agreed to provide technical and consulting services related to the business operations of Xingyong. As consideration for such services, Xingyong has agreed to pay to Yongle a service fee equal to 80% to 100% of the profits of Xingyong. The exact fee is calculated and paid on a quarterly basis, and is determined based on a number of factors, including but not limited to the complexity of the services provided and the commercial value of the services provided. The term of the exclusive technical consulting and services agreement is 10 years from the date thereof. Yongle may extend the term of such agreement. The parties may terminate the agreement, prior to its expiration, upon the mutual consent of Yongle and Xingyong.
Business Operations Agreement. Pursuant to the business operations agreement entered into on December 7, 2007 between Yongle, Xingyong, and the shareholders of Xingyong, Xingyong has agreed not to conduct any material transaction or corporate action without obtaining the prior written consent of Yongle. Furthermore, Xingyong and its shareholders have agreed to implement proposals made by Yongle with respect to the operations of Xingyong’s business and the appointment of directors and officers of Xingyong. Yongle may terminate the business operations agreement at any time. The term of the business operations agreement is indefinite.
Option Agreement. Yongle entered into an option agreement on December 7, 2007 with each of the shareholders of Xingyong, as well as Xingyong itself, pursuant to which Yongle has an exclusive option to purchase, or to designate another qualified person to purchase, to the extent permitted by PRC law and foreign investment policies, part or all of the equity interests in Xingyong owned by the shareholders of Xingyong. To the extent permitted by the PRC laws, the purchase price for the entire equity interest shall equal the actual price designated by Yongle to the extent permitted by relevant laws and regulations. The option agreement has a 10 year term. Upon the request of Yongle, the parties shall extend the term of the option agreement.
Equity Pledge Agreement. Pursuant to an equity pledge agreement, dated December 7, 2007, each of the shareholders of Xingyong pledged his equity interest in Xingyong to Yongle to secure Xingyong’s obligations under the VIE agreements described above. In addition, the shareholders of Xingyong agreed not to transfer, sell, pledge, dispose of or create any encumbrance on any equity interests in Xingyong that would affect Yongle’s interests. The equity pledge agreement will expire when Xingyong fully performs its obligations under the various VIE agreements described above.
Because the relationship between Xingyong and Yongle is entirely contractual, our interest in Xingyong depends on the enforceability of those agreements under the laws of the PRC. We are not aware of any judicial decision as to the enforceability of similar agreements under PRC law. However, as the owner of the registered equity of Xingyong is Mr. Jin, our major shareholder and our General Manager, we do not believe that there is a significant risk that Xingyong will seek to terminate the relationship or otherwise breach the agreements. Accordingly, we believe that consolidation of the financial statements of Xingyong with those of the Company is appropriate. The shareholders of Xingyong do not have any kick-back rights.
6
Liquidity and Working Capital Deficit
For the past two fiscal years, the Company has managed to operate the business with a low net working capital. The Company’s low working capital is primarily due to substantial short-term loans from banks, notes payables to banks and borrowings from an unrelated party. The Company is able to operate with a low net working capital as discussed under land use rights, because of the continued support from local community and governments in Inner Mongolia. The Company is one of the largest manufactures in the area. Additionally, the length of time from purchase order to delivery our products to customers is on average three to nine months. Because of this length of the time it takes to complete purchase orders and the Company’s average collection time of 90 days based on historical experience, the Company is able to reasonably predict future operating cash flow needs six to twelve months in advance. The Company believes also its historical ability to roll over short-term debt and obtain additional financing when needed, taken together, provide adequate resources to fund ongoing operations in the foreseeable future. If the Company’s short-term cash flows decrease significantly and the Company is unable to rollover or pay its short-term liabilities, the Company’s business, financial condition and results of operations could be materially affected.
The Company Law of the PRC applicable to Chinese companies provides that net after tax income should be allocated by the following rules:
|
|
1.
|
10% of after tax income to be allocated to a statutory surplus reserve until the reserve amounts to 50% of the company’s registered capital.
|
|
|
2.
|
If the accumulate balance of statutory surplus reserve is not enough to make up the Company’s cumulative prior years’ losses, the current year’s after tax income should be first used to make up the losses before the statutory surplus reverse is drawn.
|
|
|
3.
|
Allocation can be made to the discretionary surplus reserve, if such a reserve is approved at the meeting of the equity owners.
|
Therefore, the Company is required to maintain a statutory reserve in China that limits any equity distributions to its shareholders. The maximum amount of the shareholders has not been reached. The company has never distributed earnings to shareholders and has no intentions to do so.
(2) Basis for Preparation of the Financial Statements
Management acknowledges its responsibility for the preparation of the accompanying interim condensed consolidated financial statements which reflect all adjustments, consisting of normal recurring adjustments, considered necessary in its opinion for a fair statement of its condensed consolidated financial position and the results of its operations for the interim period presented. These condensed consolidated financial statements should be read in conjunction with the summary of significant accounting policies and notes to consolidated financial statements included in the Company’s Form 10-K annual report for the year ended December 31, 2011. The condensed consolidated balance sheet as of December 31, 2011 has been derived from the audited financial statements. The results of the six-months ended June 30, 2012 are not necessarily indicative of the results to be expected for the full fiscal year ending December 31, 2012.
7
The accompanying unaudited condensed consolidated financial statements for China Carbon Graphite Group, Inc. and its subsidiaries and variable interest entity, have been prepared in accordance with accounting principles generally accepted in the United States of America (“US GAAP”) for interim financial information and with the instructions to Form 10-Q and Article 10 of Regulation S-X.
The Company maintains its books and accounting records in Renminbi (“RMB”), but its reporting currency is U.S. dollars.
The financial statements have been prepared in order to present the financial position and results of operations of the Company, its subsidiaries and Xingyong, a variable interest entity whose financial condition is consolidated with the Company pursuant to ASC Topic 810-10, Consolidation, in accordance with accounting principles generally accepted in the United States of America (“U.S. GAAP”). All significant intercompany accounts and transactions have been eliminated.
(3) Summary of Significant Accounting Policies
The accompanying condensed consolidated financial statements reflect the application of certain significant accounting policies as described in this note and elsewhere in the accompanying condensed consolidated financial statements and notes.
Use of estimates
The preparation of these financial statements in conformity with U.S. GAAP requires management to make estimates and assumptions that may affect the reported amounts of assets and liabilities and disclosure of contingent assets and liabilities at the dates of the financial statements and the reported amounts of net sales and expenses during the reporting period. Some of the significant estimates include values and lives assigned to acquired property, equipment and intangible assets, reserves for customer returns and allowances, uncollectible accounts receivable, slow moving, obsolete and/or damaged inventory and stock warrant valuation. Actual results may differ from these estimates.
Cash and cash equivalents
The Company considers all highly liquid debt instruments purchased with maturity periods of three months or less to be cash equivalents. The carrying amounts reported in the accompanying balance sheet for cash and cash equivalents approximate their fair value. Most of the Company’s cash is held in bank accounts in the PRC and is not protected by FDIC insurance or any other similar insurance. The Company’s bank account in the United States is protected by FDIC insurance.
8
Restricted cash
Restricted cash represents amounts held by a bank as security for short-term bank notes payable and therefore is subject to withdrawal restrictions. As of June 30, 2012 and December 31, 2011, these amounts totaled $10,703,200 and $11,694,820, respectively. The restricted cash is expected to be released within the next twelve months after the bank notes have matured.
Accounts receivable
Trade receivables are recognized and carried at the original invoice amount less allowance for any uncollectible amounts. An allowance for doubtful accounts is made when collection of the full amount is no longer probable. Bad debts are written off as incurred. Accounts receivable are recorded at the invoiced amount and do not bear interest. Management reviews the adequacy of the allowance for doubtful accounts on an ongoing basis, using historical collection trends and aging of receivables. Management also periodically evaluates individual customer’s financial condition, credit history, and the current economic conditions to make adjustments in the allowance when it is considered necessary.
Inventory
Inventory is stated at the lower of cost or market. Cost is determined using the weighted average method. Market value represents the estimated selling price in the ordinary course of business less the estimated costs necessary to complete the sale. The Company periodically reviews historical sales activity to determine excess, slow moving items and potentially obsolete items and also evaluates the impact of any anticipated changes in future demand. The Company provides inventory allowances based on excess and obsolete inventories determined principally by customer demand.
As of June 30, 2012 and December 31, 2011, the Company did not record an allowance for obsolete inventories, nor have there been any write-offs.
The cost of inventories comprises all costs of purchases, costs of conversion and other costs incurred in bringing the inventories to their present location and condition. The costs of conversion of inventories include fixed and variable production overhead, taking into account the stage of completion.
Property and equipment
Property and equipment is stated at the historical cost, less accumulated depreciation. Depreciation on property and equipment is provided using the straight-line method over the estimated useful lives of the assets for both financial and income tax reporting purposes as follows:
|
Buildings
|
25 - 40 years
|
|
Machinery and equipment
|
10 - 20 years
|
|
Motor vehicles
|
5 years
|
9
Expenditures for renewals and betterments are capitalized while repairs and maintenance costs are normally charged to the statement of operations in the year in which they are incurred. In situations where it can be clearly demonstrated that the expenditure has resulted in an increase in the future economic benefits expected to be obtained from the use of the asset, the expenditure is capitalized as an additional cost of the asset.
Upon sale or disposal of an asset, the historical cost and related accumulated depreciation or amortization of such asset were removed from their respective accounts and any gain or loss is recorded in the statements of income.
The Company reviews the carrying value of property, plant, and equipment for impairment whenever events and circumstances indicate that the carrying value of an asset may not be recoverable from the estimated future cash flows expected to result from its use and eventual disposition. In cases where undiscounted expected future cash flows are less than the carrying value, an impairment loss is recognized equal to an amount by which the carrying value exceeds the fair value of assets. The factors considered by management in performing this assessment include current operating results, trends and prospects, the manner in which the property is used, and the effects of obsolescence, demand, competition and other economic factors. Based on this assessment, there was no impairment recorded during the six months ended at June 30, 2012 and 2011.
Construction in progress
Construction in progress represents the costs incurred in connection with the construction of buildings or additions to the Company’s plant facilities and land improvements to the property adjacent to the plant. No depreciation is provided for construction in progress until such time as the assets are completed and placed into service. The Company has not capitalized any interest expenses for the six months ended at June 30, 2012 and 2011.
Land use rights
The Company has land use rights of 386,853 square meters used for operations in Xinghe County, Inner Mongolia, China. The land use rights have terms of 50 years, with the land use right relating to 130,220 square meters expiring in 2052 and the land use right with respect to 256,633 square meters expiring in 2053. In addition, in 2011, the local Chinese government and the Company agreed on terms for the land use rights of 387,838 square meters of land located adjacent to the Company’s facilities. The Company was not required to sign a land use right agreement or pay a fee. In exchange, the Company will allow public use of this 387,838 square meters of land, provide improvements to the land and keep the land in good condition. The land use right has a term of 50 years, with such term expiring in January 2060. The value of the land is estimated to be $14,000,000. The Company has not accrued the liability or recorded the land use right asset for this property in accordance with ASC 450, Contingencies. Because of the relationship and agreement with the local government to keep provide improvements to the land and keep it in good condition, the Company believes that it is unlikely to have to pay for the land use right. The bank allows, and the Company uses, this land use right as collateral for its short-term bank loans.
10
Stock-based compensation
Stock-based compensation includes (i) common stock awards granted to employees and directors for services which are accounted for under FASB ASC 718, Compensation–Stock Compensation” and (ii) common stock awards granted to consultants which are accounted for under FASB ASC 505-50, Equity–Equity-Based Payments to Non-Employees.
All grants of common stock awards and stock options to employees and directors are recognized in the financial statements based on their grant date fair values. The Company has elected to recognize compensation expense using the straight-line method for all common stock awards and stock options granted with service conditions that have a graded vesting schedule, with a corresponding charge to additional paid-in capital.
Common stock awards are granted to directors for services provided. The vested portions of common stock awards granted but not yet issued are recorded in common stock to be issued.
Common stock awards issued to consultants represent common stock granted to non-employees in exchange for services at fair value. The measurement dates for such awards are set at the dates that the contracts are entered into as the awards are non-forfeitable and vest immediately. The measurement date fair value is then recognized over the service period as if the Company has paid cash for such service.
The Company estimates fair value of common stock awards based on the number of shares granted and the quoted price of the Company’s common stock on the date of grant.
Foreign currency translation
The reporting currency of the Company is the U.S. dollars. The Company uses RMB as its functional currency. The results of operations and cash flows are translated at average exchange rates during the period, and assets and liabilities are translated at the unified exchange rates at the balance sheet dates, and equity is translated at the historical exchange rates. As a result, amounts related to assets and liabilities reported on the statements of cash flows will not necessarily agree with changes in the corresponding accounts on the balance sheets. Translation adjustments resulting from this process are included in accumulated other comprehensive income in the statements of stockholders’ equity. Translation adjustments for the three months ended June 30, 2012 and 2011 were $(433,954) and $553,200, respectively. Translation adjustments for the six months ended June 30, 2012 and 2011 were $(10,057) and $821,448, respectively. The cumulative translation adjustment and effect of exchange rate changes on cash for the three months ended June 30, 2012 and 2011 were $(8,005) and $39,436, respectively. The cumulative translation adjustment and effect of exchange rate changes on cash for the six months ended June 30, 2012 and 2011 were $(4,185) and $42,368, respectively. Transaction gains and losses that arise from exchange rate fluctuations on transactions denominated in a currency other than the functional currency are included in the results of operations as incurred.
11
Assets and liabilities were translated at 6.31 RMB to $1.00 at both June 30, 2012 and December 31, 2011. The equity accounts were stated at their historical rates. The average translation rates applied to income statements for the six months ended June 30, 2012 and 2011 were 6.32 RMB and 6.46 RMB to $1.00, respectively. Cash flows are also translated at average translation rates for the period; therefore, amounts reported on the statement of cash flows will not necessarily agree with changes in the corresponding balances on the balance sheet.
Revenue recognition
We recognize revenue in accordance with ASC 605-25, Revenue Recognition, which states that revenue should be recognized when the following criteria are met: (1) persuasive evidence of an arrangement exists; (2) the service has been rendered; (3) the selling price is fixed or determinable; and (4) collection of the resulting receivable is reasonably assured. Sales represent the invoiced value of goods, net of value added tax (“VAT”), if any, and are recognized upon delivery of goods and passage of title.
In accordance with ASC 605-25, the Company recognizes revenue when persuasive evidence of an arrangement exists, transfer of title has occurred or services have been rendered, the selling price is fixed or determinable and collectability is reasonably assured.
The Company derives revenues from the manufacturing and distribution of graphite based products. The Company recognizes its revenues net of VAT. The Company is subject to VAT, which is levied on a majority of the products, at a rate ranging from 13% to 17% on the invoiced value of sales. Output VAT is borne by customers in addition to the invoiced value of sales and input VAT is borne by the Company in addition to the invoiced value of purchases to the extent not refunded for export sales.
The Company recognizes revenue upon receipt of the delivery confirmation provided by the customer or distributor. The Company does not provide chargeback or price protection rights to the distributors. The distributor only places purchase orders with the Company once it has confirmed the sale with a third party because this is a specialized business, which dictates that the Company will not manufacture the products until the purchase order is received. The Company allows its customers to return products only if its products are later determined by the Company to be defective. Based on the Company’s historical experience, product returns have been insignificant throughout all of its product lines. Therefore, the Company does not estimate deductions or allowances for sales returns. If sales returns occur, they are taken against revenue when products are returned from customers. Sales are presented net of any discounts given to customers. Interest income is recognized when earned. The Company experienced no returns for the six months ended June 30, 2012 and 2011.
Taxation
Taxation on profits earned in the PRC has been calculated based on the estimated assessable profits for the year at the rates of taxation prevailing in the PRC after taking into account the benefits from any special tax credits or “tax holidays” allowed in the county of operations.
12
The Company does not accrue U.S. income tax since it has no operations in the United States. Its operating subsidiaries are organized and located in the PRC and do not conduct any business in the United States.
The Company recognizes that virtually all tax positions in the PRC are not free from some degree of uncertainty due to tax law and policy changes by the state. The Company cannot reasonably quantify political risk factors and thus must depend on guidance issued by current government officials.
Based on all known facts and circumstances and current tax law, the Company believes that the total amount of unrecognized tax benefits as of June 30, 2012 is not material to its results of operations, financial condition or cash flows. The Company also believes that the total amount of unrecognized tax benefits as of June 30, 2012, if recognized, would not have a material effect on its effective tax rate. The Company further believes that there are no tax positions, including the Enterprise Income Tax holiday from Xing He District Local Tax Authority, for which it is reasonably possible, based on current Chinese tax law and policy, that the unrecognized tax benefits will significantly increase or decrease over the next twelve months producing, individually or in the aggregate, a material effect on the Company’s results of operations, financial condition or cash flows.
Enterprise income tax
The Company has been recognized as a high technology and science company by the Ministry of Science and Technology of the PRC. Therefore, Xing He District Local Tax Authority in the Inner Mongol province granted the Company a 100% tax holiday from the enterprise income tax for 10 years from 2008 through 2017. When the tax holiday ends, based on the present tax law and the Company’s status as a high technology and science company, the Company will be subject to a corporate income tax rate of 15% effective in 2018.
Value added tax
The Provisional Regulations of the PRC Concerning Value Added Tax promulgated by the State Council came into effect on January 1, 1994. Under these regulations and the Implementing Rules of the Provisional Regulations of the PRC Concerning Value Added Tax, value added tax (“VAT”) is imposed on goods sold in or imported into the PRC and on processing, repair and replacement services provided within the PRC.
VAT payable in the PRC is charged on an aggregated basis at a rate of 13% or 17% (depending on the type of goods involved) on the full price collected for the goods sold or, in the case of taxable services provided, at a rate of 17% on the charges for the taxable services provided, but excluding, in respect of both goods and services, any amount paid in respect of VAT included in the price or charges, and less any deductible value added tax already paid by the taxpayer on purchases of goods and services in the same financial year. VAT payable (recoverable), which is included in other payables, was $71,846 and $16,542 as of June 30, 2012 and December 31, 2011, respectively.
13
Fair value of financial instruments
The Company has adopted ASC Topic 820, Fair Value Measurement and Disclosure, which defines fair value, establishes a framework for measuring fair value in GAAP, and expands disclosures about fair value measurements. It does not require any new fair value measurements, but provides guidance on how to measure fair value by providing a fair value hierarchy used to classify the source of the information. It establishes a three-level valuation hierarchy of valuation techniques based on observable and unobservable inputs, which may be used to measure fair value and include the following:
|
●
|
Level 1 inputs to the valuation methodology are quoted prices (unadjusted) for identical assets or liabilities in active markets.
|
|
●
|
Level 2 inputs to the valuation methodology include quoted prices for similar assets and liabilities in active markets, and inputs that are observable for the assets or liability, either directly or indirectly, for substantially the full term of the financial instruments.
|
|
●
|
Level 3 inputs to the valuation methodology are unobservable and significant to the fair value.
|
The fair value of the 2007 Warrants to purchase 125,000 shares of common stock was $1,344 and $2,702 at June 30, 2012 and December 31, 2011, respectively. The Company recognized a loss of $19,555 from the change in fair value of these warrants for the three months ended March 31, 2012 and a gain of $20,913 for the three months ended June 30, 2012.
The fair value of the 2009 Warrants to purchase 200,000 shares of common stock was $27,825 and $22,820 at June 30, 2012 and December 31, 2011, respectively. The Company recognized a loss of $70,934 from the change in fair value of these warrants for the three months ended March 31, 2012 and a gain of $65,929 for the three months ended June 30, 2012.
The fair value of the 2009 Series B Warrants to purchase 804,200 shares of common stock was $159,259 and $132,521 at June 30, 2012 and December 31, 2011, respectively. The Company recognized a loss of $345,784 from the change in fair value of these warrants for the three months ended March 31, 2012 and a gain of $319,045 for the three months ended June 30, 2012.
The fair value of 2010 Series B warrants to purchase 100,000 shares of common stock was $20,176 and $16,762 at June 30, 2012 and December 31, 2011, respectively. The Company recognized a loss of $43,290 from the change in fair value of these warrants for the three months ended March 31, 2012 and a gain of $39,876 for the three months ended June 30, 2012.
In summary, the Company recorded a gain of $445,763 and loss of $33,800 of changes in fair value of warrants in the condensed consolidated statement of income and comprehensive income for the three months and six months ended June 30, 2012, respectively. Each reporting period, the change in fair value is recorded into other income (expense).
14
Warrants referred to in the preceding paragraphs do not trade in an active securities market, and as such, the Company estimates the fair value of these warrants using the Black-Scholes option pricing model using the following assumptions:
|
June 30,
2012
(unaudited)
|
December 31,
2011
|
|||||||
|
2007 Warrants
|
||||||||
|
Annual dividend yield
|
-
|
-
|
||||||
|
Expected life (years)
|
0.54
|
1.04
|
||||||
|
Risk-free interest rate
|
0.18
|
%
|
0.18
|
%
|
||||
|
Expected volatility
|
104
|
%
|
90
|
%
|
||||
|
June 30,
2012
(unaudited)
|
December 31,
2011
|
|||||||
|
2009 Warrants
|
||||||||
|
Annual dividend yield
|
-
|
-
|
||||||
|
Expected life (years)
|
2.21
|
2.71
|
||||||
|
Risk-free interest rate
|
0.18
|
%
|
0.18
|
%
|
||||
|
Expected volatility
|
104
|
%
|
90
|
%
|
||||
|
June 30,
2012
(unaudited)
|
December 31,
2011
|
|||||||
|
2009 Series B Warrants
|
||||||||
|
Annual dividend yield
|
-
|
-
|
||||||
|
Expected life (years)
|
2.48
|
2.98
|
||||||
|
Risk-free interest rate
|
0.18
|
%
|
0.18
|
%
|
||||
|
Expected volatility
|
104
|
%
|
90
|
%
|
||||
|
June 30,
2012
(unaudited)
|
December 31,
2011
|
|||||||
|
2010 Series B Warrants
|
||||||||
|
Annual dividend yield
|
-
|
-
|
||||||
|
Expected life (years)
|
2.53
|
3.03
|
||||||
|
Risk-free interest rate
|
0.18
|
%
|
0.18
|
%
|
||||
|
Expected volatility
|
104
|
%
|
90
|
%
|
||||
The carrying amount of restricted cash, other receivables, advance to vendors, advances from customers, other payables, accrued liabilities and short-term loans are reasonable estimates of their fair value because of the short term nature of these items.
15
The following table sets forth by level within the fair value hierarchy of the Company’s financial assets and liabilities that was accounted for at fair value on a recurring basis or for purposes of disclosures as of June 30, 2012:
|
Carrying Value at
June 30, |
Fair Value Measurement at
June 30, 2012
|
|||||||||||||||
|
2012
|
Level 1
|
Level 2
|
Level 3 | |||||||||||||
|
Warrant liability
|
$ | 208,605 | - | - | $ | 208,605 | ||||||||||
|
Notes receivables
|
$ | 444,895 | $ | 444,895 | - | |||||||||||
|
Notes payable
|
$ | 17,786,200 | $ | 17,786,200 | - | |||||||||||
The Company uses the black-scholes valuation method approach when determining fair values of its Level 3 recurring fair value measurements. Certain unobservable units for these assets are offered quotes, lack of marketability and volatility. For Level 3 measurements, significant increases or decreases in either of those inputs in isolation could result in a significantly lower or higher fair value measurement. In general, a significant change in the calculated volatility of the Company’s stock price could negatively affect the fair value of the warrant liability.
Summary of warrants outstanding:
|
Warrants
|
Weighted Average Exercise Price
|
|||||||
|
Outstanding as of December 31, 2011
|
1,229,200
|
$
|
1.51
|
|||||
|
Granted
|
-
|
-
|
||||||
|
Exercised
|
-
|
-
|
||||||
|
Cancelled
|
-
|
-
|
||||||
|
Outstanding as of June 30, 2012
|
1,229,200
|
$
|
1.51
|
|||||
Earnings per share
Basic earnings per share is computed by dividing net income available to common shareholders by the weighted average number of shares of common stock outstanding during the period. Diluted earnings per share is computed by dividing net income available to common shareholders by the weighted average number of shares of common stock, common stock equivalents and potentially dilutive securities outstanding during each period. Potentially dilutive shares of common stock consist of the common stock issuable upon the conversion of convertible debt, preferred stock and warrants. The Company has outstanding warrants to purchase 1,229,200 shares of common stock at an exercise price in the range of $1.30 - $2.00 per share. The Company uses if-converted method to calculate the dilutive preferred stock and treasury stock method to calculate the dilutive shares issuable upon exercise of warrants.
16
The following table sets forth the computation of the number of net income per share for the six months ended June 30, 2012 and 2011:
|
June 30,
2012
(unaudited)
|
June 30,
2011
|
|||||||
|
Weighted average shares of common stock outstanding (basic)
|
23,632,248
|
21,993,435
|
||||||
|
Shares issuable upon conversion of Series B Preferred Stock
|
305,810
|
472,160
|
||||||
|
Shares issuable upon exercise of warrants
|
-
|
205,690
|
||||||
|
Weighted average shares of common stock outstanding (diluted)
|
23,938,058
|
22,671,285
|
||||||
|
Net income available to common shareholders
|
$
|
1,114,786
|
$
|
1,233,233
|
||||
|
Net income per shares of common stock (basic)
|
$
|
0.05
|
$
|
0.05
|
||||
|
Net income per shares of common stock (diluted)
|
$
|
0.05
|
$
|
0.05
|
||||
For the six months ended June 30, 2012, the Company excluded the shares of common stock issuable upon exercise of 1,229,200 warrants, because such issuance would be anti-dilutive.
For the six months ended June 30, 2011, the Company excluded the shares of common stock issuable upon exercise of 125,000 warrants, because such issuance would be anti-dilutive.
The following table sets forth the computation of the number of net income per share for the three months ended June 30, 2012 and 2011:
|
June 30,
2012
(unaudited)
|
June 30,
2011
|
|||||||
|
Weighted average shares of common stock outstanding (basic)
|
23,948,851
|
22,350,263
|
||||||
|
Shares issuable upon conversion of Series B Preferred Stock
|
305,810
|
472,160
|
||||||
|
Shares issuable upon exercise of warrants
|
-
|
372,119
|
||||||
|
Weighted average shares of common stock outstanding (diluted)
|
24,254,661
|
23,194,542
|
||||||
|
Net income available to common shareholders
|
$
|
866,687
|
$
|
875,318
|
||||
|
Net income per shares of common stock (basic)
|
$
|
0.04
|
$
|
0.04
|
||||
|
Net income per shares of common stock (diluted)
|
$
|
0.04
|
$
|
0.04
|
||||
For the three months ended June 30, 2012, the Company excluded the shares of common stock issuable upon exercise of 1,229,200 warrants, because such issuance would be anti-dilutive.
For the three months ended June 30, 2011, the Company excluded the shares of common stock issuable upon exercise of 125,000 warrants, because such issuance would be anti-dilutive.
Reclassification
Certain 2011 amounts have been reclassified to conform to the current year’s financial statements presentation. These reclassifications had no impact on the previously reported financial position, results of operations or cash flows.
Recent accounting pronouncements
The Company has reviewed all recently issued, but not yet effective, accounting pronouncements and does not believe the future adoption of any such pronouncements will have a material impact on its financial condition or the results of its operations.
In December 2011, FASB issued ASU 2011-11, Disclosures about Offsetting Assets and Liabilities. The amendments contained in ASU 2011-11 require an entity to disclose information about offsetting and related arrangements to enable users of its financial statements to understand the effect of those arrangements on its financial position. This amendment is effective for annual reporting periods beginning on or after January 1, 2013. The adoption of ASU 2011-11 results in changes to presentation and disclosure only and is not expected to have an impact on the Company’s consolidated results of operations and financial condition.
During June 2011, the FASB issued ASU 2011-05, “Presentation of Comprehensive Income.” ASU 2011-05 eliminates the option to report other comprehensive income and its components in the statement of changes in stockholders’ equity and requires an entity to present the total of comprehensive income, the components of net income and the components of other comprehensive income either in a single continuous statement or in two separate but consecutive statements. The Company has adopted ASU No. 2011-05, which resulted in the components of comprehensive income to be presented within the consolidated statements of operations and comprehensive income (loss).
17
During May 2011, the FASB issued ASU No. 2011-04, “Amendments to Achieve Common Fair Value Measurement and Disclosure Requirements in U.S. GAAP and International Financial Reporting Standards (“IFRS”).” This pronouncement was issued to provide a consistent definition of fair value and ensure that the fair value measurement and disclosure requirements are similar between U.S. GAAP and IFRS. ASU 2011-04 changes certain fair value measurement principles and enhances the disclosure requirements particularly for level 3 fair value measurements. This pronouncement is effective for reporting periods beginning on or after December 15, 2011. The adoption of ASU 2011-04 did not have an impact to our consolidated financial position or results of operations.
(4) Concentration of Business and Credit Risk
Most of the Company’s bank accounts are in banks located in the PRC and are not covered by any type of protection similar to that provided by the Federal Deposit Insurance Corporation (“FDIC”) on funds held in U.S. banks. The Company’s bank account in the United States is covered by FDIC insurance.
Financial instruments that potentially subject the Company to concentration of credit risk consist principally of cash, trade accounts receivables and inventories, the balances of which are stated on the balance sheet. The Company places its cash in banks located in China. Concentration of credit risk with respect to trade accounts receivables is limited due to the diversity of the Company’s customers who are located in different regions of China. The Company does not require collateral or other security to support financial instruments subject to credit risk.
For the six months ended June 30, 2012, two customers accounted for 10% or more of sales revenues, representing 32.4%, and 24.9%, respectively of the total sales. For the six months ended June 30, 2011, two customers accounted for 10% or more of sales revenues, representing 34.0%, and 24.0%, respectively of the total sales. As of June 30, 2012, there were two customers that constituted 43.2%, and 26.3% of the accounts receivable. As of December 31, 2011, there were two customers that constituted 41.2% and 16.3% of the accounts receivable.
For the six months ended June 30, 2012, four suppliers accounted for 10% or more of our total purchases, representing 35.7%, 15.4%, 14.2% and 10.7%, respectively. For the six months ended June 30, 2011, three suppliers accounted for 10% or more of our total purchases, representing 45.0%, 19.0% and 10.2% of our total purchase, respectively.
(5) Income Taxes
Under the Provisional Regulations of The People’s Republic of China Concerning Income Tax on Enterprises promulgated by the PRC, domestic and foreign companies pay a unified corporate income tax of 25%, except for a 15% corporate income tax rate for qualified high technology and science enterprises. The Company has been granted a 100% tax holiday from enterprise income tax from the Xing He District Local Tax Authority for 10 years from 2008 through 2017.
18
A reconciliation of the provision for income taxes with amounts determined by the PRC statutory income tax rate to income before income taxes is as follows:
|
June 30,
|
||||||||
|
2012
(unaudited)
|
2011
|
|||||||
|
Computed tax at the PRC statutory rate of 15%
|
$
|
298,317
|
$
|
359,760
|
||||
|
Benefit of tax holiday
|
(298,317
|
)
|
(359,760
|
)
|
||||
|
Income tax expenses per books
|
$
|
-
|
$
|
-
|
||||
(6) Accounts Receivable, net
As of June 30, 2012 and December 31, 2011, accounts receivable consisted of the following:
|
June 30,
2012
(unaudited)
|
December 31,
2011
|
|||||||
|
Amount outstanding
|
$
|
15,886,362
|
$
|
15,331,983
|
||||
|
Less: Allowance for doubtful accounts
|
(2,790,662
|
)
|
(2,790,662
|
)
|
||||
|
Net amount
|
$
|
13,095,700
|
$
|
12,541,321
|
||||
As of June 30, 2012 and December 31, 2011, allowance for doubtful accounts consisted of the following:
|
June 30,
2012
(unaudited)
|
December 31,
2011
|
|||||||
|
Beginning balance
|
$
|
2,790,662
|
$
|
2,505,867
|
||||
|
Provision for doubtful accounts
|
-
|
284,795
|
||||||
|
Amounts written off
|
-
|
-
|
||||||
|
Ending balance
|
$
|
2,790,662
|
$
|
2,790,662
|
||||
(7) Inventories
As of June 30, 2012 and December 31, 2011, inventories consisted of the following:
|
June 30,
2012
(unaudited)
|
December 31,
2011
|
|||||||
|
Raw materials
|
$
|
3,902,152
|
$
|
3,299,372
|
||||
|
Work in process
|
38,617,984
|
32,926,480
|
||||||
|
Finished goods
|
1,631,088
|
1,204,396
|
||||||
|
$
|
44,151,224
|
$
|
37,430,248
|
|||||
19
As of June 30, 2012 and December 31, 2011, the Company did not have any provision for inventory in regards to slow moving or obsolete items.
(8) Property and Equipment, net
As of June 30, 2012 and December 31, 2011, property and equipment consisted of the following:
|
June 30,
2012
(unaudited)
|
December 31,
2011
|
|||||||
|
Building
|
$
|
26,259,432
|
$
|
26,241,768
|
||||
|
Machinery and equipment
|
22,690,201
|
22,670,300
|
||||||
|
Motor vehicles
|
33,054
|
33,054
|
||||||
|
48,982,687
|
48,945,122
|
|||||||
|
Less: accumulated depreciation
|
13,239,934
|
12,225,527
|
||||||
|
$
|
35,742,753
|
$
|
36,719,595
|
|||||
For the three months ended June 30, 2012 and 2011, depreciation expenses amounted to $508,984 and $389,802, of which $505,745 and $389,347 was charged to cost of goods sold. For the six months ended June 30, 2012 and 2011, depreciation expenses amounted to $1,019,563 and $776,556, of which $1,013,356 and $775,732 was charged to cost of goods sold. As of June 30, 2012 and December 31, 2011, a net book value of $17,549,101 and $16,694,000, respectively, of property and equipment were used as collateral for the Company’s short-term loans.
Construction in progress consists of two projects as follows:
|
June 30,
2012
|
December 31, 2011
|
Estimated completion time
|
Expected capital needed to complete
|
|||||||||||||
|
(unaudited)
|
||||||||||||||||
|
Construction of factory
|
$ | 3,607,217 | $ | 3,427,962 |
Depends on testing
|
$ | 1,574,000 | |||||||||
|
Land improvements
|
3,911,423 | 2,792,489 | 2012 | 3,148,000 | ||||||||||||
| $ | 7,518,640 | $ | 6,220,451 | $ | 4,722,000 | |||||||||||
20
Construction in progress represents the costs incurred in connection with the construction of buildings or additions to the Company’s plant facilities and land improvements to the property adjacent to our plant. No depreciation is provided for construction in progress until such time as the assets are completed and placed into service. Construction in progress in the amount of $0 was transferred to fixed assets during the six months ended June 30, 2012.
(9) Land Use Rights
Land use rights are amortized over 50 years. As of June 30, 2012 and December 31, 2011, land use rights consisted of the following:
|
June 30, 2012
(unaudited)
|
December 31, 2011
|
|||||||
|
Land Use Rights
|
$
|
11,135,130
|
$
|
11,371,230
|
||||
|
Less: Accumulated amortization
|
775,476
|
672,171
|
||||||
|
$
|
10,359,654
|
$
|
10,699,059
|
|||||
For the three months ended June 30, 2012 and 2011, amortization expenses were $46,826 and $47,153, respectively. For the six months ended June 30, 2012 and 2011, amortization expenses were $103,830 and $93,754, respectively.
As of June 30, 2012, all land use rights were pledged as collateral for short-term bank loans.
(10) Stockholders’ equity
Restated Articles of Incorporation
On January 22, 2008, the Company changed its authorized capital stock to 120,000,000 shares of capital stock, of which 20,000,000 shares are shares of preferred stock, par value $0.001 per share, and 100,000,000 shares are shares of common stock, par value $0.001 per share. The restated articles of incorporation authorizes the board of directors of the Company to issue one or more series of preferred stock and to designate the rights, preferences, privileges and limitation of the holders of such preferred stock. The board of directors has authorized the issuance of two series of preferred stock, Series A Convertible Preferred Stock (“Series A Preferred Stock”) and Series B Convertible Preferred Stock (“Series B Preferred Stock”).
Issuance of Common Stock
(a) Conversion of Series A Preferred Stock
As of June 30, 2012 and December 31, 2011, no shares of Series A Preferred Stock are issued or outstanding.
21
(b) Conversion of Series B Preferred Stock
During the year ended December 31, 2011, the Company issued an aggregate of 736,389 shares of common stock to holders of Series B Preferred Stock upon the conversion of an aggregate of 798,890 shares of Series B Preferred Stock.
During the six months ended June 30, 2012, the Company issued an aggregate of 120,300 shares of common stock to holders of Series B Preferred Stock upon the conversion of an aggregate of 120,300 shares of Series B Preferred Stock. The remaining 305,810 Series B Preferred Stock are redeemable by the holder as of June 30, 2012. The Company has reclassified these shares into Temporary Equity as of June 30, 2012.
(c) Exercise of Warrants
On January 19, 2011, the Company issued 45,833 shares of common stock to First Trust Group, Inc. upon the cashless exercise of 100,000 warrants at an exercise price of $2.34 per share. On January 24, 2011, the Company issued 124,025 shares of common stock to Maxim Group LLC upon exercise of warrants at an exercise price of $1.32 per share. On February 7, 2011, the Company issued 160,000 shares of common stock to Silver Rock II, Ltd. upon exercise of warrants at an exercise price of $1.30 per share.
On March 29, 2010 and April 1, 2010, the Company issued an aggregate of 28,000 shares of common stock to holders of Series B Preferred Stock upon exercise of warrants at an exercise price of $1.30 per share and 100,000 shares of common stock upon exercise of warrants at an exercise price of $1.30 per share.
As of June 30, 2012, there are total 1,229,200 shares warrants outstanding.
(d) Stock Issuances for Cash
On July 14, 2011, the Company issued an aggregate of 250,000 shares of common stock at a price of $0.64 per share to unrelated parties to raise money for the Company’s operations.
On January 12, 2012, the Company issued 320,000 shares of common stock at a price of $0.50 per share to unrelated parties to raise money for the Company’s operations.
On March 8, 2012, the Company issued 100,000 shares of common stock at a price of $0.50 per share to unrelated parties to raise money for the Company’s operations.
On April 10, 2012, the Company issued 200,000 shares of common stock at a price of $0.50 per share to unrelated parties to raise money for the Company’s operations.
On May 9, 2012, the Company issued 200,000 shares of common stock at a price of $0.56 per share to unrelated parties to raise money for the Company’s operations.
22
On May 9, 2012, the Company issued 100,000 shares of common stock at a price of $0.50 per share to unrelated parties to raise money for the Company’s operations.
(e) Stock Issuances to Consultants
In April 2010, the Company issued an aggregate of 420,000 shares of common stock pursuant to three consulting agreements in exchange for consulting and investor relations services. A fair value of $659,400 was recorded. As of June 30, 2012, these consulting expenses were fully amortized.
In December 2010, the Company issued 90,000 shares of common stock to ChangeWave, Inc. in exchange for consulting and investor relations services.
During the first quarter of 2011, the Company issued an aggregate of 620,000 shares of common stock pursuant to three consulting agreements in exchange for consulting and investor relations services. A fair value of $1,240,100 was recorded for the consulting expenses relating to all three agreements, with the consulting expenses being amortized over one year for two agreements and one and a half years for the third agreement. $87,850 and $266,100 was amortized and recognized as a general and administrative expense for the six months ended June 30, 2012 and 2011, respectively. $175,700 and $532,200 was amortized and recognized as a general and administrative expense for the six months ended June 30, 2012 and 2011, respectively. As of June 30, 2012, these consulting expenses were fully amortized.
During the second quarter of 2011, the Company issued 365,000 shares of common stock pursuant to a consulting agreement in exchange for consulting and investor relations services. A fair value of $547,500 was recorded for the consulting expenses and amortized over one and a half years. $91,250 and $91,250 was amortized and recognized as a general and administrative expense for the three months ended June 30, 2012 and 2011, respectively. $182,500 and $91,250 was amortized and recognized as a general and administrative expense for the six months ended June 30, 2012 and 2011, respectively. As of June 30, 2012, $91,250 remained to be amortized and was recorded as a prepaid expense.
In April 2012, the Company issued an aggregate of 110,000 shares of common stock pursuant to a consulting agreement in exchange for investor relations services. A fair value of $96,800 was recorded for the expenses and amortized over one year. $16,133 was amortized and recognized as a general and administrative expense for the three and six months ended June 30, 2012. As of June 30, 2012, $80,667 remained to be amortized and was recorded as a prepaid expense.
In June 2012, the Company issued an aggregate of 100,000 shares of common stock pursuant to a consulting agreement in exchange for investor relations services. A fair value of $57,000 was recorded for the consulting expenses and amortized over four months. $0 was amortized and recognized as a general and administrative expense for the three and six months ended June 30, 2012. As of June 30, 2012, $57,000 remained to be amortized and was recorded as a prepaid expense.
23
(f) Other Stock Issuances
On November 29, 2011, we issued an aggregate of 100,000 shares of common stock to four directors as compensation for services. On November 29, 2011, we issued 60,000 shares of common stock to an employee. The issuance of these shares was recorded at fair market value, or $104,000.
(g) Shares Held in Escrow
In a private placement that closed on December 22, 2009 and January 13, 2010, the Company sold an aggregate of 2,480,500 shares of Series B Preferred Stock and five-year warrants to purchase 992,000 shares of common stock at an exercise price of $1.30 per share, for an aggregate purchase price of $2,976,600. The Company also paid the private placement agent an aggregate of $298,000 and issued five-year warrants to purchase 124,025 shares of common stock at an exercise price of $1.32 per share. In connection with the private placement and pursuant to the transaction agreements, the Company deposited into escrow an aggregate of 1,240,250 shares of common stock, which are to be held in escrow to be returned to the Company or delivered to the investors, depending on whether the Company meets certain financial performance targets for the years ending December 31, 2010 and December 31, 2011.
The Company did not meet the financial targets. The number of Escrow Shares payable to each Investor shall be equal to a fraction of the total number of Escrow Shares potentially issuable pursuant to the terms hereof, the numerator of which shall be the amount by which (i) the number of Conversion Shares issued or issuable upon Preferred Shares which was initially issued to the Investor exceeds (ii) the sum of (x) the number of Conversion Shares sold or otherwise transferred by the Investor plus (y) the number of shares of Conversion Shares issued or issuable sold or otherwise transferred by the Investor, and the denominator of which is the number of Conversion Shares issued or issuable by the Company in the Offering. Any Escrow Shares for either Fiscal Year 2011 or Fiscal Year 2010 which are not transferred to the Investors pursuant to this paragraph shall be returned to the Company for cancellation. As of June 30, 2012, no Escrow shears have been transferred to investors or returned to the Company.
Dividend Distribution for Series B Preferred Stock
Pursuant to the terms of a private placement that closed on December 22, 2009 and January 13, 2010, the Series B Preferred Stock offers a 6% dividend. The preferred stock dividend is payable quarterly commencing April 1, 2010. As a result, we declared a dividend for the Series B Preferred Stock in the amount of $37,742 as of June 30, 2012, compared to $28,099 as of December 31, 2011. For the three months ended June 30, 2012 and 2011, we paid $0 and $6,985, respectively, in cash for dividends declared. For the six months ended June 30, 2012 and 2011, we paid $0 and $15,114, respectively, in cash for dividends declared.
24
(11) Amount Due to a Related Party
As of June 30, 2012 and December 31, 2011, we had related party notes payable in the amount of $5,432,675 and $5,542,855, respectively, to Mr. Dengyong Jin, who is General Manager of our China operations and chief executive officer and principal shareholder of Xingyong. These amounts are not due prior to June 30, 2013 and are made to the Company by Mr. Jin for business operating purposes. The advances are interest free, therefore the interest expenses of $129,806 and $221,733 calculated at an annual interest rate of 8.2% was recorded into additional paid in capital for the three and six months ended June 30, 2012.
(12) Loan from Unrelated Parties
During the first quarter of 2012, the Company obtained short term borrowings of approximately $9,162,944 from three unrelated parties. The loans were all repaid by June 30, 2012. The interest rate is 8% and interest expenses of $185,610 was accrued as of June 30, 2012. The loans are unsecured.
(13) Short-term Bank Loans
As of June 30, 2012 and December 31, 2011, short-term loans consisted of the following:
|
June 30, 2012
(unaudited)
|
December 31, 2011
|
|||||||
|
Bank loan from China Everbright Bank, dated July 11, 2011, due and repaid on July 11, 2012, with an annual interest rate of 8.528% payable quarterly, secured by property and equipment and land use rights
|
$
|
6,296,000
|
$
|
6,296,000
|
||||
|
Bank loan from China Construction Bank, dated January 10, 2012, due January 11, 2013, with an annual interest rate of 6.56% payable quarterly, secured by property and equipment and land use rights
|
$
|
4,722,000
|
$
|
4,722,000
|
||||
|
Bank loan from China Construction Bank, dated August 27, 2011, due August 28, 2012, with an annual interest rate of 6.56% payable quarterly, secured by land use rights
|
$
|
6,296,000
|
$
|
6,296,000
|
||||
|
Bank loan from China Construction Bank, dated August 13, 2011, due August 14, 2012, with an annual interest rate of 6.56% payable quarterly, secured by land use rights
|
$
|
6,296,000
|
$
|
6,296,000
|
||||
|
Bank loan from China Construction Bank, dated June 6, 2012, due June 5, 2013 with an annual interest rate of 9.184% payable quarterly, secured by land use rights
|
$
|
6,296,000
|
$
|
6,296,000
|
||||
|
Bank loan from China Construction Bank, dated September 26, 2011, due September 27, 2012 with an annual interest rate of 6.56% payable quarterly, secured by land use rights
|
$
|
8,814,400
|
$
|
8,814,400
|
||||
|
Bank loan from Huaxia Bank, dated June 14, 2011, due and repaid on June 14, 2012, with an annual interest rate of 8.203% payable quarterly, secured by equipment and land use rights
|
$
|
-
|
$
|
5,509,000
|
||||
|
Bank loan from Credit Union, dated February 1, 2011, originally due in August 2012, repaid in April 2012, with an annual interest rate of 13.66% payable monthly, secured by guarantee from major shareholder’s wife
|
$
|
-
|
$
|
1,259,200
|
||||
|
$
|
38,720,400
|
$
|
45,488,600
|
|||||
Each of these loans is renewable at the lender’s discretion. As of June 30, 2012, all land use rights and certain property and equipment were pledged as collateral for our short-term bank loans.
Interest expenses were $1,220,173 and $693,274 for the three months ended June 30, 2012 and 2011, respectively. Interest expenses were $2,449,918 and $1,406,804 for the six months ended June 30, 2012 and 2011, respectively.
The weighted average interest rates for these loans were 7.31% and 6.73% as of June 30, 2012 and December 31, 2011, respectively.
There was no capitalized interest for the six months ended June 30, 2012 and 2011.
(14) Subsequent events
In accordance with ASC 855, Subsequent Events, which establishes general standards of accounting for and disclosure of events that occur after the balance sheet date but before financial statements are issued, the Company has evaluated events and transactions for potential recognition or disclosure through the reporting date, the date the financial statements were available to be issued and disclose the following.
25
|
Item 2.
|
Management’s Discussion and Analysis of Financial Condition and Results of Operations.
|
This quarterly report on Form 10-Q contains forward-looking statements. These statements involve known and unknown risks, uncertainties and other factors which may cause our actual results, performance or achievements to be materially different from any future results, performances or achievements expressed or implied by the forward-looking statements. These risks and uncertainties include, but are not limited to, the factors described in the section captioned “Risk Factors” in our Annual Report on Form 10-K for the year ended December 31, 2011 filed with the Securities and Exchange Commission.
In some cases, you can identify forward-looking statements by terms such as “anticipates,” “ believes,” “could,” “estimates,” “expects,” “intends,” “may,” “plans,” “potential,” “predicts,” “projects,” “should,” “would” and similar expressions intended to identify forward-looking statements. Forward-looking statements reflect our current views with respect to future events and are based on assumptions and subject to risks and uncertainties. Given these uncertainties, undue reliance should not be placed on these forward-looking statements.
Also, forward-looking statements represent our estimates and assumptions only as of the date of this report. This Annual Report should be read in its entirety and with the understanding that our actual future results may be materially different from what we expect.
Except as required by law, we assume no obligation to update any forward-looking statements publicly, or to update the reasons actual results could differ materially from those anticipated in any forward-looking statements, even if new information becomes available in the future.
Overview
We are engaged in the manufacture of graphite-based products in the PRC. Our products are used in the manufacturing process of other products, particularly non-ferrous metals and steel, and are incorporated in various types of products or processes, such as atomic reactors. We currently manufacture and sell primarily the following types of graphite products:
|
o
|
graphite electrodes;
|
|
o
|
fine grain graphite; and
|
|
o
|
high purity graphite.
|
Based on information we receive about our industry in the course of our business, we believe that we are the largest wholesale supplier of fine grain graphite and high purity graphite in China and one of China’s largest producers and suppliers of graphite products overall. Approximately 40% of our products are sold directly to end users in China, primarily consisting of steel manufacturers. All other sales are made to over 200 distributors located throughout 22 provinces in China. Our distributors then sell our products to end users both in China and in foreign countries, including, among others, Japan, the United States, Spain, England, South Korea and India. In the three and six months ended June 30, 2012, our profits improved from 2011 due to a focus on selling higher profit products, which shows an increase in demand for our high end products, resulted from improved market conditions, increased sales prices and an increase in our production capacity, as discussed in greater detail below under the heading “Results of Operations.”
The steel industry started to recover in 2010, in particular since the third quarter of 2010. Our revenues, gross profits and gross margins improved significantly during the second half of 2010, which continued into the end of 2011. Since the first quarter of 2012, our revenues decreased while our gross margin increased due to our strategy to focus on high profit products. Our gross margin for the three months ended June 30, 2012 was 24.4%, compared to 22.1% for the three months ended June 30, 2011. Our gross margin for the six months ended June 30, 2012 was 26.5%, compared to 22.3% for the six months ended June 30, 2011.
26
We are constructing a new production plant that will specialize in manufacturing high margin products including large size ultra-high power graphite electrodes, high purity graphite and fine gain graphite. We installed a 4200-ton compressor and 36 annular kilns, which we have completed testing. The 4200-ton compressor began trial production in October 2011, and the 36 annular kilns began trial production in August 2011. In addition, the new baking plant will have 36 furnaces, totaling 160 meters in length. The new plant will manufacture a new product, ultra-high power graphite electrodes with a diameter ranging from 600 to 800 millimeters, along with existing fine grain and high purity graphite products. The industrial applications of the products to be manufactured in the new facility include aerospace, defense, automotive and clean tech end products, which currently carries the greatest demand for all forms of graphite. We believe that this expansion will make us China’s first domestic producer of 800 millimeter diameter ultra-high power electrodes and will further strengthen the Company’s leading position in China’s fine grain graphite market. After completion of the expansion, our annual production capacity will increased to 60,000 tons. The Company is currently operating at 75% production capacity of maximum of 30,000 tons annually.
The initial budgeted investment for the construction of our new facility was approximately $13.5 million in the aggregate, $10.0 million of which had been spent as of June 30, 2012.
Some of our expansion plans, including the expansion of our product offerings to include nuclear, solar and semiconductor products and pursuing an acquisition, would likely require us to obtain additional financing from equity or debt markets, or borrow additional funds from local banks. We currently have no commitments from any financing sources. There is no assurance that we will be able to raise any funds on terms favorable to us, or at all. In the event that we issue shares of equity or convertible securities, holdings of our existing stockholders would be diluted. In addition, there is no assurance that we will successfully manage and integrate the production and sale of new products.
At June 30, 2012, we had short-term bank loans of approximately $38.7 million. These bank loans, which are secured by liens on our fixed assets and land use rights, are due between July 2012 and June 2013, including approximately $32.4 million owed to the Construction Bank of China. During the six months ended June 30, 2012, the Company rolled over all of its short-term bank loans from the China Construction Bank. At June 30, 2012, our cash reserves, including restricted cash, were $12.1 million and are insufficient to pay off all of our loans when due.
We purchase all of our raw materials from domestic Chinese suppliers. We make advance deposits to suppliers with available cash to lock in prices. As of June 30, 2012 and December 31, 2011, we advanced to suppliers $2,410,409 and $5,921,970, respectively. The average prices for our products have been increasing since January 2011. In particular, prices for fine grain graphite and high purity graphite products have notably increased in line with the increased raw material cost.
27
In times of decreasing prices, we may have to sell our products at prices, which are lower than the prices at which we purchased our raw materials. Furthermore, PRC regulations grant broad powers to the government to adjust the price of raw materials and manufactured products. Although the government has not imposed price controls on our raw materials or our products, it is possible that price controls may be implemented in the future, thereby affecting our results of operations and financial condition.
Results of Operations
Three months ended June 30, 2012 and 2011
The following table sets forth the results of our operations for the periods indicated in U.S. dollars and as a percentage of net sales (dollars in thousands):
|
Three months ended June 30,
|
||||||||||||||||
|
2012
|
2011
|
|||||||||||||||
|
Sales
|
$
|
11,878
|
100.0
|
%
|
$
|
12,145
|
100.0
|
%
|
||||||||
|
Cost of goods sold
|
8,985
|
75.6
|
%
|
9,457
|
77.9
|
%
|
||||||||||
|
Gross profit
|
2,892
|
24.4
|
%
|
2,688
|
22.1
|
%
|
||||||||||
|
Operating expenses
|
||||||||||||||||
|
Selling expenses
|
29
|
0.2
|
%
|
57
|
0.5
|
%
|
||||||||||
|
General and administrative
|
1,170
|
9.9
|
%
|
1, 050
|
8.6
|
%
|
||||||||||
|
Depreciation and amortization
|
47
|
0.4
|
%
|
47
|
0.4
|
%
|
||||||||||
|
Income from operations
|
1,646
|
13.9
|
%
|
1,534
|
12.6
|
%
|
||||||||||
|
Other income
|
215
|
1.8
|
%
|
16
|
0.1
|
%
|
||||||||||
|
Other expense
|
(215
|
)
|
(1.8
|
)%
|
(1
|
)
|
0.0
|
%
|
||||||||
|
Change in fair value of warrants
|
446
|
3.8
|
%
|
27
|
0.2
|
%
|
||||||||||
|
Interest expense
|
(1,220
|
)
|
(10.3
|
)%
|
(693
|
)
|
(5.7
|
)%
|
||||||||
|
Income before income tax expense
|
871
|
7.3
|
%
|
882
|
7.3
|
%
|
||||||||||
|
Net income
|
871
|
7.3
|
%
|
882
|
7.3
|
%
|
||||||||||
|
Dividend
|
(5
|
)
|
(0.0
|
)%
|
(7
|
)
|
(0.1
|
)%
|
||||||||
|
Net income available to common shareholders
|
867
|
7.3
|
%
|
875
|
7.2
|
%
|
||||||||||
|
Foreign currency translation adjustment
|
(434
|
)
|
(3.7
|
)%
|
553
|
4.6
|
%
|
|||||||||
|
Total comprehensive income
|
$
|
437
|
3.7
|
%
|
$
|
1,436
|
11.8
|
%
|
||||||||
28
Sales.
During the three months ended June 30, 2012, we had sales of $11,877,543, compared to sales of $12,145,024 for the three months ended June 30, 2011, a decrease of $267,481, or approximately 2.2%. Sales decrease was mainly attributable to a slight decrease of $424,116 in the sales for our low end graphite electrodes products during the three months ended June 30, 2012, which resulted from the Company’s decision in focusing in manufacturing and selling higher margin products. The average unit selling price of our products increased 6% during the three months ended June 30, 2012, compared to the same period for the three months ended June 30, 2011, offset by the 10% decrease in tonnage sold for the period. The average unit selling price of high purity graphite products increased 8% during the three months ended June 30, 2012, compared to the same period for the three months ended June 30, 2011, offset by the 7% decrease in tonnage sold for the period. The increase in the average unit selling price of high purity graphite is mainly due to increase in the cost for raw materials. The decrease in tonnage sold is due to less orders from certain customers due to price increases and slight dip in the Chinese construction industry. The main reason for our lower sales was due to the average unit selling price of graphite electrodes products decreased 14% combined with a 12% decrease in tonnage sold during the three months ended June 30, 2012, compared to the same period for the three months ended June 30, 2011. The decrease in the average unit selling price and tonnage sold of graphite electrodes products is mainly due to decreased demand on the lower end products.
The breakdown of revenues for each of graphite electrodes, fine grain graphite and high purity graphite, during the three months ended June 30, 2012 and 2011, respectively, was as follows:
|
June 30, 2012
Sales
|
% of Total
Sales
|
June 30, 2011
Sales
|
% of Total
Sales
|
|||||||||||||
|
Graphite Electrodes
|
$
|
1,497,743
|
12.6
|
%
|
$
|
1,921,859
|
15.8
|
%
|
||||||||
|
Fine Grain Graphite
|
5,307,387
|
44.7
|
%
|
5,277,894
|
43.5
|
%
|
||||||||||
|
High Purity Graphite
|
4,902,424
|
41.3
|
%
|
4,758,181
|
39.2
|
%
|
||||||||||
|
Others (1)
|
169,989
|
1.4
|
%
|
187,090
|
1.5
|
%
|
||||||||||
|
Total
|
$
|
11,877,543
|
100.0%
|
$
|
12,145,024
|
100.0%
|
||||||||||
(1) “Other” sales represent revenue generated by sales of semi-processed products and other types of products.
Cost of goods sold; gross margin .
Our cost of goods sold consists of the cost of raw materials, utilities, labor, and depreciation expenses in our manufacturing facilities. During the three months ended June 30, 2012, our cost of goods sold was $8,985,125, compared to $9,456,762 for the cost of goods sold for the three months ended June 30, 2011, a decrease of $471,637, or approximately 5.0%. The decrease in the cost of sales was directly associated with the decrease in our sales. Our gross margin increased from 22.1% for the three months ended June 30, 2011 to 24.4% for the three months ended June 30, 2012. This increase reflects the variance in our product mix, which is attributable to an increase of percentage in our sales of fine grain graphite products and high purity graphite products (higher margin products compared to graphite electrodes and other products).
Operating expenses.
Operating expenses totaled $1,246,440 for the three months ended June 30, 2012, compared to $1,154,130 for the three months ended June 30, 2011, an increase of $92,310, or approximately 8.0%.
29
Selling, general and administrative expenses
Selling expenses decreased from $57,312 for the three months ended June 30, 2011 to $29,152 for the three months ended June 30, 2012, a decrease of $28,160, or 49.1%. The decrease was in line with lower sales during the three months ended June 30, 2012 as compared to the three months ended June 30, 2011.
Our general and administrative expenses consist of salaries, office expenses, utilities, business travel, amortization expenses, public company expenses (including legal expenses, accounting expenses and investor relations expenses) and stock compensation. General and administrative expenses were $1,170,462 for the three months ended June 30, 2012, compared to $1,049,666 for the three months ended June 30, 2011, an increase of $120,796, or 11.5%. The increase in general and administrative expenses was due to increased salary expenses ,amortization expenses and insurance expenses offset by decreased consulting expenses and decreased property tax expense for the three months ended June 30, 2012 compared to the three months ended June 30, 2011. The Company appropriately accrued property tax for the fiscal ended December 31, 2011 for all owned land regardless of the purpose of the land. However, in 2012, the government exempted property taxes related to land used that was used for planting green plants and not used for business operations. Therefore, as of June 30, 2012, the Company reversed the property tax expenses that were previously accrued and subsequently exempted. The Company treated the update as a change in accounting estimate. The Company incurred $195,233 and $357,350 for stock based compensation during the three months ended June 30, 2012.
Depreciation and amortization expenses
Depreciation and amortization expenses totaled $555,359 for the three months ended June 30, 2012, compared to $436,955 for the three months ended June 30, 2011, an increase of $118,404, or approximately 27.1%. For the three months ended June 30, 2012, depreciation and amortization was allocated between costs of goods sold and selling, general and administrative expenses in the amounts $508,533 and $46,826, respectively. For the three months ended June 30, 2011, depreciation and amortization was allocated between costs of goods sold and selling, general and administrative expenses in the amounts $389,803 and $47,152, respectively. The increase in depreciation and amortization expenses is a result of additional fixed assets placed in service during 2011.
Income from operations.
As a result of the factors described above, operating income was $1,645,978 for the three months ended June 30, 2012, compared to $1,534,132 for the three months ended June 30, 2011, an increase of approximately $111,846, or 7.3%.
30
Other income and expense.
Our interest expense was $1,220,173 for the three months ended June 30, 2012, compared to $693,274 for the three months ended June 30, 2011, reflecting increased interest payments on loans from banks. We used the bank loans to secure additional inventory and to make advanced payments to our suppliers. Other expense, which mainly consisted of fees paid to the government for gardening, was $215,468 for the three months ended June 30, 2012, compared to $765 for the three months ended June 30, 2011. Other income, which consisted of government grants, was $215,190 for the three months ended June 30, 2012, compared to $15,670 for the three months ended June 30, 2011. Income from changes in the fair value of our warrants was $445,763 for the three months ended June 30, 2012, compared to $26,540 for the three months ended June 30, 2011.
Income tax.
During the three months ended June 30, 2012 and 2011, we benefited from a 100% tax holiday from the PRC enterprise tax. As a result, we had no income tax due for these periods. The enterprise income tax at the statutory rates would have been approximately $133,115 and $232,435, respectively, for the three months ended June 30, 2012 and 2011 without consideration of adjustments on taxable income. The tax holiday is from 2008 through 2017.
Net income.
As a result of the factors described above, our net income for the three months ended June 30, 2012 was $871,311, compared to $882,303 for the three months ended June 30, 2011, a decrease of $10,992, or 1.2%.
Foreign currency translation.
Our financial statements are expressed in U.S. dollars but the functional currency of our operating subsidiary is RMB. Results of operations and cash flows are translated at average exchange rates during the period, assets and liabilities are translated at the unified exchange rate at the end of the period and equity is translated at historical exchange rates. Translation adjustments resulting from the process of translating the financial statements denominated in RMB into U.S. dollars are included in determining comprehensive income. Our foreign currency translation gain for the three months ended June 30, 2012 was $(433,954) compared to $553,200 for the three months ended June 30, 2011, a decrease of $987,154, or 178.4%.
Dividend expense.
Pursuant to the terms of a private placement that closed on December 22, 2009 and January 13, 2010, the Series B Preferred Stock offers a 6% dividend. The preferred stock dividend is payable quarterly commencing April 1, 2010. As a result, we incurred dividend expenses of $4,625 and $6,985 for the three months ended June 30, 2012 and 2011, respectively.
Net income available to common stockholders.
Net income available to our common stockholders was $866,686, or $0.04 per share (basic and diluted), for the three months ended June 30, 2012, compared to $875,318, or $0.04 per share (basic and diluted), for the three months ended June 30, 2011.
31
Six months ended June 30, 2012 and 2011
The following table sets forth the results of our operations for the periods indicated in U.S. dollars and as a percentage of net sales (dollars in thousands):
|
Six months ended June 30,
|
||||||||||||||||
|
2012
|
2011
|
|||||||||||||||
|
Sales
|
$
|
21,939
|
100.0
|
%
|
$
|
23,608
|
100.0
|
%
|
||||||||
|
Cost of goods sold
|
16,129
|
73.5
|
%
|
18,340
|
77.7
|
%
|
||||||||||
|
Gross profit
|
5,810
|
26.5
|
%
|
5,268
|
22.3
|
%
|
||||||||||
|
Operating expenses
|
||||||||||||||||
|
Selling expenses
|
76
|
0.3
|
%
|
107
|
0.5
|
%
|
||||||||||
|
General and administrative
|
2,022
|
9.2
|
%
|
2,604
|
11.0
|
%
|
||||||||||
|
Depreciation and amortization
|
104
|
0.5
|
%
|
94
|
0.4
|
%
|
||||||||||
|
Income from operations
|
3,608
|
16.4
|
%
|
2,464
|
10.4
|
%
|
||||||||||
|
Other income
|
215
|
1.0
|
%
|
77
|
0.3
|
%
|
||||||||||
|
Other expense
|
(215
|
)
|
(1.0
|
)%
|
(1
|
)
|
0.0
|
%
|
||||||||
|
Change in fair value of warrants
|
(34
|
)
|
(0.2
|
)%
|
83
|
0.4
|
%
|
|||||||||
|
Interest expense
|
(2,450
|
)
|
(11.2
|
)%
|
(1,407
|
)
|
(6.0
|
)%
|
||||||||
|
Income before income tax expense
|
1,124
|
5.1
|
%
|
1,215
|
5.1
|
%
|
||||||||||
|
Net income
|
1,124
|
5.1
|
%
|
1,215
|
5.1
|
%
|
||||||||||
|
Dividend
|
(10
|
)
|
(0.0
|
)%
|
18
|
(0.1
|
)%
|
|||||||||
|
Net income available to common shareholders
|
1,115
|
5.1
|
%
|
1,233
|
5.2
|
%
|
||||||||||
|
Foreign currency translation adjustment
|
(10
|
)
|
(0.0
|
)%
|
821
|
3.5
|
%
|
|||||||||
|
Total comprehensive income
|
$
|
1,114
|
5.1
|
%
|
$
|
2,037
|
8.6
|
%
|
||||||||
Sales.
During the six months ended June 30, 2012, we had sales of $21,938,753, compared to sales of $23,608,359 for the six months ended June 30, 2011, a decrease of $1,669,606, or approximately 7.1%. Sales decrease was mainly attributable to a significant decrease of $1,078,146 in the sales for our low end graphite electrodes products during the six months ended June 30, 2012, which resulted from the company’s decision in focusing in manufacturing and selling higher margin products. The average unit selling price of our products increased 26% during the six months ended June 30, 2012, compared to the same period for the six months ended June 30, 2011, offset by a 29% decrease in tonnage sold during the period. The average unit selling price of high purity graphite products increased 28% during the six months ended June 30, 2012, compared to the same period ended June 30, 2011, offset by a 25% decrease in tonnage sold during the period. The increase in the average unit selling price of high purity graphite is due to an increase in the cost for raw materials. The decrease in tonnage sold is due to less orders from certain customers due to price increases and slight dip in the Chinese construction industry.. The main reason for our lower sales was due to the average unit selling price of graphite electrodes products decreased 7% combined with a 26% decrease in tonnage sold during the six months ended June 30, 2012, compared to the same period ended June 30, 2011. The decrease in average unit selling price and tonnage sold of graphite electrodes is due to decreased demand for lower end products.
32
The breakdown of revenues for each of graphite electrodes, fine grain graphite and high purity graphite, during the six months ended June 30, 2012 and 2011, respectively, was as follows:
|
June 30, 2012
Sales
|
% of Total
Sales
|
June 30, 2011
Sales
|
% of Total
Sales
|
|||||||||||||
|
Graphite Electrodes
|
$
|
2,645,516
|
12.0
|
%
|
$
|
3,723,662
|
15.8
|
%
|
||||||||
|
Fine Grain Graphite
|
9,776,198
|
44.6
|
%
|
9,993,158
|
42.3
|
%
|
||||||||||
|
High Purity Graphite
|
9,260,948
|
42.2
|
%
|
9,395,314
|
39.8
|
%
|
||||||||||
|
Others (1)
|
256,091
|
1.2
|
%
|
496,225
|
2.1
|
%
|
||||||||||
|
Total
|
$
|
21,938,753
|
100.0%
|
$
|
23,608,359
|
100.0%
|
||||||||||
(1) “Other” sales represent revenue generated by sales of semi-processed products and other types of products.
Cost of goods sold; gross margin .
Our cost of goods sold consists of the cost of raw materials, utilities, labor, and depreciation expenses in our manufacturing facilities. During the six months ended June 30, 2012, our cost of goods sold was $16,128,731, compared to $18,340,023 for the cost of goods sold for the six months ended June 30, 2011, a decrease of $2,211,292, or approximately 12.1%. The decrease in the cost of sales was directly associated with a decrease in our sales. Our gross margin increased from 22.3% for the six months ended June 30, 2011 to 26.5% for the six months ended June 30, 2012. This increase reflects the variance in our product mix, which is attributable to an increase of percentage in our sales of fine grain graphite products and high purity graphite products (higher margin products compared to graphite electrodes and other products).
Operating expenses.
Operating expenses totaled $2,201,641 for the six months ended June 30, 2012, compared to $2,804,657 for the six months ended June 30, 2011, a decrease of $603,016, or approximately 21.5%.
Selling, general and administrative expenses
Selling expenses decreased from $107,175 for the six months ended June 30, 2011 to $75,950 for the six months ended June 30, 2012, a decrease of $31,225, or 29.1%. The decrease was in line with lower sales during the six months ended June 30, 2012 as compared to the six months ended June 30, 2011.
Our general and administrative expenses consist of salaries, office expenses, utilities, business travel, amortization expenses, public company expenses (including legal expenses, accounting expenses and investor relations expenses) and stock compensation. General and administrative expenses were $2,021,861 for the six months ended June 30, 2012, compared to $2,603,728 for the six months ended June 30, 2011, a decrease of $581,867, or 22.3%. The decrease in general and administrative expenses was mainly due to decreased property tax expenses for the six months ended June 30, 2012 compared to the six months ended June 30, 2011. The company appropriately accrued property tax for the fiscal year ended December 31, 2011 for all owned land regardless of the purpose of the land. However, in 2012, at the completion of the construction on the land, the government exempted property taxes related to land used that was used for planting green plants and not used for business operations. Therefore, as of June 30, 2012, the company reversed the property tax expenses that were previously accrued and subsequently exempted. The company treated the update as a change in accounting estimate. The company incurred $374,333 and $623,450 for consulting expenses during the six months ended June 30, 2012.
33
Depreciation and amortization expenses
Depreciation and amortization expenses totaled $1,360,692 for the six months ended June 30, 2012, compared to $870,310 for the six months ended June 30, 2011, an increase of $490,382, or approximately 56.3%. For the six months ended June 30, 2012, depreciation and amortization was allocated between costs of goods sold and selling, general and administrative expenses in the amounts $1,256,862 and $103,830, respectively. For the six months ended June 30, 2011, depreciation and amortization was allocated between costs of goods sold and selling, general and administrative expenses in the amounts $776,556 and $93,754, respectively. The increase in depreciation and amortization expenses is a result of additional fixed assets placed in service during 2011.
Income from operations.
As a result of the factors described above, operating income was $3,608,381, for the six months ended June 30, 2012, compared to $2,463,679 for the six months ended June 30, 2011, an increase of approximately $1,114,702, or 46.5%.
Other income and expenses.
Our interest expense was $2,449,918 for the six months ended June 30, 2012, compared to $1,406,804 for the six months ended June 30, 2011, reflecting increased interest payments on loans from banks. We used the bank loans to secure additional inventory and to make advanced payments to our suppliers. Other income, which consisted of government grants, was $215,190 for the six months ended June 30, 2012, compared to $76,550 for the six months ended June 30, 2011. Expenses from changes in the fair value of our warrants was $(33,800) for the six months ended June 30, 2012, compared to income of $82,692 for the six months ended June 30, 2011.
Income tax.
During the six months ended June 30, 2012 and 2011, we benefited from a 100% tax holiday from the PRC enterprise tax. As a result, we had no income tax due for these periods. The enterprise income tax at the statutory rates would have been approximately $298,317 and $359,760, respectively, for the six months ended June 30, 2012 and 2011 without consideration of adjustments on taxable income. The tax holiday is from 2008 through 2017.
34
Net income.
As a result of the factors described above, our net income for the six months ended June 30, 2012 was $1,124,428, compared to $1,215,351 for the six months ended June 30, 2011, a decrease of $90,923, or 7.5%.
Foreign currency translation.
Our financial statements are expressed in U.S. dollars but the functional currency of our operating subsidiary is RMB. Results of operations and cash flows are translated at average exchange rates during the period, assets and liabilities are translated at the unified exchange rate at the end of the period and equity is translated at historical exchange rates. Translation adjustments resulting from the process of translating the financial statements denominated in RMB into U.S. dollars are included in determining comprehensive income. Our foreign currency translation gain for the six months ended June 30, 2012 was $(10,057) compared to $821,448 for the six months ended June 30, 2011, an increase of $831,505, or 101.2%.
Dividend expense.
Pursuant to the terms of a private placement that closed on December 22, 2009 and January 13, 2010, the Series B Preferred Stock offers a 6% dividend. The preferred stock dividend is payable quarterly commencing April 1, 2010. As a result, we incurred dividend expenses of $9,643 and $17,882 for the six months ended June 30, 2012 and 2011, respectively.
Net income available to common stockholders.
Net income available to our common stockholders was $1,114,785, or $0.05 and $0.05 per share (basic and diluted), for the six months ended June 30, 2012, compared to $1,233,233, or $0.05 and $0.05 per share (basic and diluted), for the six months ended June 30, 2011.
Liquidity and Capital Resources
All of our business operations are carried out by Xingyong, and all of the cash generated by our operations has been held by that entity. In order to transfer such cash to our parent entity, China Carbon Graphite Group, Inc., which is a Nevada Corporation, we would need to rely on dividends, loans or advances made by our PRC subsidiaries or VIE entity. Such transfers may be subject to certain regulations or risks. To date, our parent entity has paid its expenses by raising capital through private placement transactions. In the future, in the event that our parent entity is unable to raise needed funds from private investors, Xingyong would have to transfer funds to our parent entity through our wholly-owned subsidiaries, Talent and Yongle.
PRC regulations relating to statutory reserves and currency conversion would impact our ability to transfer cash within our corporate structure. The Company Law of the PRC applicable to Chinese companies provides that net after tax income should be allocated by the following rules:
35
|
|
1.
|
10% of after tax income to be allocated to a statutory surplus reserve until the reserve amounts to 50% of the company’s registered capital.
|
|
|
2.
|
If the accumulate balance of statutory surplus reserve is not enough to make up the Company’s cumulative prior years’ losses, the current year’s after tax income should be first used to make up the losses before the statutory surplus reverse is drawn.
|
|
|
3.
|
Allocation can be made to the discretionary surplus reserve, if such a reserve is approved at the meeting of the equity owners.
|
Therefore, the Company is required to maintain a statutory reserve in China that limits any equity distributions to its shareholders. The maximum amount of the shareholders has not been reached. The company has never distributed earnings to shareholders and has consistently stated in the Company’s filings it has no intentions to do so.
The RMB is not freely convertible into Dollars. The State Administration of Foreign Exchange (“SAFE”) administers foreign exchange dealings and requires that they be conducted though designated financial institutions. Foreign Investment Enterprises, such as Xingyong, may purchase foreign currency from designated financial institutions in connection with current account transactions, including profit repatriation.
These factors will limit the amount of funds that we can transfer from Xingyong to our parent entity and may delay any such transfer. In addition, upon repatriation of earnings of Xingyong to the United States, those earnings may become subject to United States federal and state income taxes. We have not accrued any U.S. federal or state tax liability on the undistributed earnings of our foreign subsidiary because those funds are intended to be indefinitely reinvested in our international operations. Accordingly, taxes imposed upon repatriation of those earnings to the U.S. would reduce the net worth of the Company.
Our primary capital needs have been to fund our working capital requirements. Our primary sources of financing have been cash generated from short-term and long-term loans from banks in China, loans from an unrelated party and loans from a related party.
36
At June 30, 2012, we had short-term loans in the aggregate amount of $38,720,400 outstanding, as described below.
|
June 30, 2012
(unaudited)
|
December 31, 2011
|
|||||||
|
Bank loan from China Everbright Bank, dated July 11, 2011, due and repaid July 11, 2012, with an annual interest rate of 8.528% payable quarterly, secured by property and equipment and land use rights
|
$
|
6,296,000
|
$
|
6,296,000
|
||||
|
Bank loan from China Construction Bank, dated January 10, 2012, due January 11, 2013, with an annual interest rate of 6.56% payable quarterly, secured by property and equipment and land use rights
|
$
|
4,722,000
|
$
|
4,722,000
|
||||
|
Bank loan from China Construction Bank, dated August 27, 2011, due August 28, 2012, with an annual interest rate of 6.56% payable quarterly, secured by land use rights
|
$
|
6,296,000
|
$
|
6,296,000
|
||||
|
Bank loan from China Construction Bank, dated August 13, 2011, due August 14, 2012, with an annual interest rate of 6.56% payable quarterly, secured by land use rights
|
$
|
6,296,000
|
$
|
6,296,000
|
||||
|
Bank loan from China Construction Bank, dated June 6, 2012, due June 5, 2013, with an annual interest rate of 9.184% payable quarterly, secured by land use rights
|
$
|
6,296,000
|
$
|
6,296,000
|
||||
|
Bank loan from China Construction Bank, dated September 26, 2011, due September 27, 2012 with an annual interest rate of 6.56% payable quarterly, secured by land use rights
|
$
|
8,814,400
|
$
|
8,814,400
|
||||
|
Bank loan from Huaxia Bank, dated June 14, 2011, due June 14, 2012, with an annual interest rate of 8.203% payable quarterly, secured by equipment and land use rights
|
$
|
-
|
$
|
5,509,000
|
||||
|
Bank loan from Credit Union, dated February 1, 2011, due August 2012, with an annual interest rate of 13.66% payable monthly, secured by guarantee from major shareholder’s wife
|
$
|
-
|
$
|
1,259,200
|
||||
|
$
|
38,720,400
|
$
|
45,488,600
|
|||||
Historically we have rolled over our short-term loans on an annual basis. Although we believe that we will be able to obtain extensions of these loans when they mature, we cannot assure investors that such extensions will be granted. In the event repayment of the loans is not extended and we default on our obligations, the lenders could call the loans, foreclose on the collateral securing the loans or seek other remedies. In such an event, our operations and financial conditions would be materially adversely affected and we would be forced to cease operations if alternative funding is not obtained.
37
Despite a low amount of working capital, we are able to operate our business through bank financing, loans from related and unrelated parties and issuing equity in exchange for certain services provided. Our long-term goal is to continue to roll over short-term loans and obtain positive cash flows from collecting our outstanding accounts receivable and sales of inventory until our new facility is operating at full capacity. We have the ability to manage and predict our cash flow for inventory purchases and advances to suppliers because the length of the time it takes to complete purchase orders for customers, which on average is six months. Our customers must order products well in advance of productions, as a purchase order is fulfilled only six months after such order is placed, thereby allowing us to predict cash flow. We believe that increased market demand for our products and the increased production capacity, together with better management of our accounts receivable, inventory and advances to suppliers will produce a positive cash flow in future periods. During the interim, we expect that anticipated cash flows from future operations, short-term and long-term bank loans and loans from unrelated or related parties will be sufficient to fund our operations through at least the next twelve months, provided that:
|
o
|
We continue to generate sufficient business to generate substantial profits, which cannot be assured;
|
|
o
|
Our banks continue to provide us with the necessary working capital financing; and
|
|
o
|
We are able to generate savings by improving the efficiency of our operations.
|
We may require additional equity, debt or bank funding to finance acquisitions or to allow us to produce graphite for the nuclear industry, which is one of our primary growth strategies. We can provide no assurances that we will be able to enter into any additional financing agreements on terms favorable to us, if at all, especially considering the current global instability of the capital markets.
At June 30, 2012, cash and cash equivalents were $1,350,890, compared to $521,450 at December 31, 2011, an increase of $829,440. Restricted cash decreased to $10,703,200 as of June 30, 2012 from $11,694,820 as of December 31, 2011, which was restricted as a requirement by our lenders. Our working capital increased by $6,584,459 to $7,834,921 at June 30, 2012 from $1,250,462 at December 31, 2011.
As of June 30, 2012, accounts receivable, net of allowance, was $13,095,700, compared to $12,541,321 at December 31, 2011, an increase of $554,379, or 4.42%. The increase was due to slower collection of some outstanding receivables during the six months ended June 30, 2012. Accounts receivable are recorded at the invoiced amount and do not bear interest. Our management reviews the adequacy of our allowance for doubtful accounts on an ongoing basis, using historical collection trends and the aging of receivables. Management also periodically evaluates individual customer’s financial condition, credit history, and the current economic conditions to make adjustments in the allowance when it is considered necessary. The Company believes its allowance was sufficient as of June 30, 2012.
As of June 30, 2012, inventories were $44,151,224, compared to $37,430,248 at December 31, 2011, an increase of $6,720,976, or 17.96%. The increase in inventories is due to an increase in the cost of raw materials.
As of June 30, 2012, prepaid expenses were $234,917, compared to $452,730 at December 31, 2011, a decrease of $217,813, or 48.11%. The decrease in prepaid expenses is attributable to the amortization of various prepaid consulting fees paid from stock issuances.
Advances to suppliers decreased from $5,921,970 at December 31, 2011 to $2,410,409 at June 30, 2012, a decrease of $3,511,561. The decrease is because the Company has received a lot of advanced products by the end of June 30, 2012. No allowance for doubtful accounts was necessary for the balance of advances to suppliers.
38
Notes payable reflect our obligations to bank lenders who have guaranteed our future payment obligations as requested by certain of our suppliers. Notes payable increased from $16,763,100 to $17,786,200 from December 31, 2011 to June 30, 2012. The notes payable were secured by $10,703,200 of restricted cash at June 30, 2012. Notes payable allow the Company to reserve more cash resources for other operating expenses. Restricted cash represents amounts held by a bank as security for bank acceptance notes and is subject to withdrawal restrictions.
Accounts payable increased from $1,340,498 at December 31, 2011 to $3,866,990 at June 30, 2012, an increase of $2,526,492. The increase in accounts payable resulted from an increase in the purchase of inventories and other purchases as of June 30, 2012 because of an increase in raw material cost.
Six months ended June 30, 2012 Compared to Six months ended June 30, 2011
The following table sets forth information about our net cash flow for the three months indicated:
|
Cash Flows Data:
|
||||||||
|
For Six Months Ended June 30,
|
||||||||
|
2012
|
2011
|
|||||||
|
Net cash flows provided by (used in) operating activities
|
$
|
1,827,804
|
$
|
(3,167,845
|
)
|
|||
|
Net cash flows used in investing activities
|
$
|
(1,147,159
|
)
|
$
|
(2,486,609
|
)
|
||
|
Net cash flows provided by financing activities
|
$
|
152,980
|
$
|
9,386,928
|
||||
Net cash flow provided by operating activities was $1,827,804 for the six months ended June 30, 2012, compared to $3,167,845 net cash flow used in operating activities for the six months ended June 30, 2011, an increase of $4,995,649, or 157.7%. The increase in net cash flow provided by operating activities was mainly due to the use of our prepaid advances to suppliers of $4.4 million, the increase in accounts payable and accrued liabilities of $2.8 million due to raw material purchases and the increase in accounts receivable collections during the period of $3.8 million, offset by the increase of inventories of $2.6 million because of the increasing cost of raw materials and decreased advances from customers of $2.6 million.
Net cash flow used in investing activities was $1,147,159 for the six months ended June 30, 2012, compared to $2,486,609 for the six months ended June 30, 2011, a decrease of $1,339,450, or 53.9%. The decrease is mainly attributable to fewer payments for construction in process during the six months ended June 30, 2012 as there was more construction during the six months ended June 30, 2011. In the six months ended June 30, 2011, the Company was constructing a 4200-ton compressor and 36 annular kilns. The 4200-ton compressor began trial production in October 2011, and the 36 annular kilns began trial production in August 2011. For land improvements related to the property adjacent to the property, phase 1 is near completion, causing fewer payments during the period.
39
Net cash flow provided by financing activities was $152,980 for the six months ended June 30, 2012, compared to $9,386,928 net cash flow provided by financing activities for the six months ended June 30, 2011, a decrease of $9,233,948, or 98.4%. The decrease in net cash flow provided by financing activities was mainly due to the Company’s decreased need for new long-term debt and having sufficient funds from operations. For the six months ended June 30, 2011, the Company obtained a new long-term note payable in the amount of $10,410,800 and had positive cash inflow from short terms loans for $5,128,850, which was offset by a restricted cash balance of $6,491,440. For the six months ended June 30, 2012, the Company had positive cash flows from stock issuances of $470,000, additional long-term notes payable for $1,028,300 and a decrease in restricted cash of $996,660, offset by net repayments of short term loans of $2,088,240.
Concentration of Business and Credit Risk
Most of the Company’s bank accounts are in banks located in the PRC and are not covered by any type of protection similar to that provided by the Federal Deposit Insurance Corporation (“FDIC”) on funds held in U.S. banks. The Company’s bank account in the United States is covered by FDIC insurance.
Because the Company’s operations are located in the PRC, this may give rise to significant foreign currency risks due to fluctuations in and the volatility of foreign exchange rates between U.S. dollars and RMB.
Financial instruments that potentially subject the Company to concentration of credit risk consist principally of cash, trade accounts receivables and inventories, the balances of which are stated on the balance sheet. The Company places its cash in banks located in China. Concentration of credit risk with respect to trade accounts receivables is limited due to the diversity of the Company’s customers who are located in different regions of China. The Company does not require collateral or other security to support financial instruments subject to credit risk.
For the six months ended June 30, 2012, two customers accounted for 10% or more of sales revenues, representing 32.4%, and 24.9%, respectively of the total sales. For the six months ended June 30, 2011, two customers accounted for 10% or more of sales revenues, representing 34.0%, and 24.0%, respectively of the total sales. As of June 30, 2012, there were two customers that constituted 43.2%, and 26.3% of the accounts receivable. As of December 31, 2011, there were two customers that constituted 41.2% and 16.3% of the accounts receivable.
For the six months ended June 30, 2012, four suppliers accounted for 10% or more of our total purchases, representing 35.7%, 15.4%, 14.2% and 10.7%, respectively. For the six months ended June 30, 2011, three suppliers accounted for 10% or more of our total purchases, representing 45.0%, 19.0% and 10.2% of our total purchase, respectively.
40
Off-Balance Sheet Arrangements
We have not entered into any off-balance sheet arrangements.
Significant Accounting Estimates and Policies
The discussion and analysis of our financial condition and results of operations is based upon our financial statements that have been prepared in accordance with accounting principles generally accepted in the United States. The preparation of these financial statements requires us to make estimates and judgments that affect the reported amounts of assets and liabilities. On an ongoing basis, we evaluate our estimates including the allowance for doubtful accounts, the salability and recoverability of our products, income taxes and contingencies. We base our estimates on historical experience and on other assumptions that we believe to be reasonable under the circumstances, the results of which form our basis for making judgments about the carrying values of assets and liabilities that are not readily apparent from other sources. Actual results may differ from these estimates under different assumptions or conditions.
Revenue Recognition
We recognize revenue in accordance with ASC 605-25, Revenue Recognition, which states that revenue should be recognized when the following criteria are met: (1) persuasive evidence of an arrangement exists; (2) the service has been rendered; (3) the selling price is fixed or determinable; and (4) collection of the resulting receivable is reasonably assured. Sales represent the invoiced value of goods, net of value added tax (“VAT”), if any, and are recognized upon delivery of goods and passage of title.
In accordance with ASC 605-25, the Company recognizes revenue when persuasive evidence of an arrangement exists, transfer of title has occurred or services have been rendered, the selling price is fixed or determinable and collectability is reasonably assured.
The Company derives revenues from the manufacturing and distribution of graphite based products. The Company recognizes its revenues net of VAT. The Company is subject to VAT, which is levied on a majority of the products, at a rate ranging from 13% to 17% on the invoiced value of sales. Output VAT is borne by customers in addition to the invoiced value of sales and input VAT is borne by the Company in addition to the invoiced value of purchases to the extent not refunded for export sales.
The Company recognizes revenue upon receipt of the delivery confirmation provided by the customer or distributor. The Company does not provide chargeback or price protection rights to the distributors. The distributor only places purchase orders with the Company once it has confirmed the sale with a third party because this is a specialized business, which dictates that the Company will not manufacture the products until the purchase order is received. The Company allows its customers to return products only if its products are later determined by the Company to be defective. Based on the Company’s historical experience, product returns have been insignificant throughout all of its product lines. Therefore, the Company does not estimate deductions or allowances for sales returns. If sales returns occur, they are taken against revenue when products are returned from customers. Sales are presented net of any discounts given to customers. Interest income is recognized when earned. The Company experienced no returns for the six months ended June 30, 2012 and 2011.
41
Income Taxes
We account for income taxes under the provisions of ASC 740, Income Tax, formerly known as SFAS No. 109, Accounting for Income Taxes, which requires recognition of deferred tax assets and liabilities for the expected future tax consequences of events that have been included in the consolidated financial statements or tax returns. Deferred tax assets and liabilities are recognized for the future tax consequence attributable to the difference between the tax bases of assets and liabilities and their reported amounts in the financial statements. Deferred tax assets and liabilities are measured using the enacted tax rate expected to apply to taxable income in the years in which those temporary differences are expected to be recovered or settled. The effect on deferred tax assets and liabilities of a change in tax rates is recognized in income in the period that includes the enactment date.
Effective January 1, 2008, the new Chinese income tax law sets unified income tax rates for domestic and foreign companies at 25%, except for a 15% corporate income tax rate for qualified high technology and science enterprises. In accordance with this new income tax law, low preferential tax rates in accordance with both the tax laws and administrative regulations prior to the promulgation of this law gradually become subject to the new tax rate within five years after the implementation of this law.
We have been recognized as a high technology and science company by the Ministry of Science and Technology of the PRC. The Xing He District Local Tax Authority in the Inner Mongol province granted us a 100% tax holiday with respect to enterprise income tax for ten years from 2008 through 2017. Afterwards, based on the present tax law and our status as a qualified high technology and science company, we will be subject to a corporate income tax rate of 15% effective in 2018.
Accounts Receivable and Allowance For Doubtful Accounts
Accounts receivables are recognized and carried at the original invoice amount less allowance for any uncollectible amounts. An estimate for allowance for doubtful accounts is made when collection of the full amount is no longer probable. Bad debts are written off as incurred. Accounts receivable are recorded at the invoiced amount and do not bear interest. Management reviews the adequacy of the allowance for doubtful accounts on an ongoing basis, using historical collection trends and aging of receivables. Management also periodically evaluates individual customer’s financial condition, credit history, and the current economic conditions to make adjustments in the allowance when it is considered necessary. The allowance for doubtful accounts amounted to $2,790,662 for the six months ended June 30, 2012. Management believes that this allowance is sufficient based on a review of customer credit history, historic payment records, aging, the market and other factors.
Inventories
Inventories are stated at the lower of cost, determined on a weighted average basis, and net realizable value. Work in progress and finished goods are composed of direct material, direct labor and a portion of manufacturing overhead. Net realizable value is the estimated selling price, in the ordinary course of business, less estimated costs to complete and dispose. Management believes that there was no obsolete inventory as of June 30, 2012 or December 31, 2011 and therefore, no allowance for inventory was necessary.
42
Land Use Rights
There is no private ownership of land in China. All land ownership is held by the government, its agencies and collectives. Land use rights are obtained from the government, and are typically renewable. Land use rights can be transferred upon approval by State Land Administration Bureau and payment of the required transfer fee. We record the property subject to land use rights as intangible asset.
The Company has land use rights of 386,853 square meters used for operations in Xinghe County, Inner Mongolia, China. The land use rights have terms of 50 years, with the land use right relating to 130,220 square meters expiring in 2052 and the land use right with respect to 256,633 square meters expiring in 2053. In addition, in 2011, the local Chinese government and the Company agreed on terms for the land use rights of 387,838 square meters of land located adjacent to the Company’s facilities. The Company was not required to sign a land use right agreement or pay a fee. In exchange, the Company will allow public use of this 387,838 square meters of land and keep the land in good condition. The land use right has a term of 50 years, with such term expiring in January 2060. The value of the land is estimated to be $14,000,000. The Company has not accrued the liability or recorded the land use right asset for this property in accordance with ASC 450, Contingencies. Because of our current relationship and agreement with the local government to keep the land in good condition, we believe that it is unlikely that we will have to pay for the land use right. The bank allows, and the Company uses, this land use right as collateral for its short-term bank loans. We believe that our facilities are sufficient to meet our current and near future requirements and that any additional space that we may require would be available on commercially reasonable terms. If a lender foreclosed on our land, the lender would acquire the land use rights to such land, which rights are currently held by us. In addition, because we did no pay for one of the land use rights that were granted to us with respect to a portion of our facilities we are required to keep such property in good condition and to allocate a portion of the land as a park that can be accessed by the public.
Fair Value of Financial Instruments
The Company has adopted ASC Topic 820, Fair Value Measurement and Disclosure, which defines fair value, establishes a framework for measuring fair value in GAAP, and expands disclosures about fair value measurements. It does not require any new fair value measurements, but provides guidance on how to measure fair value by providing a fair value hierarchy used to classify the source of the information. It establishes a three-level valuation hierarchy of valuation techniques based on observable and unobservable inputs, which may be used to measure fair value and include the following:
|
●
|
Level 1 inputs to the valuation methodology are quoted prices (unadjusted) for identical assets or liabilities in active markets.
|
43
|
●
|
Level 2 inputs to the valuation methodology include quoted prices for similar assets and liabilities in active markets, and inputs that are observable for the assets or liabilities, either directly or indirectly, for substantially the full term of the financial instruments.
|
|
●
|
Level 3 inputs to the valuation methodology are unobservable and significant to the fair value.
|
Please see Note 3 contained in the Notes to the Consolidated Financial Statements for a summary of the hierarchy for assets and liabilities measured at fair value for the six months ended June 30, 2012.
Stock-based Compensation
Stock-based compensation includes (i) common stock awards granted to employees and directors for services which are accounted for under FASB ASC 718, Compensation–Stock Compensation, and (ii) common stock awards granted to consultants which are accounted for under FASB ASC 505-50, Equity–Equity-Based Payments to Non-Employees.
Stock compensation expenses were $195,233 and $357,350 and recognized as general and administrative expenses for the three months ended June 30, 2012 and 2011, respectively. Stock compensation expenses were $374,333 and $623,450 and recognized as general and administrative expenses for the six months ended June 30, 2012 and 2011, respectively.
Recent Accounting Pronouncements
The Company has reviewed all recently issued, but not yet effective, accounting pronouncements and does not believe the future adoption of any such pronouncements may be expected to cause a material impact on its financial condition or the results of its operations. Please refer to Note 3 of the accompanying financial statements for further details of recent accounting pronouncements.
|
Item 3.
|
Quantitative and Qualitative Disclosures about Market Risk.
|
Not applicable to smaller reporting companies.
|
Item 4.
|
Controls and Procedures.
|
Evaluation of Disclosure Controls and Procedures
Our management, including our Chief Executive Officer and Chief Financial Officer, evaluated the effectiveness of the design and operation of our disclosure controls and procedures as of June 30, 2012.
Disclosure controls and procedures refer to controls and other procedures designed to ensure that information required to be disclosed in the reports we file or submit under the Securities Exchange Act of 1934, as amended (the “Exchange Act”), is recorded, processed, summarized and reported within the time periods specified in the rules and forms of the SEC and that such information is accumulated and communicated to our management, including our chief executive officer and chief financial officer, as appropriate, to allow timely decisions regarding required disclosure. In designing and evaluating our disclosure controls and procedures, management recognizes that any controls and procedures, no matter how well designed and operated, can provide only reasonable assurance of achieving the desired control objectives, and management is required to apply its judgment in evaluating and implementing possible controls and procedures.
44
Management conducted its evaluation of disclosure controls and procedures under the supervision of our Chief Executive Officer and Chief Financial Officer. Based on that evaluation, our Chief Executive Officer and Chief Financial Officer concluded that, because of the material weakness in internal control over financial reporting, our disclosure controls and procedures were not effective as of June 30, 2012.
Changes in Internal Control over Financial Reporting
During the six months ended June 30, 2012, there has been no change in our internal controls over financial reporting (as defined in Rule 13a-15(f) and 15d-15(f) under the Exchange Act) that has materially affected, or is reasonably likely to materially affect, our internal controls over financial reporting. We will continue to monitor the deficiencies identified in internal controls and make changes that our management deems necessary.
Limitations on Controls
Management does not expect that our disclosure controls and procedures or our internal control over financial reporting will prevent or detect all error and fraud. Any control system, no matter how well designed and operated, is based upon certain assumptions and can provide only reasonable assurance that its objectives will be met. Further, no evaluation of controls can provide absolute assurance that misstatements due to error or fraud will not occur or that all control issues and instances of fraud, if any, within the Company have been detected.
PART II – OTHER INFORMATION
ITEM 1. Legal Proceedings
From time to time, we may become involved in various lawsuits and legal proceedings which arise in the ordinary course of business. However, litigation is subject to inherent uncertainties, and an adverse result in these or other matters may arise from time to time that may harm our business. We are currently not aware of any pending legal proceedings which involve us or any of our properties or subsidiaries.
45
ITEM 1A. Risk Factors
Pursuant to regulations for interim reporting, we are required to disclose material changes to risk factors identified in our annual report on Form 10-K. For a complete listing of risk factors, refer to our annual report on Form 10-K for the year ended December 31, 2011.
Our auditor, like other independent registered public accounting firms operating in China, is not subject to inspection by Public Company Accounting Oversight Board, and as such, investors may be deprived of the benefits of such inspection.
Our independent registered public accounting firm that issues the audit reports included in our annual reports filed with the SEC, as an auditor of companies that are traded publicly in the United States and a firm registered with the Public Company Accounting Oversight Board (United States), or PCAOB, is required by the laws of the United States to undergo regular inspections by PCAOB to assess its compliance with the laws of the United States and professional standards. Because our auditor is located in China, a jurisdiction where PCAOB is currently unable to conduct inspections without the approval of the PRC authorities, our auditor, like other independent registered public accounting firms operating in China, is currently not inspected by PCAOB.
Inspections of other firms that PCAOB has conducted outside of China have identified deficiencies in those firms’ audit procedures and quality control procedures, which may be addressed as part of the inspection process to improve future audit quality. The inability of PCAOB to conduct inspections of independent registered public accounting firms operating in China makes it more difficult to evaluate the effectiveness of our auditor’s audit procedures or quality control procedures. As a result, investors may be deprived of the benefits of PCAOB inspections.
|
Item 2.
|
Unregistered Sales Of Equity Securities And Use Of Proceeds
|
On May 9, 2012, the Company issued 200,000 shares of common stock at a price of $0.56 per share to unrelated parties to raise money for the Company’s operations.
On May 9, 2012, the Company issued 100,000 shares of common stock at a price of $0.50 per share to unrelated parties to raise money for the Company’s operations.
On April 24, 2012, the Company issued 110,000 shares of common stock as compensation for one service company.
On June 21, 2012, the Company issued 100,000 shares of common stock as compensation for one service company.
Based on representations made by the third parties to whom we issued these shares, such issuances were exempt from registration pursuant to Section 4(2) of the Securities Act and either Regulation 506 of the SEC thereunder or Regulation S.
46
|
Item 3.
|
Defaults Upon Senior Securities
|
None.
|
Item 4.
|
Mine Safety Disclosures
|
None.
|
Item 5.
|
Other Information
|
None.
|
Item 6.
|
Exhibits
|
|
31.1
|
Rule 13a-14(a)/15d-14(a) Certification of Chief Executive Officer
|
|
31.2
|
Rule 13a-14(a)/15d-14(a) Certification of Chief Financial Officer
|
|
32.1
|
Section 1350 Certification of Chief Executive Officer
|
|
32.2
|
Section 1350 Certification of Chief Financial Officer
|
47
SIGNATURES
Pursuant to the requirements of the Securities Exchange Act of 1934, the registrant has duly caused this report to be signed on its behalf by the undersigned, thereunto duly authorized.
|
CHINA CARBON GRAPHITE GROUP, INC.
|
||
|
Date: August 14, 2012
|
By:
|
/s/ Donghai Yu
|
|
Donghai Yu
|
||
|
Chief Executive Officer
|
||
|
Date: August 14, 2012
|
By:
|
/s/ Zhenfang Yang
|
|
Zhenfang Yang
|
||
|
Chief Financial Officer
|
48