Attached files
| file | filename |
|---|---|
| 8-K/A - FORM 8-K/A - CHINA FUND INC | v320867_8ka.htm |
| Monthly Insight | |
| JUN 30, 2012 | The China Fund, Inc. (CHN) |
Investment Objective
The investment objective of the Fund is to achieve long term capital appreciation. The Fund seeks to achieve its objective through investment in the equity securities of companies and other entities with significant assets, investments, production activities, trading or other business interests in China or which derive a significant part of their revenue from China.
The Fund has an operating policy that the Fund will invest at least 80% of its assets in China companies. For this purpose, ‘China companies’ are (i) companies for which the principal securities trading market is in China; (ii) companies for which the principal securities trading market is outside of China or in companies organized outside of China, that in both cases derive at least 50% of their revenues from goods or services sold or produced, or have a least 50% of their assets in China; or (iii) companies organized in China. Under the policy, China will mean the People’s Republic of China, including Hong Kong, and Taiwan. The Fund will provide its stockholders with at least 60 days’ prior notice of any change to this policy.
Performance Overview
| Since | ||||||||||||||||||||||||||||||||
| Performance History | 1 month | 3 months | YTD | 1 Year | 3 Years | 5 Years | 10 Years | Inception | ||||||||||||||||||||||||
| (p.a.) | (p.a.) | (p.a.) | (p.a.) | |||||||||||||||||||||||||||||
| NAV (%) | 0.76 | -5.52 | 2.32 | -20.17 | 9.28 | 3.32 | 17.24 | 10.53 | ||||||||||||||||||||||||
| Market price (%) | 2.19 | -5.88 | 6.92 | -19.39 | 9.15 | 5.62 | 18.4 | 9.63 | ||||||||||||||||||||||||
| Benchmark (%) | 1.91 | -6.44 | 4.83 | -13.89 | 6.02 | 0.03 | 9.60 | N/A | ||||||||||||||||||||||||
| Performance History | 2011 | 2010 | 2009 | 2008 | 2007 | 2006 | 2005 | 2004 | ||||||||||||||||||||||||
| NAV (%) | -24.37 | 27.25 | 72.82 | -46.95 | 86.20 | 57.10 | 6.09 | 3.80 | ||||||||||||||||||||||||
| Market price (%) | -27.51 | 23.60 | 72.19 | -40.65 | 50.24 | 65.67 | -21.51 | -9.95 | ||||||||||||||||||||||||
| Benchmark (%) | -18.36 | 13.60 | 67.12 | -49.37 | 37.97 | 39.50 | 10.27 | 14.27 | ||||||||||||||||||||||||
Source : State Street Bank and Trust Company. Source for index data: MSCI as at June 30, 2012
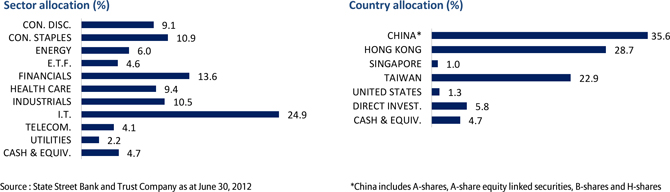
Portfolio Analysis

The China Fund, Inc. (CHN)
Portfolio Analysis (continued)
| Top 10 Holdings | Sector | % | Direct investments | Sector | % | |||||
| PING AN INSURANCE (GROUP) | FINANCIALS | 5.0 | CHINA BRIGHT | HEALTH CARE | 2.9 | |||||
| HAND ENTERPRISE SOLUTIONS CO., LTD. | I.T. | 4.8 | ZONG SU FOODS | CON. STAPLES | 2.9 | |||||
| TAIWAN SEMICONDUCTOR MANUFACT. | I.T. | 4.5 | CHINA SILICON CORP., SERIES A PREFERRED | I.T. | 0.0 | |||||
| TRACKER FUND OF HONG KONG | FINANCIALS | 4.1 | CHINA SILICON CORP. COMMON STOCK | I.T. | 0.0 | |||||
| FAMILYMART CO., LTD. | CON. DISC. | 3.4 | ||||||||
| CHINA MEDICAL SYSTEM HOLDINGS, LTD. | HEALTH CARE | 3.3 | ||||||||
| DIGITAL CHINA HOLDINGS, LTD. | I.T. | 3.1 | ||||||||
| CHINA MOBILE, LTD. | TELECOM. | 3.0 | ||||||||
| CHINA BRIGHT | HEALTH CARE | 2.9 | ||||||||
| INDUSTRIAL & COMMERCIAL BANK OF CHINA | FINANCIALS | 2.9 | ||||||||
| Total | 37.0 | Total | 5.8 |
Source : State Street Bank and Trust Company as at June 30, 2012
Fund Details
| NAV | $23.79 |
| Market price | $21.93 |
| Premium/Discount | -7.82% |
| Market cap | US$495.0m |
| Shares outstanding | 22,570,549 |
| Exchange listed | NYSE |
| Listing date | July 10, 1992 |
| Benchmark | MSCI Golden Dragon Index (Total Return) |
| Fund Manager | Christina Chung |
| Listed and direct investment manager | RCM Asia Pacific Limited |
Source : State Street Bank and Trust Company as at June 30, 2012
Dividend History (10 years)
|
Declaration date |
Ex-dividend date |
Record date | Payable date | Dividend/Share | Income |
Long-term Capital |
Short-term Capital | |||||||
| 8 Dec 2011 | 21 Dec 2011 | 23 Dec 2011 | 29 Dec 2011 | 2.99640 | 0.17420 | 2.82220 | 0.00000 | |||||||
| 8 Dec 2010 | 21 Dec 2010 | 24 Dec 2010 | 29 Dec 2010 | 2.27420 | 0.37460 | 1.89960 | 0.00000 | |||||||
| 9 Dec 2009 | 22 Dec 2009 | 24 Dec 2009 | 29 Dec 2009 | 0.25570 | 0.25570 | 0.00000 | 0.00000 | |||||||
| 8 Dec 2008 | 22 Dec 2008 | 24 Dec 2008 | 23 Jan 2009 | 5.81740 | 0.48130 | 5.33610 | 0.00000 | |||||||
| 7 Dec 2007 | 19 Dec 2007 | 21 Dec 2007 | 25 Jan 2008 | 12.12000 | 0.28000 | 9.00000 | 2.84000 | |||||||
| 8 Dec 2006 | 19 Dec 2006 | 21 Dec 2006 | 29 Dec 2006 | 4.01170 | 0.29960 | 2.73090 | 0.98120 | |||||||
| 9 Dec 2005 | 19 Dec 2005 | 21 Dec 2005 | 29 Dec 2005 | 2.51190 | 0.21720 | 2.29470 | 0.00000 | |||||||
| 13 Dec 2004 | 20 Dec 2004 | 22 Dec 2004 | 7 Jan 2005 | 3.57010 | 0.19630 | 3.26640 | 0.10740 | |||||||
| 19 Dec 2003 | 29 Dec 2003 | 31 Dec 2003 | 15 Jan 2004 | 1.78000 | 0.07000 | 0.67000 | 1.04000 | |||||||
| 17 Dec 2002 | 23 Dec 2002 | 26 Dec 2002 | 15 Jan 2003 | 0.21437 | 0.06397 | 0.00069 | 0.14971 |
Source : State Street Bank and Trust Company as at June 30, 2012
The China Fund, Inc. (CHN)
The China Fund Inc. NAV Performance of US$10,000 since inception (with dividends reinvested at NAV price)
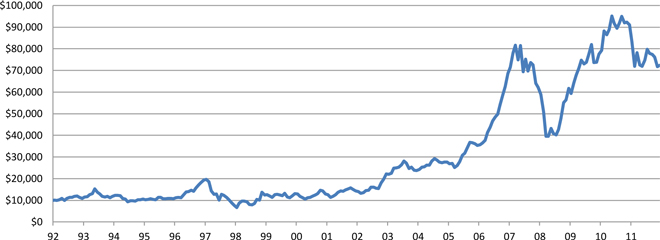
Past performance is not a guide to future returns.
Source : State Street Bank and Trust Company as at June 30, 2012
The China Fund Inc. Premium / Discount
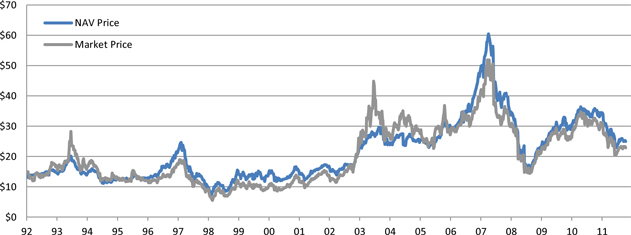
Past performance is not a guide to future returns.
Source : State Street Bank and Trust Company as at June 30, 2012
The China Fund, Inc. (CHN)
Manager’s Commentary
Market review
The surprise move by the People’s Bank of China (“PBoC”) to cut the benchmark lending and deposit rates by 25 basis points, effective June 8, provided a clear and strong signal to the market of a loosening in the policy stance. However, the asymmetric rate cut had an adverse effect on the net interest margin of Chinese banks and given the banking sector’s big weighting in the index, the rally in H-shares turned out to be relatively muted. With the positive effect of the Greek re-election results fading out in mid-June, the market re-focused on the weak economic data and the poor corporate earnings outlook. While it was expected that the Chinese government will continue to accelerate the pace of policy easing to stimulate domestic demand, market turnover remained low, suggesting that investors continued to stay on the sidelines.
The Greater China market did rally on the last trading day of the month backed by the positive measures coming from the EU summit which temporarily soothed market concerns over the euro credit situation.
Fund review
The top contributors for the month were Hand Enterprise Solutions, Ping An Insurance and Sinopharm Group. The share price of Hand Enterprise, an I.T. consultancy firm, rebounded in June on the expectation of better first half earnings results. Ping An Insurance benefited from the policy changes that allow insurance companies to participate in the RQFII program and other new businesses. The purchase of additional shares in June by management also supported the share price. Sinopharm, China's largest pharmaceutical products distributor, proposed an issuance of corporate bonds to strengthen the balance sheet, and the rate cut in early June also helped reduce Sinopharm’s interest expense.
The main detractors during the month were ZTE Corporation and ENN Energy. The share price of ZTE remains weak as investors are concerned about the company’s potential earnings disappointment in the upcoming interim results. However, the valuation is now at an attractive level. Although earnings expectations are bearish, there is potential upside that could come from tougher cost controls and lower financing costs. For ENN Energy, the share price soared in late May as a result of the proposed acquisition of China Gas, however it retreated after the deal faced opposition by another substantial shareholder, Beijing Enterprises.
Outlook
The latest development in Europe appears to have reduced the systemic risk of banks in the euro zone. With respect to China, there are more signs of policy easing, although the pace is still very gradual and the scope remains very selective. Notwithstanding these positive developments, a major challenge for equity markets is the fact that global economic growth remains very weak. In particular, China’s economy is much weaker than expected. Hence, while economic growth in China is likely to recover in the second half of 2012, the rate of recovery could be subdued in the absence of more significant policy support. As a result, the corporate earnings outlook continues to be weak and while we could be at the bottom of the earnings cycle, visibility of an earnings recovery remains low. Overall, we believe that Chinese equities will continue to be range bound in the short term.
The Taiwan stock market remained almost flat during the month of June, underperforming most regional peers. The prolonged uncertainty surrounding capital gain tax (CGT) in Taiwan and the poor global economy will continue to weigh negatively on domestic consumption in Taiwan. For instance, on a recent company visit to one of the major retailers the forecast indicated that domestic demand is very weak. With respect to the technology sector, we remain cautious as we see a weakening in the bargaining power of Taiwan component suppliers due to the emergence of 2 very strong customers, Samsung and Apple. We also expect the widely anticipated third quarter PC recovery to be either weaker than expected or delayed to next year, which is another negative for Taiwan technology companies. In terms of valuation, we believe that the Taiwan market will still stay above the regional average in terms of P.E. Ratio, despite its underperformance in June. We continue to stay cautious on Taiwan.
Source : RCM Asia Pacific Limited as at June 30, 2012
The China Fund, Inc. (CHN)
Portfolio Holdings
| Percentage of | |||||||||||||||||||
| CUSIP | Security Description | Cost Base | Base MV | Shares | Net Assets | ||||||||||||||
| 913BMZ902 | Ping An Insurance (Group) Company of China, Ltd. | 26,129,356 | 26,878,299 | 3,707,857 | 5.0 | ||||||||||||||
| B3VN92906 | HAND Enterprise Solutions Co., Ltd. | 2,691,250 | 25,963,361 | 9,558,157 | 4.8 | ||||||||||||||
| 688910900 | Taiwan Semiconductor Manufacturing Co., Ltd. | 23,621,479 | 24,192,769 | 8,893,000 | 4.5 | ||||||||||||||
| 618855902 | Tracker Fund of Hong Kong | 21,479,883 | 21,811,935 | 8,468,500 | 4.1 | ||||||||||||||
| 644094906 | FamilyMart Co., Ltd. | 5,058,480 | 18,328,614 | 3,940,652 | 3.4 | ||||||||||||||
| B6WY99909 | China Medical System Holdings, Ltd. | 3,005,888 | 17,847,913 | 41,083,300 | 3.3 | ||||||||||||||
| 635186901 | Digital China Holdings, Ltd. | 17,914,700 | 16,736,931 | 9,603,000 | 3.1 | ||||||||||||||
| 607355906 | China Mobile, Ltd. | 15,654,256 | 15,980,644 | 1,461,000 | 3.0 | ||||||||||||||
| ACI007Y93 | China Bright | 14,969,436 | 15,635,006 | 14,665,617 | 2.9 | ||||||||||||||
| B1G1QD902 | Industrial & Commercial Bank of China | 20,054,110 | 15,468,278 | 27,970,000 | 2.9 | ||||||||||||||
| ACI0090H8 | Zong Su Foods | 15,000,034 | 15,307,086 | 2,677 | 2.9 | ||||||||||||||
| B00G0S903 | CNOOC, Ltd. | 16,633,138 | 15,103,703 | 7,608,000 | 2.8 | ||||||||||||||
| B1YMYT902 | Hiwin Technologies Corp. | 14,799,643 | 13,692,823 | 1,355,000 | 2.6 | ||||||||||||||
| 663094902 | China Everbright International, Ltd. | 11,891,059 | 12,280,769 | 26,100,000 | 2.3 | ||||||||||||||
| 635415904 | Epistar Corp. | 14,075,935 | 12,262,757 | 5,595,000 | 2.3 | ||||||||||||||
| 633393905 | Enn Energy Holdings, Ltd. | 961,117 | 11,990,834 | 3,426,000 | 2.2 | ||||||||||||||
| 674842901 | Ruentex Development Co., Ltd. | 4,853,391 | 10,463,206 | 6,857,301 | 1.9 | ||||||||||||||
| 634007900 | Kunlun Energy Co., Ltd. | 10,482,242 | 10,254,789 | 6,436,000 | 1.9 | ||||||||||||||
| 629099904 | WT Microelectronics Co., Ltd. | 8,888,527 | 9,592,120 | 7,122,000 | 1.8 | ||||||||||||||
| 99ZMCS903 | Kweichow Moutai Co., Ltd. | 8,981,307 | 9,540,735 | 251,649 | 1.8 | ||||||||||||||
| B2R2ZC908 | CSR Corp., Ltd. | 9,248,041 | 9,445,615 | 12,212,000 | 1.8 | ||||||||||||||
| 670039007 | Uni-President Enterprises Corp. | 1,896,024 | 9,158,974 | 5,750,335 | 1.7 | ||||||||||||||
| 971DPM903 | ZTE Corp. Access Product | 12,015,588 | 9,055,973 | 4,099,499 | 1.7 | ||||||||||||||
| 642411904 | Yuanta Financial Holdings Co., Ltd. | 9,957,748 | 8,753,286 | 19,305,680 | 1.6 | ||||||||||||||
| B3ZVDV905 | Sinopharm Group Co., Ltd. | 6,363,867 | 8,379,139 | 3,051,600 | 1.6 | ||||||||||||||
| 651795908 | Natural Beauty Bio-Technology, Ltd. | 4,906,910 | 7,564,962 | 47,710,000 | 1.4 | ||||||||||||||
| 17307D352 | Wuliangye Yibin Co., Ltd. | 3,118,592 | 7,270,166 | 1,403,507 | 1.3 | ||||||||||||||
| 619376908 | China Resources Land Ltd. | 5,946,869 | 7,016,177 | 3,436,000 | 1.3 | ||||||||||||||
| B1JNK8908 | China Coal Energy Co., Ltd. | 10,996,167 | 6,899,887 | 8,429,000 | 1.3 | ||||||||||||||
| 643648900 | Shenzhen International Holdings, Ltd. | 6,956,592 | 6,836,975 | 111,655,000 | 1.3 | ||||||||||||||
| B01CT3905 | Tencent Holdings, Ltd. | 6,391,568 | 6,823,191 | 234,200 | 1.3 | ||||||||||||||
| 970LGE904 | Zhengzhou Yutong Bus Co., Ltd. | 7,126,648 | 6,737,047 | 1,894,588 | 1.3 | ||||||||||||||
| 671815900 | Qingling Motors Co., Ltd. | 7,603,281 | 5,923,053 | 24,836,000 | 1.1 | ||||||||||||||
| 34415V109 | Focus Media Holding Ltd. | 5,976,531 | 5,880,261 | 250,437 | 1.1 | ||||||||||||||
| B03SMV903 | China United Network Communications, Ltd. | 8,426,234 | 5,778,493 | 9,809,037 | 1.1 | ||||||||||||||
| 600245005 | ASM Pacific Technology Ltd. | 5,467,670 | 5,214,986 | 410,700 | 1.0 | ||||||||||||||
| 17313A533 | Gree Electric Appliances, Inc. | 5,451,623 | 5,110,020 | 1,549,900 | 0.9 | ||||||||||||||
| 626073902 | Delta Electronics Inc. | 4,550,608 | 4,912,280 | 1,615,000 | 0.9 | ||||||||||||||
| 674234901 | Shandong Weigao Group Medical Polymer Co., Ltd. | 1,296,225 | 4,874,810 | 4,428,000 | 0.9 | ||||||||||||||
| 604364901 | Yantai Changyu Pioneer Wine Co., Ltd. | 5,808,831 | 4,644,316 | 688,855 | 0.9 | ||||||||||||||
| 959GRNII9 | Taiwan Life Insurance Co., Ltd. | 6,178,274 | 4,604,986 | 200,000,000 | 0.9 | ||||||||||||||
| 665157905 | Comba Telecom Systems Holdings, Ltd. | 7,565,579 | 4,548,825 | 10,958,500 | 0.8 | ||||||||||||||
| B0PR2N901 | Wumart Stores, Inc. | 1,810,149 | 4,486,858 | 2,219,750 | 0.8 | ||||||||||||||
| B188NR908 | Qinghai Salt Lake Potash Co., Ltd. | 6,484,994 | 4,348,349 | 814,450 | 0.8 | ||||||||||||||
| 620267906 | Advantech Co., Ltd. | 4,104,779 | 4,236,319 | 1,284,000 | 0.8 | ||||||||||||||
| 912TARII6 | Shanghai Yuyuan Tourist Mart Co., Ltd. | 3,943,762 | 4,148,078 | 3,318,462 | 0.8 | ||||||||||||||
| 17316E755 | Yonyou Software Co., Ltd. | 4,454,170 | 3,974,814 | 1,647,250 | 0.7 | ||||||||||||||
| 643055908 | Golden Meditech Co., Ltd. | 4,555,715 | 3,749,164 | 35,040,000 | 0.7 | ||||||||||||||
| B633D9904 | Zhongsheng Group Holdings Ltd. | 3,195,651 | 2,940,991 | 2,440,000 | 0.6 | ||||||||||||||
| B05LP6908 | CDW Holding, Ltd. | 1,203,361 | 2,890,354 | 40,930,000 | 0.5 | ||||||||||||||
| 618666903 | Catcher Technology Co., Ltd. | 2,892,336 | 2,869,400 | 432,000 | 0.5 | ||||||||||||||
| 642324909 | iShares MSCI China Index ETF | 2,690,838 | 2,707,528 | 1,182,600 | 0.5 | ||||||||||||||
| B1XBPZ903 | China Fishery Group, Ltd. | 2,240,953 | 2,578,518 | 3,734,872 | 0.5 | ||||||||||||||
| B4R29H902 | Asian Citrus Holdings, Ltd. | 3,953,174 | 2,436,521 | 4,355,000 | 0.4 | ||||||||||||||
The China Fund, Inc. (CHN)
Portfolio Holdings (continued)
| Percentage of | |||||||||||||||||||
| CUSIP | Security Description | Cost Base | Base MV | Shares | Net Assets | ||||||||||||||
| B4PTR3906 | Fook Woo Group Holdings, Ltd. | 7,974,083 | 2,235,340 | 25,314,000 | 0.4 | ||||||||||||||
| 677103905 | Shangri-La Asia, Ltd. | 1,660,098 | 2,229,816 | 1,176,683 | 0.4 | ||||||||||||||
| G45667105 | Hollysys Automation Technologies, Ltd. | 892,101 | 886,284 | 104,024 | 0.2 | ||||||||||||||
| 631349909 | Chaoda Modern Agriculture (Holdings), Ltd. | 9,287,936 | 0 | 26,651,357 | 0.0 | ||||||||||||||
| 16899C939 | China Silicon Corp. Common Stock | 1,458,811 | 0 | 2,301,863 | 0.0 | ||||||||||||||
| 169999935 | China Silicon Corp., Series A Preferred | 5,171,016 | 0 | 27,418 | 0.0 | ||||||||||||||
| B04W2V905 | FU JI Food & Catering Services | 4,246,696 | 0 | 5,462,000 | 0.0 | ||||||||||||||
Source : State Street Bank and Trust Company as at June 30, 2012
The information contained herein has been obtained from sources believed to be reliable but RCM and its affiliates do not warrant the information to be accurate, complete or reliable. The opinions expressed herein are subject to change at any time and without notice. Past performance is not indicative of future results. This material is not intended as an offer or solicitation for the purchase or sale of any financial instrument. Investors should consider the investment objectives, risks, charges and expenses of any mutual fund carefully before investing. This and other information is contained in the fund’s annual and semiannual reports, proxy statement and other fund information, which may be obtained by contacting your financial advisor or visiting the fund’s website at www.chinafundinc.com. This information is unaudited and is intended for informational purposes only. It is presented only to provide information on investment strategies and opportunities. The Fund seeks to achieve its objective through investment in the equity securities of companies and other entities with significant assets, investments, production activities, trading or other business interests in China or which derive a significant part of their revenue from China. Investing in non-U.S. securities entails additional risks, including political and economic risk and the risk of currency fluctuations, as well as lower liquidity. These risks, which can result in greater price volatility, will generally be enhanced in less diversified funds that concentrate investments in a particular geographic region. The Fund is a closed-end exchange traded management investment company. This material is presented only to provide information and is not intended for trading purposes. Closed-end funds, unlike open-end funds, are not continuously offered. After the initial public offering, shares are sold on the open market through a stock exchange, where shares may trade at a premium or a discount. Holdings are subject to change daily.