Attached files
| file | filename |
|---|---|
| 8-K - ROSETTA RESOURCES INC 8-K 8-8-2012 - NBL Texas, LLC | form8k.htm |
EXHIBIT 99.1

REDEFINED
BUILDING VALUE IN UNCONVENTIONAL RESOURCES
Rosetta Resources Inc.
Second Quarter 2012
Earnings Review
August 8, 2012
Second Quarter 2012
Earnings Review
August 8, 2012

• Opening Comments Randy Limbacher
• Financial Update John Hagale
• Operations Update Jim Craddock
• Asset Development Update John Clayton
• Closing Remarks Randy Limbacher
2
Earnings Call Agenda

Long-term strategy based on three elements:
• Develop existing Eagle Ford production base
• Invest cash flow into acquisitions in lower-risk plays
• Expose 10% of annual capital to higher-risk new ventures
Strong second quarter performance led by:
• Successful down spacing in Gates Ranch and highly economic
recoveries in new Eagle Ford areas
recoveries in new Eagle Ford areas
• Lower unit costs at drill bit and field operations
• Strong preliminary year-end reserve replacement estimate of
450%
450%
3
Overview - Randy Limbacher

• Net income growth reflects increased production, more favorable
commodity mix and unrealized gain on derivative activities
commodity mix and unrealized gain on derivative activities
• Liquids sales generated 83% of revenues*
• Operating cost improvements reflect lower total LOE, DD&A, and
production taxes
production taxes
• Unit T&T costs expected to trend slightly lower in second half with
increasing Karnes Trough production
increasing Karnes Trough production
• Strong cash position of $60.1 million; current debt-to-cap ratio of
30%
30%
• Revised annual cost guidance reflects narrowed ranges and
slightly higher costs
slightly higher costs
4
Financial Update - John Hagale
*Including the effects of realized derivatives

|
|
|
2012 Full Year
|
||
|
|
|
(Guidance Range)
|
||
|
Direct Lease Operating Expense
|
|
$ 2.15
|
-
|
$ 2.20
|
|
Workover Expenses
|
|
|
-
|
|
|
Insurance
|
|
0.10
|
-
|
0.11
|
|
Ad Valorem Tax
|
|
0.75
|
-
|
0.85
|
|
Treating and Transportation
|
|
3.85
|
-
|
4.25
|
|
Production Taxes
|
|
1.20
|
-
|
1.25
|
|
DD&A
|
|
11.30
|
-
|
12.00
|
|
G&A, excluding Stock-Based Compensation
|
|
3.60
|
-
|
4.00
|
|
Interest Expense
|
|
1.90
|
-
|
1.95
|
5
Expense Guidance

• Spent $171 million in second quarter 2012 capex; drilled 20 gross
wells with 100% success rate and completed 15
wells with 100% success rate and completed 15
• Averaged quarterly production of 33,400 Boe/d; 59 percent liquids
• Operated five rigs, two in Gates Ranch, two in Karnes Trough,
and one at Briscoe Ranch
and one at Briscoe Ranch
• Ramping up activity in oil-rich Klotzman area; newly-constructed
oil terminal placed in service in late July
oil terminal placed in service in late July
• Completed two horizontal wells in the Southern Alberta Basin
• July production averaged 35 MBoe/d; 61 percent liquids
• Reaffirmed 2012 production guidance: 35 - 38 MBoe/d
6
Operations Update - Jim Craddock
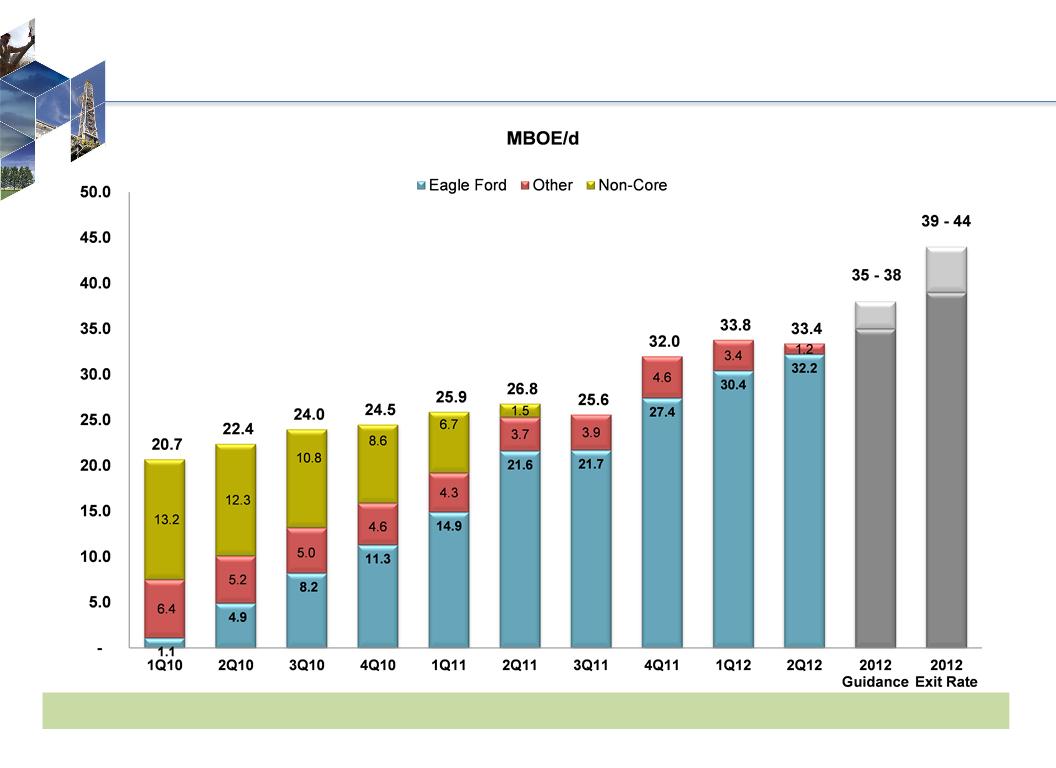
Quarterly Production Performance
% Liquids: 14 19 24 29 33 46 51 49 52 59 60 61
7

• Gates Ranch Down-Spacing
• Pilot well spacing of 50 to 65 acres operating without interference
• Decision to develop on 475-foot well spacing (55-acre effective spacing)
• Full development with 428 horizontal wells; 356 remain to be completed
• Average EUR of 1.7 MMBoe gross per well; 100% incremental reserves
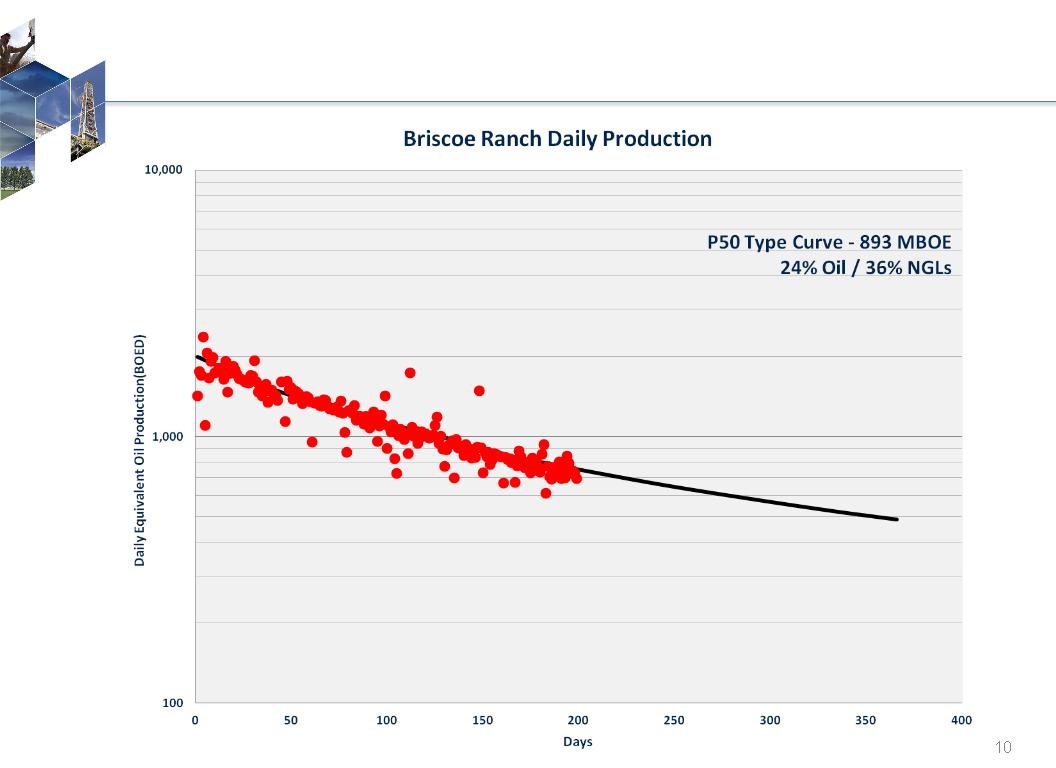
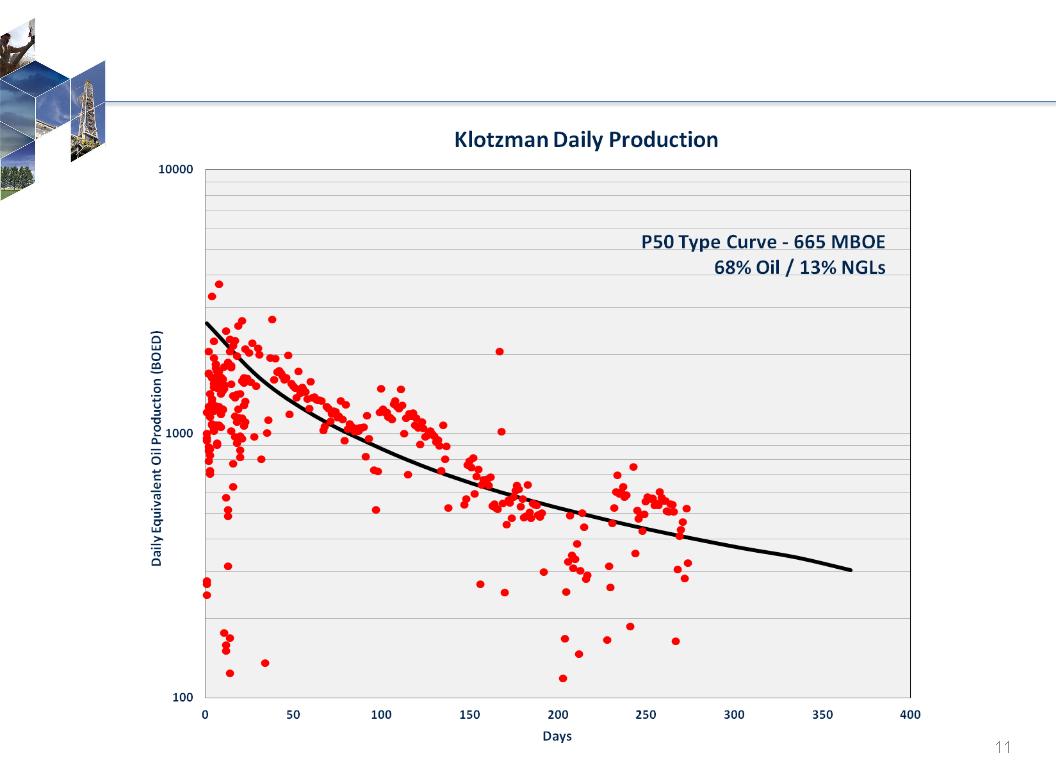
• Non-Gates Ranch Type Curves
• Briscoe Ranch EUR of 890 MBoe gross per well; 68 total locations
• Klotzman (Karnes Trough area) EUR of 665 MBoe gross per well
• Suspended Southern Alberta Basin program
• Completed five of seven horizontal wells
• Results below targeted type curve
8
Asset Development Update - John Clayton
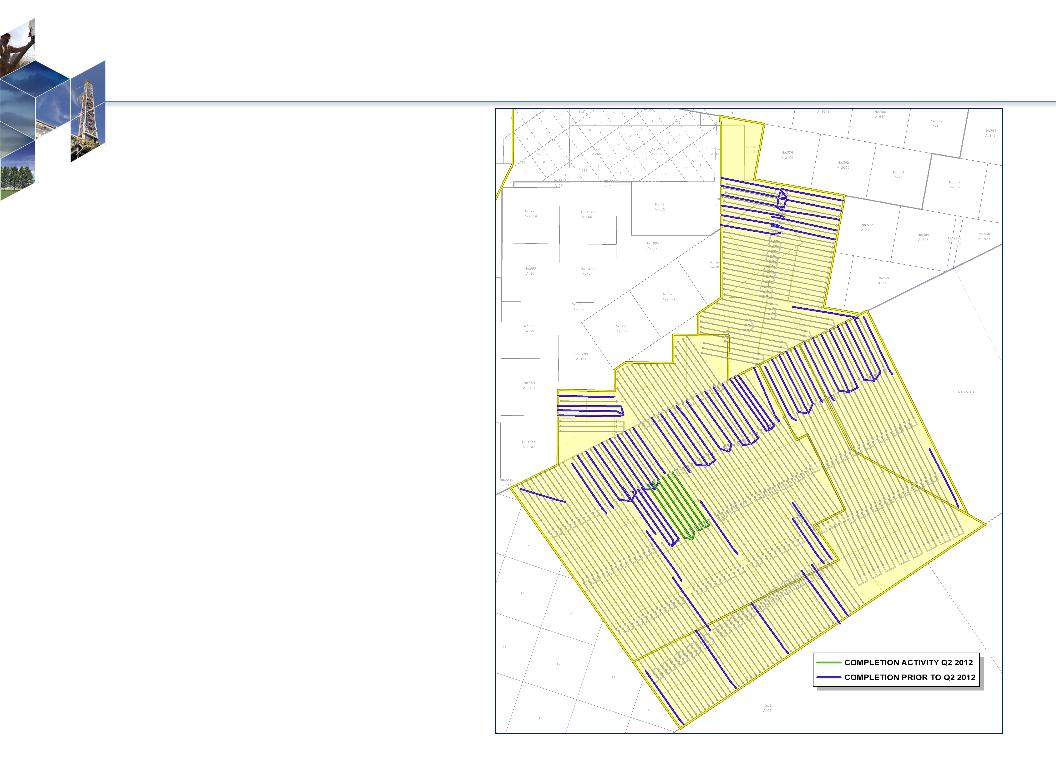
Gates Ranch
9
Summary
• 26,500 net acres in Webb County
• 72 completions as of 6/30/2012
• 356 well locations remaining under current
spacing assumptions
spacing assumptions
Average Well Characteristics
• Spacing: 475 feet apart or 55 acres
• Composite EUR: 1.67 MMBoe
• Condensate Yield = 64 Bbls/MMcf
• NGL Yield = 100 Bbls/MMcf
• Shrinkage = 20%
• Mix: Oil 21%, NGLs 34%
Briscoe Ranch Type Curve
Klotzman Type Curve
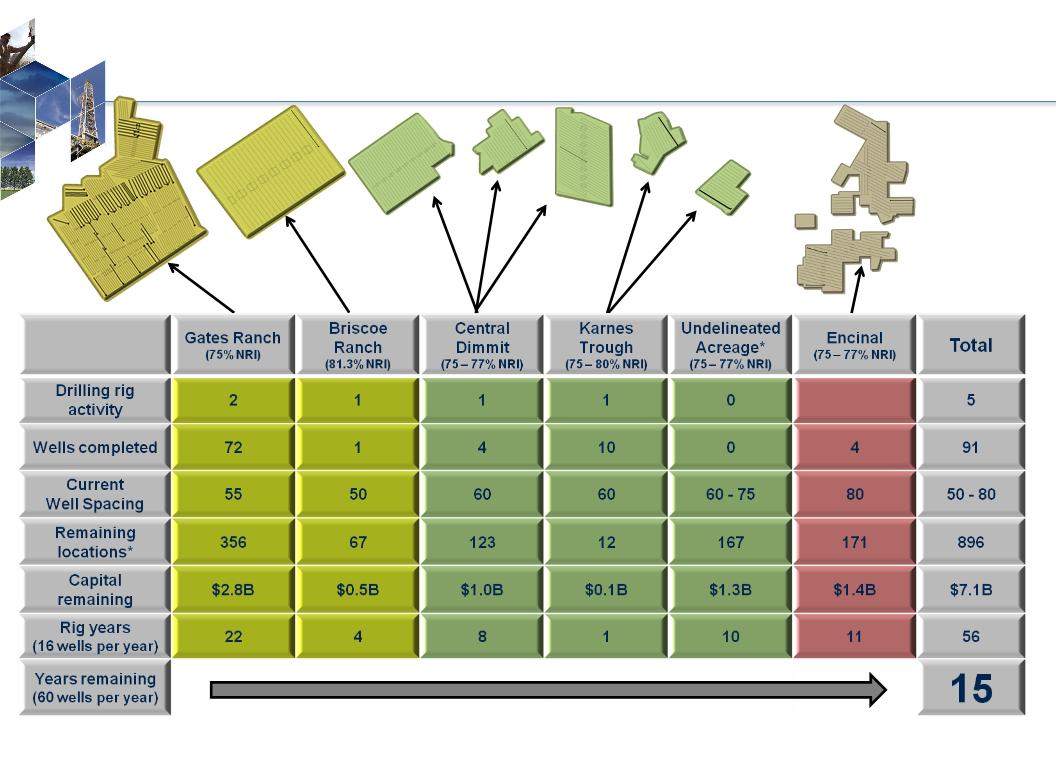
Eagle Ford Inventory
+/- 900 net wells remaining as of 6/30/2012
+/- 900 net wells remaining as of 6/30/2012
* Denotes roughly 10,000 net acres in the liquids window of the play in Webb (~3,000), LaSalle (~3,500), and Gonzales (~3,000) counties.
12

This presentation includes forward-looking statements, which give the Company's current expectations or forecasts of future
events based on currently available information. Forward-looking statements are statements that are not historical facts,
such as expectations regarding drilling plans, including the acceleration thereof, production rates and guidance, resource
potential, incremental transportation capacity, exit rate guidance, net present value, development plans, progress on
infrastructure projects, exposures to weak natural gas prices, changes in the Company's liquidity, changes in acreage
positions, expected expenses, expected capital expenditures, and projected debt balances. The assumptions of
management and the future performance of the Company are subject to a wide range of business risks and uncertainties
and there is no assurance that these statements and projections will be met. Factors that could affect the Company's
business include, but are not limited to: the risks associated with drilling of oil and natural gas wells; the Company's ability to
find, acquire, market, develop, and produce new reserves; the risk of drilling dry holes; oil and natural gas price volatility;
derivative transactions (including the costs associated therewith and the abilities of counterparties to perform thereunder);
uncertainties in the estimation of proved, probable, and possible reserves and in the projection of future rates of production
and reserve growth; inaccuracies in the Company's assumptions regarding items of income and expense and the level of
capital expenditures; uncertainties in the timing of exploitation expenditures; operating hazards attendant to the oil and
natural gas business; drilling and completion losses that are generally not recoverable from third parties or insurance;
potential mechanical failure or underperformance of significant wells; availability and limitations of capacity in midstream
marketing facilities, including processing plant and pipeline construction difficulties and operational upsets; climatic
conditions; availability and cost of material, supplies, equipment and services; the risks associated with operating in a limited
number of geographic areas; actions or inactions of third-party operators of the Company's properties; the Company's ability
to retain skilled personnel; diversion of management's attention from existing operations while pursuing acquisitions or
dispositions; availability of capital; the strength and financial resources of the Company's competitors; regulatory
developments; environmental risks; uncertainties in the capital markets; general economic and business conditions
(including the effects of the worldwide economic recession); industry trends; and other factors detailed in the Company's
most recent Form 10-K, Form 10-Q and other filings with the Securities and Exchange Commission. If one or more of these
risks or uncertainties materialize (or the consequences of such a development changes), or should underlying assumptions
prove incorrect, actual outcomes may vary materially from those forecasted or expected. The Company undertakes no
obligation to publicly update or revise any forward-looking statements except as required by law.
13
Forward-Looking Statements and Terminology Used

For filings reporting year-end 2011 reserves, the SEC permits the optional disclosure of probable and possible
reserves. The Company has elected not to report probable and possible reserves in its filings with the SEC. We use the
term “net risked resources” to describe the Company’s internal estimates of volumes of natural gas and oil that are not
classified as proved reserves but are potentially recoverable through exploratory drilling or additional drilling or recovery
techniques. Estimates of unproved resources are by their nature more speculative than estimates of proved reserves
and accordingly are subject to substantially greater risk of actually being realized by the Company. Estimates of
unproved resources may change significantly as development provides additional data, and actual quantities that are
ultimately recovered may differ substantially from prior estimates. We use the term “BFIT NPV10” to describe the
Company’s estimate of before income tax net present value discounted at 10 percent resulting from project economic
evaluation. The net present value of a project is calculated by summing future cash flows generated by a project, both
inflows and outflows, and discounting those cash flows to arrive at a present value. Inflows primarily include revenues
generated from estimated production and commodity prices at the time of the analysis. Outflows include drilling and
completion capital and operating expenses. Net present value is used to analyze the profitability of a project. Estimates
of net present value may change significantly as additional data becomes available, and with adjustments in prior
estimates of actual quantities of production and recoverable reserves, commodity prices, capital expenditures, and/or
operating expenses.
14
Forward-Looking Statements and Terminology Used (cont.)