Attached files
| file | filename |
|---|---|
| 8-K - FORM 8-K - ION GEOPHYSICAL CORP | d393177d8k.htm |
| EX-99.1 - PRESS RELEASE - ION GEOPHYSICAL CORP | d393177dex991.htm |
 ION
Earnings Call – Q2 2012
Earnings Call Presentation
August 8, 2012
Exhibit 99.2 |
 Earnings Call Introduction
Corporate Participants & Contact Information
CONTACT INFORMATION
If you have technical problems during the call, please contact DRG&L at 713 529
6600. If
you
would
like
to
listen
to
a
replay
of
today's
call,
it
will
be
available
via
webcast
in
the
Investor
Relations
section
of
the
Company's
website
-
www.iongeo.com
for
approximately
12
months.
BRIAN HANSON
Chief Executive Officer
GREG HEINLEIN
Chief Financial Officer
2 |
 Earnings Call Introduction
FORWARD-LOOKING STATEMENTS
The information included herein contains forward-looking statements within
the meaning of Section 27A of the Securities Act of 1933 and Section 21E
of the Securities Exchange Act of 1934.
Actual results may vary fundamentally from those described in these
forward-looking statements.
All forward-looking statements reflect numerous assumptions and involve a
number of risks and uncertainties.
These risks and uncertainties include risk factors that are disclosed by ION
from time to time in its filings with the Securities and Exchange
Commission. 3 |
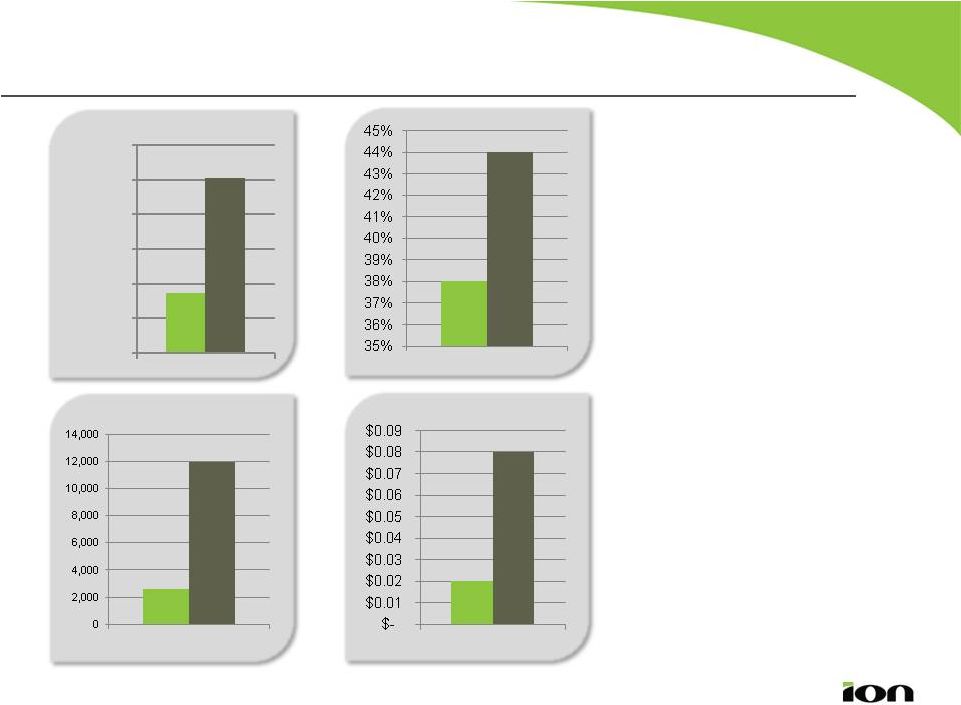 ION Q2
2012 Highlights Continued Momentum –
Solid Q2
4
Revenues
($ Thousands)
Q2 11
Q2 12
Gross Profit
Q2 11
Q2 12
Up 19%
Diluted EPS
Q2 11
Q2 12
Net Income
($ Thousands)
Q2 11
Q2 12
•
Strong revenue
growth
•
Good gross margins
•
EPS up 300%
Up 300%
80,000
85,000
90,000
95,000
100,000
105,000
110,000 |
 Market
Observations International Data Processing Picking Up
Fifth sequential quarterly improvement in
ION DP revenues
International demand
up
--
Europe, Africa,
Middle East
Continued rebalancing of our portfolio
beyond Gulf of Mexico
Ended Q2 with record data processing
backlog
Introduced new broadband processing
technology,
WiBand ,
with
20+
projects
underway
5
Conventional Image
WiBand Image
WiBand Projects
TM |
 Market
Observations Continued Growth in Marine Seismic Activity
6
Towed Streamer market tightening
Good growth in Seabed market
Launched Calypso
TM
seabed
acquisition system in Q2 at EAGE
Growing demand for ION’s Acquisition
Optimization Services |
 7
Solid performance --
revenues, operating profits, margins.
Ended Q2 with record backlog.
Continued rise in international exploration –
Africa, Latin America, Australia
and the Arctic.
GeoVentures
TM
Acquisition and Data Library Programs –
1H 2012 |
 Summary
Industry remains robust
International activity is strong
Well positioned to grow
Remain confident in our ability to
deliver against plan
8 |
 Software
Systems
Solutions
9
Solutions
revenues of $72 million,
up
47% Y/Y
Software
revenues
of
$10
million,
up
6% in local currency Y/Y
Systems
revenues of $23 million,
down
23% Y/Y
Q2 revenue growth led by strong growth in
Solutions segment
Financial Overview
Revenues by Segment
-
20
40
60
80
100
120
Q2 11
Q2 12 |
 Solutions Segment
Financial Overview
Revenue by Type
Multi-client Investments
Solutions Backlog
Q4
11
$134 M Data
Processing
Data
Libraries
New
Ventures
Q2
11 $117 M
10
Q3
11 $106 M
Q1
12
$129 M $150 M
$130 M
Data Processing and New Ventures activity strong.
Backlog growing well.
Q2
12
$153 M |
 Software Segment
Financial Overview
Revenue by Type (GBP)
Services
Software Systems
% of Seismic Vessels with Orca
®
Orca-Permanent
Spectra/Pre-Orca
ION versions
11
Continued steady growth in Q2.
Added two Orca vessels.
Growing demand for on-board services.
-
1
2
3
4
5
6
7
Q2 11
Q2 12
41%
59% |
 Systems Segment
Financial Overview
Revenue by Type
Towed Streamer Equipment
OBC
Other
12
Q2 soft as expected –
timing of revenue recognition.
Good reception for Calypso at EAGE.
-
5
10
15
20
25
30
35
Q2 11
Q2 12 |
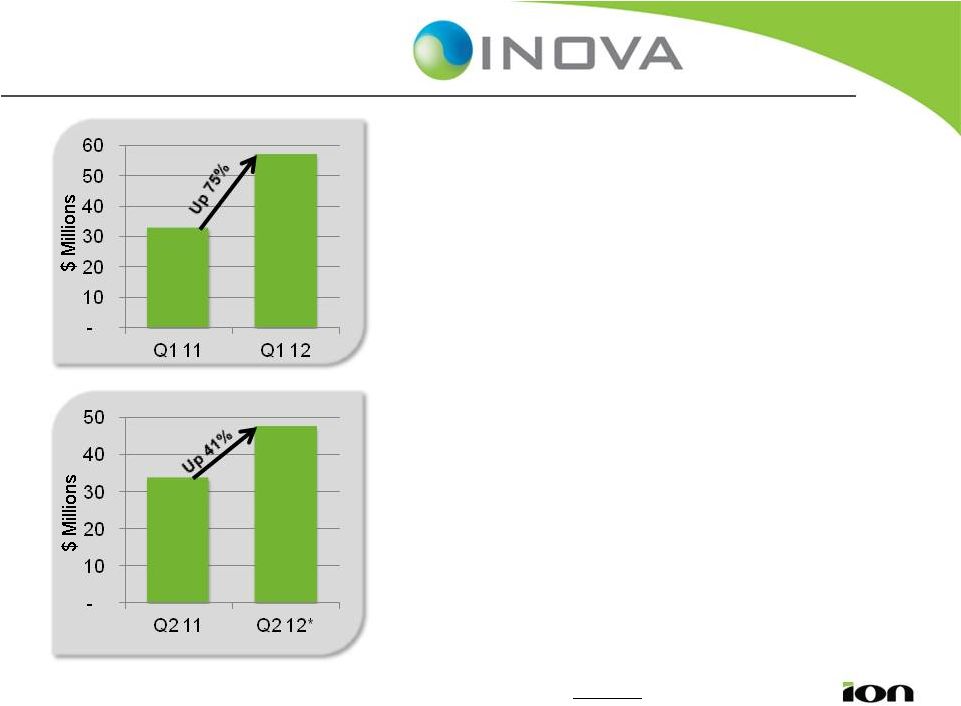 INOVA
Geophysical Financial Overview
Revenues
13
*Forecast
Revenues
**ION
to
share
in
49%
of
these
results.
2012
estimates
are
unaudited.
Q1 2012
•
Revenues of $56.8 million with operating
income of $8.9 million**
•
Delivered 15,000 channels of G3i™
•
Delivered first 3 UniVib™ units
•
Significant number of Vibrator sales Q2 2012 •
Estimated revenues of $45 to $49 million
with an operating loss of ($3) to ($4) million**
•
Delivered an additional 9,000 channels of G3i
•
First sale of new wireless Hawk™ system
|
 Financial Overview
Cash Flow
Three Months Ended
June 31,
SUMMARIZED CASH FLOW
2012
2011
Cash from operations
$
38,556
$
20,349
Working capital
(5,023)
(11,283)
Multi-client investment
(28,054)
(34,195)
PP&E Capital Expenditures
(3,122)
(3,566)
Free Cash Flow
2,357
(28,695)
Other Investing & Financing
(6,171)
(7,186)
Cash flow, including ST investments
(3,814)
(35,881)
Cash, Cash Equivalents & ST Investments (Beginning of Period)
87,096
130,834
Cash, Cash Equivalents & ST Investments (End of Period)
$
83,282
$
94,953
Good free cash flow and strong cash position
14 |
 Financial Overview
Balance Sheet as of June 30, 2012
Capital Employed*
Capital Book Value
Cash
Net Fixed Assets
Multi-Client Data Library
Goodwill & Equity in INOVA
Equity
Debt
** Net Debt = Debt less Cash
Other Working Capital
15
*Assets less Current Liabilities
Net Debt of $22M**
0
100
200
300
400
500
600
0
100
200
300
400
500
600
$187M
$83M
$177M
$87M
Q2
Q1
$105M
$105M
Q1
Q2 |
 Continued Momentum in Q2
16
•
Strong first half 2012
•
Expect solid Y/Y growth
throughout 2012
•
Continue to anticipate
2012
multi-client
investment
in
$130
-
$150
range
•
Remain positive on outlook to
achieve Y/Y quarterly
improvement for balance of 2012 |
 17 |