Attached files
| file | filename |
|---|---|
| 8-K - FORM 8-K - Bristow Group Inc | d393369d8k.htm |
 Bristow Group Inc.
Investor Relations Presentation
August 8 –
10, 2012
Exhibit 99.1 |
 2
Forward-looking statements
This presentation may contain “forward-looking statements” within the meaning of the
Private Securities Litigation Reform Act of 1995. Forward-looking statements include
statements about our future business, operations, capital expenditures, fleet composition,
capabilities and results; modeling information, earnings guidance, expected operating margins
and other financial projections; future dividends, share repurchase and other uses of excess
cash; plans, strategies and objectives of our management, including our plans and strategies to
grow earnings and our business, our general strategy going forward and our business model;
expected actions by us and by third parties, including our customers, competitors and
regulators; the valuation of our company and its valuation relative to relevant financial
indices; assumptions underlying or relating to any of the foregoing, including assumptions
regarding factors impacting our business, financial results and industry; and other matters. Our
forward-looking statements reflect our views and assumptions on the date of this
presentation regarding future events and operating performance. They involve known and unknown
risks, uncertainties and other factors, many of which may be beyond our control, that may cause
actual results to differ materially from any future results, performance or achievements
expressed or implied by the forward-looking statements. These risks, uncertainties and other
factors include those discussed under the captions “Risk Factors” and
“Management’s Discussion and Analysis of Financial Condition and Results of Operations” in our
Annual Report on Form 10-K for the fiscal year-ended March 31, 2012 and our Quarterly Report
on Form 10-Q for the quarter ended June 30, 2012. We do not undertake any obligation, other
than as required by law, to update or revise any forward-looking statements, whether as a
result of new information, future events or otherwise. |
 3
Bristow is the leading provider of helicopter services
and is a unique investment in oil field services
•
~20 countries
•
551 aircraft
•
~3,400 employees
•
Ticker: BRS
•
Stock price
*
: $45.77/share
•
Market cap
*
: ~$1.7 billion
•
Quarterly dividend of $0.20/share
Bristow flies crews and light cargo to production platforms, vessels and rigs
* Based on 36.4 million fully diluted weighted average shares outstanding for the
three months ended 06/30/2012 and stock price as of July 31, 2012 |
 4
Why Bristow?
$275
•
Bristow
is
the
largest
of
only
two
global
helicopter
providers
•
Bristow is
stable
as we have long term contracts that serve
mostly production
•
Bristow
is
growing
with
demand
not
dependent
on
economic
or commodity cycles
•
Bristow’s
asset
values
are
resilient
even
in
depressed
economic times as there is strong demand for helicopters
outside of E&P
•
Bristow
pays
a
quarterly
dividend
of
$0.20/share
after
a
33%
increase in 2012 (our fiscal year 2013), and has a $100 million
share repurchase authorization |
 5
our industry leading safety program,
creates differentiation and client loyalty
•
Safety is our primary core value
•
Bristow’s ‘Target Zero’
program is now the leading example
emulated industry-wide
•
Safety Performance accounts for 25% of management
incentive compensation
•
2011 National Ocean Industries Association (NOIA) Safety
in Seas Award Winner
TARGET ZERO, |
 6
Bristow services are utilized in every phase of
offshore oil and gas activity, especially production
•
Largest share of revenues (>60%) relates to
oil and gas production, providing stability and
growth opportunities
•
There are ~ 8,000 offshore production
installations worldwide—compared with >600
exploratory drilling rigs
•
~ 1,700 helicopters servicing worldwide oil
and gas industry of which Bristow’s fleet is
approximately one third
•
Bristow revenues primarily driven by
operating expenditures
Typical revenues by segment
Exploration
20%
Development
10%
Production
60%
Other 10%
H e l i c o p t e r t r a n s p o r t a t i o
n s e r v i c e s SEISMIC
EXPLORATION
DEVELOPMENT
PRODUCTION
ABANDONMENT |
 7
Bristow’s contract and operations structure results in more
predictable income with significant operating leverage
Revenue sources
•
Two tiered contract structure includes both:
–
Fixed or monthly standing charge to reserve helicopter
capacity
–
Variable fees based on hours flown with fuel pass through
•
Bristow contracts earn 65% of revenue without flying
Operating income
Fixed
monthly
65%
Variable
hourly
35%
Fixed
monthly
70%
Variable
hourly
30% |
 8
•
Europe represented 39% of Bristow operating
revenue and 42% of adjusted EBITDAR* in Q1
FY13
•
Operating revenue increased to $123.2M in Q1
FY13 from $108.3M in Q1 FY12 with the
addition of four large aircraft and increased
activity with existing clients and new contracts
in NNS and Norway
•
Adjusted EBITDAR increased to $39.7M in
Q1FY13 from $35.7M in Q1 FY12 while
adjusted EBITDAR margin remained relatively
flat at 32.2% in Q1 FY13 versus 33.0% in Q1
FY12
Outlook:
•
Bristow is shortlisted for UK SAR program
with results to be announced in early 2013
•
High activity continues as demonstrated by
new awards for nine aircraft recently
announced. Additional awards are
anticipated next quarter.
FY13 adjusted EBITDAR margin
expected to be ~ low thirties
Europe (EBU)
* Operating revenue and adjusted EBITDAR percentages exclude corporate and
other. |
 9
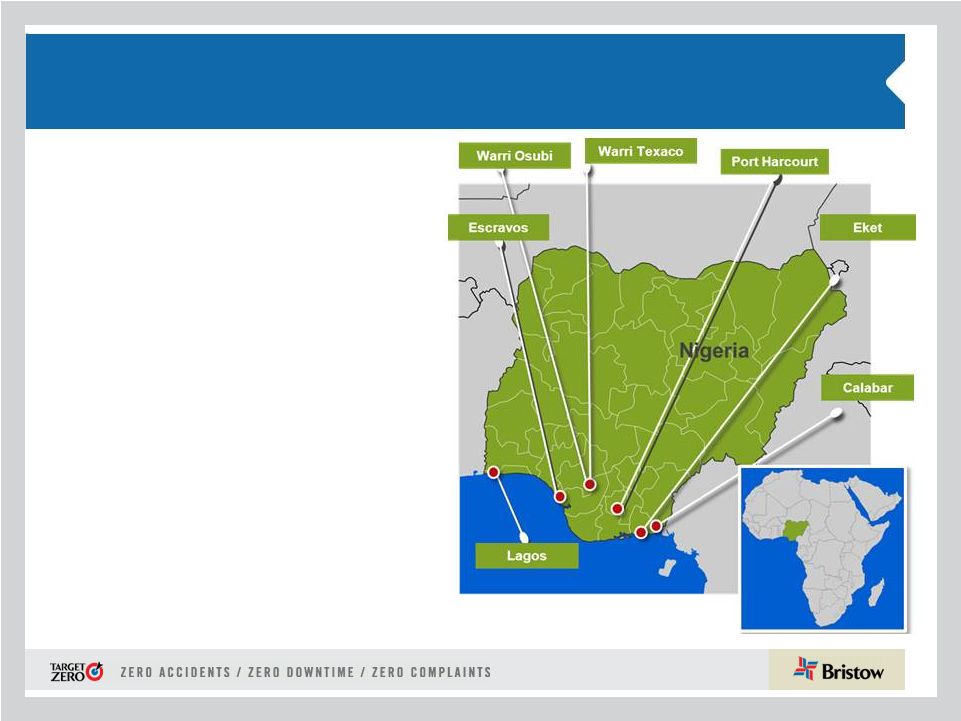
West Africa (WASBU)
•
Nigeria represented 21% of Bristow operating
revenue and 22% of adjusted EBITDAR* in Q1 FY13
•
Operating revenue of $66.4M in Q1 FY13 increased
27% from $52.3M in Q1 FY12 due to strong activity
and a 12% increase in flight hours compared to Q1
FY12
•
Adjusted EBITDAR increased to $21.2M in Q1 FY13
from $15.4M in Q1 FY12 with adjusted EBITDAR
margin of 32% in Q1 FY13 vs 30% in Q1 FY12
•
Outlook:
•
Improved service through Client Promise
initiative continues to drive strong results: Two
existing contracts extended with better pricing
and terms
•
Upcoming heavy maintenance on several
aircraft will impact Q2 and Q3 FY13
•
We continue to work on optimizing the
operating model in this business unit as part
of the local content initiative
FY13 adjusted EBITDAR margin expected
to be ~ low thirties
* Operating revenue and adjusted EBITDAR percentages exclude corporate and
other. |
 10
•
•
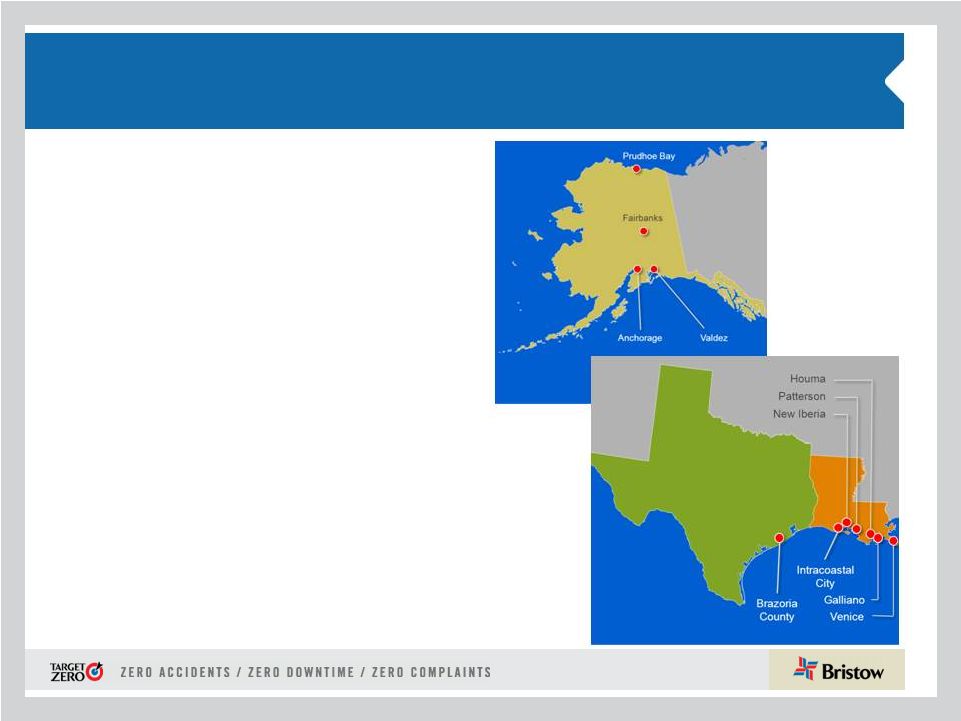
North America represented 17% of Bristow operating
revenue and 13% of adjusted EBITDAR* in Q1 FY13
•
Adjusted EBITDAR almost doubled to $12.2M in Q1 FY13
vs. $6.3M in Q1 FY12 and adjusted EBITDAR margin of
23.2% in Q1 FY13 increased significantly from 14.3% in
Q1 FY12
•
Sequential improvement of almost 50% in adjusted
EBITDAR from $8.2M in Q4 FY12 to $12.2M in the
current quarter
•
The business model performed with key parameters
significantly better: several mid-teen price increases,
large aircraft working and costs contained
Outlook:
•
Our business is improving in FY13 similar to other
oil
service
sector
recoveries
-
more
rigs,
more
people, and more investment
•
Client Promise initiative continues to deliver
positive results
FY13 adjusted EBITDAR expected to be ~ low
twenties
North America (NABU)
* Operating revenue and adjusted EBITDAR percentages exclude corporate and
other. |
 11
Australia (AUSBU)
•
Australia represented 12% of Bristow operating
revenue and 11% of adjusted EBITDAR* in Q1 FY13
•
Operating revenue of $38.2M in Q1 FY13 decreased
from $40.9M in Q1 FY12 due to a decrease in overall
flight activity
•
Adjusted EBITDAR increased to $10.3M in Q1 FY13
from $8.3M in Q1 FY12 and adjusted EBITDAR
margin increased to 27.0% in Q1 FY13 from 20.2% in
Q1 FY12 reflecting better asset utilization along with
lower operating costs
Outlook:
•
INPEX award of a ten-year contract for up to
six large aircraft with an option to add a long
term SAR aircraft with the start date in FY14
•
Aircraft will be redeployed as short term
contracts roll off. This will impact performance
in Q2 and Q3 FY13
•
An additional medium aircraft contract award
with improved terms
* Operating revenue and adjusted EBITDAR percentages exclude corporate and
other. FY13 adjusted EBITDAR margin expected
to be ~ mid to high twenties |
 12
Other International (OIBU)
Other International (OIBU)
•
Other International represented 11% of Bristow operating revenue
and 12% of adjusted EBITDAR* in Q1 FY13
•
Operating revenue decreased to $33.2M in Q1 FY13 vs. $34.5M
in Q1 FY12 due to decrease in activity in Ghana and the end of a
contract in the Baltic Sea
•
Adjusted EBITDAR margin of 36.2% in Q1 FY13 decreased from
48.1% in Q1 FY12 due primarily to decreased earnings from
unconsolidated affiliates (particularly Lider in Brazil), activity
reduction in Mexico, and increased operating costs in Trinidad
•
Lider equity earnings decreased to $0.0M in Q1 FY13 compared
to $2.7M in Q1 FY12
* Operating revenue and adjusted EBITDAR percentages exclude corporate and
other. Outlook:
•
•
•
FY13 adjusted EBITDAR margin expected to be ~ low
to mid forties
Potential new opportunities in Caspian, East Africa, Southeast
Asia, and the Caribbean
Petrobras awarded Lider contracts for five new large aircraft,
with one leased by Bristow to Lider, with operations scheduled
to commence starting in August 2012 through April 2013
Lider’s second half of the year is expected to be better than
the first half as operations under new contracts begin.
Currency fluctuations make it difficult to predict if this will
translate into higher equity earnings |
 13
Our value proposition is based on three principles:
secular growth, financial safety, and balanced return
Long term value for our
shareholders
2. Prudent Balance
Sheet Management
with ample liquidity
1. Growth not dependent
on economic or
commodity cycles
3. Capital Return
through dividends and
opportunistic share repurchases
Investment:
FY 2012 -
2016 |
 14
56
Small
Medium
Large
Total Opportunities *
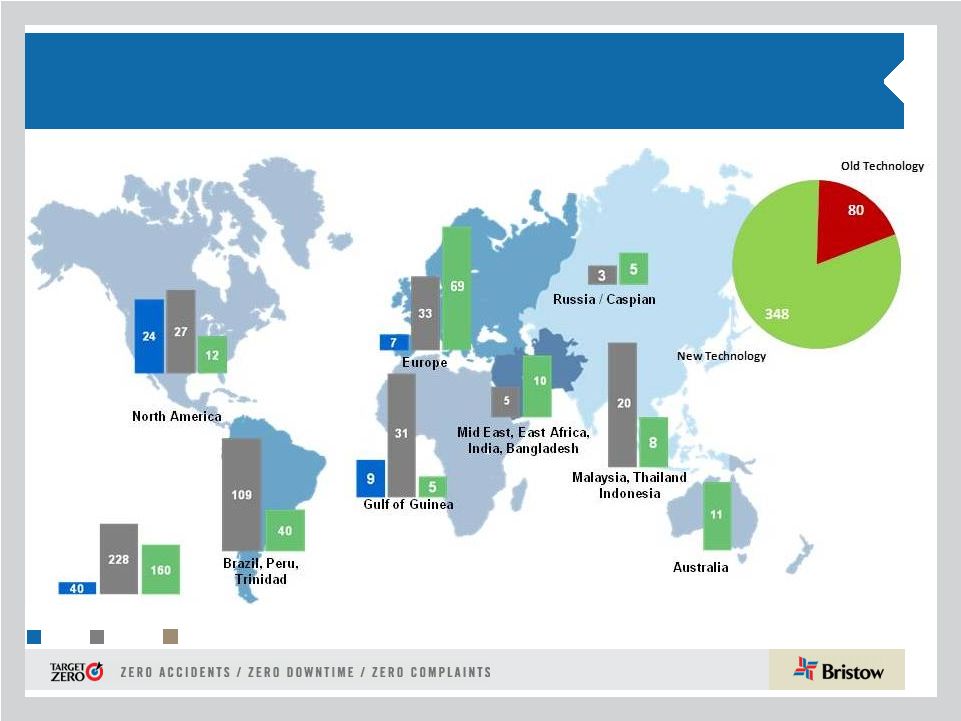
1. Bristow Growth: A wider scope with 428
opportunities identified between FY13 and FY17
30
348
80 |
 15
The market outlook is better as we enter FY13
•
The overall market both in terms of tender activity and pricing is
improving
•
North Sea tender activity remains at historic levels
•
Aircraft supply is tightening with significant SAR requirements
(both governmental and O&G) and faster Brazilian expansion
•
Petrobras board approved 52 incremental aircraft through
FY15 with a focus on heavy aircraft. First ten were awarded, of
which Lider will provide five, and a new bid expected later this
year for next tranche.
•
Demand outside Brazil is at least equal to Petrobras needs
further tightening supply/demand for heavies
•
Most clients increasing activity in GoM as rigs go back to work
•
Eastern Canada new drilling activity increasing with Statoil,
ExxonMobil and Chevron
Overall
activity
above pre-
2008 levels
Brazil growth
accelerates
NABU market
returning |
 16
2. Bristow enjoys the strongest balance sheet in our
industry with ample cash flow, liquidity, and asset value
•
Bristow generated 53% more operating cash flow in
FY12 compared to FY11. Operating cash flow in Q1
FY13 was 5% higher than Q1 FY12 and 48% higher
than the sequential Q4 FY12
•
Bristow closed Q1 FY13 with almost $400 million of
liquidity
•
Current (June 30, 2012) fair market value of aircraft is
well above current (June 30, 2012) share price
•
Adjusted Debt/Capital Ratio less than 45% with a BBB-
rating from Standard and Poor’s
•
Operating lease strategy used to finance growth with a
much lower cost of capital
Prudent
Balance
sheet
management
Significant
Cash Flow
Generation
Ample
Liquidity with
underlying
asset value |
 17
Our focus on returns has yielded much higher
operating cash flow generation . . .
Net cash provided by operating activities
See 10-Q for more information on cash flow provided by operating
activities 29.6
35.0
25.7
52.9
55.4
127.9
195.4
151.4
231.3
0
40
80
120
160
200
240
280
320
FY09
FY10
FY11
FY12
Q1 FY13 |
 18
. . . leading to a robust cash and liquidity position
Total liquidity |
 19
Bristow’s asset values are resilient as there is strong
demand for helicopters outside of oil field services |
 20
3. Bristow has a proven commitment to a balanced return
for our shareholders as demonstrated in the past year
•
FY12 quarterly dividend initiated at
$0.15/share
•
We recently increased the quarterly dividend
by 33% to $0.20/share
•
Bristow has a $100 million share repurchase
authorization with $25 million executed
•
Value is key to decision with net book value
and Aircraft FMV being guide posts
Regular
Dividend
Share
Repurchase |
 21
Bristow provides investors with unique and balanced
return opportunities in various market environments
The “Growth Price Signal”
is provided
by the commercial markets and outlook
for ANNUAL EPS Growth
Cash
Flow Yield
=
OCF + A/C sales –
Depreciation
Market Capitalization
We can provide a balanced return, but some years we
will “Go Faster”
depending on price signals
The “Capital Return Price Signal”
is
provided by the financial markets and
our current free cash flow yield
Today this equals 13.5 %*
FY13
EPS
Guidance:
$3.25
-
$3.55
FY12 –
FY13 EPS
Midpoint
Growth
9.0 %
=
*last trailing twelve months |
 22
Bristow Group Inc. (NYSE: BRS)
2103 City West Blvd., 4
Floor
Houston, Texas 77042
t
713.267.7600
f
713.267.7620
bristowgroup.com
Contact Us
th |
 23
Appendix |
 24
Organizational Chart -
as of June 30, 2012
Business
Unit
(%
of
FY13
Operating
Revenue)
Corporate
Region
( # of Aircraft / # of Locations)
Joint
Venture
(#
of
aircraft)
Key
Operated Aircraft
Bristow owned and/or operated
357 aircraft as of June 30, 2012
Affiliated Aircraft
Bristow affiliates and joint
ventures operated 194 aircraft
as of June 30, 2012 |
 25
Aircraft Fleet –
Medium and Large
As of June 30, 2012
Next Generation Aircraft
Medium capacity 12-16 passengers
Large capacity 18-25 passengers
Mature Aircraft Models
Aircraft
Type
No. of PAX
Engine
Consl
Unconsl
Total
Ordered
Large Helicopters
AS332L Super Puma
18
Twin Turbine
23
-
23
-
AW189
16
Twin Turbine
-
-
-
6
EC225
25
Twin Turbine
18
-
18
-
Mil MI 8
20
Twin Turbine
7
-
7
-
Sikorsky S-61
18
Twin Turbine
2
-
2
-
Sikorsky S-92
19
Twin Turbine
32
4
36
11
82
4
86
17
LACE
76
Medium Helicopters
AW139
12
Twin Turbine
7
2
9
-
Bell 212
12
Twin Turbine
1
14
15
-
Bell 412
13
Twin Turbine
34
20
54
-
EC155
13
Twin Turbine
3
-
3
-
Sikorsky S-76A/A++
12
Twin Turbine
15
5
20
-
Sikorsky S-76C/C++
12
Twin Turbine
52
31
83
-
112
72
184
-
LACE
51 |
  26
Aircraft Fleet –
Small, Training and Fixed
As of June 30, 2012 (continued)
Next Generation Aircraft
Mature Aircraft Models
Small capacity 4-7 passengers
Training capacity 2-6 passengers
•LACE does not include held for sale, training and fixed wing
helicopters Aircraft
Type
No. of PAX
Engine
Consl
Unconsl
Total
Ordered
Small Helicopters
Bell 206B
4
Turbine
1
2
3
-
Bell 206 L-3
6
Turbine
4
6
10
-
Bell 206 L-4
6
Turbine
29
1
30
-
Bell 407
6
Turbine
39
-
39
-
BK 117
7
Twin Turbine
2
-
2
-
BO-105
4
Twin Turbine
2
-
2
-
EC135
7
Twin Turbine
6
3
9
-
83
12
95
-
LACE
21
Training Helicopters
AW139
12
Twin Turbine
-
3
3
-
Bell 412
13
Twin Turbine
-
8
8
-
Bell 212
12
Twin Turbine
-
15
15
-
AS355
4
Twin Turbine
5
-
5
-
AS350BB
4
Turbine
-
36
36
-
Agusta 109
8
Twin Turbine
-
2
2
-
Bell 206B
6
Single Engine
12
-
12
-
Robinson R22
2
Piston
12
-
12
-
Robinson R44
2
Piston
2
-
2
-
Sikorsky 300CB/Cbi
2
Piston
45
-
45
-
Fixed Wing
1
-
1
-
77
64
141
-
Fixed Wing
3
42
45
-
Total
357
194
551
17
TOTAL LACE (Large Aircraft Equivalent)
147 |
 27
Operating lease strategy: lowering the cost and amount of
capital needed to grow
•
Of the 56 aircraft currently leased in our fleet, 30 are training and 26 are
commercial (18 LACE)
•
18 LACE aircraft represent approximately 12% of our commercial fleet
•
Our
goal
is
for
commercial
fleet
operating
leases
to
account
for
20-30%
of
our
LACE
Leased aircraft as of June 30, 2012
Large
Medium
Small
Total
Leased LACE
Total LACE
% Leased
EBU
8
-
-
8
8
47
17%
WASBU
-
1
-
1
1
22
2%
NABU
2
11
1
14
8
30
26%
AUSBU
1
-
2
3
2
18
11%
OIBU
-
-
-
-
32
0%
Total
11
12
3
26
18
147
12%
- |
 28
Consolidated Fleet Changes and Aircraft Sales for
Q1 FY13
EBU
WASBU
NABU
AUSBU
OIBU
Total
Large
3
-
-
3
-
6
Medium
2
1
-
1
7
11
Small
-
-
-
-
-
-
Total
5
1
-
4
7
17
Aircraft held for sale by BU
EBU
WASBU
NABU
AUSBU
OIBU
BA
Total
Large
8
-
2
1
-
-
11
Medium
-
1
11
-
-
-
12
Small
-
-
1
2
-
-
3
Fixed
-
-
-
-
-
-
-
Training
-
-
-
-
-
30
30
Total
8
1
14
3
-
30
56
Leased aircraft in consolidated fleet
# of A/C Sold
Received*
Q1 FY13
4
19
$
Totals
4
19
$
* $ in millions
Q 1 FY13
Fleet Count Beginning Period
361
Delivered
S-92
2
Total Delivered
2
Removed
Sales
(4)
Other*
(2)
Total Removed
(6)
357
* Includes destroyed aircraft, lease returns
and commencements
Fleet changes |
 29
Operating Revenue, LACE and LACE rate by BU
1) $ in millions
2) LACE Rate is annualized
3) $ in millions per LACE
4) OIBU LACE rate is lower than other business units’ LACE rate due to a large proportion of
revenue being from dry leases Operating revenue
1
LACE
LACE Rate
2,3
EBU
123.2
47
10.60
WASBU
66.4
22
12.35
NABU
52.6
30
7.05
AUSBU
38.2
18
8.48
OIBU
4
33.2
32
4.22
Total
313.6
147
8.55
Operating Revenue, LACE, and LACE Rate by BU
as of June 30, 2012 |
  30
Order and options book as of June 30, 2012
#
Helicopter
Class
Delivery Date
Location
Contracted
#
Helicopter
Class
Delivery Date
3
Large
December 2012
EBU
3
1
Large
September 2013
2
Large
December 2012
WASBU
0
1
Large
December 2013
2
Large
March 2013
EBU
2
1
Large
March 2014
1
Large
September 2013
EBU
0
1
Large
June 2014
1
Large
September 2013
NABU
0
1
Large
September 2014
2
Large
December 2013
OIBU
0
1
Large
December 2014
1
Large
September 2014
NABU
0
1
Large
March 2015
1
Large
December 2014
OIBU
0
2
Large
June 2015
1
Large
March 2015
OIBU
0
2
Large
September 2015
1
Large
June 2015
EBU
0
2
Large
December 2015
1
Large
March 2016
EBU
0
1
Large
March 2016
1
Large
June 2016
AUSBU
0
2
Large
June2016
17
5
2
Large
September 2016
2
Large
December 2016
* Six large ordered aircraft expected to enter service beginning
1
Large
March 2017
in calendar year 2014 are subject to the successful development
1
Large
June 2017
and certification of the aircraft.
1
Large
September 2017
1
Large
December 2017
1
Medium
June 2013
4
Medium
December 2013
3
Medium
June 2014
2
Medium
September 2014
2
Medium
June 2015
36
ORDER BOOK*
OPTIONS BOOK |
 31
Adjusted EBITDAR margin* trend
Q1
Q2
Q3
Q4
Full Year
Q1
Q2
Q3
Q4
Full Year
EBU
31.2%
31.7%
31.9%
28.0%
30.8%
29.8%
31.5%
34.6%
34.4%
32.7%
WASBU
31.7%
36.8%
33.7%
39.1%
36.0%
33.7%
36.9%
35.8%
34.3%
35.2%
NABU
18.3%
20.0%
14.9%
17.7%
17.8%
20.8%
25.8%
15.9%
8.5%
18.5%
AUSBU
26.5%
36.7%
34.4%
31.3%
32.4%
33.2%
26.1%
27.0%
31.1%
29.3%
OIBU
34.4%
37.6%
25.9%
25.1%
31.0%
18.3%
40.2%
37.4%
59.4%
39.3%
Consolidated
24.7%
27.8%
24.7%
23.9%
25.3%
23.8%
27.5%
25.9%
29.6%
26.7%
2013
Q1
Q2
Q3
Q4
Full Year
Q1
EBU
33.0%
31.4%
30.7%
36.1%
32.9%
32.2%
WASBU
29.5%
35.5%
37.2%
36.6%
35.0%
31.9%
NABU
14.3%
20.6%
14.8%
19.4%
17.3%
23.2%
AUSBU
20.2%
14.4%
23.5%
35.6%
24.3%
27.0%
OIBU
48.1%
19.1%
47.8%
42.9%
39.5%
36.2%
Consolidated
23.4%
24.0%
27.6%
31.2%
26.6%
26.3%
2010
2011
2012
* Adjusted EBITDAR excludes special items and asset dispositions and calculated by taking adjusted
EBITDAR divided by operating revenue |
  32
Adjusted EBITDAR* reconciliation
* Adjusted EBITDAR excludes special items and asset dispositions
($ in millions)
Q1
Q2
Q3
Q4
Full Year
Q1
Q2
Q3
Q4
Full Year
Net income
$24.0
$33.7
$27.1
$28.7
$113.5
$20.9
$38.8
$42.3
$31.2
$133.3
Income tax expense
9.5
11.2
5.7
2.6
29.0
8.5
3.3
-11.8
7.1
7.1
Interest expense
10.0
10.6
11.0
10.8
42.4
11.0
11.5
13.8
9.9
46.2
Gain on disposal of assets
-6.0
-4.9
-2.4
-5.3
-18.7
-1.7
-1.9
0.0
-5.1
-8.7
Depreciation and amortization
18.2
18.5
20.7
17.4
74.7
19.3
21.0
21.3
27.7
89.4
Special items
2.6
-2.5
-1.1
1.0
0.0
0.0
0.0
-1.2
2.4
1.2
EBITDA Subtotal
58.2
66.7
60.9
55.1
240.9
58.1
72.7
64.4
73.3
268.5
Rental expense
7.0
7.0
7.2
6.3
27.3
6.6
6.1
8.7
7.7
29.2
Adjusted EBITDAR
$65.2
$73.6
$68.1
$61.3
$268.2
$64.7
$78.8
$73.1
$81.1
$297.7
3/31/2013
($ in millions)
Q1
Q2
Q3
Q4
Full Year
Q1
Net income
$21.2
$3.0
$26.5
$14.6
$65.2
$24.2
Income tax expense
6.6
-1.9
7.1
2.4
14.2
6.2
Interest expense
9.0
9.5
9.8
10.0
38.1
8.8
Gain on disposal of assets
-1.4
1.6
2.9
28.6
31.7
5.3
Depreciation and amortization
22.7
25.4
22.7
25.3
96.1
21.4
Special items
0.0
24.6
0.0
3.4
28.1
2.2
EBITDA Subtotal
58.1
62.1
68.9
84.3
273.4
68.0
Rental expense
9.0
9.1
12.8
15.1
46.0
16.3
Adjusted EBITDAR
$67.0
$71.2
$81.8
$99.5
$319.5
$84.3
3/31/2010
3/31/2011
3/31/2012
Fiscal year ended,
Fiscal year ended, |
 33
Bristow Value Added (BVA)
Sample calculation
Bristow Value Added = Gross Cash Flow –
(Gross Operating Assets X Capital Charge)
BVA
= GCF -
(
GOA X 10.5%** )
Bristow Value Added calculation for Q1 FY12
($15.4)
=
$60* -
(
$2,874* X 2.625%** )
Bristow Value Added calculation for Q1 FY13
$1.9 =
$2,976*
X 2.625%** )
* Reconciliation for these items follows right after
this slide ** Quarterly capital charge of 2.625% is based on
annual capital charge of 10.5% $80*
-
( |
 34
Gross Cash Flow Presentation
Special items:
(in millions)
Gross Cash Flow Reconciliation
Q1 FY12
Q1 FY13
Net Income
21
24
Depreciation and Amortization
23
21
Interest Expense
9
9
Interest Income
(0)
(0)
Rent
9
16
Other Income/expense-net
(0)
1
Gain/loss on Asset Sale
(1)
5
Special Items
0
2
Tax Effect from Special Items
0
(2)
Earnings (losses) from Unconsolidated Affiliates, Net
(6)
(2)
Non-controlling Interests
0
1
Gross Cash Flow before Lider
$54
$75
Gross Cash Flow - Lider proportional
6
5
Gross Cash Flow after Lider
$60
$80
FY13 includes: $2.2m special charge for severance costs related to the termination of a contract in the
Southern North Sea |
 35
Gross Operating Asset Presentation
(in millions)
Adjusted Gross Operating Assets Reconciliation
Q1 FY12
Q1 FY13
Total Assets
2,701
2,740
Accumulated Depreciation
463
468
Capitalized Operating Leases
136
194
Cash and Cash Equivalents
(117)
(227)
Investment in Unconsolidated Entities
(210)
(201)
Goodwill
(30)
(29)
Intangibles
(7)
(4)
Assets Held for Sale: Net
(34)
(18)
Assets Held for Sale: Gross
77
86
Adj. for gains & losses on assets sales
(0)
116
Accounts Payable
(51)
(58)
Accrued Maintenance and Repairs
(11)
(16)
Other Accrued Taxes
(4)
(7)
Accrued Wages, Benefits and Related Taxes
(33)
(43)
Other Accrued Liabilities
(18)
(27)
Income Taxes Payable
(16)
(10)
Deferred Revenue
(9)
(13)
ST Deferred Taxes
(10)
(15)
LT Deferred Taxes
(155)
(142)
Adjusted Gross Operating Assets before Lider
$2,672
$2,794
Adjusted Gross Operating Assets - Lider proportional
202
182
Adjusted Gross Operating Assets after Lider
$2,874
$2,976 |
 36
GAAP reconciliation |
 37
Leverage Reconciliation
*Adjusted EBITDAR exclude gains and losses on dispositions of assets
Debt
Investment
Capital
Leverage
(a)
(b)
(c) = (a) + (b)
(a) / (c)
(in millions)
As of June 30, 2012
736.3
$
1,540.7
$
2,277.0
$
32.3%
Adjust for:
Unfunded pension liability
109.8
109.8
NPV of all lease obligations
217.0
217.0
Letters of credit
1.5
1.5
Adjusted
1,064.6
$
(d)
1,540.7
$
2,605.3
$
40.9%
Calculation of debt to adjusted EBITDAR multiple
Adjusted EBITDAR*:
FY 2012
336.8
$
(e)
Annualized
449.1
$
= (d) / (e)
3.16:1 |
 38
Contact Us
Bristow Group Inc. (NYSE: BRS)
2103 City West Blvd., 4
Floor
Houston, Texas 77042
t
713.267.7600
f
713.267.7620
bristowgroup.com
th |