Attached files
| file | filename |
|---|---|
| 8-K - FORM 8-K - Tower Group International, Ltd. | d392728d8k.htm |
 1.
Second Quarter 2012
Earnings Call Presentation
Exhibit 99.1 |
 1
Forward-Looking Statements
The Private Securities Litigation Reform Act of 1995 provides a "safe
harbor" for forward-looking statements. This presentation and any
other written or oral statements made by or on behalf of Tower may
include forward-looking statements that reflect Tower's current
views with respect to future events and financial performance. All statements
other than statements of historical fact included in this presentation are
forward-looking statements. Forward-looking statements can
generally be identified by the use of forward-looking terminology such as "may," "will," "plan," "expect,"
"project," "intend," "estimate," "anticipate,"
"believe" and "continue" or their negative or variations or similar terminology.
All forward-looking statements address matters that involve risks and
uncertainties. Accordingly, there are or will be important factors that
could cause the actual results of Tower to differ materially from those indicated in these
statements. Please refer to Tower’s filings with the SEC, including
among others Tower’s Annual Report on Form 10-K for the year
ended December 31, 2011 and subsequent filings on Form 10-Q, for a description of the important factors that
could cause the actual results of Tower to differ materially from those
indicated in these statements. Forward-looking statements
speak only as of the date on which they are made, and Tower undertakes
no obligation to update publicly or revise any forward-looking
statement, whether as a result of new information, future developments or otherwise.
Notes on Non-GAAP Financial Measures
Operating income excludes realized gains and losses, acquisition-related
transaction costs and the results of the reciprocal business, net of
tax. This is a common measurement for property and casualty insurance companies. We
believe this presentation enhances the understanding of our results of
operations by highlighting the underlying profitability of our insurance
business. Additionally, these measures are a key internal management performance
standard. Operating earnings per share is operating income divided by diluted
weighted average shares outstanding. Operating return on equity is
annualized operating income divided by average common stockholders' equity.
Total premiums include gross premiums written through our insurance
subsidiaries and produced as managing general agent on behalf of other
insurance companies, including the reciprocal exchanges. |
 2
Overview of the Operating Results |
 3
Second Quarter Snapshot
Second quarter operating results
•
Net operating loss of $15.5 million, or ($0.39) per diluted share compared
with operating income of $26.0 million, or $0.63 per diluted share same
period last year
»
Excluding the after-tax loss reserve charge of $42 million, Tower achieved
strong operating results
Organic growth initiative and improving market conditions drive strong
top line growth
•
14.9%
top
line
growth
in
2Q
driven
from
growth
from
new
business
units
•
Improving market conditions, especially in property and specialty lines of
business •
Developing a strong pipeline of organic growth opportunities
Exercised option to combine with Canopius Holdings Bermuda Limited
and Canopius Bermuda Limited (together, “Canopius Bermuda”)
•
Will
enable
Tower
to
create
a
global
specialty
insurance
company
with
greater
diversification
•
Access to U.S., Bermuda and Lloyd’s markets supported by an efficient
international holding company structure
•
Enables
Tower
to
increase
its
ROE
target
to
13%
to
15%
within
18
months
of
merger |
 4
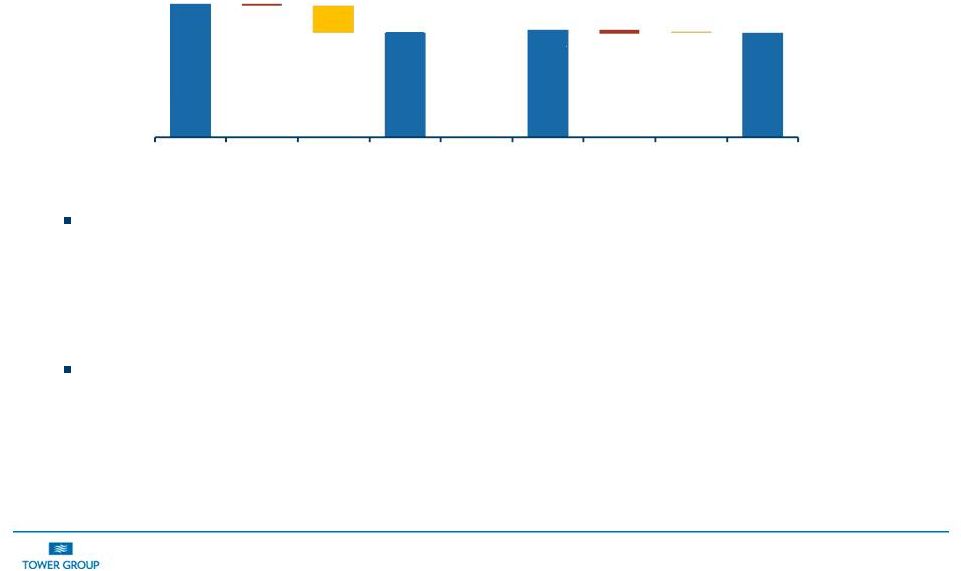
Second Quarter 2012 Highlights
*Stockholders equity reduced by $95 million from stock repurchases and
dividends since 2Q11 -
0.3
3.3
42.3
4.6
2Q12
Storms
Dev.
Pro -
Forma
2Q12
2Q11
Storms
Dev.
Pro -
Forma
2Q11
Operating Earnings ($ millions)
2Q12
2Q11
0.08
1.08
0.11
-
0.01
2Q12
Storms
Dev.
Pro -
Forma
2Q12
2Q11
Storms
Dev.
Pro -
Forma
2Q11
Operating EPS (Loss)
2Q12
2Q11
2Q12
2Q11
Book Value per Share ($)*
2Q12
2Q11
Stockholders' Equity ($ millions)* |
 5
Second Quarter Highlights
109.7
94.1
93.3
93.4
1.2
15.6
2.1
-
0.1
2Q12
Storms
Dev.
Pro -
Forma
2Q12
2Q11
Storms
Dev.
Pro -
Forma
2Q11
Combined Ratio (%)
2Q12
2Q11
1.3
16.2
1.7
-
0.1
2Q12
Storms
Dev.
Pro -
Forma
2Q12
2Q11
Storms
Dev.
Pro -
Forma
2Q11
Operating ROE (%)
2Q12
2Q11 |
 6
Organic Growth Initiative is Driving Top Line Growth
Organic Growth Initiative Second Quarter 2012 Status
Expand products:
•
Continued product expansion into mono-line commercial property, inland
marine, surety and package policies focusing on affluent clients
Develop entrepreneurial businesses
•
Continued
production
from
newly
created
businesses
including
assumed
reinsurance
($48
million
of
GWP in the second quarter), customized solutions and National Commercial
Property business units Develop key processes related to generating
organic growth •
Recently expanded marketing department developing a pipeline of organic growth
opportunities 537.6
468.0
2Q12
2Q11
Gross Premiums Written and Managed
($ millions)
15% |
 7
Business Segment Results
Commercial
Personal**
Insurance
General
Specialty
Services
Business Units / Products
Small business;
Middle market
National Programs, E&S,
Customized Solutions,
Transportation and
Assumed Reinsurance
Homeowners and
private passenger
auto
2Q12 GPW* ($ millions)
$175
$195
$168
$9***
2Q11 GPW* ($ millions)
185
131
152
8***
2Q12 % of total GPW
33%
36%
31%
n/a
Commercial Consolidated
Loss Ratio
83.3%
52.1%
n/a
Expense Ratio
32.2%
39.8%
n/a
Combined Ratio
115.5%
91.9%
n/a
Retention
78%
92%
n/a
Renewal Premium Change
4.2%
2.6%
n/a
Segment
Summary
* Gross premiums written and managed
** Loss, Expense and Combined ratios exclude
reciprocal business ***Total revenue for the segment
Accelerated focus
on small premium
size segment across
all lines of business
Seeing signs of
pricing improvement
in the middle
market business
Completed
termination of
unprofitable program
business with a
focus on profitable
specialty programs
Growth driven
primarily by
assumed
reinsurance
business
Successful rollout of
personal lines
system; on pace to
replace legacy
system by middle of
2012
Continued expansion
into affluent
personal lines
market
Expanding licensing
to expand writings
in other states and
thereby increasing
fee income |
 8
Net Loss and Loss Expense Ratio, Excluding Reciprocals
Prior to the charge, Tower has had minimal history of adverse
development •
Prior to the 2Q charge, less than $30 million total adverse development since
going public in 2004 (including $7 million from late reported storm
losses in 2011) •
$65M
2Q
reserve
strengthening
is
a
culmination
of
multi-year
actions
that
began
in
the
4Q
2009 to mitigate prolonged soft market conditions
»
Reserve charge should allow Tower’s prospective financial results to
fully reflect current accident year profitability going forward
Positive reserves and underwriting outlook
•
Reserve strengthening improves the overall reserve position
»
6-30 reserves now exceed the year end 2011 central estimates developed by
the outside actuaries
•
Historical loss ratio remains favorable after reserve strengthening (62.3 %
from 2008 to 2011 excluding 2.4 point of storm losses)
•
Shift in business mix, corrective underwriting and claims cost reduction
projected to reduce 2012 accident year loss ratio by 2 to 4 points
(61.5% projected in 2012) 77.3
60.5
62.4
1.2
15.6
2.1
-0.1
2Q12
Storms
Dev.
Pro -
Forma
2Q12
2Q11
Storms
Dev.
Pro -
Forma
2Q11
Loss
Ratio
and
Reserves
(%)
2Q12
2Q11
60.4 |
 9
19.2%
17.8%
10.8%
11.3%
3.6%
3.9%
33.6%
33.0%
2Q12
2Q11
Commissions, net of ceding commissions
OUE, net of fees
BB&T expenses
Expense Ratio Excluding Reciprocals
Revised
allocation
to
claims
costs
resulted
in
1
point
year
over
year
increase
in
other underwriting expenses (OUE)
Commission rate higher year over year due to assumed reinsurance, this should
trend down in second half of year
As
systems
initiatives
relating
to
personal
lines
are
completed,
we
expect
scale
advantage to drive expense ratio down
Note: Excludes reciprocals |
 10
Improving Investment Performance
Note: Excludes reciprocals
$2,434
$2,281
6-30-2012
6-30-2011
Cash and Invested Assets ($millions)
4.8
4.7
6-30-2012
6-30-2011
Tax-
Equivalent Fixed Income
Yield (%)
$30
$30
6-30-2012
6-30-2011
Net Investment Income
($millions)
Alternative
investment
commitment
remains
modest
but
assets
have
begun
to generate positive returns in 2Q12 and should provide higher yield and
diversification from interest rate risk inherent in fixed-income
investments, and reduce capital markets volatility
Operating cash flows improved in 2Q12 as compared to 2Q11
|
 11
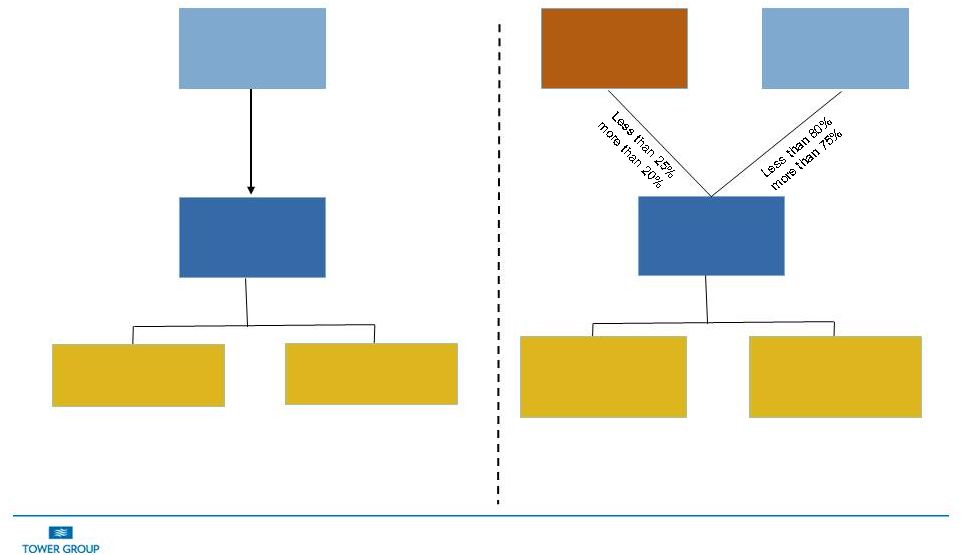
High Level Merger Corporate Chart
*CP RE used solely to reinsure US Pool
100%
CURRENT STATE
Note: After merger completion, Tower expects U.S. and Bermuda
operations to have comparable capital bases. TWGP shareholders
get$1.25 per share in cash consideration and the company increases
its capital by between $190 million to $240 million
POST MERGER
Tower
Shareholders
US HOLDCO
CP RE
US POOL*
New
Shareholders
Tower
Shareholders
Bermuda
Operations
Lloyd’s and CPRe
business
Tower and its
Subsidiaries
U.S. Operations
Tower Group
International
Holding Company |
 12
Positive Trends and Guidance
2Q12*
2H12*
2012 Target*
Trend
through remainder of 2012
Annual GPW Growth
14.9%
< 5%
Anticipate growth on the upper end of our 5% to 10% range
due to organic growth initiatives and improving market
conditions
Loss Ratio
77.3%
61.5%-62.5%
The loss ratio trend for 2H12 should improve due to re-
underwriting and pricing actions, shift to profitable specialty
and property business and declining impact of the runoff
business. No further adverse development is anticipated
Expense Ratio
33.6%
33.5%-34.5%
Expense ratio should benefit over remainder of year from
lower acquisition cost trends, lower systems costs at end of
year and leveling of OUE by year end
Combined Ratio
110.9%
95.0%-97.0%
Future improvement will be driven primarily by reduction in
loss and expense ratios expected over the balance of the
year
Investment Yield
4.8%
4.6%-4.8%
Continued growth in invested asset base and book yield
stabilization due to alternative and strategic investments
Operating ROE &
2012 Guidance
(5.9%)
10.0%
-11.0%
We expect to see improvement to 10%-12% range occurring
in second half of year and continuing into 2013
*Excludes reciprocals
99.5%
5.0%
$1.45
4.7%
-
$1.55
-
6.0%
-
4.8%
-
101.5%
33.5%
-
34.5%
66%
67%
-
5%
10%
- |