Attached files
| file | filename |
|---|---|
| 8-K - FORM 8-K - CORPORATE PROPERTY ASSOCIATES 16 GLOBAL INC | d392256d8k.htm |
Exhibit 99.1

Corporate Property Associates 16 – Global Incorporated
Supplemental Unaudited Information
As of June 30, 2012
As used in this supplemental package, the terms “the Company,” “we,” “us” and “our” include Corporate Property Associates
16 – Global Incorporated (“CPA®:16 – Global”), its consolidated subsidiaries and predecessors, unless otherwise indicated.
Important Note Regarding Non-GAAP Financial Measures
This supplemental package includes non-GAAP measures, including funds from operations (“FFO”), modified funds from operations (“MFFO”), adjusted cash flow from operating activities (“ACFO”), and total adjusted revenue. A description of these non-GAAP measures and reconciliations to the most directly comparable GAAP measures are provided in this supplemental package.
Forward-Looking Statements
This supplemental package contains forward-looking statements within the meaning of the Federal securities laws. It is important to note that our actual results could be materially different from those projected in such forward-looking statements. You should exercise caution in relying on forward-looking statements as they involve known and unknown risks, uncertainties and other factors that may materially affect our future results, performance, achievements or transactions. Information on factors which could impact actual results and forward-looking statements contained herein is included in our filings with the Securities and Exchange Commission, including but not limited to our Annual Report on Form 10-K for the year ended December 31, 2011. We do not undertake to revise or update any forward-looking statements.
| Executive Offices 50 Rockefeller Plaza New York, NY 10020 Tel: 1-800-WPCAREY or (212) 492-1100 Fax: (212) 492-8922 Web Site Address: www.CPA16GLOBAL.com |
Investor Relations Susan C. Hyde Managing Director & Director of Investor Relations W. P. Carey & Co. LLC Phone: (212) 492-1151 |
Corporate Property Associates 16 – Global Incorporated
Reconciliation of Net Income (Loss) Attributable to CPA®:16 – Global Shareholders
to Modified Funds From Operations (MFFO) (Unaudited)
(in thousands, except share and per share amounts)
| Three Months Ended June 30, | Six Months Ended June 30, | |||||||||||||||
| 2012 | 2011 | 2012 | 2011 | |||||||||||||
| Net income (loss) attributable to CPA®:16 - Global shareholders |
$ | 7,977 | $ | (20,171 | ) | $ | 15,297 | $ | (14,766 | ) | ||||||
| Adjustments: |
||||||||||||||||
| Depreciation and amortization of real property |
25,578 | 22,765 | 52,088 | 37,903 | ||||||||||||
| Impairment charges (a) |
— | 12,889 | 495 | 12,889 | ||||||||||||
| (Gain) loss on sale of real estate, net |
(2 | ) | 140 | 2,189 | 140 | |||||||||||
| Proportionate share of adjustments to equity in net income of partially-owned entities to arrive at FFO: |
||||||||||||||||
| Depreciation and amortization of real property |
3,962 | 4,217 | 7,414 | 6,585 | ||||||||||||
| Impairment charges (a) |
84 | 1 | 84 | — | ||||||||||||
| Gain (loss) on sale of real estate |
3 | — | (322 | ) | 2 | |||||||||||
| Proportionate share of adjustments for noncontrolling interests to arrive at FFO |
(2,565 | ) | (3,615 | ) | (5,819 | ) | (9,490 | ) | ||||||||
|
|
|
|
|
|
|
|
|
|||||||||
| Total adjustments |
27,060 | 36,397 | 56,129 | 48,029 | ||||||||||||
|
|
|
|
|
|
|
|
|
|||||||||
| FFO — as defined by NAREIT (a) |
35,037 | 16,226 | 71,426 | 33,263 | ||||||||||||
|
|
|
|
|
|
|
|
|
|||||||||
| Adjustments: |
||||||||||||||||
| Issuance of Special Member Interest |
— | 34,300 | — | 34,300 | ||||||||||||
| Bargain purchase gain on acquisition |
— | (28,709 | ) | — | (28,709 | ) | ||||||||||
| (Gain) loss on extinguishment of debt (b) |
(5,670 | ) | 2,479 | (5,164 | ) | 2,479 | ||||||||||
| Other depreciation, amortization and non-cash charges |
2,459 | 97 | 1,460 | (748 | ) | |||||||||||
| Straight-line and other rent adjustments (c) |
(1,268 | ) | (6,263 | ) | (3,415 | ) | (6,998 | ) | ||||||||
| Acquisition expenses (d) |
127 | 94 | 234 | 189 | ||||||||||||
| Merger expenses (d) |
6 | 12,026 | 99 | 12,026 | ||||||||||||
| Amortization of deferred financing costs |
(117 | ) | — | 740 | — | |||||||||||
| Above-market rent intangible lease amortization, net (e) |
5,428 | 3,815 | 9,936 | 4,435 | ||||||||||||
| (Accretion of discounts) / amortization of premiums on debt investments, net |
(546 | ) | 435 | 82 | 509 | |||||||||||
| Realized gains on foreign currency, derivatives and other (f) |
(84 | ) | (1,594 | ) | — | (1,539 | ) | |||||||||
| Unrealized losses (gains) on mark-to-market adjustments (g) |
66 | (32 | ) | 84 | (32 | ) | ||||||||||
| Proportionate share of adjustments to equity in net income of partially-owned entities to arrive at MFFO: |
||||||||||||||||
| Other depreciation, amortization and other non-cash charges |
(33 | ) | 12 | (3 | ) | 44 | ||||||||||
| Straight-line and other rent adjustments (c) |
(48 | ) | (1,491 | ) | 65 | (1,673 | ) | |||||||||
| Loss on extinguishment of debt |
83 | — | 83 | — | ||||||||||||
| Acquisition expenses (d) |
64 | 64 | 128 | 128 | ||||||||||||
| Above (below)-market rent intangible lease amortization, net (e) |
923 | 452 | 1,848 | 522 | ||||||||||||
| Realized losses (gains) on foreign currency, derivatives and other (f) |
5 | (26 | ) | 30 | (33 | ) | ||||||||||
| Unrealized gains on mark-to-market adjustments (g) |
— | (2 | ) | — | (2 | ) | ||||||||||
| Proportionate share of adjustments for noncontrolling interests to arrive at MFFO |
4,208 | 22 | 3,965 | 231 | ||||||||||||
|
|
|
|
|
|
|
|
|
|||||||||
| Total adjustments |
5,603 | 15,679 | 10,172 | 15,129 | ||||||||||||
|
|
|
|
|
|
|
|
|
|||||||||
| MFFO (c) (d) | $ | 40,640 | $ | 31,905 | $ | 81,598 | $ | 48,392 | ||||||||
|
|
|
|
|
|
|
|
|
|||||||||
| MFFO per share | $ | 0.22 | $ | 0.20 | $ | 0.42 | $ | 0.34 | ||||||||
|
|
|
|
|
|
|
|
|
|||||||||
| Weighted average shares outstanding | 201,829,673 | 174,466,678 | 201,567,879 | 150,639,007 | ||||||||||||
|
|
|
|
|
|
|
|
|
|||||||||
CPA®:16 – Global 6/30/2012 Supplemental 8-K — 2
MFFO per share calculation:
| Three Months Ended June 30, | Six Months Ended June 30, | |||||||||||||||
| 2012 | 2011 | 2012 | 2011 | |||||||||||||
| MFFO |
$ | 40,640 | $ | 31,905 | $ | 81,598 | $ | 48,392 | ||||||||
| Issuance of shares to an affiliate in satisfaction of fees due |
4,649 | 3,031 | 2,350 | 2,298 | ||||||||||||
|
|
|
|
|
|
|
|
|
|||||||||
| MFFO numerator in determination of MFFO per share |
$ | 45,289 | $ | 34,936 | $ | 83,948 | $ | 50,690 | ||||||||
|
|
|
|
|
|
|
|
|
|||||||||
| (a) | The SEC Staff has recently stated that they take no position on the inclusion or exclusion of impairment write-downs in arriving at FFO. Since 2003, the National Association of Real Estate Investment Trusts, Inc., or NAREIT, an industry trade group, has taken the position that the exclusion of impairment charges is consistent with its definition of FFO. Accordingly, we have revised our computation of FFO to exclude impairment charges, if any, in arriving at FFO for all periods presented. |
| (b) | This relates to our share of gain on the extinguishment of debt recognized by a jointly-owned investment |
| (c) | Under GAAP, rental receipts are allocated to periods using various methodologies. This may result in income recognition that is significantly different than underlying contract terms. By adjusting for these items (to reflect such payments from a GAAP accrual basis to a cash basis of disclosing the rent and lease payments), management believes that MFFO provides useful supplemental information on the realized economic impact of lease terms and debt investments, provides insight on the contractual cash flows of such lease terms and debt investments, and aligns results with management’s analysis of operating performance. |
| (d) | In evaluating investments in real estate, management differentiates the costs to acquire the investment from the operations derived from the investment. Such information would be comparable only for non-listed REITs that have completed their acquisition activity and have other similar operating characteristics. By excluding expensed acquisition costs, management believes MFFO provides useful supplemental information that is comparable for each type of real estate investment and is consistent with management’s analysis of the investing and operating performance of our properties. Acquisition fees and expenses include payments to our advisor or third parties. Acquisition fees and expenses under GAAP are considered operating expenses and as expenses included in the determination of net income and income from continuing operations, both of which are performance measures under GAAP. All paid and accrued acquisition fees and expenses will have negative effects on returns to shareholders, the potential for future distributions, and cash flows generated by us, unless earnings from operations or net sales proceeds from the disposition of properties are generated to cover the purchase price of the property, these fees and expenses and other costs related to the property. |
| (e) | Under GAAP, certain intangibles are accounted for at cost and reviewed at least annually for impairment, and certain intangibles are assumed to diminish predictably in value over time and amortized, similar to depreciation and amortization of other real estate related assets that are excluded from FFO. However, because real estate values and market lease rates historically rise or fall with market conditions, management believes that by excluding charges relating to amortization of these intangibles, MFFO provides useful supplemental information on the performance of the real estate. |
| (f) | Management believes that adjusting for fair value adjustments for derivatives provides useful information because such fair value adjustments are based on market fluctuations and may not be directly related or attributable to our operations. |
| (g) | Management believes that adjusting for mark-to-market adjustments is appropriate because they are items that may not be reflective of on-going operations and reflect unrealized impacts on value based only on then current market conditions, although they may be based upon current operational issues related to an individual property or industry or general market conditions. The need to reflect mark-to-market adjustments is a continuous process and is analyzed on a quarterly and/or annual basis in accordance with GAAP. |
Non-GAAP Financial Disclosure – FFO and MFFO
Due to certain unique operating characteristics of real estate companies, as discussed below, NAREIT has promulgated a measure known as funds from operations, or FFO, which we believe to be an appropriate supplemental measure to reflect the operating performance of a real estate investment trust, or REIT. The use of FFO is recommended by the REIT industry as a supplemental performance measure. FFO is not equivalent to nor a substitute for net income or loss as determined under GAAP.
We define FFO, a non-GAAP measure, consistent with the standards established by the White Paper on FFO approved by the Board of Governors of NAREIT, as revised in February 2004, or the White Paper. The White Paper defines FFO as net income or loss computed in accordance with GAAP, excluding gains or losses from sales of property, impairment charges on real estate and depreciation and amortization; and after adjustments for unconsolidated partnerships and jointly-owned investments. Adjustments for unconsolidated partnerships and jointly-owned investments are calculated to reflect FFO. Our FFO calculation complies with NAREIT’s policy described above.
CPA®:16 – Global 6/30/2012 Supplemental 8-K — 3
The historical accounting convention used for real estate assets requires straight-line depreciation of buildings and improvements, which implies that the value of real estate assets diminishes predictably over time, especially if such assets are not adequately maintained or repaired and renovated as required by relevant circumstances and/or is requested or required by lessees for operational purposes in order to maintain the value disclosed. We believe that, since real estate values historically rise and fall with market conditions, including inflation, interest rates, the business cycle, unemployment and consumer spending, presentations of operating results for a REIT using historical accounting for depreciation may be less informative. Historical accounting for real estate involves the use of GAAP. Any other method of accounting for real estate such as the fair value method cannot be construed to be any more accurate or relevant than the comparable methodologies of real estate valuation found in GAAP. Nevertheless, we believe that the use of FFO, which excludes the impact of real estate-related depreciation and amortization as well as impairment charges of real estate-related assets, provides a more complete understanding of our performance to investors and to management, and when compared year over year, reflects the impact on our operations from trends in occupancy rates, rental rates, operating costs, general and administrative expenses, and interest costs, which may not be immediately apparent from net income. In particular, we believe it is appropriate to disregard impairment charges, as this is a fair value adjustment that is largely based on market fluctuations and assessments regarding general market conditions which can change over time. An asset will only be evaluated for impairment if certain impairment indications exist and if the carrying, or book value, exceeds the total estimated undiscounted future cash flows (including net rental and lease revenues, net proceeds on the sale of the property, and any other ancillary cash flows at a property or group level under GAAP) from such asset. Investors should note, however, that determinations of whether impairment charges have been incurred are based partly on anticipated operating performance, because estimated undiscounted future cash flows from a property, including estimated future net rental and lease revenues, net proceeds on the sale of the property, and certain other ancillary cash flows, are taken into account in determining whether an impairment charge has been incurred. While impairment charges are excluded from the calculation of FFO described above, investors are cautioned that, due to the fact that impairments are based on estimated future undiscounted cash flows and the relatively limited term of our operations, it could be difficult to recover any impairment charges. However, FFO and MFFO, as described below, should not be construed to be more relevant or accurate than the current GAAP methodology in calculating net income or in its applicability in evaluating the operating performance of the company. The method utilized to evaluate the value and performance of real estate under GAAP should be construed as a more relevant measure of operational performance and considered more prominently than the non-GAAP FFO and MFFO measures and the adjustments to GAAP in calculating FFO and MFFO.
Changes in the accounting and reporting promulgations under GAAP (for acquisition fees and expenses from a capitalization/depreciation model to an expensed-as-incurred model) were put into effect in 2009. These other changes to GAAP accounting for real estate subsequent to the establishment of NAREIT’s definition of FFO have prompted an increase in cash-settled expenses, specifically acquisition fees and expenses for all industries as items that are expensed under GAAP, that are typically accounted for as operating expenses. Management believes these fees and expenses do not affect our overall long-term operating performance. Publicly registered, non-listed REITs typically have a significant amount of acquisition activity and are substantially more dynamic during their initial years of investment and operation. While other start-up entities may also experience significant acquisition activity during their initial years, we believe that non-listed REITs are unique in that they have a limited life with targeted exit strategies within a relatively limited time frame after acquisition activity ceases. As disclosed in the prospectus for our follow-on offering dated April 28, 2006 (the “Prospectus”), we intend to begin the process of achieving a liquidity event (i.e., listing of our common stock on a national exchange, a merger or sale of our assets or another similar transaction) within eight to 12 years following the investment of substantially all of the proceeds from our initial public offering, which was terminated in March 2005. Thus, we do not intend to continuously purchase assets and intend to have a limited life. Due to the above factors and other unique features of publicly registered, non-listed REITs, the Investment Program Association (“IPA”), an industry trade group, has standardized a measure known as MFFO, which the IPA has recommended as a supplemental measure for publicly registered non-listed REITs and which we believe to be another appropriate supplemental measure to reflect the operating performance of a non-listed REIT having the characteristics described above. MFFO is not equivalent to our net income or loss as determined under GAAP, and MFFO may not be a useful measure of the impact of long-term operating performance on value if we do not continue to operate with a limited life and targeted exit strategy, as currently intended. We believe that, because MFFO excludes costs that we consider more reflective of investing activities and other non-operating items included in FFO and also excludes acquisition fees and expenses that affect our operations only in periods in which properties are acquired, MFFO can provide, on a going forward basis, an indication of the sustainability (that is, the capacity to continue to be maintained) of our operating performance after the period in which we are acquiring properties and once our portfolio is in place. By providing MFFO, we believe we are presenting useful information that assists investors and analysts to better assess the sustainability of our operating performance now that our offering has been completed and essentially all of our properties have been acquired. We also believe that MFFO is a recognized measure of sustainable operating performance by the non-listed REIT industry. Further, we believe MFFO is useful in comparing the sustainability of our operating performance since our offering and essentially all of our acquisitions are completed with the sustainability of the operating performance of other real estate companies that are not as involved in acquisition activities. Investors are cautioned that MFFO should only be used to assess the sustainability of a company’s operating performance after a company’s offering has been completed and properties have been acquired, as it excludes acquisition costs that have a negative effect on a company’s operating performance during the periods in which properties are acquired.
CPA®:16 – Global 6/30/2012 Supplemental 8-K — 4
We define MFFO, a non-GAAP measure, consistent with the IPA’s Guideline 2010-01, Supplemental Performance Measure for Publicly Registered, Non-Listed REITs: Modified Funds from Operations, or the Practice Guideline, issued by the IPA in November 2010. The Practice Guideline defines MFFO as FFO further adjusted for the following items, as applicable, included in the determination of GAAP net income: acquisition fees and expenses; amounts relating to deferred rent receivables and amortization of above and below market leases and liabilities (which are adjusted in order to reflect such payments from a GAAP accrual basis to a cash basis of disclosing the rent and lease payments); accretion of discounts and amortization of premiums on debt investments; nonrecurring impairments of real estate-related investments (i.e., infrequent or unusual, not reasonably likely to recur in the ordinary course of business); mark-to-market adjustments included in net income; nonrecurring gains or losses included in net income from the extinguishment or sale of debt, hedges, foreign exchange, derivatives or securities holdings where trading of such holdings is not a fundamental attribute of the business plan, unrealized gains or losses resulting from consolidation from, or deconsolidation to, equity accounting, and after adjustments for consolidated and unconsolidated partnerships and jointly-owned investments, with such adjustments calculated to reflect MFFO on the same basis. The accretion of discounts and amortization of premiums on debt investments, nonrecurring unrealized gains and losses on hedges, foreign exchange, derivatives or securities holdings, unrealized gains and losses resulting from consolidations, as well as other listed cash flow adjustments are adjustments made to net income in calculating the cash flows provided by operating activities and, in some cases, reflect gains or losses which are unrealized and may not ultimately be realized. While we are responsible for managing interest rate, hedge and foreign exchange risk, we retain an outside consultant to review all our hedging agreements. Inasmuch as interest rate hedges are not a fundamental part of our operations, we believe it is appropriate to exclude such infrequent gains and losses in calculating MFFO, as such gains and losses are not reflective of on-going operations.
Our MFFO calculation complies with the IPA’s Practice Guideline described above. In calculating MFFO, we exclude acquisition-related expenses, amortization of above- and below-market leases, fair value adjustments of derivative financial instruments, deferred rent receivables and the adjustments of such items related to noncontrolling interests. Under GAAP, acquisition fees and expenses are characterized as operating expenses in determining operating net income. These expenses are paid in cash by a company. All paid and accrued acquisition fees and expenses will have negative effects on returns to investors, the potential for future distributions, and cash flows generated by the company, unless earnings from operations or net sales proceeds from the disposition of other properties are generated to cover the purchase price of the property, these fees and expenses and other costs related to such property. Further, under GAAP, certain contemplated non-cash fair value and other non-cash adjustments are considered operating non-cash adjustments to net income in determining cash flow from operating activities. In addition, we view fair value adjustments of derivatives and gains and losses from dispositions of assets as infrequent items or items which are unrealized and may not ultimately be realized, and which are not reflective of on-going operations and are therefore typically adjusted for assessing operating performance.
Our management uses MFFO and the adjustments used to calculate it in order to evaluate our performance against other non-listed REITs which have limited lives with short and defined acquisition periods and targeted exit strategies shortly thereafter. As noted above, MFFO may not be a useful measure of the impact of long-term operating performance on value if we do not continue to operate in this manner. We believe that our use of MFFO and the adjustments used to calculate it allow us to present our performance in a manner that reflects certain characteristics that are unique to non-listed REITs, such as their limited life, limited and defined acquisition period and targeted exit strategy, and hence that the use of such measures is useful to investors. For example, acquisition costs were generally funded from the proceeds of our offering and other financing sources and not from operations. By excluding expensed acquisition costs, the use of MFFO provides information consistent with management’s analysis of the operating performance of the properties. Additionally, fair value adjustments, which are based on the impact of current market fluctuations and underlying assessments of general market conditions, but can also result from operational factors such as rental and occupancy rates, may not be directly related or attributable to our current operating performance. By excluding such changes that may reflect anticipated and unrealized gains or losses, we believe MFFO provides useful supplemental information.
Presentation of this information is intended to provide useful information to investors as they compare the operating performance of different REITs, although it should be noted that not all REITs calculate FFO and MFFO the same way, so comparisons with other REITs may not be meaningful. Furthermore, FFO and MFFO are not necessarily indicative of cash flow available to fund cash needs and should not be considered as an alternative to net income (loss) or income (loss) from continuing operations as an indication of our performance, as an alternative to cash flows from operations as an indication of our liquidity, or indicative of funds available to fund our cash needs including our ability to make distributions to our shareholders. FFO and MFFO should be reviewed in conjunction with other GAAP measurements as an indication of our performance.
Neither the SEC, NAREIT nor any other regulatory body has passed judgment on the acceptability of the adjustments that we use to calculate FFO or MFFO. In the future, the SEC, NAREIT or another regulatory body may decide to standardize the allowable adjustments across the non-listed REIT industry and we would have to adjust our calculation and characterization of FFO or MFFO accordingly.
CPA®:16 – Global 6/30/2012 Supplemental 8-K — 5
Corporate Property Associates 16 – Global Incorporated
Adjusted Cash Flow from Operating Activities (ACFO) (Unaudited)
(in thousands)
The following summarizes our cash flows:
| Six Months Ended June 30, | ||||||||
| 2012 | 2011 | |||||||
| Cash flow provided by operating activities |
$ | 94,072 | $ | 63,254 | ||||
|
|
|
|
|
|||||
| Cash flow provided by (used in) investing activities |
$ | 56,049 | $ | (320,120 | ) | |||
|
|
|
|
|
|||||
| Cash flow (used in) provided by financing activities |
$ | (172,771 | ) | $ | 268,739 | |||
|
|
|
|
|
|||||
| ACFO is as follows: | ||||||||
| Six Months Ended June 30, | ||||||||
| 2012 | 2011 | |||||||
| Cash flow provided by operating activities |
$ | 94,072 | $ | 63,254 | ||||
| Adjustments related to equity method investments: |
||||||||
| Add: Distributions received from equity investments in real estate in excess of equity income |
6,441 | 2,770 | ||||||
| Less: Distributions received from equity investments in real estate in excess of equity income — attributable to financing activities |
(155 | ) | (579 | ) | ||||
|
|
|
|
|
|||||
| Distributions received from equity investments in excess of equity income — attributable to operating activities (a) |
6,286 | 2,191 | ||||||
|
|
|
|
|
|||||
| Adjustments related to noncontrolling interests: |
||||||||
| Less: Distributions (paid to) net of contributions received from noncontrolling interests |
5,415 | (10,860 | ) | |||||
| Add: Distributions received from noncontrolling interests, net not attributable to operating activities |
(19,786 | ) | (315 | ) | ||||
|
|
|
|
|
|||||
| Distributions paid to noncontrolling interests, attributable to operating activities (b) (c) |
(14,371 | ) | (11,175 | ) | ||||
|
|
|
|
|
|||||
| Adjustments related to changes in working capital: (d) |
||||||||
| Net changes in other assets and liabilities |
(259 | ) | (8,826 | ) | ||||
|
|
|
|
|
|||||
| Adjusted cash flow from operating activities |
$ | 85,728 | $ | 45,444 | ||||
|
|
|
|
|
|||||
| Distributions declared |
$ | 67,399 | $ | 49,661 | ||||
|
|
|
|
|
|||||
| (a) | Cash flow provided by operating activities on a GAAP basis does not include distributions that we receive from equity investments in excess of our equity income. All such excess distributions, including our share of distributions of property-level cash flows in excess of operating income, are reported as cash flows provided by investing activities in our statement of cash flows. In calculating ACFO, we make an adjustment to our reported cash flow provided by operating activities to add such distributions to the extent they relate to our pro rata share of property-level operating income, after deducting any portion of such distributions attributable to the financing or investment activities of the underlying jointly-owned investment. |
| (b) | Cash flow provided by operating activities on a GAAP basis does not include contributions that we receive from noncontrolling interests and distributions that we pay to noncontrolling interests in our consolidated jointly-owned investments. All such contributions and distributions, including contributions to and distributions of property-level operating cash flows, are reported as cash flows used in or provided by financing activities in our statement of cash flows. In calculating ACFO, we make adjustments to our reported cash flow provided by operating activities to add contributions received from noncontrolling interests and subtract distributions paid to noncontrolling interests to the extent these contributions or distributions relate to operating activities of the underlying property jointly-owned investments. |
| (c) | The amount previously disclosed for ACFO for the six months ended June 30, 2011 of $46.4 million has been revised in the table above to reflect an additional noncontrolling interest distribution of $1.0 million. |
| (d) | Cash flow provided by operating activities on a GAAP basis includes adjustments to reflect the impact of the “net changes in other operating assets and liabilities” as well as the change in income taxes, net. We make adjustments to cash flow provided by operating activities to incorporate changes between reporting periods in other assets and liabilities, including accrued and prepaid income taxes, as we believe that these adjustments better reflect cash generated from core operations. |
CPA®:16 – Global 6/30/2012 Supplemental 8-K — 6
Non-GAAP Financial Disclosure – ACFO
ACFO refers to our cash flow from operating activities (as computed in accordance with GAAP) adjusted, where applicable, primarily to: add cash distributions of property-level operating cash flows that we receive from our investments in unconsolidated real estate jointly-owned investments in excess of our equity income; subtract cash distributions of property-level operating cash flows that we make to our noncontrolling partners in real estate jointly-owned investments that we consolidate net of such partners’ contributions to our share of property-level operating cash flows; and eliminate changes in working capital. We hold a number of interests in real estate jointly-owned investments, and we believe that adjusting our GAAP cash flow provided by operating activities to reflect these actual cash receipts and cash payments that are attributable to the property-level operating cash flows of the underlying jointly-owned investments, as well as eliminating the effect of timing differences between the payment of certain liabilities and the receipt of certain receivables in a period other than that in which the item is recognized, may give investors additional information about our actual cash flow that is not incorporated in cash flow from operating activities as defined by GAAP. The jointly-owned investments are property-owning entities and their activities are generally limited to receiving rental income, financing the property and ultimately disposing of the property. Distributions and contributions related to these activities are based on the ownership percentages of the partners in each jointly-owned investment. In accordance with each jointly-owned investment’s operating agreement, jointly-owned investment partners generally participate in the jointly-owned investment’s operating cash flow, debt financing and proceeds from property distributions. Distributions of cash to jointly-owned investment partners are typically made on a monthly basis.
We believe that ACFO is a useful supplemental measure for assessing the cash flow generated from our core operations as it gives investors important information about our liquidity that is not provided within cash flow from operating activities as defined by GAAP, and we use this measure when evaluating distributions to shareholders. ACFO should not be considered as an alternative to cash provided by operating activities computed on a GAAP basis as a measure of liquidity.
CPA®:16 – Global 6/30/2012 Supplemental 8-K — 7
CORPORATE PROPERTY ASSOCIATES 16 – GLOBAL INCORPORATED
Total Adjusted Revenue (Unaudited)
(in thousands)
| Three Months Ended | Six Months Ended June 30, | |||||||||||||||||||||||||||
| June 30, 2012 | March 31, 2012 | December 31, 2011 | September 30, 2011 | June 30, 2011 | 2012 | 2011 | ||||||||||||||||||||||
| Reconciliation of Total Adjusted Revenue |
||||||||||||||||||||||||||||
| Total revenue — as reported |
$ | 82,120 | $ | 83,123 | $ | 87,297 | $ | 86,262 | $ | 80,216 | $ | 165,242 | $ | 139,052 | ||||||||||||||
| Less: Other operating income |
(1,089 | ) | (2,599 | ) | (4,118 | ) | (1,382 | ) | (1,581 | ) | (3,687 | ) | (2,971 | ) | ||||||||||||||
| Less: Interest income revenue |
(896 | ) | (1,172 | ) | (1,431 | ) | (1,211 | ) | (1,076 | ) | (2,068 | ) | (1,821 | ) | ||||||||||||||
| Less: Other real estate income |
(7,417 | ) | (6,408 | ) | (6,016 | ) | (7,099 | ) | (6,747 | ) | (13,825 | ) | (12,835 | ) | ||||||||||||||
|
|
|
|
|
|
|
|
|
|
|
|
|
|
|
|||||||||||||||
| Total consolidated lease revenues |
72,718 | 72,944 | 75,732 | 76,570 | 70,812 | 145,662 | 121,425 | |||||||||||||||||||||
| Lease revenues — discontinued operations |
55 | 256 | 382 | 1,383 | 2,943 | 311 | 3,882 | |||||||||||||||||||||
| Add: Pro rata share of revenues from equity investments |
15,363 | 15,222 | 17,350 | 17,694 | 15,872 | 30,585 | 27,265 | |||||||||||||||||||||
| Less: Pro rata share of revenues due to noncontrolling interests |
(2,894 | ) | (2,834 | ) | (3,242 | ) | (2,994 | ) | (2,994 | ) | (5,728 | ) | (5,567 | ) | ||||||||||||||
|
|
|
|
|
|
|
|
|
|
|
|
|
|
|
|||||||||||||||
| Total pro rata net lease revenues |
85,242 | 85,588 | 90,222 | 92,653 | 86,633 | 170,830 | 147,005 | |||||||||||||||||||||
| Add: Other real estate income |
7,417 | 6,408 | 6,016 | 7,099 | 6,747 | 13,825 | 12,835 | |||||||||||||||||||||
|
|
|
|
|
|
|
|
|
|
|
|
|
|
|
|||||||||||||||
| Total Adjusted Revenue |
$ | 92,659 | $ | 91,996 | $ | 96,238 | $ | 99,752 | $ | 93,380 | $ | 184,655 | $ | 159,840 | ||||||||||||||
|
|
|
|
|
|
|
|
|
|
|
|
|
|
|
|||||||||||||||
Non-GAAP Financial Disclosure – Total Adjusted Revenue
Total adjusted revenue is a non-GAAP financial measure that represents revenues on a GAAP basis adjusted for our pro rata share of revenues from equity investments as well as the pro rata share of revenues due to noncontrolling interests. We believe that total adjusted revenue is useful to investors and analysts as a supplemental measure of revenues from our core operations, and we use it to evaluate the stability of our underlying revenue streams. Total adjusted revenue should not be considered as an alternative to revenues computed on a GAAP basis as a measure of our profitability. Total adjusted revenue may not be comparable to similarly titled measures of other companies.
CPA®:16 – Global 6/30/2012 Supplemental 8-K — 8
Corporate Property Associates 16 – Global Incorporated
Portfolio Diversification as of June 30, 2012 (Unaudited)
Top Ten Tenants by Rent (Pro Rata Basis)
(in thousands, except percentages)
| Tenant/Lease Guarantor |
Annualized Contractual Minimum Base Rent |
Percent | ||||||
| Carrefour France, SAS (a) |
$ 16,030 | 5 | % | |||||
| Hellweg Die Profi-Baumärkte GmbH & Co. KG (a) |
12,934 | 4 | % | |||||
| Telcordia Technologies, Inc. |
10,505 | 3 | % | |||||
| U-Haul Moving Partners, Inc. and Mercury Partners, L.P. |
9,996 | 3 | % | |||||
| Advanced Micro Devices, Inc. |
7,963 | 2 | % | |||||
| Dick’s Sporting Goods, Inc. |
7,821 | 2 | % | |||||
| Nordic Cold Storage LLC |
7,539 | 2 | % | |||||
| True Value Company |
7,101 | 2 | % | |||||
| The New York Times Company |
6,892 | 2 | % | |||||
| SoHo House/SHG Acquisition (UK) Limited |
6,554 | 2 | % | |||||
|
|
|
|
|
|||||
| Total |
$ 93,335 | 27 | % | |||||
|
|
|
|
|
|||||
| Weighted-Average Lease Term for Portfolio: |
10.6 years |
| (a) | Rent amounts are subject to fluctuations in foreign currency exchange rates. |
| (b) | Percentage of the portfolio’s total pro rata square footage that was subject to lease. |
Portfolio
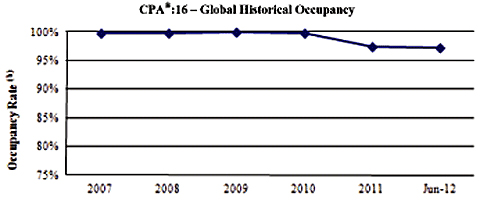
At June 30, 2012, our portfolio was comprised of our full or partial ownership interests in 503 properties, substantially all of which were triple-net leased to 144 tenants, and totaled approximately 48 million square feet (on a pro rata basis), with an occupancy rate of approximately 97%.
CPA®:16 – Global 6/30/2012 Supplemental 8-K — 9
Corporate Property Associates 16 – Global Incorporated
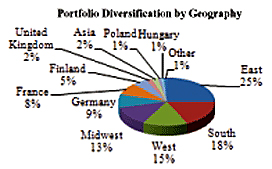
Portfolio Diversification as of June 30, 2012 (Unaudited)
by Geography and Property Type (Pro Rata Basis)
(in thousands, except percentages)
| Region |
Annualized Contractual Minimum Base Rent |
Percent | ||||||
| U.S. |
||||||||
| East |
$ | 80,507 | 25 | % | ||||
| South |
58,152 | 18 | % | |||||
| West |
49,695 | 15 | % | |||||
| Midwest |
44,190 | 13 | % | |||||
|
|
|
|
|
|||||
| U.S. Total |
232,544 | 71 | % | |||||
|
|
|
|
|
|||||
| International |
||||||||
| Germany |
29,128 | 9 | % | |||||
| France |
27,408 | 8 | % | |||||
| Finland |
16,409 | 5 | % | |||||
| United Kingdom |
5,293 | 2 | % | |||||
|
Asia (a) |
4,943 | 2 | % | |||||
| Poland |
3,927 | 1 | % | |||||
| Hungary |
3,397 | 1 | % | |||||
|
Other (b) |
4,497 | 1 | % | |||||
|
|
|
|
|
|||||
| International Total |
95,002 | 29 | % | |||||
|
|
|
|
|
|||||
| Total |
$ | 327,546 | 100 | % | ||||
|
|
|
|
|
|||||
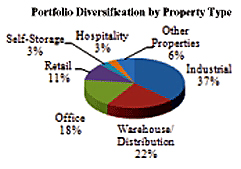
| Property Type |
Annualized Contractual Minimum Base Rent |
Percent | ||||||
| Industrial |
$ | 123,171 | 37 | % | ||||
| Warehouse/Distribution |
71,661 | 22 | % | |||||
| Office |
58,618 | 18 | % | |||||
| Retail |
36,098 | 11 | % | |||||
| Self Storage |
9,996 | 3 | % | |||||
| Hospitality |
9,554 | 3 | % | |||||
| Other Properties (c) |
18,448 | 6 | % | |||||
|
|
|
|
|
|||||
| Total |
$ | 327,546 | 100 | % | ||||
|
|
|
|
|
|||||
| (a) | Includes rent from tenants in Malaysia and Thailand. |
| (b) | Includes rent from tenants in Canada, Mexico, the Netherlands and Sweden. |
| (c) | Includes rent from tenants with the following property types: education (1.7%), theater (1.5%), residential (1.3%), sports (1.0%), and land (0.02%). |
|
|
CPA®:16 – Global 6/30/2012 Supplemental 8-K — 10
Corporate Property Associates 16 – Global Incorporated
Portfolio Diversification as of June 30, 2012 (Unaudited)
by Tenant Industry (Pro Rata Basis)
(in thousands, except percentages)
| Industry Type (a) |
Annualized Contractual Minimum Base Rent |
Percent | ||||||
| Retail Trade |
$ | 58,381 | 18 | % | ||||
| Electronics |
37,481 | 12 | % | |||||
| Automobile |
24,341 | 7 | % | |||||
| Chemicals, Plastics, Rubber, and Glass |
21,786 | 7 | % | |||||
| Construction and Building |
20,236 | 6 | % | |||||
| Healthcare, Education and Childcare |
17,473 | 5 | % | |||||
| Consumer Non-durable Goods |
15,946 | 5 | % | |||||
| Transportation - Cargo |
13,818 | 4 | % | |||||
| Beverages, Food, and Tobacco |
12,775 | 4 | % | |||||
| Media: Printing and Publishing |
11,620 | 4 | % | |||||
| Machinery |
10,854 | 3 | % | |||||
| Telecommunications |
10,557 | 3 | % | |||||
| Hotels and Gaming |
9,554 | 3 | % | |||||
| Leisure, Amusement, Entertainment |
9,456 | 3 | % | |||||
| Business and Commercial Services |
8,956 | 3 | % | |||||
| Grocery |
7,051 | 2 | % | |||||
| Buildings and Real Estate |
6,497 | 2 | % | |||||
| Mining, Metals, and Primary Metal Industries |
5,099 | 2 | % | |||||
| Insurance |
4,872 | 1 | % | |||||
| Federal, State and Local Government |
4,006 | 1 | % | |||||
| Textiles, Leather, and Apparel |
3,955 | 1 | % | |||||
| Transportation - Personal |
3,499 | 1 | % | |||||
| Aerospace and Defense |
3,450 | 1 | % | |||||
| Other (b) |
5,883 | 2 | % | |||||
|
|
|
|
|
|||||
| Total |
$ | 327,546 | 100 | % | ||||
|
|
|
|
|
|||||
| (a) | Based on the Moody’s Investors Service, Inc. classification system and information provided by the tenant. |
| (b) | Includes rent from tenants in the following industries: consumer services (0.7%), forest products and paper (0.5%), consumer and durable goods (0.3%) and utilities (0.3%). |
CPA®:16 – Global 6/30/2012 Supplemental 8-K — 11