Attached files
| file | filename |
|---|---|
| 8-K - FORM 8-K - Bristow Group Inc | d391367d8k.htm |
 First Quarter FY 2013
Earnings Presentation
Bristow Group Inc.
August 7, 2012
Exhibit 99.1 |
 2
Fourth quarter earnings call agenda
Introduction
CEO remarks and operational highlights
Current and future financial performance
-
Q1 FY13 financial results discussion
-
New contract awards
Closing remarks
Questions and answers
Linda McNeill, Director Investor Relations
Bill Chiles, President and CEO
Jonathan Baliff, SVP and CFO
Bill Chiles, President and CEO |
 3
Forward-looking statements
This presentation may contain “forward-looking statements” within the meaning of the
Private Securities Litigation Reform Act of 1995. Forward-looking statements include
statements about our future business, operations, capital expenditures, fleet composition,
capabilities and results; modeling information, earnings guidance, expected operating margins
and other financial projections; future dividends, share repurchase and other uses of excess
cash; plans, strategies and objectives of our management, including our plans and strategies to
grow earnings and our business, our general strategy going forward and our business model;
expected actions by us and by third parties, including our customers, competitors and
regulators; the valuation of our company and its valuation relative to relevant financial
indices; assumptions underlying or relating to any of the foregoing, including assumptions regarding
factors impacting our business, financial results and industry; and other matters. Our
forward-looking statements reflect our views and assumptions on the date of this
presentation regarding future events and operating performance. They involve known and unknown
risks, uncertainties and other factors, many of which may be beyond our control, that may cause
actual results to differ materially from any future results, performance or achievements
expressed or implied by the forward-looking statements. These risks, uncertainties and
other factors include those discussed under the captions “Risk Factors” and
“Management’s Discussion and Analysis of Financial Condition and Results of Operations” in our
Annual Report on Form 10-K for the fiscal year-ended March 31, 2012 and our Quarterly Report
on Form 10-Q for the quarter ended June 30, 2012. We do not undertake any obligation, other
than as required by law, to update or revise any forward-looking statements, whether as a
result of new information, future events or otherwise. |
 4
Chief Executive Officer comments
Bill
Chiles,
President
and
CEO |
 5
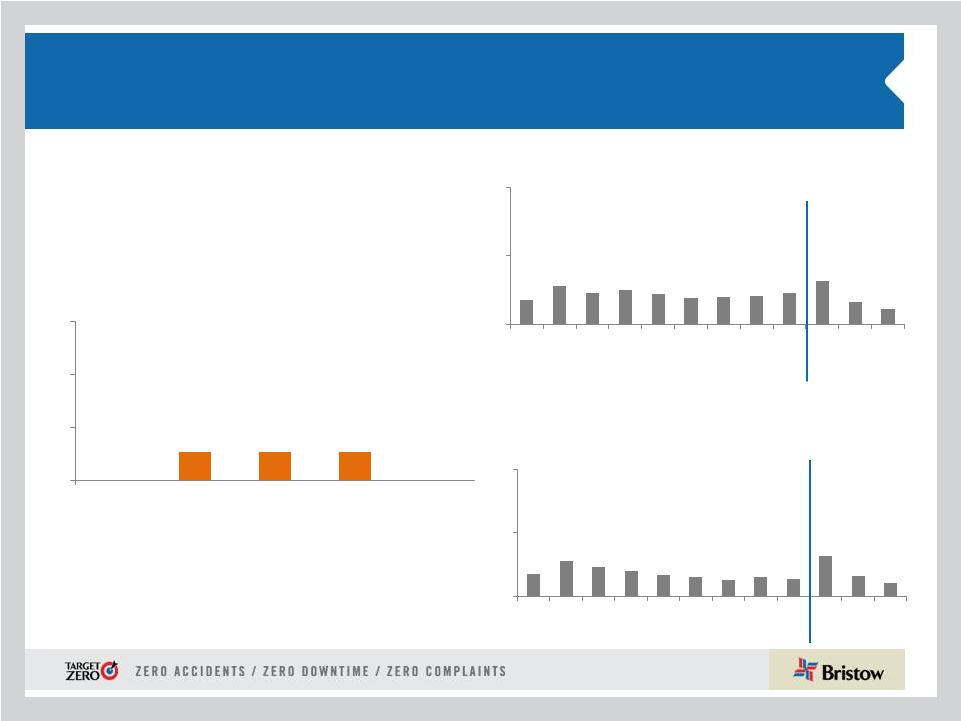
Operational safety review
* Includes consolidated commercial operations only
Total Recordable Injury Rate* per 200,000 man-
hours (cumulative)
Lost Work Case Rate* per 200,000
man-hours (cumulative)
Commercial Air Accident Rate* per 100,000
Flight Hours (Fiscal Year)
FY12
FY12
FY13
FY13
0
0.54
0.53
0.53
0
0
1
2
3
FY09
FY10
FY11
FY12
Q1 FY13
0.18
0.28
0.23
0.25
0.22
0.19
0.2
0.21
0.23
0.32
0.16
0.11
0
0.5
1
J
A
S
O
N
D
J
F
M
A
M
J
0.18
0.28
0.23
0.2
0.17
0.15
0.20
0.15
0.14
0.32
0.16
0.11
0
0.5
1
J
A
S
O
N
D
J
F
M
A
M
J |
 6
Q1 FY13 Highlights
•
The strong
operating
performance
in
Q4
FY12
continued
in
Q1
FY13
with
GAAP
EPS up 14% and adjusted EPS higher by 50% year-over-year
•
Cash flow from operations of $55.4 million up ~ 5% year-over-year
•
Four
out
of
five
business
units
generated
positive
BVA**
with
an
overall
increase of $17.3 million over Q1 FY12 from increased revenue and margin
improvement
•
EPS guidance
for
the
full
FY13
is
reaffirmed
at
$3.25
-
$3.55
•
Q1 operating revenue of $320.7M (12% increase from Q1 FY12, 1% increase from Q4
FY12) •
Q1 GAAP EPS of $0.65 (14% increase from Q1 FY12, 67% increase
from Q4 FY12) •
Q1 adjusted EPS* of $0.81 (50% increase from Q1 FY12, 34% decrease from Q4
FY12) •
Q1 adjusted
EBITDAR*
of
$84.3M
(26%
increase
from
Q1
FY12,
15%
decrease
from
Q4
FY12)
* Adjusted
EPS
and
adjusted
EBITDAR
amounts
exclude
gains
and
losses
on
dispositions
of
assets
and
any
special
items
during
the
period.
See reconciliation
of
these
items
to
GAAP
measures
in
the
appendix
hereto
and
in
our
earnings
release
for
the
quarter
ended
June
30,
2012.
** Bristow
Value
Added
(BVA)
is
calculated
by
taking
Gross
Cash
Flow
less
the
product
of
Gross
Operating
Assets
times
a
capital
charge of
10.5%. Sample calculation for Q1 FY12 and Q1 FY13 can be found in the appendix
hereto. |
 7
•
Global E & P spending is expected to rise by 11% in 2012 even in
the face of
worldwide economic uncertainty and upcoming U.S. presidential elections
•
Supermajors continue to earmark deepwater and ultra deepwater projects,
especially in response to weakness in the natural gas sector
•
Secular trends, such as continued deepwater development, higher safety
requirements, and an acceleration of newer technology, are expected to support
demand for additional larger helicopters
•
The Gulf of Mexico activity demonstrates all of these trends as rising dayrates
across all rig classes and solid contract momentum support the bullish
outlook for helicopter demand in this region
•
Continued momentum around the world for search and rescue (SAR) work is
contributing to tightness in helicopter supply
Current market environment |
 8
•
Europe represented 39% of Bristow operating
revenue and 42% of adjusted EBITDAR* in Q1
FY13
•
Operating revenue increased to $123.2M in Q1
FY13 from $108.3M in Q1 FY12 with the
addition of four large aircraft and increased
activity with existing clients and new contracts
in NNS and Norway
•
Adjusted EBITDAR increased to $39.7M in
Q1FY13 from $35.7M in Q1 FY12 while
adjusted EBITDAR margin remained relatively
flat at 32.2% in Q1 FY13 versus 33.0% in Q1
FY12
Outlook:
•
Bristow is shortlisted for UK SAR program
with results to be announced in early 2013
•
High activity continues as demonstrated by
new awards for nine aircraft recently
announced. Additional awards are
anticipated next quarter.
FY13 adjusted EBITDAR margin
expected to be ~ low thirties
Europe (EBU)
* Operating revenue and adjusted EBITDAR percentages exclude corporate and
other. |
 9
West Africa (WASBU)
•
Nigeria represented 21% of Bristow operating
revenue and 22% of adjusted EBITDAR* in Q1 FY13
•
Operating revenue of $66.4M in Q1 FY13 increased
27% from $52.3M in Q1 FY12 due to strong activity
and a 12% increase in flight hours compared to Q1
FY12
•
Adjusted EBITDAR increased to $21.2M in Q1 FY13
from $15.4M in Q1 FY12 with adjusted EBITDAR
margin of 32% in Q1 FY13 vs 30% in Q1 FY12
•
Outlook:
•
Improved service through Client Promise
initiative continues to drive strong results: Two
existing contracts extended with better pricing
and terms
•
Upcoming heavy maintenance on several
aircraft will impact Q2 and Q3 FY13
•
We continue to work on optimizing the
operating model in this business unit as part
of the local content initiative
FY13 adjusted EBITDAR margin expected
to be ~ low thirties
* Operating revenue and adjusted EBITDAR percentages exclude corporate and
other. |
 10
•
•
North America represented 17% of Bristow operating
revenue and 13% of adjusted EBITDAR* in Q1 FY13
•
Adjusted EBITDAR almost doubled to $12.2M in Q1 FY13
vs. $6.3M in Q1 FY12 and adjusted EBITDAR margin of
23.2% in Q1 FY13 increased significantly from 14.3% in
Q1 FY12
•
Sequential improvement of almost 50% in adjusted
EBITDAR from $8.2M in Q4 FY12 to $12.2M in the
current quarter
•
The business model performed with key parameters
significantly better: several mid-teen price increases,
large aircraft working and costs contained
Outlook:
•
Our business is improving in FY13 similar to other
oil service deepwater sector recoveries -
more
rigs, more people, and better results
•
Client Promise initiative continues to deliver
positive results
FY13 adjusted EBITDAR expected to be ~ low
twenties
North America (NABU)
* Operating revenue and adjusted EBITDAR percentages exclude corporate and
other. |
 11
Australia (AUSBU)
•
Australia represented 12% of Bristow operating
revenue and 11% of adjusted EBITDAR* in Q1 FY13
•
Operating revenue of $38.2M in Q1 FY13 decreased
from $40.9M in Q1 FY12 due to a decrease in overall
flight activity
•
Adjusted EBITDAR increased to $10.3M in Q1 FY13
from $8.3M in Q1 FY12 and adjusted EBITDAR
margin increased to 27.0% in Q1 FY13 from 20.2% in
Q1 FY12 reflecting better asset utilization along with
lower operating costs
•
INPEX award of a ten-year contract for up to
six large aircraft with an option to add a long
term SAR aircraft with the start date in FY14
•
Aircraft will be redeployed as short term
contracts roll off. This will impact performance
in Q2 and Q3 FY13
•
An additional medium aircraft contract award
with improved terms
* Operating revenue and adjusted EBITDAR percentages exclude corporate and
other. Outlook:
FY13
adjusted
EBITDAR
margin
expected to
be ~ mid to high twenties |
 12
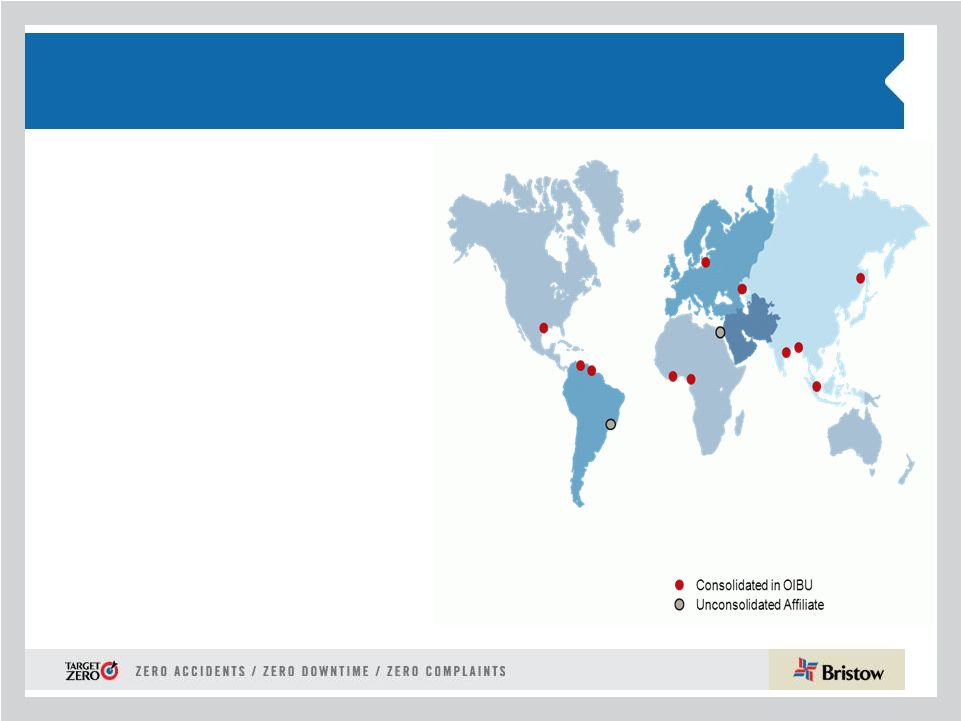
Other International (OIBU)
Other International (OIBU)
•
Other International represented 11% of Bristow operating revenue
and 12% of adjusted EBITDAR* in Q1 FY13
•
Operating revenue decreased to $33.2M in Q1 FY13 vs. $34.5M
in Q1 FY12 due to decrease in activity in Ghana and the end of a
contract in the Baltic Sea
•
Adjusted EBITDAR margin of 36.2% in Q1 FY13 decreased from
48.1% in Q1 FY12 due primarily to decreased earnings from
unconsolidated affiliates (particularly Lider in Brazil), activity
reduction in Mexico, and increased operating costs in Trinidad
•
Lider equity earnings decreased to $0.0M in Q1 FY13 compared
to $2.7M in Q1 FY12
* Operating revenue and adjusted EBITDAR percentages exclude corporate and
other. Outlook:
•
Potential new opportunities in Caspian, East Africa, Southeast
Asia, and the Caribbean
•
Petrobras awarded Lider contracts for five new large aircraft, with
one leased by Bristow to Lider, with operations scheduled to
commence starting in August 2012 through April 2013
•
Lider’s second half of the year is expected to be better than the first
half as operations under new contracts begin. Currency fluctuations
make it difficult to predict if this will translate into higher equity
earnings
FY13 adjusted EBITDAR margin expected to be ~ low
to mid forties |
 13
Financial discussion
Jonathan
Baliff,
SVP
and
CFO |
 14
Financial highlights:
Adjusted EPS and EBITDAR Summary
Q1FY2012 to Q1FY2013 adjusted EPS bridge
Q1FY2012 to Q1FY2013 adjusted EBITDAR bridge (in millions)
$0.54
$0.81
$0.28
$0.08
$0.09
Q1FY2012
Operations
Corporate and Other
FX Changes
Q1FY2013
$67.0
$84.3
$15.9
$5.4
$4.0
Q1FY2012
Operations
Corporate and Other
FX Changes
Q1FY2013
Adjusted EPS and EBITDAR amounts exclude gains and losses on dispositions of assets and any special
items during the quarter. See reconciliation of these items to GAAP in the appendix
hereto and in our earnings release for the quarter ended June 30, 2012 .
* |
 15
LACE rate increased with overall LACE declining
due to sales of less productive aircraft
YTD
LACE
Rate
increased
with
the
improvement
in
contract
terms
and
higher
utilization
of
aircraft,
especially
in
NABU
and
WASBU
($ in millions)
* YTD FY13 LACE rate is annualized
295
290
279
268
263
164
159
153
149
147
0
50
100
150
200
250
300
350
FY09
FY10
FY11
FY12
YTD FY13
Consolidated commerical aircraft
Large Aircraft Equivalent (LACE)
164
159
153
149
147
6.14
6.49
7.15
7.89
8.55
0
1
2
3
4
5
6
7
8
9
0
50
100
150
200
250
300
350
FY09
FY10
FY11
FY12
YTD FY13*
LACE
LACE Rate
See appendix hereto for more information on LACE and LACE Rate. LACE and LACE Rate excludes Bristow
Academy, affiliate aircraft, aircraft held for sale, aircraft construction in progress, and
reimbursable revenue. |
 16
BVA –
Six Quarters
Year over year improvement for Q1 FY13
BVA* Q4 FY11 –
Q1 FY13
*See 10-Q for more information on BVA and appendix hereto for GAAP
reconciliation. •
Q1 FY13 BVA is $1.9M,
which is a $17.3M
improvement over Q1
FY12
•
Positive year-over-year
change in BVA is driven
by:
Revenue growth in
Europe, West Africa,
and North America
Margin improvements,
including lower
corporate G&A
-3.6
-15.4
1.1
13.6
1.9
-20
-15
-10
-5
0
5
10
15
20
Q4 FY11
Q1 FY12
Q2 FY12
Q3 FY12
Q4 FY12
Q1 FY13
0 |
 17
Our progress on BVA continues with stronger
operating cash flow generation in Q1 FY13
Net cash provided by operating activities
See 10-Q for more information on cash flow provided by operating
activities 29.6
35.0
25.7
52.9
55.4
127.9
195.4
151.4
231.3
0
40
80
120
160
200
240
280
320
FY09
FY10
FY11
FY12
Q1 FY13 |
 18
Recently announced contract awards provide growth and
demonstrate the success of Bristow’s Client Promise
Norway:
•
Contract renewal for four
S-92s starting Sep 2014
for seven-year term with
option to extend for five
years, using existing a/c
•
New contract for SAR
services for three
EC225s starting Sep
2014 for five-year term
with option to extend for
five years, using two new
option a/c and one
leased a/c
UK:
•
New contract for one
S-92 starting in July
2012
•
New contract for one
EC225 starting Aug
2012 for minimum of
two years
•
One a/c is reflected in
our fleet and one a/c is
leased
Brazil:
•
Lider was awarded
contracts for five S-92s
for five-year terms.
One a/c is leased to
Lider by Bristow and is
scheduled to start work
in Aug 2012 with the
rest starting by Apr
2013
Australia:
•
New contract with
INPEX for up to six
EC225s starting in
2014 for ten-year term
with an option to add a
long term SAR a/c,
using one new option
aircraft and five
existing a/c
20 large aircraft
4 = Existing contract extensions
16 = Incremental new contracts
All contracts are at higher pricing
and better terms |
 19
Financial highlights:
FY13 guidance reaffirmed
•
EPS guidance range $3.25
- $3.55, excluding aircraft sales and
special items •
Depreciation and amortization expense ~ $90 –
$95 million
•
SG & A expense ~ $135 -
$140 million
•
Interest expense ~ $38 -
$43 million
•
Tax ~
20% -
24 %
(assuming revenue earned in same regions and same mix)
•
LACE* (Large Aircraft Equivalent) ~ 152-156 (FY13 average)
•
LACE Rate* ~ $7.90 -
$8.20 million per LACE aircraft per year
•
Anticipate a better overall second half of FY13 compared to the first half
* Excludes Bristow Academy, aircraft held for sale, CIP, and reimbursable
revenue. |
 20
Conclusions
•
Our focus on execution is delivering results with Target Zero /
Client Promise being the top priority
•
Strong financial profile with liquidity, and prudent balance
sheet management (our adjusted debt to equity is 71% vs.
peer* average of 248%)
•
We are delivering a balanced shareholder return through
dividend increases (quarterly dividend of $0.20 per share or
33% increase from Q1 FY12) and opportunistic share
repurchases
* Our peer group includes CHC, ERA, Inaer Aviation, and PHI. Data from latest
filings as of July 29, 2012. ERA based on S-1 pro-forma. |
 21
Appendix |
 22
Organizational Chart -
as of June 30, 2012
Business
Unit
(%
of
FY13
Operating
Revenue)
Corporate
Region
(
#
of
Aircraft
/
#
of
Locations)
Joint
Venture
(#
of
aircraft)
Key
Operated Aircraft
Bristow owned and/or operated
357 aircraft as of June 30, 2012
Affiliated Aircraft
Bristow affiliates and joint
ventures operated 194 aircraft
as of June 30, 2012 |
 23
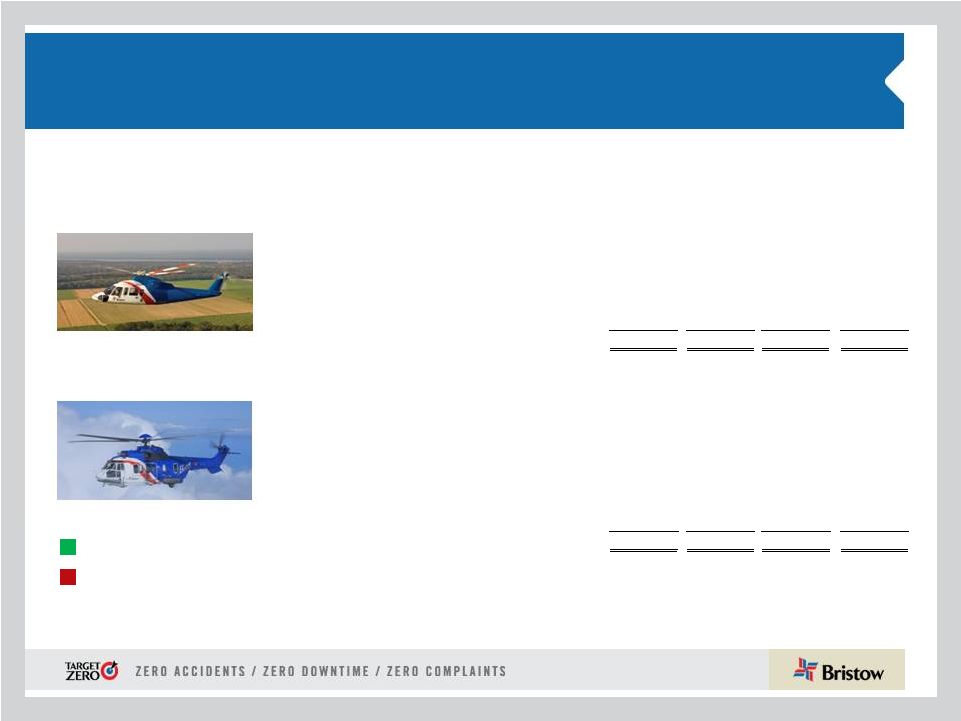
Aircraft Fleet –
Medium and Large
As of June 30, 2012
Next Generation Aircraft
Medium capacity 12-16 passengers
Large capacity 18-25 passengers
Mature Aircraft Models
Aircraft
Type
No. of PAX
Engine
Consl
Unconsl
Total
Ordered
Large Helicopters
AS332L Super Puma
18
Twin Turbine
23
-
23
-
AW189
16
Twin Turbine
-
-
-
6
EC225
25
Twin Turbine
18
-
18
-
Mil MI 8
20
Twin Turbine
7
-
7
-
Sikorsky S-61
18
Twin Turbine
2
-
2
-
Sikorsky S-92
19
Twin Turbine
32
4
36
11
82
4
86
17
LACE
76
Medium Helicopters
AW139
12
Twin Turbine
7
2
9
-
Bell 212
12
Twin Turbine
1
14
15
-
Bell 412
13
Twin Turbine
34
20
54
-
EC155
13
Twin Turbine
3
-
3
-
Sikorsky S-76A/A++
12
Twin Turbine
15
5
20
-
Sikorsky S-76C/C++
12
Twin Turbine
52
31
83
-
112
72
184
-
LACE
51 |
  24
Aircraft Fleet –
Small, Training and Fixed
As of June 30, 2012 (continued)
Next Generation Aircraft
Mature Aircraft Models
Small capacity 4-7 passengers
Training capacity 2-6 passengers
•LACE does not include held for sale, training and fixed wing
helicopters Aircraft
Type
No. of PAX
Engine
Consl
Unconsl
Total
Ordered
Small Helicopters
Bell 206B
4
Turbine
1
2
3
-
Bell 206 L-3
6
Turbine
4
6
10
-
Bell 206 L-4
6
Turbine
29
1
30
-
Bell 407
6
Turbine
39
-
39
-
BK 117
7
Twin Turbine
2
-
2
-
BO-105
4
Twin Turbine
2
-
2
-
EC135
7
Twin Turbine
6
3
9
-
83
12
95
-
LACE
21
Training Helicopters
AW139
12
Twin Turbine
-
3
3
-
Bell 412
13
Twin Turbine
-
8
8
-
Bell 212
12
Twin Turbine
-
15
15
-
AS355
4
Twin Turbine
5
-
5
-
AS350BB
4
Turbine
-
36
36
-
Agusta 109
8
Twin Turbine
-
2
2
-
Bell 206B
6
Single Engine
12
-
12
-
Robinson R22
2
Piston
12
-
12
-
Robinson R44
2
Piston
2
-
2
-
Sikorsky 300CB/Cbi
2
Piston
45
-
45
-
Fixed Wing
1
-
1
-
77
64
141
-
Fixed Wing
3
42
45
-
Total
357
194
551
17
TOTAL LACE (Large Aircraft Equivalent)
147 |
 25
Operating lease strategy: lowering the cost and amount of
capital needed to grow
•
Of the 56 aircraft currently leased in our fleet, 30 are training and 26 are
commercial (18 LACE)
•
18 LACE aircraft represent approximately 12% of our commercial fleet
•
Our
goal
is
for
commercial
fleet
operating
leases
to
account
for
20-30%
of
our
LACE
Leased aircraft as of June 30, 2012
Large
Medium
Small
Total
Leased LACE
Total LACE
% Leased
EBU
8
-
-
8
8
47
17%
WASBU
-
1
-
1
1
22
2%
NABU
2
11
1
14
8
30
26%
AUSBU
1
-
2
3
2
18
11%
OIBU
-
-
-
-
-
32
0%
Total
11
12
3
26
18
147
12% |
 26
Consolidated Fleet Changes and Aircraft Sales for
Q1 FY13
EBU
WASBU
NABU
AUSBU
OIBU
Total
Large
3
-
-
3
-
6
Medium
2
1
-
1
7
11
Small
-
-
-
-
-
-
Total
5
1
-
4
7
17
Aircraft held for sale by BU
EBU
WASBU
NABU
AUSBU
OIBU
BA
Total
Large
8
-
2
1
-
-
11
Medium
-
1
11
-
-
-
12
Small
-
-
1
2
-
-
3
Fixed
-
-
-
-
-
-
-
Training
-
-
-
-
-
30
30
Total
8
1
14
3
-
30
56
Leased aircraft in consolidated fleet
# of A/C Sold
Received*
Q1 FY13
4
19
$
Totals
4
19
$
* $ in millions
Q 1 FY13
Fleet Count Beginning Period
361
Delivered
S-92
2
Total Delivered
2
Removed
Sales
(4)
Other*
(2)
Total Removed
(6)
357
* Includes destroyed aircraft, lease returns
and commencements
Fleet changes |
 27
Operating Revenue, LACE and LACE rate by BU
Operating
revenue
LACE
LACE Rate
2,3
EBU
123.2
47
10.60
WASBU
66.4
22
12.35
NABU
52.6
30
7.05
AUSBU
38.2
18
8.48
OIBU
33.2
32
4.22
Total
313.6
147
8.55
Operating Revenue, LACE, and LACE Rate by BU
as of June 30, 2012
1
1) $ in millions
2) LACE Rate is annualized
3) $ in millions per LACE
4) OIBU LACE rate is lower than other business units’ LACE rate due to a large proportion of
revenue being from dry leases 4 |
 28
Order and options book as of June 30, 2012
#
Helicopter
Class
Delivery Date
Location
Contracted
#
Helicopter
Class
Delivery Date
3
Large
December 2012
EBU
3
1
Large
September 2013
2
Large
December 2012
WASBU
0
1
Large
December 2013
2
Large
March 2013
EBU
2
1
Large
March 2014
1
Large
September 2013
EBU
0
1
Large
June 2014
1
Large
September 2013
NABU
0
1
Large
September 2014
2
Large
December 2013
OIBU
0
1
Large
December 2014
1
Large
September 2014
NABU
0
1
Large
March 2015
1
Large
December 2014
OIBU
0
2
Large
June 2015
1
Large
March 2015
OIBU
0
2
Large
September 2015
1
Large
June 2015
EBU
0
2
Large
December 2015
1
Large
March 2016
EBU
0
1
Large
March 2016
1
Large
June 2016
AUSBU
0
2
Large
June
2016
17
5
2
Large
September 2016
2
Large
December 2016
* Six large ordered aircraft expected to enter service beginning
1
Large
March 2017
in calendar year 2014 are subject to the successful development
1
Large
June 2017
and certification of the aircraft.
1
Large
September 2017
1
Large
December 2017
1
Medium
June 2013
4
Medium
December 2013
3
Medium
June 2014
2
Medium
September 2014
2
Medium
June 2015
36
ORDER BOOK*
OPTIONS BOOK |
 29
Adjusted EBITDAR margin* trend
Q1
Q2
Q3
Q4
Full Year
Q1
Q2
Q3
Q4
Full Year
EBU
31.2%
31.7%
31.9%
28.0%
30.8%
29.8%
31.5%
34.6%
34.4%
32.7%
WASBU
31.7%
36.8%
33.7%
39.1%
36.0%
33.7%
36.9%
35.8%
34.3%
35.2%
NABU
18.3%
20.0%
14.9%
17.7%
17.8%
20.8%
25.8%
15.9%
8.5%
18.5%
AUSBU
26.5%
36.7%
34.4%
31.3%
32.4%
33.2%
26.1%
27.0%
31.1%
29.3%
OIBU
34.4%
37.6%
25.9%
25.1%
31.0%
18.3%
40.2%
37.4%
59.4%
39.3%
Consolidated
24.7%
27.8%
24.7%
23.9%
25.3%
23.8%
27.5%
25.9%
29.6%
26.7%
2013
Q1
Q2
Q3
Q4
Full Year
Q1
EBU
33.0%
31.4%
30.7%
36.1%
32.9%
32.2%
WASBU
29.5%
35.5%
37.2%
36.6%
35.0%
31.9%
NABU
14.3%
20.6%
14.8%
19.4%
17.3%
23.2%
AUSBU
20.2%
14.4%
23.5%
35.6%
24.3%
27.0%
OIBU
48.1%
19.1%
47.8%
42.9%
39.5%
36.2%
Consolidated
23.4%
24.0%
27.6%
31.2%
26.6%
26.3%
2010
2011
2012
* Adjusted EBITDAR excludes special items and asset dispositions and calculated by taking adjusted
EBITDAR divided by operating revenue |
  30
Adjusted EBITDAR* reconciliation
* Adjusted EBITDAR excludes special items and asset dispositions
($ in millions)
Q1
Q2
Q3
Q4
Full Year
Q1
Q2
Q3
Q4
Full Year
Net income
$24.0
$33.7
$27.1
$28.7
$113.5
$20.9
$38.8
$42.3
$31.2
$133.3
Income tax expense
9.5
11.2
5.7
2.6
29.0
8.5
3.3
-11.8
7.1
7.1
Interest expense
10.0
10.6
11.0
10.8
42.4
11.0
11.5
13.8
9.9
46.2
Gain on disposal of assets
-6.0
-4.9
-2.4
-5.3
-18.7
-1.7
-1.9
0.0
-5.1
-8.7
Depreciation and amortization
18.2
18.5
20.7
17.4
74.7
19.3
21.0
21.3
27.7
89.4
Special items
2.6
-2.5
-1.1
1.0
0.0
0.0
0.0
-1.2
2.4
1.2
EBITDA Subtotal
58.2
66.7
60.9
55.1
240.9
58.1
72.7
64.4
73.3
268.5
Rental expense
7.0
7.0
7.2
6.3
27.3
6.6
6.1
8.7
7.7
29.2
Adjusted EBITDAR
$65.2
$73.6
$68.1
$61.3
$268.2
$64.7
$78.8
$73.1
$81.1
$297.7
3/31/2013
($ in millions)
Q1
Q2
Q3
Q4
Full Year
Q1
Net income
$21.2
$3.0
$26.5
$14.6
$65.2
$24.2
Income tax expense
6.6
-1.9
7.1
2.4
14.2
6.2
Interest expense
9.0
9.5
9.8
10.0
38.1
8.8
Gain on disposal of assets
-1.4
1.6
2.9
28.6
31.7
5.3
Depreciation and amortization
22.7
25.4
22.7
25.3
96.1
21.4
Special items
0.0
24.6
0.0
3.4
28.1
2.2
EBITDA Subtotal
58.1
62.1
68.9
84.3
273.4
68.0
Rental expense
9.0
9.1
12.8
15.1
46.0
16.3
Adjusted EBITDAR
$67.0
$71.2
$81.8
$99.5
$319.5
$84.3
3/31/2010
3/31/2011
3/31/2012
Fiscal year ended,
Fiscal year ended, |
 31
Bristow Value Added (BVA)
Sample calculation
Bristow
Value
Added
=
Gross
Cash
Flow
–
(Gross
Operating
Assets
X
Capital
Charge)
BVA
= GCF -
(
GOA X 10.5%** )
Bristow Value Added calculation for Q1 FY12
($15.4)
=
$60* -
(
$2,874* X 2.625%** )
Bristow Value Added calculation for Q1 FY13
$1.9 =
$80* -
(
$2,976* X 2.625%** )
* Reconciliation for these items follows right after
this slide ** Quarterly capital charge of 2.625% is based on
annual capital charge of 10.5% |
 32
Gross Cash Flow Presentation
Special items:
(in millions)
Gross Cash Flow Reconciliation
Q1 FY12
Q1 FY13
Net Income
21
24
Depreciation and Amortization
23
21
Interest Expense
9
9
Interest Income
(0)
(0)
Rent
9
16
Other Income/expense-net
(0)
1
Gain/loss on Asset Sale
(1)
5
Special Items
0
2
Tax Effect from Special Items
0
(2)
Earnings (losses) from Unconsolidated Affiliates, Net
(6)
(2)
Non-controlling Interests
0
1
Gross Cash Flow before Lider
$54
$75
Gross Cash Flow - Lider proportional
6
5
Gross Cash Flow after Lider
$60
$80
FY13 includes: $2.2m special charge for severance costs related to the termination of a contract
in the Southern North Sea |
 33
Gross Operating Asset Presentation
(in millions)
Adjusted Gross Operating Assets Reconciliation
Q1 FY12
Q1 FY13
Total Assets
2,701
2,740
Accumulated Depreciation
463
468
Capitalized Operating Leases
136
194
Cash and Cash Equivalents
(117)
(227)
Investment in Unconsolidated Entities
(210)
(201)
Goodwill
(30)
(29)
Intangibles
(7)
(4)
Assets Held for Sale: Net
(34)
(18)
Assets Held for Sale: Gross
77
86
Adj. for gains & losses on assets sales
(0)
116
Accounts Payable
(51)
(58)
Accrued Maintenance and Repairs
(11)
(16)
Other Accrued Taxes
(4)
(7)
Accrued Wages, Benefits and Related Taxes
(33)
(43)
Other Accrued Liabilities
(18)
(27)
Income Taxes Payable
(16)
(10)
Deferred Revenue
(9)
(13)
ST Deferred Taxes
(10)
(15)
LT Deferred Taxes
(155)
(142)
Adjusted Gross Operating Assets before Lider
$2,672
$2,794
Adjusted Gross Operating Assets - Lider proportional
202
182
Adjusted Gross Operating Assets after Lider
$2,874
$2,976 |
 GAAP reconciliation
Three Months Ended
June 30,
2012
2011
(In thousands, except per
share amounts)
Adjusted operating income
.................................................
47,470
$
34,989
Gain (loss) on disposal of assets
.....................................
(5,315)
1,416
Severance costs for termination of a contract
................. (2,162)
—
Operating income
................................................................
39,993
$
36,405
Adjusted EBITDAR
............................................................
84,273
$
67,025
Gain (loss) on disposal of assets
.....................................
(5,315)
1,416
Severance costs for termination of a contract
................. (2,162)
—
Depreciation and amortization
....................................... (21,372)
(22,708)
Rent expense
..................................................................
(16,274)
(8,953)
Interest expense
..............................................................
(8,774)
(8,955)
Provision for income taxes
............................................. (6,180)
(6,606)
Net income
..........................................................................
24,196
$
21,219
Adjusted net income
...........................................................
29,618
$
19,878
Gain (loss) on disposal of assets
(i)
.................................
(4,234)
1,167
Severance costs for termination of a contract
(i)
.............
(1,722)
—
Net income attributable to Bristow Group
.......................... 23,662
$
21,045
Adjusted diluted earnings per share
.................................... 0.81
$
0.54
Gain (loss) on disposal of assets
(i)
.................................
(0.12)
0.03
Severance costs for termination of a contract
(i)
.............
(0.05)
—
Diluted earnings per share
.................................................. 0.65
0.57
34 |
 35
Leverage Reconciliation
*Adjusted EBITDAR exclude gains and losses on dispositions of assets
Debt
Investment
Capital
Leverage
(a)
(b)
(c) = (a) + (b)
(a) / (c)
(in millions)
As of June 30, 2012
736.3
$
1,540.7
$
2,277.0
$
32.3%
Adjust for:
Unfunded pension liability
109.8
109.8
NPV of all lease obligations
217.0
217.0
Letters of credit
1.5
1.5
Adjusted
1,064.6
$
(d)
1,540.7
$
2,605.3
$
40.9%
Calculation of debt to adjusted EBITDAR multiple
Adjusted EBITDAR*:
FY 2012
336.8
$
(e)
Annualized
449.1
$
= (d) / (e)
3.16:1 |
 36
Bristow Group Inc. (NYSE: BRS)
2103
City
West
Blvd.,
4
Floor
Houston, Texas 77042
t
713.267.7600
f
713.267.7620
bristowgroup.com
Contact Us
th |