Attached files
| file | filename |
|---|---|
| EX-99.1 - EARNINGS RELEASE - Apollo Commercial Real Estate Finance, Inc. | d390179dex991.htm |
| 8-K - FORM 8-K - Apollo Commercial Real Estate Finance, Inc. | d390179d8k.htm |
 August 7, 2012
Supplemental Financial Information Presentation
Q2 2012
Information is as of June 30, 2012 except as otherwise noted.
It should not be assumed that investments made in the future will be
profitable or will equal the performance of investments in this document.
Exhibit 99.2 |
 1
COMMERCIAL REAL ESTATE FINANCE, INC. (“ARI”)
Legal Disclaimer
We make forward-looking statements in this presentation and other
filings we make with the SEC within the meaning of Section 27A of the
Securities Act of 1933, as amended, and Section 21E of the Securities
Exchange Act of 1934, as amended, and such statements are intended to be
covered by the safe harbor provided by the same. Forward-looking
statements are subject to substantial risks and uncertainties, many of which
are difficult to predict and are generally beyond our control. These
forward-looking statements include information about possible or assumed
future results of our business, financial condition, liquidity, results
of operations, plans and objectives. When we use the words “believe,”
“expect,”
“anticipate,”
“estimate,”
“plan,”
“continue,”
“intend,”
“should,”
“may”
or similar expressions, we intend to identify forward-looking
statements. Statements regarding the following subjects, among
others, may be forward-looking: our business and investment strategy; our
operating
results;
our
ability
to
obtain
and
maintain
financing
arrangements;
the
return
on
equity,
the
yield
on
investments
and
risks
associated
with investing in real estate assets, including changes in business
conditions and the general economy. The forward-looking
statements are based on our beliefs, assumptions and expectations of our future performance, taking into account all
information currently available to us. Forward-looking statements
are not predictions of future events. These beliefs, assumptions and
expectations can change as a result of many possible events or factors,
not all of which are known to us. Some of these factors are described
under
“Risk
Factors,”
and
“Management’s
Discussion
and
Analysis
of
Financial
Condition
and
Results
of
Operations”
as
included
in
ARI’s
Annual Report on Form 10-K for the fiscal year ended December 31,
2011. If a change occurs, our business, financial condition, liquidity and
results of operations may vary materially from those expressed in our
forward-looking statements. Any forward-looking statement speaks only as
of the date on which it is made. New risks and uncertainties arise over
time, and it is not possible for us to predict those events or how they may
affect us. Except as required by law, we are not obligated to, and do
not intend to, update or revise any forward-looking statements, whether as a
result of new information, future events or otherwise.
This presentation may contain statistics and other data that in some
cases has been obtained from or compiled from information made available
by third-party service providers. |
 2
COMMERCIAL REAL ESTATE FINANCE, INC. (“ARI”)
Apollo Commercial Real Estate Finance, Inc.
2012 Second Quarter Earnings Call
August 7, 2012
Stuart Rothstein
Chief Executive Officer, President and Chief Financial Officer
Scott Weiner
Chief Investment Officer of the Manager
Megan Gaul
Controller of the Manager
Hilary Ginsberg
Investor Relations Manager |
 3
COMMERCIAL REAL ESTATE FINANCE, INC. (“ARI”)
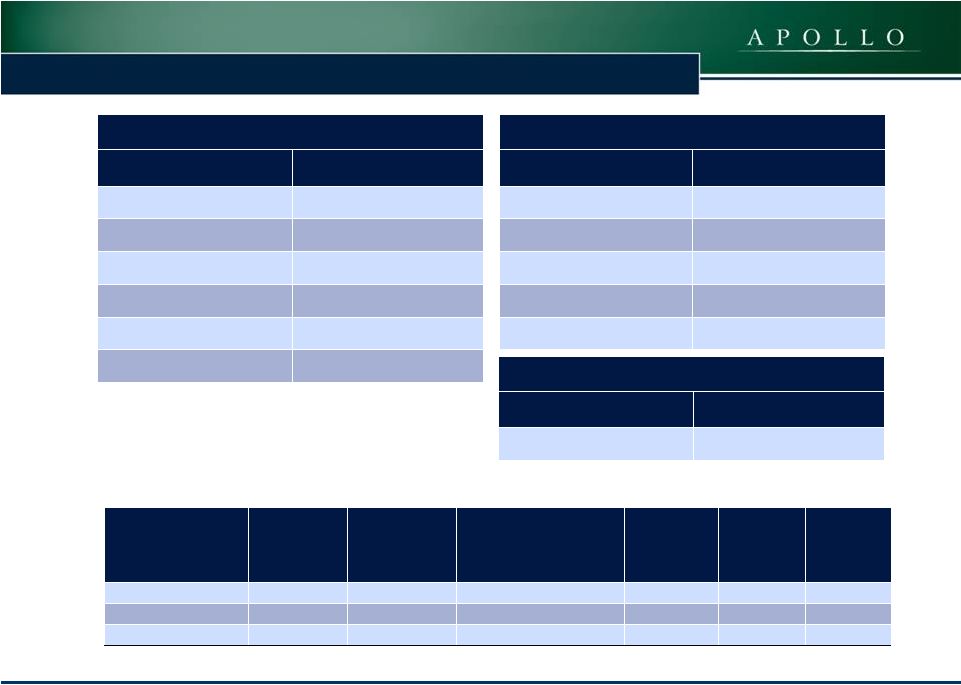
ARI –
Financial Summary
(1)
Operating Earnings is a non-GAAP financial measure that is used to
approximate cash available for distribution and is defined by the Company as net income, computed in accordance with GAAP, adjusted for (i) non-cash equity compensation expense and (ii) any
unrealized gains or losses or other non-cash items included in net
income. Please see slide 22 for a reconciliation of Operating Earnings and Operating Earnings per Share to GAAP net income and GAAP net income per share.
(2)
Fixed rate debt refers to the TALF borrowings which were refinanced with
the Wells repurchase facility during January 2012. (3)
Debt service coverage is EBITDA divided by interest expense.
Income Statement
June 30, 2012
June 30, 2011
% Change
June 30, 2012
June 30, 2011
% Change
13,880
$
13,464
$
3.1%
28,309
$
24,402
$
16.0%
(1,929)
$
(3,781)
$
-49.0%
(5,171)
$
(7,121)
$
-27.4%
Net interest income
(in thousands)
11,951
$
9,683
$
23.4%
23,138
$
17,281
$
33.9%
0.41
$
0.40
$
2.5%
0.83
$
0.69
$
20.3%
20,991,450
17,684,991
18.7%
20,978,938
17,556,455
19.5%
Balance sheet
June 30, 2012
December 31, 2011
% Change
676,034
$
860,247
$
-21.4%
325,338
$
318,220
$
2.2%
Net stockholders equity
341,518
$
336,978
$
1.3%
2.9 Years
2.2 Years
1.1x
1.6x
-
$
251,327
$
350,696
$
290,700
$
6.9x
3.9x
Three Months Ended
Six Months Ended
Interest income
(in thousands)
Interest expense
(in thousands)
Operating earnings per share
(1)
Basic and diluted weighted average common shares
outstanding
Investments at amortized cost
(in thousands)
Net equity in investments at cost
(in thousands)
Investments -
Weighted average Duration
Debt to equity
Fixed rate debt
(in thousands)
(2)
Debt service coverage
(3)
Floating rate debt
(in thousands) |
 4
COMMERCIAL REAL ESTATE FINANCE, INC. (“ARI”)
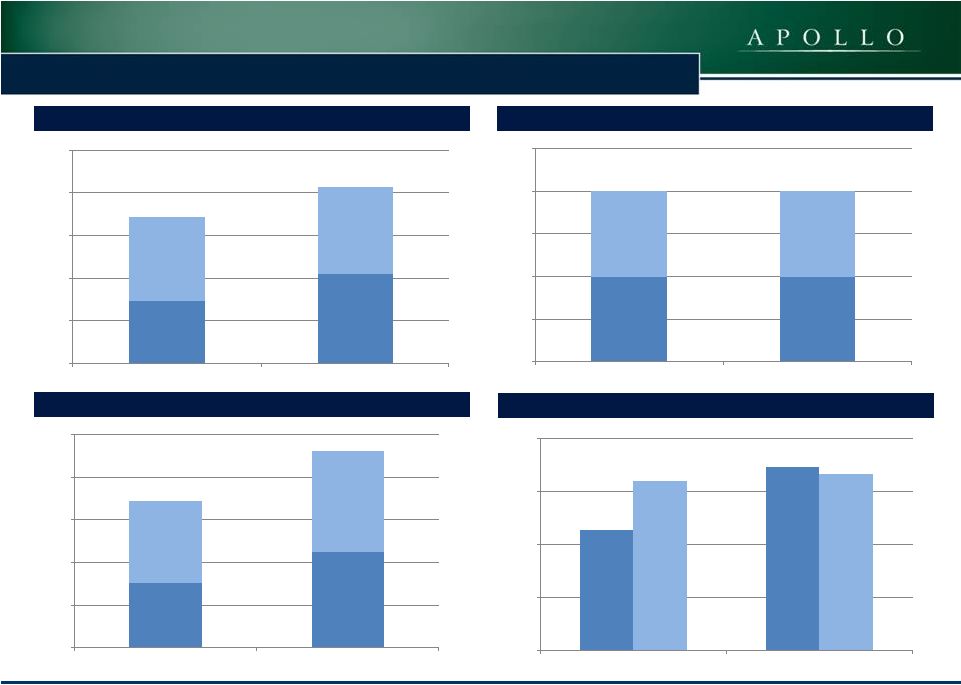
ARI –
Six Month Overview
Operating Earnings per Share
Dividends per Share
Net Interest Income ($000s)
Return
on
Equity
Based
on
Operating
Earnings
(1)
$0.40
$0.40
$0.40
$0.40
$0.00
$0.20
$0.40
$0.60
$0.80
$1.00
Six Months Ended June 30, 2011
Six Months Ended June 30, 2012
(1)
Return on equity is calculated as annualized Operating Earnings for the
quarter as a percentage of average equity. $0.29
$0.42
$0.40
$0.41
$0.00
$0.20
$0.40
$0.60
$0.80
$1.00
Six Months Ended June 30, 2011
Six Months Ended June 30, 2012
$7,599
$11,187
$9,684
$11,951
$0
$5,000
$10,000
$15,000
$20,000
$25,000
Six Months Ended June 30, 2011
Six Months Ended June 30, 2012
6.8%
10.4%
9.6%
10.0%
0.0%
3.0%
6.0%
9.0%
12.0%
Six Months Ended June 30, 2011
Six Months Ended June 30, 2012
1Q
2Q
1Q
2Q |
 5
COMMERCIAL REAL ESTATE FINANCE, INC. (“ARI”)
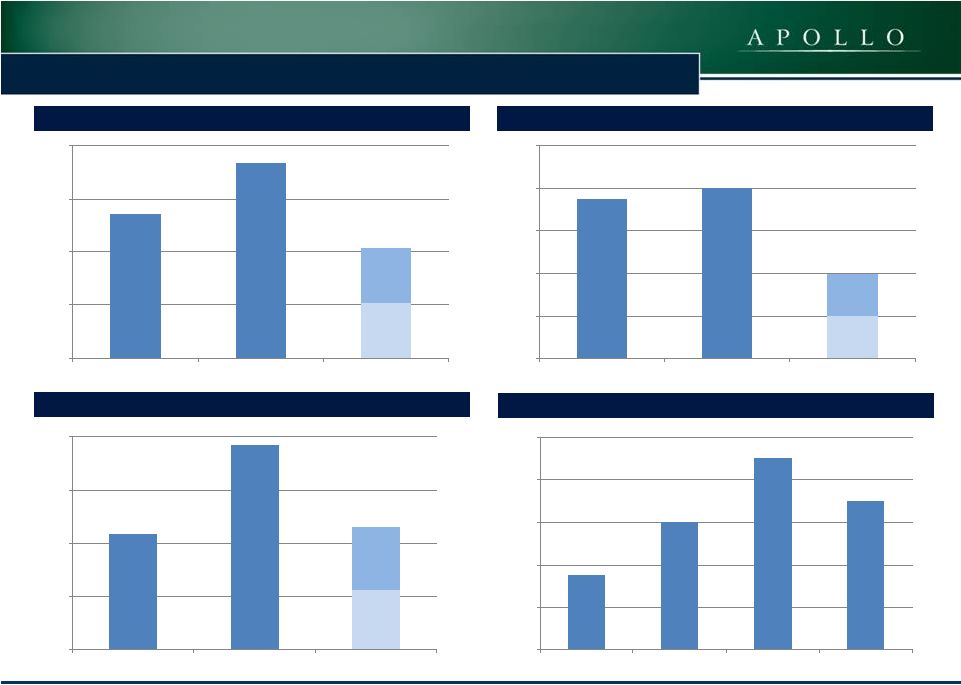
ARI –
Historical Overview
Operating Earnings per Share
(1)
Return on equity is calculated as annualized Operating Earnings for the
quarter as a percentage of average equity. Dividends per
Share Net Interest Income ($000s)
Return
on
Equity
Based
on
Operating
Earnings
(1)
9.3%
9.8%
10.4%
10.0%
8.6%
9.0%
9.4%
9.8%
10.2%
10.6%
Q3 2011
Q4 2011
Q1 2012
Q2 2012
$1.50
$1.60
$0.40
$0.40
$0.00
$0.40
$0.80
$1.20
$1.60
$2.00
2010
2011
YTD 2012
$1.09
$1.47
$0.42
$0.41
$0.00
$0.40
$0.80
$1.20
$1.60
2010
2011
YTD 2012
$21,771
$38,464
$11,187
$11,951
$0
$10,000
$20,000
$30,000
$40,000
2010
2011
YTD 2012 |
 6
COMMERCIAL REAL ESTATE FINANCE, INC. (“ARI”)
ARI –
Q2 Highlights
Financial Results & Earnings Per Share
Operating Earnings for the quarter ended June 30, 2012 of $8.5 million,
or $0.41 per diluted common share
(1)
–
A per
share
increase
of
2.5%
as
compared
with
Operating
Earnings
per
share
for
the
same
period
in
2011
–
Net interest income of $12.0 million for Q2 2012
–
Total expenses of $4.1 million, comprised of management fees of $1.3
million, G&A of $1.9
million
(including
a
one-time
brokerage
fee
of
$0.7
million
related
to
an
investment)
and
non-cash,
stock based compensation of $0.9 million
–
GAAP net income for the quarter ended June 30, 2012 of $9.9 million,
or $0.47 per diluted common share
Dividend
Declared a dividend of $0.40 per share of common stock for the quarter
ended September 30, 2012
–
Ninth consecutive quarter of maintaining consistent dividend
level –
9.6% annualized dividend yield based on $16.75 closing price on August
3, 2012 (1)
Operating Earnings is a non-GAAP financial measure that is used to
approximate cash available for distribution and is defined by the Company as net income, computed in accordance with GAAP, adjusted for (i) non-cash
equity compensation expense and (ii) any unrealized gains or losses or
other non-cash items included in net income. Please see slide 22 for a reconciliation of operating earnings and operating earnings per diluted common
share to GAAP net income and GAAP net income per diluted common
share. |
 7
COMMERCIAL REAL ESTATE FINANCE, INC. (“ARI”)
ARI –
Q2 Highlights
Investment and Portfolio Activity
New Investments
–
Acquired two senior sub-participation interests with an aggregate
face value of $23.8 million, part of a $120 million first
mortgage loan secured by over 20 acres of land in the South Boston Waterfront District, which is
entitled for over 5.8 million buildable square feet and is currently
used as parking with approximately 3,325 spaces. The
aggregate purchase price of the senior sub-participation interests was $17.9 million (75% of face
value) and the investment has been underwritten to generate an IRR of
approximately 21.7%, after the payment of expenses
(1)
–
Acquired $70.7 million of CMBS where the obligors are certain special
purpose entities formed to hold substantially all of the assets
of Hilton Worldwide, Inc.(the “Hilton CMBS”) The investment has been
underwritten
to
generate
an
IRR
of
approximately
11.7%
(1)
Loan Modification
–
Modified a $40 million subordinate loan secured by a ski resort in
California to provide financial covenant relief in connection
with a loan modification of the senior and junior loans. The loan modification included the
addition of an amendment fee, exit fee and an increase of the interest
rate. Following the modification, the investment
has
been
underwritten
to
generate
an
IRR
of
approximately
14.8%
(1)
(1)
The
internal
rates
of
return
(“IRR”)
for
the
investments
listed
reflect
the
returns
underwritten
by
the
Manager,
calculated
on
a
weighted
average
basis
assuming
no
dispositions,
early
prepayments
or
defaults
but
assumes
extensions
as
well
as
the
cost
of
borrowings
and
derivative
instruments
under
the
Company’s
master
repurchase
agreement
with
Wells
Fargo
Bank,
N.A.
(“Wells
Facility”).
There
can
be
no
assurance
the
actual
IRRs
will
equal
the
underwritten
IRRs
shown.
See
“Risk
Factors”
in
the
Company’s
Annual
Report
on
Form
10-K for the year ended December 31, 2011 for a discussion of some
of the factors that could adversely impact the returns received by the Company from the investments over time. |
 8
COMMERCIAL REAL ESTATE FINANCE, INC. (“ARI”)
ARI –
Q2 Highlights
Investment and Portfolio Activity (cont.)
Loan/Investment Repayments
–
Received repayment from a $24 million first mortgage loan on a hotel
in midtown Manhattan, which generated $8.6 million of equity
for reinvestment after repayment of $15.4 million of borrowings
–
Received $54.5 million of repayments from CMBS and the repurchase
agreement secured by CDO bonds, generating $16.0 million of
equity for reinvestment Financing Overview
Amended JP Morgan Facility
–
Amended
the
JP
Morgan
repurchase
facility
to
reduce
the
interest
rate
spread
by
0.50%
to
LIBOR+2.50%
Amended Wells Fargo Facility
–
In connection with the acquisition of the Hilton CMBS, the repurchase
facility with Wells Fargo was amended to provide up to $100
million of financing for the purchase of Hilton CMBS at LIBOR+2.35%; The
additional financing is coterminous with the Hilton CMBS, assuming
full extensions Portfolio Summary
Total
investments
with
an
amortized
cost
of
$676
million
at
June
30,
2012
Weighted
average
underwritten
IRR
of
approximately
15.0%
(1)
(1)
The
internal
rates
of
return
(“IRR”)
for
the
investments
listed
reflect
the
returns
underwritten
by
theManager,calculated
on
a
weighted
average
basis
assuming
no
dispositions,
early
prepayments
or
defaults
but
assumes
extensions
as
well
as
the
cost
of
borrowings
and
derivative
instruments under the Wells Facility. There can be no assurance the
actual IRRs will equal the underwritten IRRs shown. See “Risk Factors”
in the Company’s Annual Report on Form 10-K for the year ended
December 31, 2011 for a discussion of some of the factors that could
adversely impact the returns received by the Company from the
investments over time. |
 9
COMMERCIAL REAL ESTATE FINANCE, INC. (“ARI”)
ARI –
Q2 Highlights and Subsequent Events
Book Value
GAAP book value of $16.59 per share as of June 30, 2012
Fair
value
of
$17.22
per
share
as
of
June
30,
2012
(1)
ARI closed at $16.75 on August 3, 2012, a 1% premium to GAAP book value
per share and a 2.9% discount to fair market value per
share Subsequent Events
New Investments
–
Acquired a $6.5 million mezzanine loan secured by a pledge of the
equity interest in a borrower that owns a mixed use project
consisting of 55,585 square feet of Class-A retail and 114,476 square feet of Class-A office in Chapel
Hill,
North
Carolina.
The
loan
has
been
underwritten
to
generate
an
IRR
of
approximately
12.0%
(2)
Preferred Offering
–
Completed
an
underwritten
public
offering
of
3.45
million
shares
of
its
Series
A
Cumulative
Redeemable
Perpetual Preferred Stock (the “Series A Preferred Stock”),
with a liquidation preference of $25 per share, including the
exercise of the underwriters’ option to purchase additional
shares –
Net proceeds, after the underwriting discount and estimated offering
expenses payable by the Company, were approximately $83.2
million (1)
The Company carries loans at amortized cost and its CMBS securities are
marked to market. Management has estimated that the fair value of the Company’s financial assets at June 30, 2012 was approximately $12.9 million greater than the carrying value of the Company’s
investment portfolio as of the same date. This represents a
premium of $0.63 per share over the Company's GAAP book value as ofJune 30, 2012.
(2)
The
internal
rates
of
return
(“IRR”)
for
the
investments
listed
reflect
the
returns
underwritten
by
theManager,calculated
on
a
weighted
average
basis
assuming
no
dispositions,
early
prepayments
or
defaults
but
assumes
extensions
as
well
as
the
cost
of
borrowings
and
derivative
instruments under the Wells Facility. There can be no assurance the
actual IRRs will equal the underwritten IRRs shown. See “Risk Factors”
in the Company’s Annual Report on Form 10-K for the year ended
December 31, 2011 for a discussion of some of the factors that could
adversely impact the returns received by the Company from the
investments over time. |
 10
COMMERCIAL REAL ESTATE FINANCE, INC. (“ARI”)
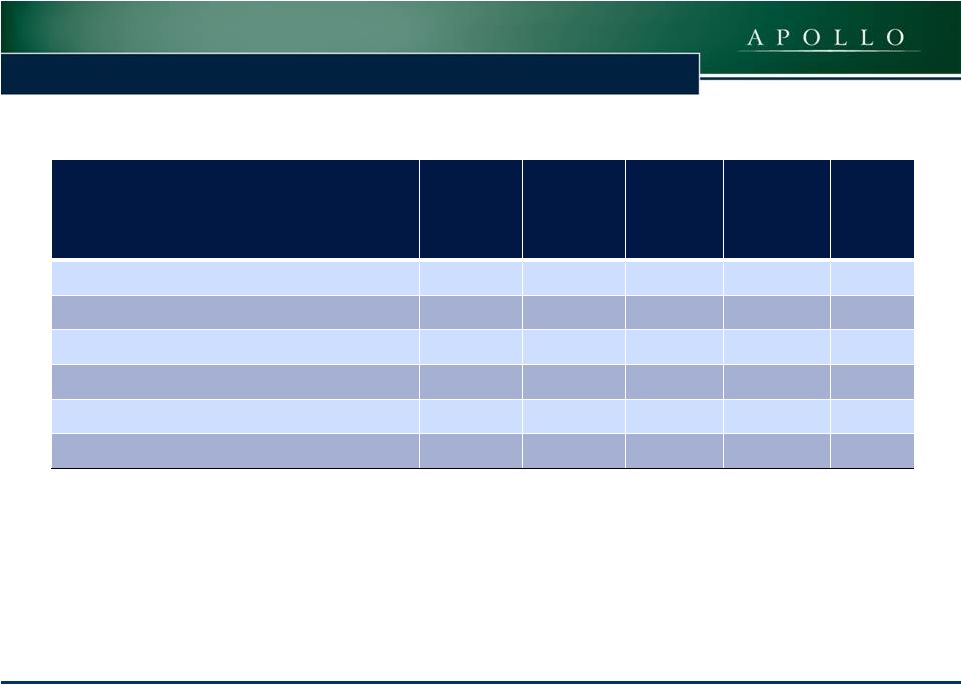
ARI –
Portfolio Overview
Asset Type
($000s)
Amortized
Cost
Borrowings
Equity
at Cost
Weighted
Average
IRR
(2)(3)
First
Mortgage
Loans
(2)
$103,320
$53,060
$50,260
2.4
20.0%
Subordinate Loans
179,602
-
179,602
5.2
14.0%
Repurchase Agreements
41,696
-
41,696
1.8
13.7%
CMBS -
AAA
280,697
248,177
$32,520
1.7
16.2%
CMBS -
Hilton
70,719
49,459
$21,260
3.4
11.7%
Investments at June 30, 2012
$676,034
$350,696
$325,338
2.9 Years
15.0%
As of June 30, 2012.
(1)
Remaining Weighted Average Life assumes all extension options are
exercised. (2)
Borrowings under the Company’s master repurchase facility with
JPMorgan bear interest at LIBOR plus 250 basis points, or 2.75% at June 30, 2012. The IRR calculation further assumes the JPM repurchase facility will
remain available over the life of these investments.
(3)
The IRR for the investments shown in the above table reflect the returns
underwritten by the Manager, calculated on a weighted average basis assuming no dispositions, early prepayments or defaults but assumes extensions
as well as the cost of borrowings and derivative instruments under the
Wells Facility. There can be no assurance the actual IRRs will equal the underwritten IRRs shown in the table. See “Risk Factors” in the Company’s
Annual Report on Form 10-K for the year ended December 31, 2011 for
a discussion of some of the factors that could adversely impact the returns received by the Company from the investments shown in the table over time.
Remaining
Weighted
Average
Life (years )
(1) |
 11
COMMERCIAL REAL ESTATE FINANCE, INC. (“ARI”)
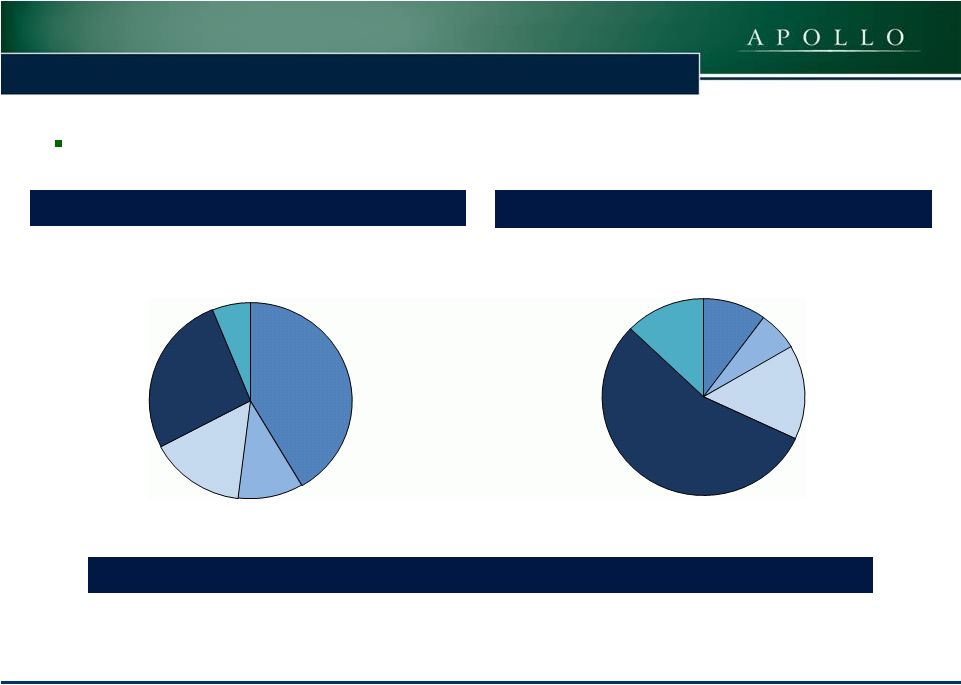
ARI –
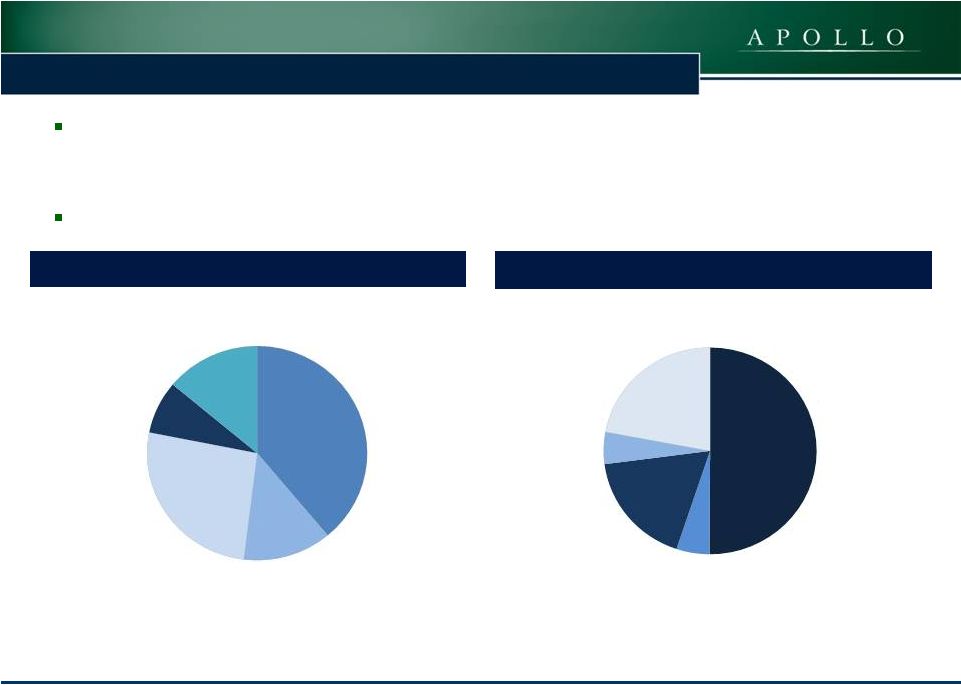
Portfolio Overview
Diversified Investment Portfolio with Amortized Cost Basis of $676
million Weighted Average IRR of Approximately 15.0%
(1)
Net Invested Equity at Amortized Cost Basis
Gross Assets at Amortized Cost Basis
CMBS -
AAA
42%
CMBS -
Hilton
10%
First Mortgages
15%
Subordinate
Loans
27%
Repurchase
Agreements
6%
CMBS -
AAA
10%
CMBS -
Hilton
7%
First Mortgages
15%
Subordinate
Loans
55%
Repurchase
Agreements
13%
As of June 30, 2012.
(1)
The IRR for the investments shown in the above charts reflect the returns
underwritten by the Manager, calculated on a weighted average basis assuming no dispositions, early prepayments or defaults but
assumes extensions as well as the cost of borrowings and derivative instruments
under the Wells Facility. There can be no assurance the actual IRRs will equal the underwritten IRRs shown in the charts. See
“Risk Factors”
in the Company’s Annual Report on Form 10-K for the year ended December
31, 2011 for a discussion of some of the factors that could adversely impact the returns received by the Company
from the investments over time. |
 12
COMMERCIAL REAL ESTATE FINANCE, INC. (“ARI”)
ARI –
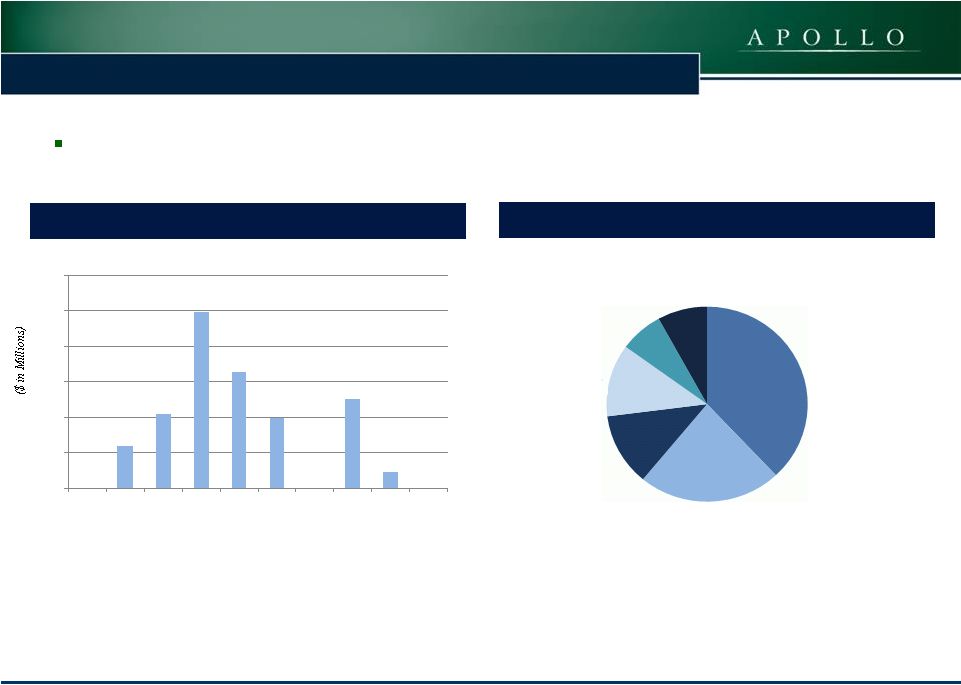
Loan Portfolio Diversification
As of June 30, 2012, first mortgages and subordinate loans represented
70% of ARI’s investment portfolio’s net equity
The loan portfolio is diversified by property type and geographic
location Loan Portfolio -
Geographic Diversification by Face
Amount
(1)
Loan Portfolio -
Property Type by Face Amount
(1)
(1)
Does not include CMBS (AAA or Hilton) or repurchase agreement investment
secured by CDO bond. (2)
Other category includes the subordinate financing on a ski resort.
Hotel
39%
Office
13%
Retail
26%
Parking/
Development
Site
8%
Other (2)
14%
Northeast
50%
Southeast
5%
Mid-Atlantic
18%
Midwest
5%
West
22% |
 13
COMMERCIAL REAL ESTATE FINANCE, INC. (“ARI”)
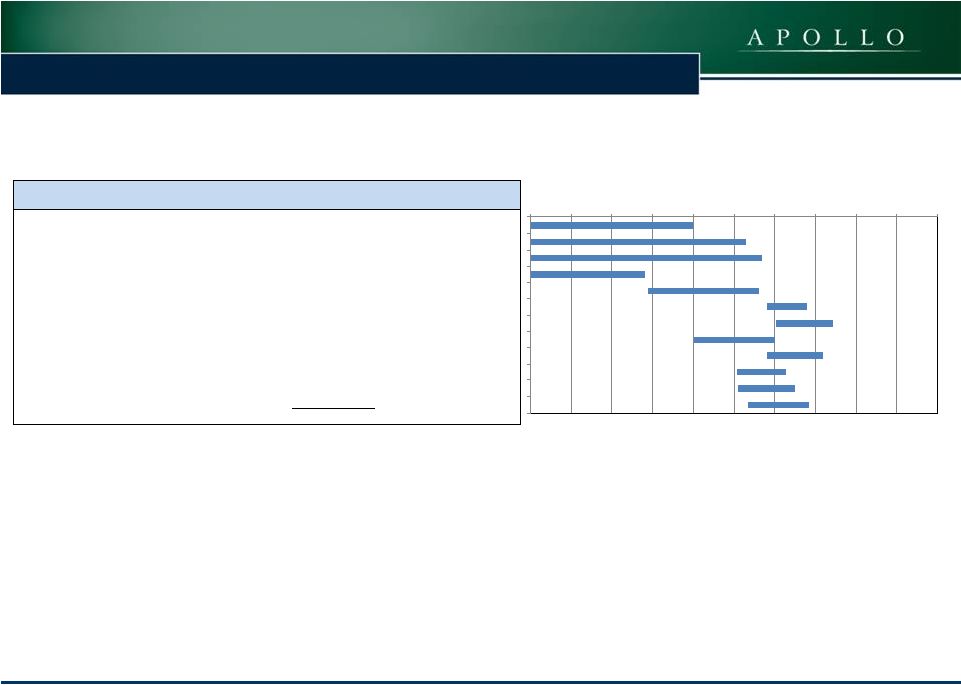
ARI –Loan Portfolio -
Maturity and Type
Fully
Extended
Loan
Maturity
Schedule
($000s)
(1)
(1)
Based upon Face Amount of Loans; Does not include CMBS (AAA or Hilton)
or repurchase agreement investment secured by CDO bond. Loan
Position and Rate Type (1)
ARI’s Loan Portfolio had a face amount of $288 million at June 30,
2012 $0
$23.8
$41.7
$99.6
$65.7
$40.0
$0
$50.0
$8.9
$0
$0
$20
$40
$60
$80
$100
$120
2012
2013
2014
2015
2016
2017
2018
2019
2020
2021
Senior Loan
Fixed
38%
Mezzanine
Loan Fixed
23%
Mezzanine
Loan Floating
12%
Subordinate
Loan Fixed
12%
Subordinate
Loan Floating
7%
Preferred
Equity Fixed
8% |
 14
COMMERCIAL REAL ESTATE FINANCE, INC. (“ARI”)
ARI –
Loan Portfolio –
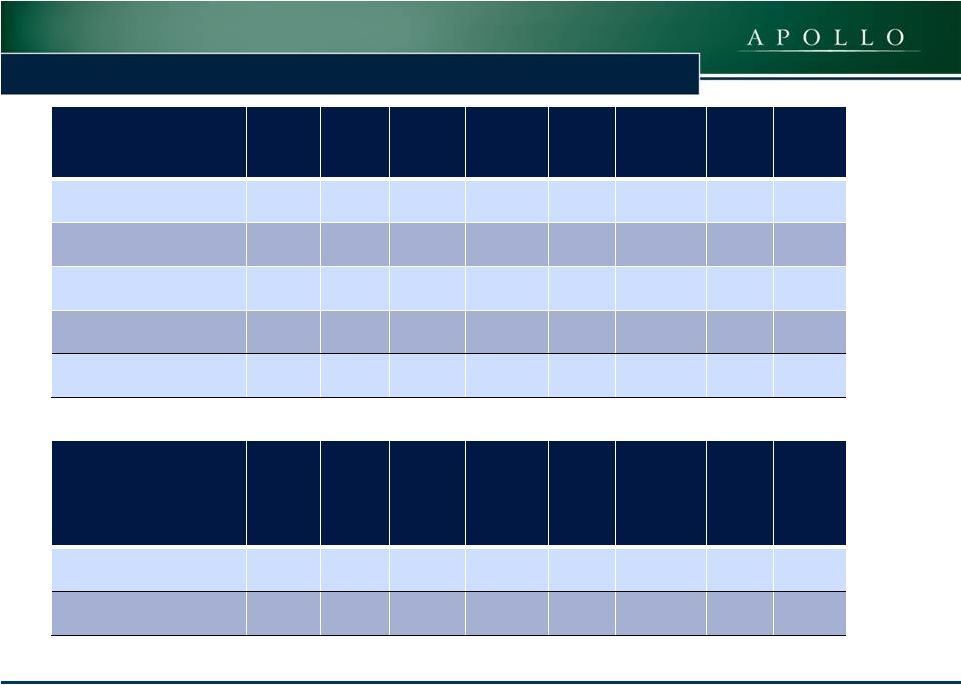
Loan Level LTV (Through Last Invested Dollar)
(1)
Ending LTV represents the loan-to-value as of the date of
investment for all loans except the $32,000 New York, NY hotel loan, which is as of March 2011.
(2)
Description ($ in thousands)
Location
Balance at
June 30, 2012
LTV (Senior
Mortgage)
Ending LTV
(1)
First Mortgage - Hotel
New York
31,687
$
0%
40%
First Mortgage - Office
New York
27,534
$
0%
53%
First Mortgage - Hotel
Maryland
25,421
$
0%
57%
First Mortgage - Parking/Development Site
(2)
Boston
23,844
$
0%
28%
Subordinate - Ski Resort
California
40,000
$
29%
56%
Subordinate - Retail
Various
30,000
$
58%
68%
Subordinate - Retail
Virginia
25,670
$
60%
74%
Subordinate - Hotel Portfolio
New York
25,000
$
40%
60%
Subordinate -Retail
Various
20,000
$
58%
72%
Subordinate - Hotel
New York
15,000
$
51%
63%
Subordinate - Hotel
New York
15,000
$
51%
65%
Subordinate - Office
Michigan
8,932
$
53%
68%
Total
288,088
$
0%
10%
20%
30%
40%
50%
60%
70%
80%
90%
100%
LTV is based upon the aggregate face value ($23.8 million) of the senior
sub-participation interests at the date of investment; ARI purchased the senior sub participation interests for $17.8 million (75% of face value). |
 15
COMMERCIAL REAL ESTATE FINANCE, INC. (“ARI”)
ARI –
Senior Loan Portfolio
Description ($000’s)
Date of
Investment
Maturity
Date
(1)
Original
Face
Amount
Current
Face
Amount
Coupon
Amortization
Schedule
Property
Size
Appraised
LTV
(2)
Hotel
New York, NY
Jan-10
Feb-15
$32,000
31,687
8.25%
30 year
151
rooms
40%
Office Condo (Headquarters)
New York, NY
Feb-10
Feb-15
28,000
27,534
8.00
30 year
73,419
sq. ft.
54%
Hotel
Silver Spring, MD
Mar-10
Apr-15
26,000
25,421
9.00
25 year
263
rooms
58%
Parking/Development Site
Boston, MA
Apr-12
Dec-13
23,844
23,844
2.00%
(L+1.72%)
Interest
Only
20 acres
28%
Total
.
.
$109,844
$108,486
6.99%
(1)
Maturity date assumes all extension options are exercised.
(2)
Appraised LTV represents the loan to value as of the date of investment
for all loans except the $32,000 New York, NY hotel loan, which is as of March 2011.
(3)
Interest rate includes 10% current payment with a 3% accrual.
Description ($000’s)
Date of
Investment
Maturity
Date
Original
Face
Amount
Current
Face
Amount
Coupon
Amortization
Schedule
Property
Size
Appraised
LTV
(2)
Repurchase Agreement
(3)
Sept-10
Mar-14
$47,439
$41,696
13.00%
Interest
only
N/A
N/A
Total
$47,439
$41,696
13.00% |
 16
COMMERCIAL REAL ESTATE FINANCE, INC. (“ARI”)
ARI –
Subordinate Loan Portfolio
Description ($000’s)
Date of
Investment
Maturity
Date
(1)
Original
Face
Amount
Current Face
Amount
Coupon
Amortization
Schedule
Appraised
LTV
(2)
Senior Mezz –
Retail
Various
Dec-09
Dec-19
(3)
$30,000
30,000
12.24%
Interest
only
69%
Junior Mezz –
Retail
Various
Dec-09
Dec-19
(3)
20,000
20,000
14.00
Interest
only
74%
Office
Michigan
May-10
Jun-20
9,000
8,932
13.00
25 year
70%
Ski Resort
California
Apr-11
May-17
(4)
40,000
40,000
14.00
Interest
only
64%
Hotel Portfolio
New York
(5)
Aug-11
July-16
(6)
25,000
25,000
11.49
(L+10.49%)
Interest
only
60%
Retail Center
Virginia
(7)
Oct-11
Oct-16
(7)
25,000
25,670
14.00
Interest
only
74%
Hotel
(8)
New York
Jan-12
Jan-15
15,000
15,000
12.00
Interest
only
63%
Hotel
(9)
New York
Mar-12
Feb-16
15,000
15,000
11.50
(L+11.00%)
Interest only
65%
Total
.
.
$179,000
$179,602
13.03%
(1) Maturity date assumes all extension options are
exercised. (2) Appraised LTV represents the loan to value as
of the date of investment. (3) Prepayments are prohibited prior to
the fourth year of the loan and any prepayments thereafter are subject to prepayment penalties ranging from 5% to 1%.
(4) Prepayments are prohibited prior to the third year of the loan and
any prepayments thereafter are subject to prepayment penalties ranging from 5% to 1%.
(5) Includes a LIBOR floor of 1% and three one-year extension
options subject to certain conditions and the payment of a 0.25% fee for the fourth and fifth year extensions.
(6) Prepayments are prohibited prior to February 2013 and any
prepayments thereafter are subject to spread maintenance premiums.
(7) Interest rate of 14.0% includes a 10.0% current payment with
a 4.0% accrual. There are two one-year extension options
subject to certain conditions. (8) Includes a 1.00% origination
fee, a one-year extension option subject to certain conditions and a 0.50% extension fee as well as a 1.50% exit fee.
(9) Includes a LIBOR floor of 0.50%, two one-year extension options
subject to certain conditions and the payment of a 0.50% fee for the second extension. |
 17
COMMERCIAL REAL ESTATE FINANCE, INC. (“ARI”)
ARI –
CMBS Portfolio
Face
Amortized
Cost
Remaining Weighted
Average Life with
Extensions (years)
Estimated
Fair Value
Debt
Net
Equity at
Cost
CMBS –
AAA
$275,997
$280,697
1.7
$283,365
$248,177
$32,520
CMBS –
Hilton
74,854
70,719
3.4
71,205
49,459
21,260
CMBS –
Total
$350,851
$351,416
2.0
$354,570
$297,636
$53,780
CMBS -
AAA
CUSIP
Description
07388YAB8
BSCMS 07-PW16 A2
07401DAB7
BSCMS 2007-PW18 A2
12513YAC4
CD 2007-CD4 A2B
46629MAB1
JPMCC 2006-LDP8 A2
61754KAC9
MSC 07-IQ14 A2
92978YAB6
WBCMT 07-C32 A2
CMBS -
AAA
CUSIP
Description
07401DAB7
BSCMS 2007-PW18 A2
36246LAB7
GSMS 2007-GG10 A2
46630JAK5
JPMCC 2007-LDPX A2S
61751NAD4
MSC 2007-HQ11 A31
92978TAB7
WBCMT 2007-C31 A2
CMBS –
Hilton
CUSIP
Description
05956KAA6
BALL 2010-HLTN |
 18
COMMERCIAL REAL ESTATE FINANCE, INC. (“ARI”)
Financing Overview
Facility
Debt Balance
Weighted
Average
Remaining
Maturity
(1)
Cost of
Funds
Hedged
Cost of
Funds
Wells Facility
$297,636
1.5 years
1.8%
2.0%
JP Morgan Facility
53,060
0.5 years
2.7%
2.7%
Total Borrowings at June 30, 2012
$350,696
1.3 years
1.9%
2.1%
Facility
Less than 1 year
1 to 3 years
3 to 5 years
Total
Wells Facility
$118,087
$137,466
$42,083
$297,636
JP Morgan Facility
53,060
-
-
53,060
Total Borrowings at June 30, 2012
$171,147
$137,466
$42,083
$350,696
ARI had total borrowings outstanding of $351 million at June 30,
2012
ARI’s borrowings had the following remaining maturities at June
30, 2012: (1)
Assumes extension options on Wells Facility are exercised. Borrowings
outstanding under the Wells Facility bear interest at LIBOR plus 125bps, 150bps or 235bps depending on the collateral pledged. |
 19
COMMERCIAL REAL ESTATE FINANCE, INC. (“ARI”)
Financials |
  20
COMMERCIAL REAL ESTATE FINANCE, INC. (“ARI”)
Consolidated Balance Sheets
(in thousands—except share and per share data)
June 30, 2012
December 31, 2011
Assets:
Cash
11,959
$
21,568
$
Securities available-for-sale,
at estimated fair value 125,631
302,543
Securities, at estimated fair
value 228,939
251,452
Commercial mortgage loans, held for
investment 103,321
109,006
Subordinate loans, held for
investment 179,602
149,086
Repurchase agreements, held for
investment 41,696
47,439
Principal and interest
receivable 11,195
8,075
Deferred
financing costs, net 1,161
2,044
Other
assets 10
17
Total Assets
703,514
$
891,230
$
Liabilities and Stockholders' Equity
Liabilities:
Borrowings under repurchase agreements
350,696
$
290,700
$
TALF Borrowings
-
251,327
Derivative instruments, net
291
478
Accounts payable and accrued expenses
1,072
1,746
Payable
to related party 1,294
1,298
Dividends
payable 8,726
8,703
Deferred
revenue 117
-
Total Liabilities
362,196
554,252
Stockholders' Equity:
Common stock, $0.01 par value, 450,000,000 shares authorized 20,570,616 and 20,561,032 shares
issued and outstanding in 2012 and 2011, respectively
206
206
Preferred stock, $0.01 par value, 50,000,000 shares authorized and no shares outstanding
-
-
Additional paid-in-capital
337,923
336,209
Retained earnings
2,214
-
Accumulated other comprehensive income
975
563
Total Stockholders' Equity
341,318
336,978
Total Liabilities and Stockholders'
Equity 703,514
$
891,230
$
|
 21
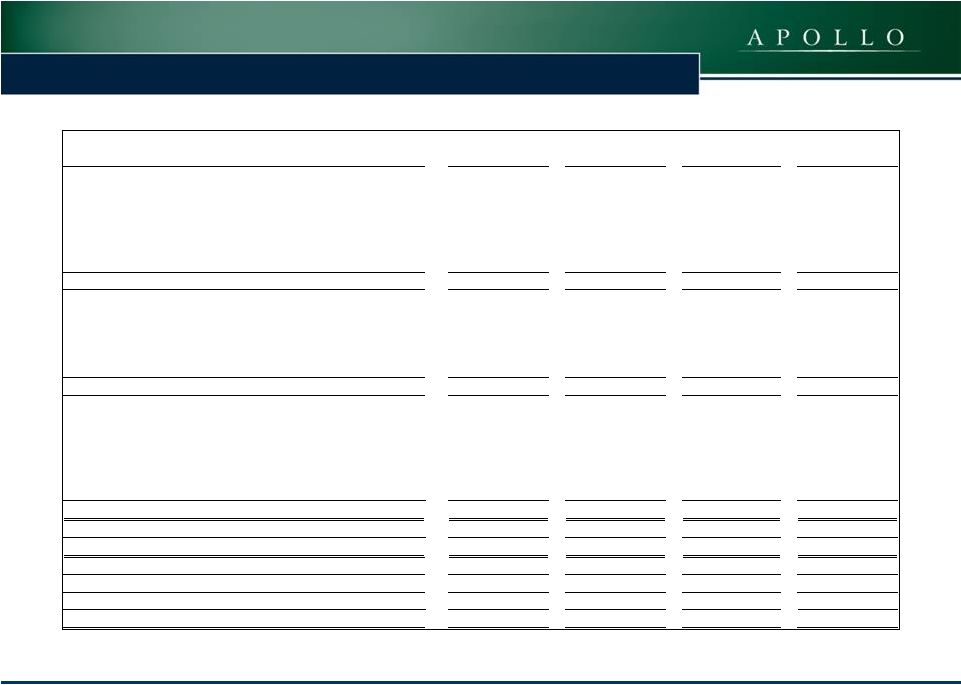
COMMERCIAL REAL ESTATE FINANCE, INC. (“ARI”)
Consolidated Statement of Operations
2012
2011
2012
2011
Net interest income:
Interest income from securities
3,230
$
6,448
$
8,552
$
13,103
$
Interest income from commercial mortgage loans
2,791
2,297
5,026
4,610
Interest income from subordinate loans
5,859
3,167
11,172
5,077
Interest income from repurchase agreements
2,000
1,552
3,559
1,612
Interest expense
(1,929)
(3,781)
(5,171)
(7,121)
Net interest income
11,951
9,683
23,138
17,281
Operating expenses:
General and administrative expenses (includes $886 and
$1,969 of non-cash stock based compensation in 2012 and
$384 and $736 in 2011, respectively)
(2,762)
(1,412)
(4,798)
(2,792)
Management fees to related party
(1,292)
(1,101)
(2,581)
(2,189)
Total operating expenses
(4,054)
(2,513)
(7,379)
(4,981)
Interest income from cash balances
-
3
1
9
Realized gain on sale of securities
-
-
262
-
Unrealized gain on securities
2,078
1,366
3,463
1,392
Loss on derivative instruments (includes $192 and
$187 of unrealized gains in 2012 and $1,548 and $1,089 of unrealized
losses 2011, respectively)
(65)
(2,019)
(482)
(2,001)
Net income
9,910
$
6,520
$
19,003
$
11,700
$
Basic and diluted net income per share of common stock
0.47
$
0.37
$
0.91
$
0.66
$
Basic and diluted weighted average common shares
outstanding 20,991,450
17,561,032
20,978,938
17,556,455
Dividend declared per share of common stock
0.40
$
0.40
$
0.80
$
0.80
$
Three months ended June 30,
Six months ended June 30, |
 22
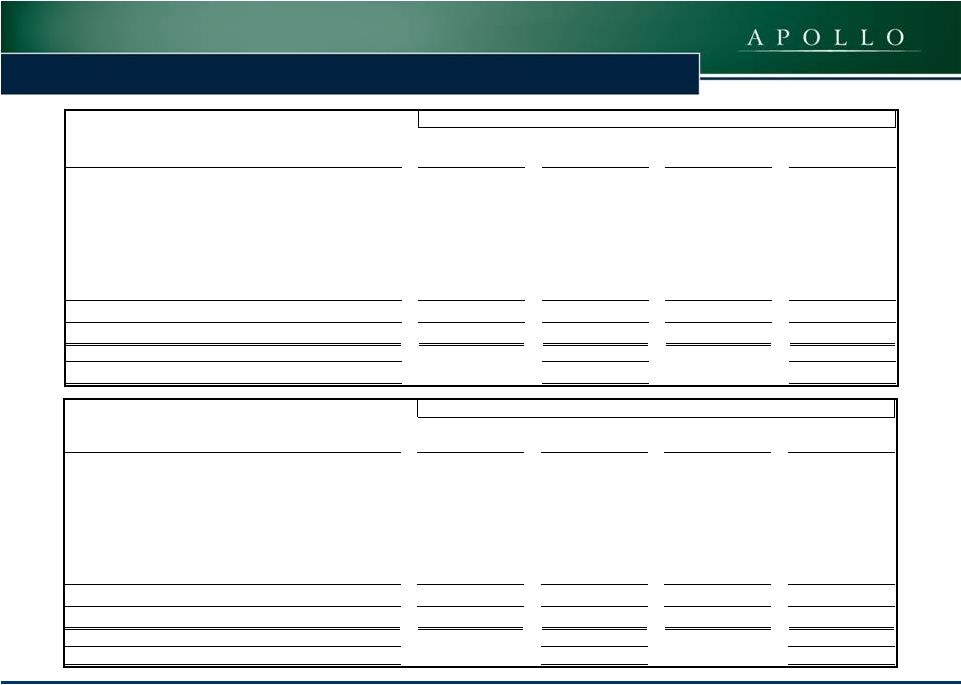
COMMERCIAL REAL ESTATE FINANCE, INC. (“ARI”)
Reconciliation of Operating Earnings to Net Income
June 30, 2012
Earnings Per Share
(Diluted)
June 30, 2011
Earnings Per Share
(Diluted)
Operating Earnings:
Net income
$19,003
$0.91
$11,700
$0.66
Adjustments:
Unrealized gains on securities
(3,463)
(0.16)
(1,392)
(0.08)
Unrealized gains on derivative instruments
(187)
(0.01)
1,089
0.06
Non-cash stock-based compensation expense
1,969
0.09
736
0.04
Total adjustments:
(1,681)
(0.08)
433
0.02
Operating Earnings
17,322
$0.83
$12,133
$0.69
20,978,938
17,556,455
Six Months Ended
June 30, 2012
Earnings Per Share
(Diluted)
June 30, 2011
Earnings Per Share
(Diluted)
Operating Earnings:
Net income
$9,910
$0.47
$6,520
$0.37
Adjustments:
Unrealized gains on securities
(2,078)
(0.09)
(1,366)
(0.08)
Unrealized gains on derivative instruments
(192)
(0.01)
1,548
0.09
Non-cash stock-based compensation expense
886
0.04
384
0.02
Total adjustments:
(1,384)
(0.06)
566
0.03
Operating Earnings
8,526
$0.41
$7,086
$0.40
Basic and diluted weighted average common shares outstanding
20,991,450
17,684,991
Three Months Ended
Basic and diluted weighted average common shares outstanding |