Attached files
| file | filename |
|---|---|
| 8-K - 8-K - ARCH RESOURCES, INC. | a12-17780_18k.htm |
Exhibit 99.1
|
|
Arch Coal, Inc. Investor Presentation August 2012 |
|
|
Slide 2 Forward-Looking Information This presentation contains “forward-looking statements” – that is, statements related to future, not past, events. In this context, forward-looking statements often address our expected future business and financial performance, and often contain words such as “expects,” “anticipates,” “intends,” “plans,” “believes,” “seeks,” or “will.” Forward-looking statements by their nature address matters that are, to different degrees, uncertain. For us, particular uncertainties arise from changes in the demand for our coal by the domestic electric generation industry; from legislation and regulations relating to the Clean Air Act and other environmental initiatives; from operational, geological, permit, labor and weather-related factors; from fluctuations in the amount of cash we generate from operations; from future integration of acquired businesses; and from numerous other matters of national, regional and global scale, including those of a political, economic, business, competitive or regulatory nature. These uncertainties may cause our actual future results to be materially different than those expressed in our forward-looking statements. We do not undertake to update our forward-looking statements, whether as a result of new information, future events or otherwise, except as may be required by law. For a description of some of the risks and uncertainties that may affect our future results, you should see the risk factors described from time to time in the reports we file with the Securities and Exchange Commission. |
|
|
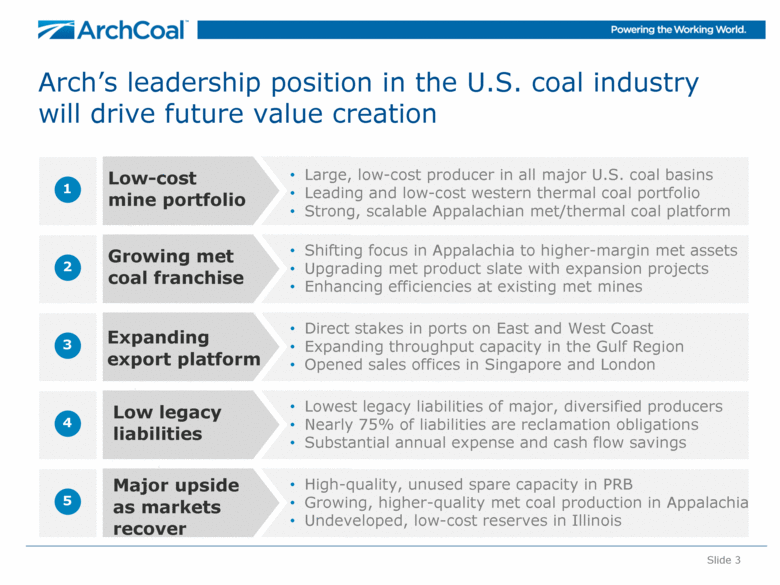
Arch’s leadership position in the U.S. coal industry will drive future value creation Slide 3 1 Low-cost mine portfolio Large, low-cost producer in all major U.S. coal basins Leading and low-cost western thermal coal portfolio Strong, scalable Appalachian met/thermal coal platform 2 Growing met coal franchise Shifting focus in Appalachia to higher-margin met assets Upgrading met product slate with expansion projects Enhancing efficiencies at existing met mines 3 Expanding export platform Direct stakes in ports on East and West Coast Expanding throughput capacity in the Gulf Region Opened sales offices in Singapore and London 4 Low legacy liabilities Lowest legacy liabilities of major, diversified producers Nearly 75% of liabilities are reclamation obligations Substantial annual expense and cash flow savings 5 Major upside as markets recover High-quality, unused spare capacity in PRB Growing, higher-quality met coal production in Appalachia Undeveloped, low-cost reserves in Illinois |
|
|
Arch is the most diversified U.S. coal producer, and the No. 2 reserve holder in the nation Operations extend to every major coal supply basin Slide 4 *Pro forma reserves at 12/31/11 5.6 Billion Ton Reserve Base Western Bituminous Region 422 million tons of reserves Illinois Basin 722 million tons of reserves Powder River Basin 3,382 million tons of reserves Appalachia 1,064 414 Met/PCI million tons of reserves * |

|
|
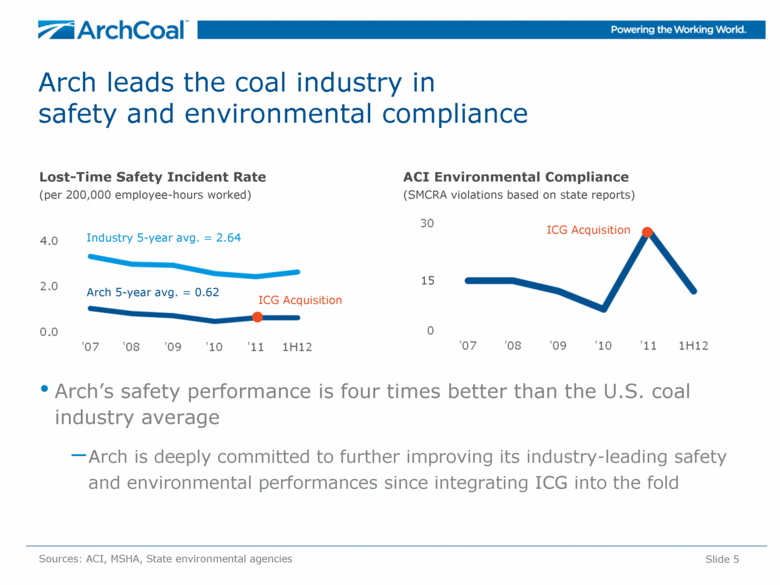
Arch leads the coal industry in safety and environmental compliance Arch’s safety performance is four times better than the U.S. coal industry average Arch is deeply committed to further improving its industry-leading safety and environmental performances since integrating ICG into the fold Slide 5 Sources: ACI, MSHA, State environmental agencies ACI Environmental Compliance (SMCRA violations based on state reports) Lost-Time Safety Incident Rate (per 200,000 employee-hours worked) Arch 5-year avg. = 0.62 Industry 5-year avg. = 2.64 ICG Acquisition ICG Acquisition 15 |
|
|
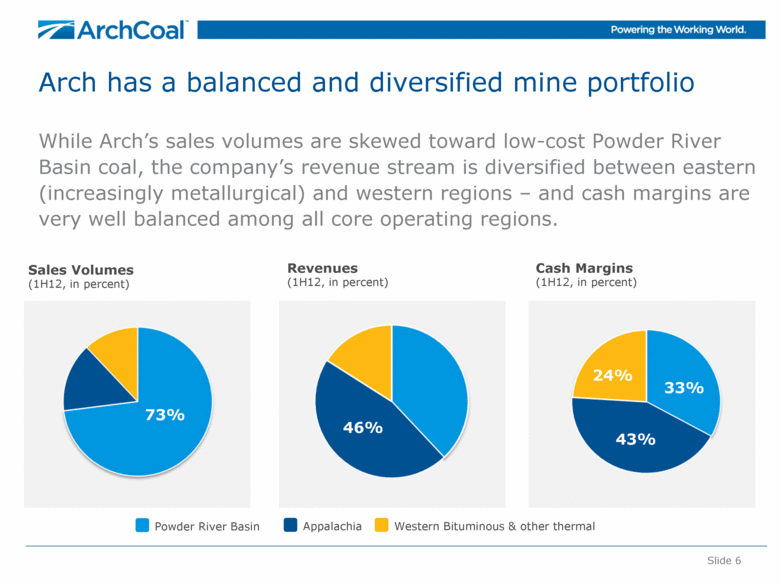
24% Arch has a balanced and diversified mine portfolio While Arch’s sales volumes are skewed toward low-cost Powder River Basin coal, the company’s revenue stream is diversified between eastern (increasingly metallurgical) and western regions – and cash margins are very well balanced among all core operating regions. Slide 6 Sales Volumes (1H12, in percent) Revenues (1H12, in percent) Cash Margins (1H12, in percent) 73% Powder River Basin Appalachia Western Bituminous & other thermal 46% 33% 43% |
|
|
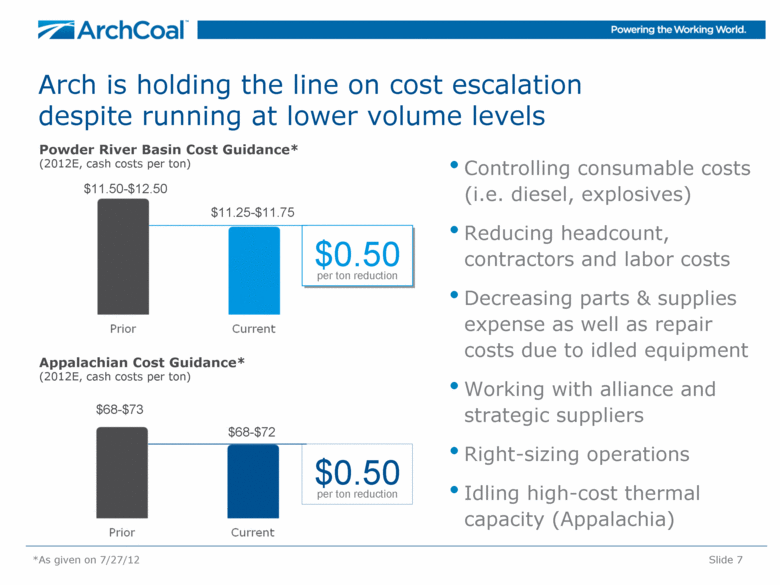
Arch is holding the line on cost escalation despite running at lower volume levels Controlling consumable costs (i.e. diesel, explosives) Reducing headcount, contractors and labor costs Decreasing parts & supplies expense as well as repair costs due to idled equipment Working with alliance and strategic suppliers Right-sizing operations Idling high-cost thermal capacity (Appalachia) Slide 7 Growth $200 Powder River Basin Cost Guidance* (2012E, cash costs per ton) *As given on 7/27/12 $11.50-$12.50 $11.25-$11.75 $0.50 per ton reduction Appalachian Cost Guidance* (2012E, cash costs per ton) $68-$73 $68-$72 $0.50 per ton reduction |
|
|
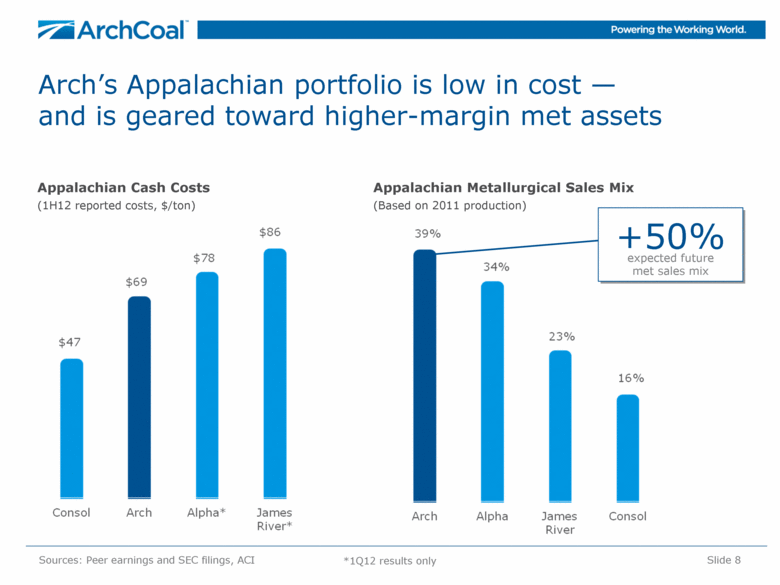
*1Q12 results only Arch’s Appalachian portfolio is low in cost — and is geared toward higher-margin met assets Slide 8 Sources: Peer earnings and SEC filings, ACI Appalachian Metallurgical Sales Mix (Based on 2011 production) Appalachian Cash Costs (1H12 reported costs, $/ton) + 50% expected future met sales mix |
|
|
Arch has increased its financial flexibility and enhanced its liquidity Arch has no long-term debt maturities until 2016 Relaxed financial maintenance covenants until late 2014 $860 million of liquidity available Slide 9 Short-term debt Unsecured bonds Term loan Cash on Hand* $513 million *Balances as of 6/30/2012 Debt Maturity Profile* (in millions) |

|
|
Slide 10 Arch’s long-term growth plans are focused on higher-return organic expansions Leer metallurgical mine adds 3.5 million tons, starting in mid-2013 414 million tons of low-cost met reserves support incremental and greenfield expansion, should market conditions warrant 2012E* 2020 7.5 2015 14-15 15-20 *As given on 7/27/12 |

|
|
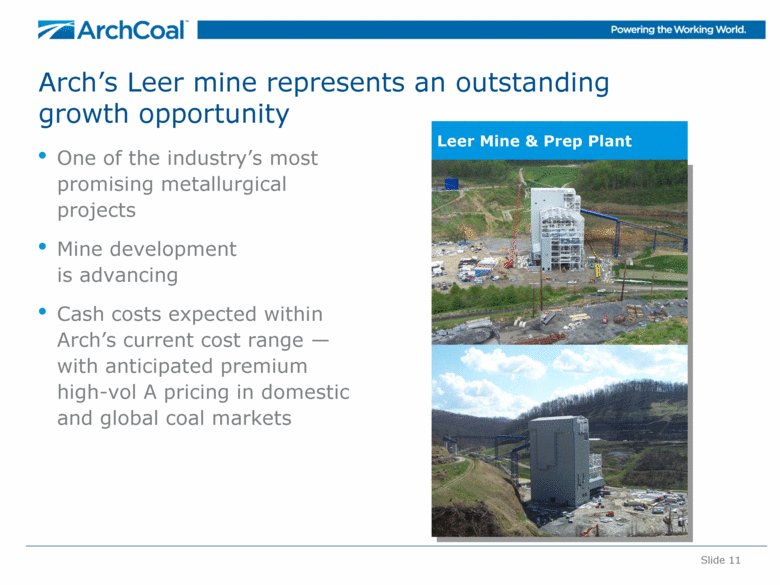
Slide 11 Arch’s Leer mine represents an outstanding growth opportunity One of the industry’s most promising metallurgical projects Mine development is advancing Cash costs expected within Arch’s current cost range — with anticipated premium high-vol A pricing in domestic and global coal markets Leer Mine & Prep Plant |
|
|
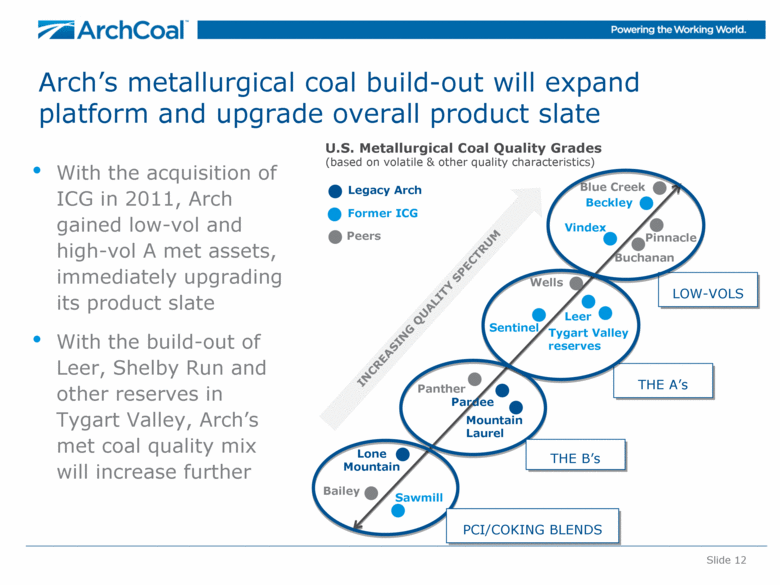
Slide 12 Arch’s metallurgical coal build-out will expand platform and upgrade overall product slate With the acquisition of ICG in 2011, Arch gained low-vol and high-vol A met assets, immediately upgrading its product slate With the build-out of Leer, Shelby Run and other reserves in Tygart Valley, Arch’s met coal quality mix will increase further U.S. Metallurgical Coal Quality Grades (based on volatile & other quality characteristics) Blue Creek Beckley Buchanan Vindex Leer Mountain Laurel Sentinel Pardee Lone Mountain Sawmill Tygart Valley reserves Bailey Panther Wells LOW-VOLS Pinnacle Legacy Arch Former ICG Peers INCREASING QUALITY SPECTRUM THE A’s THE B’s PCI/COKING BLENDS |
|
|
Slide 13 Arch’s long-term goal is to play a larger role in the expanding seaborne coal trade East Coast DTA port in VA Throughput options at other ports Arch’s capacity could approach 10 million tons by 2015 Sources: Wood Mackenzie, ACI 2020 2 billion tons 7+ million tons 1 billion tons 2011 ~30 million tons Seaborne coal trade Arch’s export volumes West Coast MBT port in WA Agreement with Ridley in BC, Canada Pursuing additional throughput options at ports along West Coast Gulf Coast River terminals in Illinois Agreement with Kinder Morgan in LA and TX Throughput options at other ports (plus mid-streaming) |

|
|
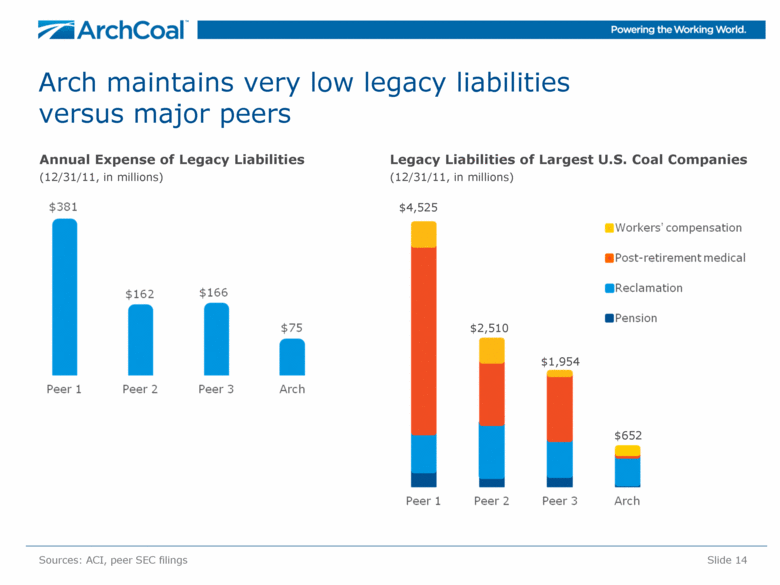
Arch maintains very low legacy liabilities versus major peers Slide 14 Sources: ACI, peer SEC filings Annual Expense of Legacy Liabilities (12/31/11, in millions) Legacy Liabilities of Largest U.S. Coal Companies (12/31/11, in millions) $4,525 $2,510 $1,954 $652 |
|
|
Outlook for Coal Markets |
|
|
Slide 16 Metallurgical coal markets represent a compelling long-term opportunity CURRENT GLOBAL MARKET Met markets are soft currently due to global macro uncertainty Global steel production declined month-over-month in June 2012 Utilization rates at U.S. steel mills have fallen below 75% Seaborne coal markets were slightly oversupplied by roughly 25 million tonnes in 1H12 Sources: World Steel Association, Wood Mackenzie, ACI and other public sources LONG-TERM GLOBAL MARKET World steel consumption is projected to increase +50% by 2020 World population to top 8 billion by 2030 — with substantial growth in the middle class China and India are expected to import 1.5 billion tonnes by 2030 Long-term met market strength driven by demand growth — and supply constraints |

|
|
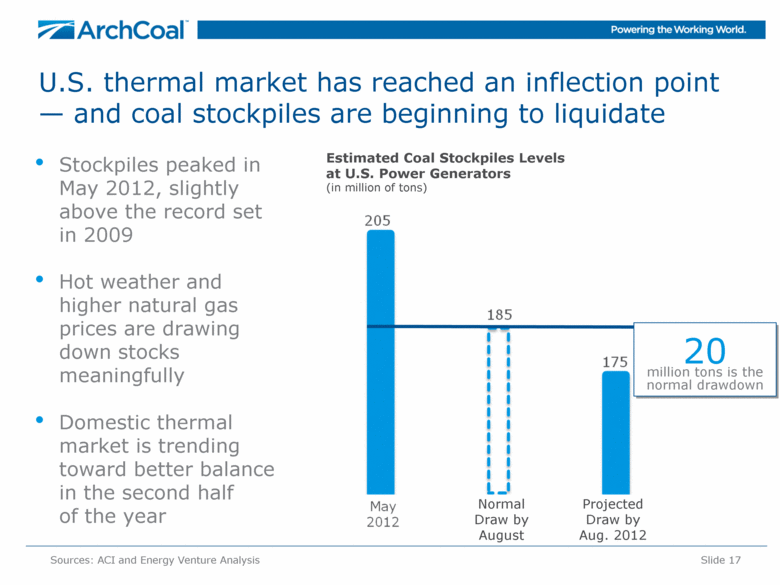
Slide 17 U.S. thermal market has reached an inflection point — and coal stockpiles are beginning to liquidate Sources: ACI and Energy Venture Analysis Estimated Coal Stockpiles Levels at U.S. Power Generators (in million of tons) Stockpiles peaked in May 2012, slightly above the record set in 2009 Hot weather and higher natural gas prices are drawing down stocks meaningfully Domestic thermal market is trending toward better balance in the second half of the year Normal Draw by August Projected Draw by Aug. 2012 20 million tons is the normal drawdown |
|
|
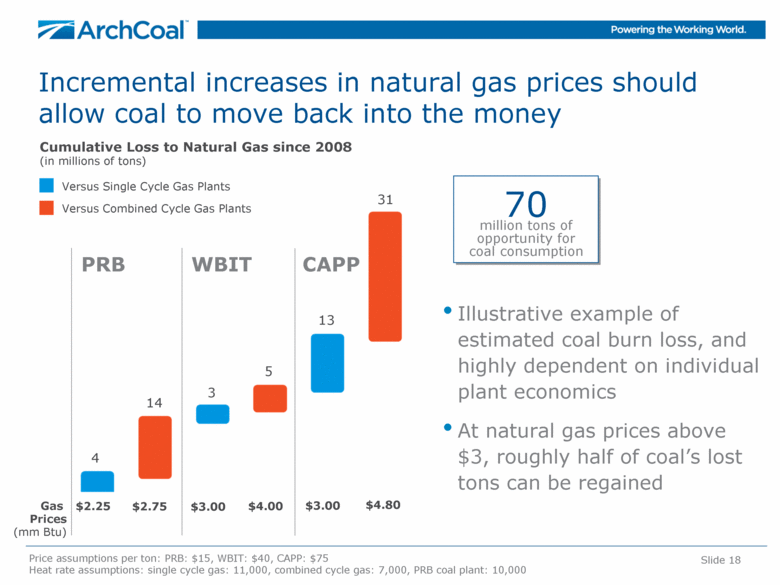
Slide 18 Incremental increases in natural gas prices should allow coal to move back into the money Cumulative Loss to Natural Gas since 2008 (in millions of tons) 4 14 3 5 13 31 70 million tons of opportunity for coal consumption PRB WBIT CAPP Versus Single Cycle Gas Plants Versus Combined Cycle Gas Plants Gas Prices (mm Btu) $2.25 $2.75 $3.00 $4.00 $3.00 $4.80 Illustrative example of estimated coal burn loss, and highly dependent on individual plant economics At natural gas prices above $3, roughly half of coal’s lost tons can be regained Price assumptions per ton: PRB: $15, WBIT: $40, CAPP: $75 Heat rate assumptions: single cycle gas: 11,000, combined cycle gas: 7,000, PRB coal plant: 10,000 |
|
|
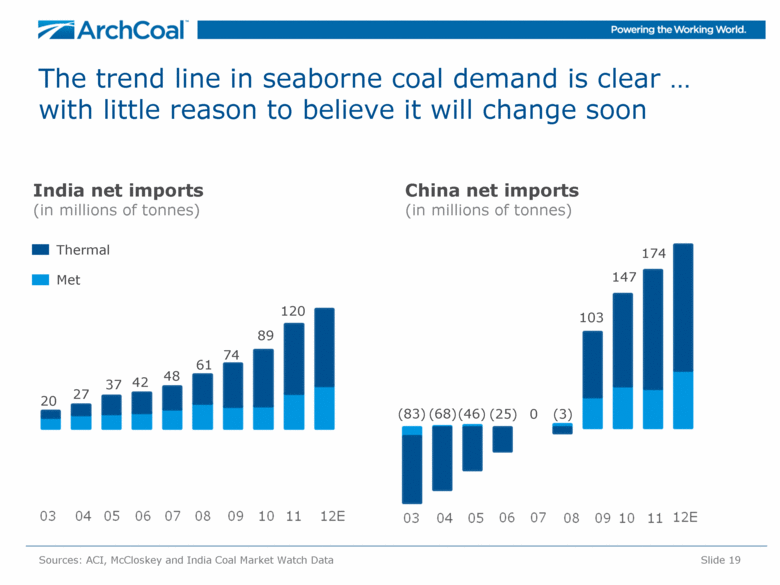
Slide 19 The trend line in seaborne coal demand is clear with little reason to believe it will change soon Sources: ACI, McCloskey and India Coal Market Watch Data China net imports (in millions of tonnes) India net imports (in millions of tonnes) 37 42 48 61 74 89 120 (46) (25) 0 (3) 103 147 174 27 20 (68) (83) Thermal Met |
|
|
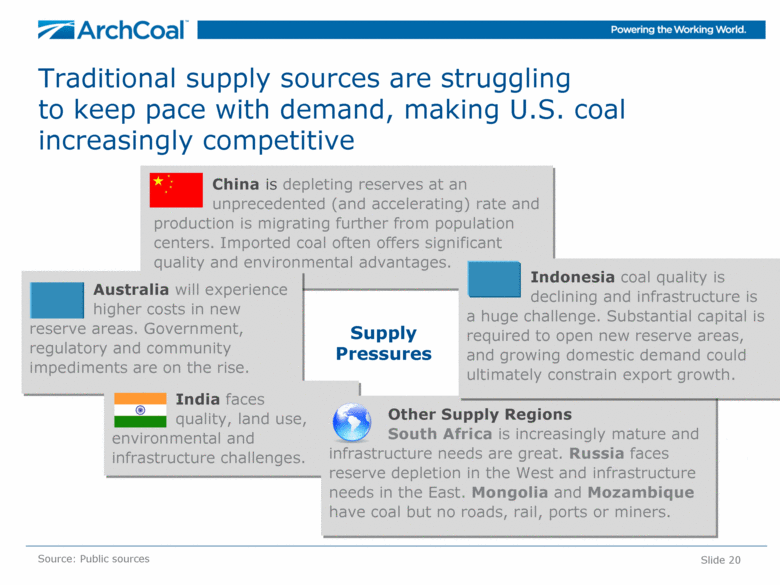
China is depleting reserves at an unprecedented (and accelerating) rate and production is migrating further from population centers. Imported coal often offers significant quality and environmental advantages. Australia will experience higher costs in new reserve areas. Government, regulatory and community impediments are on the rise. Supply Pressures Traditional supply sources are struggling to keep pace with demand, making U.S. coal increasingly competitive Slide 20 Source: Public sources India faces quality, land use, environmental and infrastructure challenges. Other Supply Regions South Africa is increasingly mature and infrastructure needs are great. Russia faces reserve depletion in the West and infrastructure needs in the East. Mongolia and Mozambique have coal but no roads, rail, ports or miners. Indonesia coal quality is declining and infrastructure is a huge challenge. Substantial capital is required to open new reserve areas, and growing domestic demand could ultimately constrain export growth. |
|
|
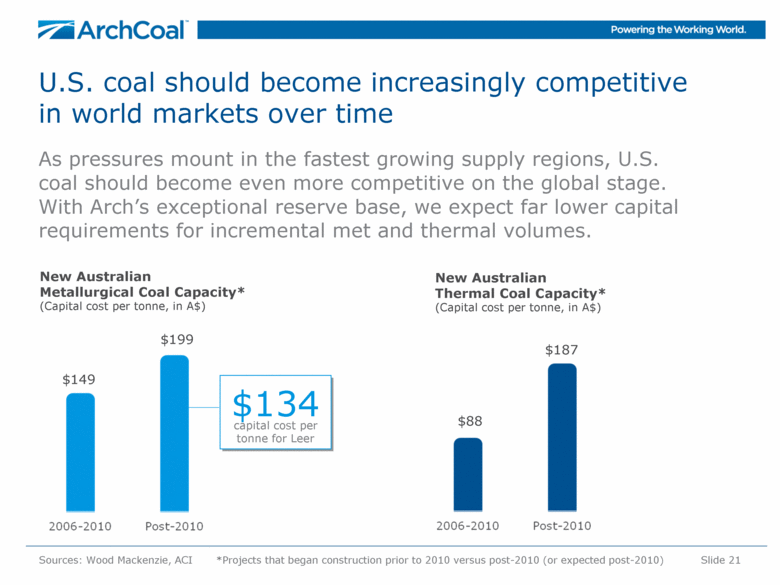
Slide 21 As pressures mount in the fastest growing supply regions, U.S. coal should become even more competitive on the global stage. With Arch’s exceptional reserve base, we expect far lower capital requirements for incremental met and thermal volumes. New Australian Metallurgical Coal Capacity* (Capital cost per tonne, in A$) Sources: Wood Mackenzie, ACI *Projects that began construction prior to 2010 versus post-2010 (or expected post-2010) U.S. coal should become increasingly competitive in world markets over time $149 $199 New Australian Thermal Coal Capacity* (Capital cost per tonne, in A$) $88 $187 $134 capital cost per tonne for Leer |
|
|
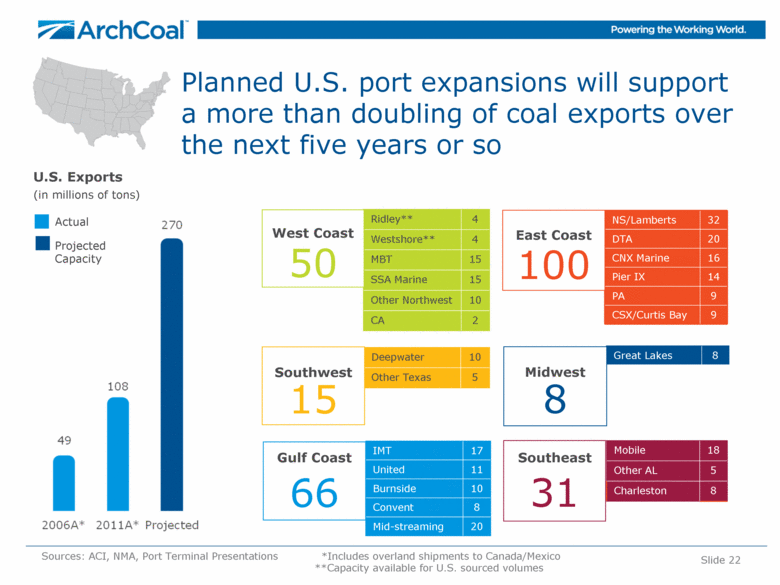
Planned U.S. port expansions will support a more than doubling of coal exports over the next five years or so NS/Lamberts 32 DTA 20 CNX Marine 16 Pier IX 14 PA 9 CSX/Curtis Bay 9 Ridley** 4 Westshore** 4 MBT 15 SSA Marine 15 Other Northwest 10 CA 2 Mobile 18 Other AL 5 Charleston 8 U.S. Exports (in millions of tons) Sources: ACI, NMA, Port Terminal Presentations *Includes overland shipments to Canada/Mexico **Capacity available for U.S. sourced volumes Slide 22 Deepwater 10 Other Texas 5 IMT 17 United 11 Burnside 10 Convent 8 Mid-streaming 20 Great Lakes 8 West Coast 50 Southwest 15 Gulf Coast 66 East Coast 100 Midwest 8 Southeast 31 Actual Projected Capacity |
|
|
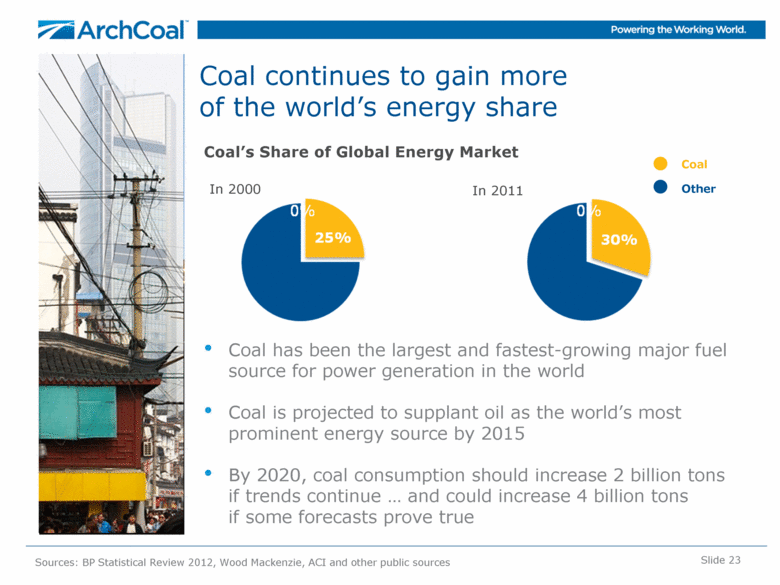
Coal continues to gain more of the world’s energy share Slide 23 Coal’s Share of Global Energy Market In 2000 Coal Other In 2011 Coal has been the largest and fastest-growing major fuel source for power generation in the world Coal is projected to supplant oil as the world’s most prominent energy source by 2015 By 2020, coal consumption should increase 2 billion tons if trends continue and could increase 4 billion tons if some forecasts prove true Sources: BP Statistical Review 2012, Wood Mackenzie, ACI and other public sources |
|
|
Arch Coal, Inc. Investor Presentation August 2012 |