Attached files
| file | filename |
|---|---|
| 8-K - FORM 8-K - POWERSECURE INTERNATIONAL, INC. | d390423d8k.htm |
Exhibit 99.1

PowerSecure Reports Second Quarter Results
Strong Revenue Growth and Gross Margin Increase Drive Profit Gain, Backlog
Reaches Record $166 Million
Wake Forest, N.C. – August 6, 2012 – PowerSecure International, Inc. (Nasdaq: POWR) today reported its second quarter 2012 results, including strong second quarter revenues of $37.9 million, gross margin of 32.2 percent, diluted earnings per share (“E.P.S.”) from continuing operations of $0.09, and Non-GAAP E.P.S. from continuing operations of $0.03. This compares to second quarter 2011 revenues of $30.1 million, gross margin of 30.9%, diluted E.P.S. from continuing operations of $0.97, and Non-GAAP loss from continuing operations of ($0.03) per share. Non-GAAP per share amounts for both periods exclude income and gains related to the sale of the Company’s WaterSecure investment (see Non-GAAP discussion and reconciliation, below).
Sidney Hinton, CEO of PowerSecure, said, “We are having a terrific 2012. Each of our product and service areas is showing strong growth, driving our profit increases, and our backlog is a record $166 million. Additionally, our gross margins increased 3.4 percentage points sequentially, and 1.3 percentage points over last year. We are in great position for the second half of 2012 and 2013.” Mr. Hinton continued, “We continue to be very focused on translating our top-line success to bottom-line E.P.S. results, and leveraging the incremental operating expenses we have invested in to drive our business forward. I am pleased to report that in our second quarter our operating expenses decreased 2.5 percentage points as a percentage of revenue.”
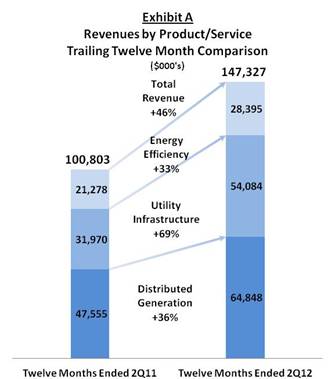
Each of the Company’s product and service lines have grown significantly in size and scale over the last several quarters, driven by an expansion of its utility partners, a growing customer base, and a growing portfolio of product offerings and service capabilities. Exhibit A illustrates the increased scale achieved in each of the Company’s product and service lines, comparing trailing twelve month revenue for the period ended June 30, 2012, which totaled $147.3 million, to the period ended June 30, 2011, which totaled $100.8 million, a 46% increase.
The Company’s strong second quarter 2012 year-over-year revenue growth of 26%, to $37.9 million, was driven by a 27% increase in Distributed Generation products and services, a 12% increase in Utility Infrastructure products and services, and a 51% increase in Energy Efficiency products, as shown below.
| Variance | ||||||||||||||||
| ($ in 000’s) | 2Q12 | 2Q11 | $ | % | ||||||||||||
| Revenue by Product/Service |
||||||||||||||||
| Distributed Generation |
16,139 | 12,725 | 3,414 | 27 | % | |||||||||||
| Utility Infrastructure |
12,912 | 11,510 | 1,402 | 12 | % | |||||||||||
| Energy Efficiency |
8,816 | 5,851 | 2,965 | 51 | % | |||||||||||
|
|
|
|
|
|
|
|
|
|||||||||
| Total Revenue |
37,867 | 30,086 | 7,781 | 26 | % | |||||||||||
The Company’s second quarter 2012 gross margin as a percentage of revenue was 32.2% compared to 30.9% in the second quarter of 2011. The gross margin increase was driven by favorabilities in the mix of projects completed in 2012 compared to 2011, a higher percentage of revenues from the Company’s higher margin Distributed Generation and Energy Efficiency product areas, and higher revenues from the Company’s higher margin company-owned distributed generation recurring revenue projects.
Operating expenses for the second quarter of 2012 were $11.6 million compared to $10.0 million in the second quarter of 2011. As a percentage of revenue, operating expenses decreased 2.5 percentage points on a year-over-year basis. The Company’s operating expenses included $0.3 million of costs from its acquisition of a distributed solar energy company during the second quarter of 2012.
The Company’s capital resources continue to be strong, with $23.7 million in cash and zero drawn on its revolving credit facility at the end of the second quarter of 2012. The Company’s capital expenditures during the second quarter were $2.5 million in total, with $1.9 million of this capital invested to deploy systems to support PowerSecure-owned long-term recurring revenue Distributed Generation projects.
The Company announced that its revenue backlog stands at $166 million. This includes new business awards announced on July 24, 2012 and August 1, 2012. It also includes revenue from projects assumed in conjunction with its acquisition of a distributed solar energy company during the second quarter of 2012. The Company’s revenue backlog represents revenue expected to be recognized after June 30, 2012, for periods including the third quarter of 2012 onward. This backlog figure compares to the revenue backlog of $151 million announced in the Company’s first quarter earnings release issued on May 3, 2012, which represented revenue expected to be recognized after March 31, 2012. The Company’s $166 million revenue backlog and the estimated timing of revenue recognition are outlined below, including “project-based revenues” expected to be recognized as projects are completed, and “recurring revenues” expected to be recognized over the life of the underlying contracts:
Revenue Backlog expected to be recognized after June 30, 2012
| Anticipated | Estimated Primary | |||||
| Description |
Revenue | Recognition Period | ||||
| Project-based Revenue—Near term |
$ | 78 Million | 3Q12 through 1Q13 | |||
| Project-based Revenue—Long term |
$ | 18 Million | 2Q13 through 2014 | |||
| Recurring Revenue |
$ | 71 Million | 3Q12 through 2020 | |||
|
|
|
|||||
| Revenue Backlog expected to be recognized after June 30, 2012 |
$ | 166 Million | ||||
Note: Anticipated revenue and estimated primary recognition periods are subject to risks and uncertanities as indicated in the Company’s safe harbor statement, below. Consistent with past practice, these figures are not intended to constitute the Company’s total revenue over the indicated time periods, as the Company has additional, regular on-going revenues. Examples of additional, regular recurring revenues include revenues from the engineering fees, and service revenue, among others. Numbers may not add due to rounding.
Orders in the Company’s revenue backlog are subject to delay, deferral, acceleration, resizing, or cancellation from time to time, and estimates are utilized in the determination of the backlog amounts. Given the irregular sales cycle of customer orders, and especially of large orders, the revenue backlog at any given time is not necessarily an accurate indication of our future revenues.
The Company’s results include gains on the June, 2011 sale of its WaterSecure investment recorded in both the second quarter of 2011 of $21.8 million, and the second quarter of 2012 of $1.4 million. The gain recorded during the second quarter of 2012 relates to $1.4 million of contingent sale proceeds that were released from escrow to the Company during that period. The Company’s results also include discontinued operations comprised of the Company’s former Southern Flow unit, which was sold during the first quarter of 2011 and for which a $5.6 million gain on sale was recorded in that period, and the Company’s discontinued PowerPackages unit, which was exited during the second half of 2011. The results of these discontinued operations were negligible during the second quarter of 2012. However, these discontinued operations negatively impacted the second quarter of 2011 by ($1.4) million of after-tax income, or ($0.07) of E.P.S. The Company’s acquisition of a solar distributed energy company during the second quarter of 2012 also negatively impacted E.P.S. by ($0.01) per share.
The Company will host a conference call commencing today at 5:30 p.m. eastern time to discuss its second quarter 2012 results, business operations, strategic initiatives and prospects for the future. The conference call will be webcast live and can be accessed from the Investor Relations section of the Company’s website at www.powersecure.com. Participants can also access the call by dialing 888-680-0878 (or 617-213-4855 if dialing internationally), and providing pass code 82974295. If you are unable to participate during the live webcast, a replay of the conference call will be available beginning today at 7:30 p.m. eastern time through midnight on September 3, 2012. To listen to the replay, dial toll-free 888-286-8010 (or 617-801-6888 if dialing internationally), and enter pass code 16153149. In addition, the webcast will be archived on the Company’s website at www.powersecure.com.
About PowerSecure
PowerSecure International, Inc. is a leading provider of Utility and Energy Technologies to electric utilities, and their industrial, institutional, and commercial customers. PowerSecure provides products and services in the areas of Energy Efficiency, Interactive Distributed Generation, and Utility Infrastructure. The Company is a pioneer in developing Interactive Distributed Generation® (IDG®) power systems with sophisticated smart grid capabilities, including the ability to 1) forecast electricity demand and electronically deploy the systems to deliver more efficient, and environmentally friendly power at peak power times, 2) provide utilities with dedicated electric power generation capacity to utilize for demand response purposes, and 3) provide customers with the most dependable standby power in the industry. Its proprietary distributed generation system designs utilize a range of technologies to deliver power, including renewables. The Company’s Energy Efficiency business develops energy efficient lighting technologies that improve the quality of light, including its proprietary EfficientLights® LED lighting products for grocery, drug, and convenience stores, and its SecureLite and PowerLite street lights for utilities and municipalities. PowerSecure also provides electric utilities with transmission and distribution infrastructure maintenance and construction services, and engineering and regulatory consulting services. Additional information is available at www.powersecure.com.
This press release contains forward-looking statements within the meaning of and made pursuant to the safe harbor provisions of the Private Securities Litigation Reform Act of 1995. Forward-looking statements are all statements other than statements of historical facts, including but not limited to statements concerning the outlook for the Company’s future revenues, earnings, margins, cash resources and cash flow and other financial and operating information and data; the Company’s future business operations, strategies and prospects; and all other statements concerning the plans, intentions, expectations, projections, hopes, beliefs, objectives, goals and strategies of management, including statements about other future financial and non-financial items, performance or events and about present and future products, services, technologies and businesses; and statements of assumptions underlying the foregoing. Forward-looking statements are not guarantees of future performance or events and are subject to a number of known and unknown risks, uncertainties and other factors that could cause actual results to differ materially from those expressed, projected or implied by such forward-looking statements. Important risks, uncertainties and other factors include, but are not limited to, the on-going downturn, disruption and volatility in the economy, financial markets and business markets and the effects thereof on the Company’s markets and customers, the demand for its products and services, and the Company’s access to capital; the size, timing and terms of sales and orders, including the Company’s revenue backlog discussed in this press release, and the risk of customers delaying, deferring or canceling purchase orders or making smaller purchases than expected; the effects of the sale of Southern Flow business and WaterSecure investment and the Company’s strategy of monetizing its non-core businesses on the Company’s financial condition and results of operations; the potential adverse financial and reputational consequences that can result from safety risks and hazards such as accidents inherent in our operations; the effects of exiting the Company’s PowerPackages business, including any future charges we may incur; the timely and successful development, production and market acceptance of new and enhanced products, services and technologies of the Company; the ability of the Company to obtain adequate supplies of key components and materials of sufficient reliability and quality for its products and technologies on a timely and cost-effective basis and the effects of related warranty claims and disputes; the ability of the Company to successfully expand its core distributed generation products and services, to successfully develop and achieve market acceptance of its new energy-related businesses, to successfully expand its recurring revenue projects, to manage its growth and to address the effects of any future changes in utility tariff structures and environmental requirements on its business solutions; the effects of competition; changes in customer and industry demand and preferences; the ability of the Company to continue the growth and diversification of its customer base; the ability of the Company to attract, retain, and motivate its executives and key personnel; changes in the energy industry in general and the electricity, oil, and natural gas markets in particular, including price levels; the effects of competition; the ability of the Company to secure and maintain key contracts and relationships; the effects of pending and future litigation, claims and disputes; and other risks, uncertainties and other factors identified from time to time in its reports filed with or furnished to the Securities and Exchange Commission, including the Company’s most recent Annual Report on Form 10-K, as well as subsequently filed reports on Form 10-Q and Form 8-K. Accordingly, there can be no assurance that the results expressed, projected or implied by any forward-looking statements will be achieved, and readers are cautioned not to place undue reliance on any forward-looking statements. The forward-looking statements in this press release speak only as of the date hereof and are based on the current plans, goals, objectives, strategies, intentions, expectations and assumptions of, and the information currently available to, management. The Company assumes no duty or obligation to update or revise any forward-looking statements for any reason, whether as the result of changes in expectations, new information, future events, conditions or circumstances or otherwise.
Contact
Chris Hutter
Chief Financial Officer
PowerSecure International, Inc.
(919) 453-1760
PowerSecure International, Inc.
Consolidated Statements of Operations (unaudited)
($000’s except per share data)
| Three Months Ended | Six Months Ended | |||||||||||||||
| June 30, | June 30, | June 30, | June 30, | |||||||||||||
| 2012 | 2011 | 2012 | 2011 | |||||||||||||
| Revenue |
37,867 | 30,086 | 71,052 | 53,741 | ||||||||||||
| Cost of sales |
25,663 | 20,780 | 49,293 | 36,706 | ||||||||||||
|
|
|
|
|
|
|
|
|
|||||||||
| Gross Profit |
12,204 | 9,306 | 21,759 | 17,035 | ||||||||||||
|
|
|
|
|
|
|
|
|
|||||||||
| Operating expenses |
||||||||||||||||
| General and administrative |
9,093 | 7,952 | 17,738 | 15,633 | ||||||||||||
| Selling, marketing, and service |
1,366 | 1,214 | 2,424 | 2,368 | ||||||||||||
| Depreciation and amortization |
1,136 | 802 | 2,221 | 1,575 | ||||||||||||
|
|
|
|
|
|
|
|
|
|||||||||
| Total operating expenses |
11,595 | 9,968 | 22,383 | 19,576 | ||||||||||||
|
|
|
|
|
|
|
|
|
|||||||||
| Operating income (loss) |
609 | (662 | ) | (624 | ) | (2,541 | ) | |||||||||
| Other income (expense) |
||||||||||||||||
| Gain on sale of unconsolidated affiliate |
1,439 | 21,786 | 1,439 | 21,786 | ||||||||||||
| Equity income—unconsolidated affiliate |
0 | 548 | 0 | 1,559 | ||||||||||||
| Management fees—unconsolidated affiliate |
0 | 114 | 0 | 282 | ||||||||||||
| Interest income and other income |
23 | 22 | 45 | 42 | ||||||||||||
| Interest expense |
(116 | ) | (144 | ) | (224 | ) | (286 | ) | ||||||||
|
|
|
|
|
|
|
|
|
|||||||||
| Income (loss) before income taxes |
1,955 | 21,664 | 636 | 20,842 | ||||||||||||
| Income tax benefit (provision) |
(621 | ) | (3,183 | ) | (228 | ) | (3,230 | ) | ||||||||
|
|
|
|
|
|
|
|
|
|||||||||
| Net income (loss) from continuing operations |
1,334 | 18,481 | 408 | 17,612 | ||||||||||||
| Discontinued operations—income (loss) from operations (net of tax) |
32 | (1,388 | ) | 67 | (1,603 | ) | ||||||||||
| Discontinued operations—gain on sale (net of tax) |
0 | 0 | 0 | 5,636 | ||||||||||||
|
|
|
|
|
|
|
|
|
|||||||||
| Net income (loss) |
1,366 | 17,093 | 475 | 21,645 | ||||||||||||
| Net loss attributable to noncontrolling interest |
277 | 159 | 565 | 343 | ||||||||||||
|
|
|
|
|
|
|
|
|
|||||||||
| Net income (loss) attributable to PowerSecure International, Inc. |
1,643 | 17,252 | 1,040 | 21,988 | ||||||||||||
|
|
|
|
|
|
|
|
|
|||||||||
| Summary of Amounts Attributable to PowerSecure International, Inc. shareholders |
||||||||||||||||
| Income (loss) from continuing operations (net of tax) |
1,611 | 18,640 | 973 | 17,955 | ||||||||||||
| Income (loss) from discontinued operations (net of tax) |
32 | (1,388 | ) | 67 | 4,033 | |||||||||||
|
|
|
|
|
|
|
|
|
|||||||||
| Net income (loss) attributable to PowerSecure International, Inc. |
1,643 | 17,252 | 1,040 | 21,988 | ||||||||||||
|
|
|
|
|
|
|
|
|
|||||||||
| EARNINGS PER SHARE AMOUNTS (“E.P.S”) ATTRIBUTABLE TO POWERSECURE INTERNATIONAL, INC. SHAREHOLDERS: |
||||||||||||||||
| Continuing Operations |
||||||||||||||||
| Basic |
0.09 | 0.98 | 0.05 | 0.96 | ||||||||||||
|
|
|
|
|
|
|
|
|
|||||||||
| Diluted |
0.09 | 0.97 | 0.05 | 0.94 | ||||||||||||
|
|
|
|
|
|
|
|
|
|||||||||
| Discontinued Operations |
||||||||||||||||
| Basic |
0.00 | (0.07 | ) | 0.01 | 0.21 | |||||||||||
|
|
|
|
|
|
|
|
|
|||||||||
| Diluted |
0.00 | (0.07 | ) | 0.00 | 0.21 | |||||||||||
|
|
|
|
|
|
|
|
|
|||||||||
| Net Income |
||||||||||||||||
| Basic |
0.09 | 0.91 | 0.06 | 1.17 | ||||||||||||
|
|
|
|
|
|
|
|
|
|||||||||
| Diluted |
0.09 | 0.90 | 0.05 | 1.15 | ||||||||||||
|
|
|
|
|
|
|
|
|
|||||||||
| WEIGHTED AVERAGE COMMON SHARES OUTSTANDING |
||||||||||||||||
| Basic |
18,846 | 18,857 | 18,874 | 18,788 | ||||||||||||
|
|
|
|
|
|
|
|
|
|||||||||
| Diluted |
18,941 | 19,146 | 19,015 | 19,113 | ||||||||||||
|
|
|
|
|
|
|
|
|
|||||||||
PowerSecure International, Inc.
Condensed Consolidated Balance Sheets (unaudited)
($000’s)
| June 30, 2012 |
December 31, 2011 |
|||||||
| ASSETS |
||||||||
| CURRENT ASSETS: |
||||||||
| Cash and cash equivalents |
23,707 | 24,606 | ||||||
| Trade receivables, net of allowance for doubtful accounts |
43,124 | 46,163 | ||||||
| Assets of discontinued operations held for sale |
190 | 380 | ||||||
| Inventories |
19,530 | 20,290 | ||||||
| Income taxes receivable |
230 | 439 | ||||||
| Current deferred income taxes |
650 | 650 | ||||||
| Prepaid expenses and other current assets |
920 | 1,128 | ||||||
|
|
|
|
|
|||||
| Total Current Assets |
88,351 | 93,656 | ||||||
|
|
|
|
|
|||||
| PROPERTY, PLANT, AND EQUIPMENT: |
||||||||
| Equipment |
41,589 | 38,441 | ||||||
| Furniture and fixtures |
338 | 283 | ||||||
| Land, building, and improvements |
5,901 | 5,885 | ||||||
|
|
|
|
|
|||||
| Total property, plant, and equipment at cost |
47,828 | 44,609 | ||||||
| Less accumulated depreciation and amortization |
10,048 | 8,281 | ||||||
|
|
|
|
|
|||||
| Property, plant, and equipment, net |
37,780 | 36,328 | ||||||
|
|
|
|
|
|||||
| OTHER ASSETS: |
||||||||
| Goodwill |
12,884 | 7,970 | ||||||
| Deferred income taxes, net of current portion |
266 | 266 | ||||||
| Restricted annuity contract |
2,412 | 2,376 | ||||||
| Intangible rights and capitalized software, net of accum amort |
1,552 | 1,642 | ||||||
| Investment in unconsolidated affiliate |
0 | 6 | ||||||
| Other assets |
739 | 331 | ||||||
|
|
|
|
|
|||||
| Total other assets |
17,853 | 12,591 | ||||||
|
|
|
|
|
|||||
| TOTAL ASSETS |
143,984 | 142,575 | ||||||
|
|
|
|
|
|||||
| LIABILITIES AND STOCKHOLDERS’ EQUITY |
||||||||
| CURRENT LIABILITIES |
||||||||
| Accounts payable |
7,193 | 6,894 | ||||||
| Accrued and other liabilities |
14,861 | 16,129 | ||||||
| Liabilities of discontinued operations held for sale |
0 | 125 | ||||||
| Current unrecognized tax benefit |
287 | 287 | ||||||
| Current portion of term loan |
160 | 0 | ||||||
| Current portion of capital lease obligations |
863 | 840 | ||||||
|
|
|
|
|
|||||
| Total current liabilitees |
23,364 | 24,275 | ||||||
|
|
|
|
|
|||||
| LONG-TERM LIABILITIES |
||||||||
| Revolving Line of Credit |
0 | 0 | ||||||
| Term loan, net of current portion |
2,160 | 0 | ||||||
| Capital lease obligations, net of current portion |
2,370 | 2,807 | ||||||
| Unrecognized tax benefit |
731 | 731 | ||||||
| Other long-term liabilities |
2,409 | 2,300 | ||||||
|
|
|
|
|
|||||
| Total long-term liabilities |
7,670 | 5,838 | ||||||
|
|
|
|
|
|||||
| STOCKHOLDERS’ EQUITY |
||||||||
| Perferred stock—undesignated |
0 | 0 | ||||||
| Preferred stock—Series C |
0 | 0 | ||||||
| Common stock |
188 | 189 | ||||||
| Additional paid-in-capital |
116,384 | 116,803 | ||||||
| Accumulated deficit |
(4,399 | ) | (5,439 | ) | ||||
|
|
|
|
|
|||||
| Total PowerSecure International, Inc. stockholders’ equity |
112,173 | 111,553 | ||||||
| Noncontrolling Interest |
777 | 909 | ||||||
|
|
|
|
|
|||||
| Total stockholders’ equity |
112,950 | 112,462 | ||||||
|
|
|
|
|
|||||
| TOTAL LIABILITIES AND STOCKHOLDERS’ EQUITY |
143,984 | 142,575 | ||||||
|
|
|
|
|
|||||
PowerSecure International, Inc.
Condensed Consolidated Statement of Cash Flows (unaudited)
($000’s)
| Six Months Ended | ||||||||
| June 30, 2012 |
June 30, 2011 |
|||||||
| CASH FLOWS FROM OPERATING ACTIVITIES: |
||||||||
| Net income (loss) |
475 | 21,645 | ||||||
| Adjustments to reconcile net income (loss) to net cash provided by (used in) operating activities: |
||||||||
| Gain on sale of unconsolidated affiliate |
(1,439 | ) | (21,786 | ) | ||||
| Income from discontinued operations |
(67 | ) | (4,033 | ) | ||||
| Depreciation and amortization |
2,221 | 1,575 | ||||||
| Stock compensation expense |
576 | 926 | ||||||
| Loss on disposal of miscellaneous assets |
45 | 43 | ||||||
| Equity in income of unconsolidated affiliate |
0 | (1,559 | ) | |||||
| Distributions from unconsolidated affiliate |
0 | 607 | ||||||
| Changes in operating assets and liabilities, net of effect of acquisitons: |
||||||||
| Trade receivables, net |
4,360 | (12,580 | ) | |||||
| Inventories |
861 | (1,016 | ) | |||||
| Deferred income taxes |
0 | 1,154 | ||||||
| Other current assets and liabilities |
416 | 895 | ||||||
| Other noncurrent assets and liabilities |
(335 | ) | 1,132 | |||||
| Accounts payable |
(378 | ) | (1,099 | ) | ||||
| Accrued and other liabilities |
(3,067 | ) | 3,525 | |||||
|
|
|
|
|
|||||
| Net cash provided by (used in) continuing operations |
3,668 | (10,571 | ) | |||||
| Net cash provided by (used in) discontinued operations |
132 | (1,152 | ) | |||||
|
|
|
|
|
|||||
| Net cash provided by (used in) operating activities |
3,800 | (11,723 | ) | |||||
|
|
|
|
|
|||||
| CASH FLOWS FROM INVESTING ACTIVITIES: |
||||||||
| Acquisition |
(3,523 | ) | 0 | |||||
| Additions to property, plant and equipment |
(3,330 | ) | (9,037 | ) | ||||
| Additions to intangible rights and software development |
(215 | ) | (268 | ) | ||||
| Proceeds from sale of property, plant and equipment |
14 | 0 | ||||||
| Proceeds from sale of unconsolidated affiliate |
1,445 | 25,610 | ||||||
| Proceeds from sale of discontinued operations |
0 | 16,515 | ||||||
| Discontinued operations investing activities |
0 | (3 | ) | |||||
|
|
|
|
|
|||||
| Net cash provided by (used in) investing activities |
(5,609 | ) | 32,817 | |||||
|
|
|
|
|
|||||
| CASH FLOWS FROM FINANCING ACTIVITIES: |
||||||||
| Net borrowings (payments) on revolving line of credit |
0 | 5,000 | ||||||
| Proceeds from term loan borrowings |
2,400 | 0 | ||||||
| Proceeds from sale leaseback transactions |
0 | 2,097 | ||||||
| Payments on term loan |
(80 | ) | 0 | |||||
| Payments on capital lease obligations |
(414 | ) | (393 | ) | ||||
| Repurchases of common stock |
(1,010 | ) | (162 | ) | ||||
| Proceeds from stock option exercises |
14 | 310 | ||||||
|
|
|
|
|
|||||
| Net cash provided by (used in) financing activities |
910 | 6,852 | ||||||
|
|
|
|
|
|||||
| NET INCREASE (DECREASE) IN CASH AND CASH EQUIVALENTS |
(899 | ) | 27,946 | |||||
| CASH AND CASH EQUIVALENTS AT BEGINNING OF YEAR |
24,606 | 8,202 | ||||||
|
|
|
|
|
|||||
| CASH AND CASH EQUIVALENTS AT END OF PERIOD |
23,707 | 36,148 | ||||||
|
|
|
|
|
|||||
Non-GAAP Pro forma Financial Measures:
Our references to our second quarter 2012 and 2011 “Non-GAAP Pro forma” financial measures of net income from continuing operations, net income, net income attributable to PowerSecure International, Inc., diluted E.P.S. from continuing operations, diluted E.P.S. from discontinued operations, and diluted E.P.S. discussed and shown in this report constitute non-GAAP financial measures. They refer to our GAAP results, adjusted to show the results 1) without the after-tax income from our WaterSecure investment, including gains realized on its sale (identified in our financial statements as our unconsolidated affiliate), 2) without the after-tax results of our discontinued PowerPackages business.
We believe providing non-GAAP measures which show our pro forma results with these items adjusted is valuable and useful as it allows our management and our board of directors to measure, monitor and evaluate our operating performance with the same consistent financial context as the business was managed and evaluated from 2011 forward. Additionally, because our WaterSecure business was sold in June, 2011, and our PowerPackages business was discontinued in 2011, these pro forma measures provide baseline comparatives which are more comparable to our current and future results.
We believe these Non-GAAP Pro forma measures also provide meaningful information to investors in terms of enhancing their understanding of our 2012 operating performance and results, as they allow investors to more easily compare our financial performance on a consistent basis compared to 2011. These Non-GAAP Pro forma measures also correspond with the way we expect Wall Street analysts to compare our results. Our Non-GAAP Pro forma measures should be considered only as supplements to, and not as substitutes for or in isolation from, our other measures of financial information prepared in accordance with GAAP, such as GAAP revenue, operating income, net income from continuing operations, net income, net income attributable to PowerSecure International, Inc., diluted E.P.S. from continuing operations, diluted E.P.S. from discontinued operations, and diluted E.P.S.
PowerSecure International, Inc.
Non-GAAP Pro forma Measures Excluding WaterSecure and PowerPackages Results
($000’s except per share data, some rounding throughout)
| Three Months Ended June 30, 2012 | Three Months Ended June 30, 2011 | |||||||||||||||||||||||
| As Reported 2Q12 |
WaterSecure and PowerPackages |
Pro forma 2Q12 |
As Reported 2Q11 |
WaterSecure and PowerPackages |
Pro forma 2Q11 |
|||||||||||||||||||
| Revenue |
37,867 | 37,867 | 30,086 | 30,086 | ||||||||||||||||||||
| Cost of sales |
25,663 | 25,663 | 20,780 | 20,780 | ||||||||||||||||||||
|
|
|
|
|
|
|
|
|
|
|
|
|
|||||||||||||
| Gross Profit |
12,204 | 0 | 12,204 | 9,306 | 0 | 9,306 | ||||||||||||||||||
|
|
|
|
|
|
|
|
|
|
|
|
|
|||||||||||||
| Operating expenses |
||||||||||||||||||||||||
| General and administrative |
9,093 | 9,093 | 7,952 | 7,952 | ||||||||||||||||||||
| Selling, marketing, and service |
1,366 | 1,366 | 1,214 | 1,214 | ||||||||||||||||||||
| Depreciation and amortization |
1,136 | 1,136 | 802 | 802 | ||||||||||||||||||||
|
|
|
|
|
|
|
|
|
|
|
|
|
|||||||||||||
| Total operating expenses |
11,595 | 0 | 11,595 | 9,968 | 0 | 9,968 | ||||||||||||||||||
|
|
|
|
|
|
|
|
|
|
|
|
|
|||||||||||||
| Operating income (loss) |
609 | 0 | 609 | (662 | ) | 0 | (662 | ) | ||||||||||||||||
| Other income (expense) |
||||||||||||||||||||||||
| Gain on sale of unconsolidated affiliate |
1,439 | (1,439 | ) | 0 | 21,786 | (21,786 | ) | 0 | ||||||||||||||||
| Equity income—unconsolidated affiliate |
0 | 0 | 548 | (548 | ) | 0 | ||||||||||||||||||
| Management fees—unconsolidated affiliate |
0 | 0 | 114 | (114 | ) | 0 | ||||||||||||||||||
| Interest income and other income |
23 | 23 | 22 | 22 | ||||||||||||||||||||
| Interest expense |
(116 | ) | (116 | ) | (144 | ) | (144 | ) | ||||||||||||||||
|
|
|
|
|
|
|
|
|
|
|
|
|
|||||||||||||
| Income (loss) before income taxes |
1,955 | (1,439 | ) | 516 | 21,664 | (22,448 | ) | (784 | ) | |||||||||||||||
| Income tax benefit (provision) |
(621 | ) | 457 | (164 | ) | (3,183 | ) | 3,168 | (15 | ) | ||||||||||||||
|
|
|
|
|
|
|
|
|
|
|
|
|
|||||||||||||
| Net income (loss) from continuing operations |
1,334 | (982 | ) | 352 | 18,481 | (19,280 | ) | (799 | ) | |||||||||||||||
| Discontinued operations—income (loss) from operations (net of tax) |
32 | (32 | ) | 0 | (1,388 | ) | 1,388 | 0 | ||||||||||||||||
| Discontinued operations—gain on sale (net of tax) |
0 | 0 | 0 | 0 | 0 | 0 | ||||||||||||||||||
|
|
|
|
|
|
|
|
|
|
|
|
|
|||||||||||||
| Net income (loss) |
1,366 | (1,014 | ) | 352 | 17,093 | (17,892 | ) | (799 | ) | |||||||||||||||
| Net income (loss) attributable to noncontrolling interest |
277 | 277 | 159 | 159 | ||||||||||||||||||||
|
|
|
|
|
|
|
|
|
|
|
|
|
|||||||||||||
| Net income (loss) attributable to PowerSecure International, Inc. |
1,643 | (1,014 | ) | 629 | 17,252 | (17,892 | ) | (640 | ) | |||||||||||||||
|
|
|
|
|
|
|
|
|
|
|
|
|
|||||||||||||
| Summary of Amounts Attributable to PowerSecure International, Inc. shareholders |
||||||||||||||||||||||||
| Income (loss) from continuing operations (net of tax) |
1,611 | (982 | ) | 629 | 18,640 | (19,280 | ) | (640 | ) | |||||||||||||||
| Income (loss) from discontinued operations (net of tax) |
32 | (32 | ) | 0 | (1,388 | ) | 1,388 | 0 | ||||||||||||||||
|
|
|
|
|
|
|
|
|
|
|
|
|
|||||||||||||
| Net income (loss) attributable to PowerSecure International, Inc. |
1,643 | (1,014 | ) | 629 | 17,252 | (17,892 | ) | (640 | ) | |||||||||||||||
|
|
|
|
|
|
|
|
|
|
|
|
|
|||||||||||||
| EARNINGS PER SHARE AMOUNTS (“E.P.S”) ATTRIBUTABLE TO POWERSECURE INTERNATIONAL, INC. SHAREHOLDERS: |
||||||||||||||||||||||||
| Continuing Operations |
||||||||||||||||||||||||
| Basic |
0.09 | (0.05 | ) | 0.03 | 0.98 | (1.02 | ) | (0.03 | ) | |||||||||||||||
|
|
|
|
|
|
|
|
|
|
|
|
|
|||||||||||||
| Diluted |
0.09 | (0.05 | ) | 0.03 | 0.97 | (1.01 | ) | (0.03 | ) | |||||||||||||||
|
|
|
|
|
|
|
|
|
|
|
|
|
|||||||||||||
| Discontinued Operations |
||||||||||||||||||||||||
| Basic |
0.00 | 0.00 | 0.00 | (0.07 | ) | 0.07 | 0.00 | |||||||||||||||||
|
|
|
|
|
|
|
|
|
|
|
|
|
|||||||||||||
| Diluted |
0.00 | 0.00 | 0.00 | (0.07 | ) | 0.07 | 0.00 | |||||||||||||||||
|
|
|
|
|
|
|
|
|
|
|
|
|
|||||||||||||
| Net Income |
||||||||||||||||||||||||
| Basic |
0.09 | (0.05 | ) | 0.03 | 0.91 | (0.95 | ) | (0.03 | ) | |||||||||||||||
|
|
|
|
|
|
|
|
|
|
|
|
|
|||||||||||||
| Diluted |
0.09 | (0.05 | ) | 0.03 | 0.90 | (0.93 | ) | (0.03 | ) | |||||||||||||||
|
|
|
|
|
|
|
|
|
|
|
|
|
|||||||||||||
| WEIGHTED AVERAGE COMMON SHARES OUTSTANDING |
||||||||||||||||||||||||
| Basic |
18,846 | 18,846 | 18,846 | 18,857 | 18,857 | 18,857 | ||||||||||||||||||
|
|
|
|
|
|
|
|
|
|
|
|
|
|||||||||||||
| Diluted |
18,941 | 18,941 | 18,941 | 19,146 | 19,146 | 19,146 | ||||||||||||||||||
|
|
|
|
|
|
|
|
|
|
|
|
|
|||||||||||||
# # #