Attached files
| file | filename |
|---|---|
| 8-K - 8-K - CLOUD PEAK ENERGY INC. | a12-17530_18k.htm |
Exhibit 99.1
|
|
Investor Presentation August 2012 |
|
|
1 Cloud Peak Energy Inc. Financial Data Cloud Peak Energy Inc. is the sole owner of Cloud Peak Energy Resources LLC. Unless expressly stated otherwise in this presentation, all financial data included herein is consolidated financial data of Cloud Peak Energy Inc. Cautionary Note Regarding Forward-Looking Statements This presentation contains “forward-looking statements” within the meaning of the safe harbor provisions of Section 27A of the Securities Act of 1933 and Section 21E of the Securities Exchange Act of 1934. Forward-looking statements are not statements of historical facts, and often contain words such as “may,” “will,” “expect,” “believe,” “anticipate,” “plan,” “estimate,” “seek,” “could,” “should,” “intend,” “potential,” or words of similar meaning. Forward-looking statements are based on management’s current expectations, beliefs, assumptions and estimates regarding our company, industry, economic conditions, government regulations, energy policies and other factors. These statements are subject to significant risks, uncertainties and assumptions that are difficult to predict and could cause actual results to differ materially and adversely from those expressed or implied in the forward-looking statements. For a description of some of the risks and uncertainties that may adversely affect our future results, refer to the risk factors described from time to time in the reports and registration statements we file with the Securities and Exchange Commission, including those in Item 1A "Risk Factors" of our most recent Form 10-K and any updates thereto in our Forms 10-Q and current reports on Forms 8-K. There may be other risks and uncertainties that are not currently known to us or that we currently believe are not material. We make forward-looking statements based on currently available information, and we assume no obligation to, and expressly disclaim any obligation to, update or revise publicly any forward-looking statements made in our presentation, whether as a result of new information, future events or otherwise, except as required by law. Non-GAAP Financial Measures This presentation includes the non-GAAP financial measures of (1) Adjusted EBITDA and (2) Adjusted Earnings Per Share (“Adjusted EPS”). Adjusted EBITDA and Adjusted EPS are intended to provide additional information only and do not have any standard meaning prescribed by generally accepted accounting principles in the U.S., or GAAP. A quantitative reconciliation of historical net income or net income from continuing operations (as applicable) to Adjusted EBITDA and EPS (as defined below) to Adjusted EPS is found in the tables accompanying this presentation. EBITDA represents net income or net income from continuing operations (as applicable) before (1) interest income (expense) net, (2) income tax provision, (3) depreciation and depletion, (4) amortization, and (5) accretion. Adjusted EBITDA represents EBITDA as further adjusted to exclude specifically identified items that management believes do not directly reflect our core operations. The specifically identified items are the impacts, as applicable, of: (1) the Tax Receivable Agreement including tax impacts of our 2009 initial public offering and 2010 secondary offering, (2) adjustments for derivative financial instruments including unrealized mark-to-market amounts and cash settlements realized, and (3) our significant broker contract that expired in the first quarter of 2010. Because of the inherent uncertainty related to the items identified above, management does not believe it is able to provide a meaningful forecast of the comparable GAAP measures or a reconciliation to any forecasted GAAP measures. Adjusted EPS represents diluted earnings per common share attributable to controlling interest or diluted earnings per common share attributable to controlling interest from continuing operations (as applicable) (“EPS”), adjusted to exclude the estimated per share impact of the same specifically identified items used to calculate Adjusted EBITDA and described above, adjusted at the statutory tax rate of 36%. Adjusted EBITDA is an additional tool intended to assist our management in comparing our performance on a consistent basis for purposes of business decision-making by removing the impact of certain items that management believes do not directly reflect our core operations. Adjusted EBITDA is a metric intended to assist management in evaluating operating performance, comparing performance across periods, planning and forecasting future business operations and helping determine levels of operating and capital investments. Period-to-period comparisons of Adjusted EBITDA are intended to help our management identify and assess additional trends potentially impacting our company that may not be shown solely by period-to-period comparisons of net income or income from continuing operations. Adjusted EBITDA is also used as part of our incentive compensation program for our executive officers and others. We believe Adjusted EBITDA and Adjusted EPS are also useful to investors, analysts and other external users of our consolidated financial statements in evaluating our operating performance from period to period and comparing our performance to similar operating results of other relevant companies. Adjusted EBITDA allows investors to measure a company's operating performance without regard to items such as interest expense, taxes, depreciation and depletion, amortization and accretion and other specifically identified items that are not considered to directly reflect our core operations. Similarly, we believe our use of Adjusted EPS provides an appropriate measure to use in assessing our performance across periods given that this measure provides an adjustment for certain specifically identified significant items that are not considered to directly reflect our core operations, the magnitude of which may vary drastically from period to period and, thereby, have a disproportionate effect on the earnings per share reported for a given period. Our management recognizes that using Adjusted EBITDA and Adjusted EPS as performance measures has inherent limitations as compared to net income, income from continuing operations, EPS or other GAAP financial measures, as these non-GAAP measures exclude certain items, including items that are recurring in nature, which may be meaningful to investors. Adjusted EBITDA and Adjusted EPS should not be considered in isolation and do not purport to be alternatives to net income, income from continuing operations, EPS or other GAAP financial measures as a measure of our operating performance. Because not all companies use identical calculations, our presentations of Adjusted EBITDA and Adjusted EPS may not be comparable to other similarly titled measures of other companies. Moreover, our presentation of Adjusted EBITDA is different than EBITDA as defined in our debt financing agreements. |
|
|
2 Cloud Peak Energy Profile One of the largest U.S. coal producers 2011 coal shipments from company-operated mines of 95.6 million tons 2011 proven & probable reserves of 1.37 billion tons Only pure-play PRB coal company Extensive NPRB base for long-term growth opportunities Employs approximately 1,600 people NYSE: CLD (7/31/12) $16.55 Market Capitalization (7/31/12) ~$1.0 billion Total Available Liquidity (6/30/12) $722 million 2011 Revenue $1.6 billion Senior Debt (B1/BB-) (6/30/12) $600 million Market and Financial Overview Company Overview |
|
|
3 Low-Risk Surface Operations Highly productive, non-unionized workforce at all company-operated mines Proportionately low, long-term operational liabilities Surface mining reduces liabilities and allows for high-quality reclamation Strong environmental compliance programs and ISO-14001 certified |

|
|
4 Top Coal Producing Companies - 2011 Incident Rates (MSHA) Source: MSHA. Note: Total Incident Rate = (total number of employee incidents x 200,000) / total man-hours. Good Safety Record Indicates Well-Run Operations A portion of all employees’ bonuses is tied to safety |
|
|
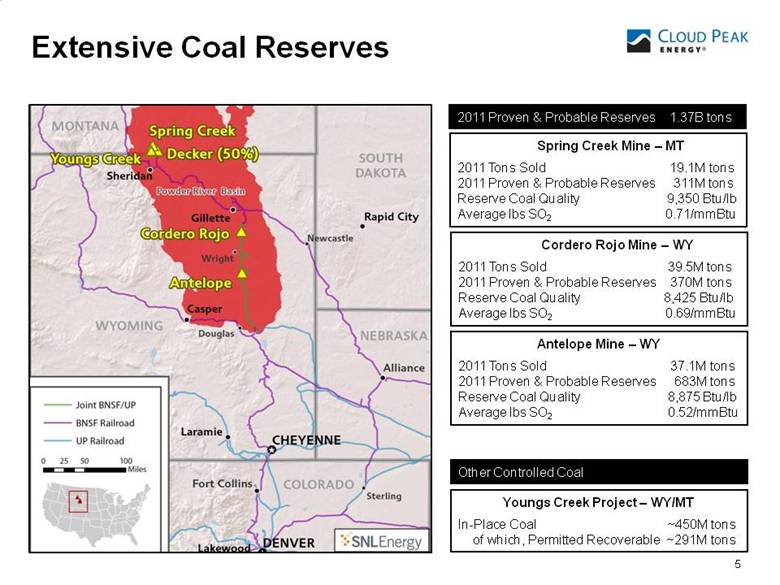
Extensive Coal Reserves 5 Spring Creek Mine – MT 2011 Tons Sold 19.1M tons 2011 Proven & Probable Reserves 311M tons Reserve Coal Quality 9,350 Btu/lb Average lbs SO2 0.71/mmBtu Antelope Mine – WY 2011 Tons Sold 37.1M tons 2011 Proven & Probable Reserves 683M tons Reserve Coal Quality 8,875 Btu/lb Average lbs SO2 0.52/mmBtu Cordero Rojo Mine – WY 2011 Tons Sold 39.5M tons 2011 Proven & Probable Reserves 370M tons Reserve Coal Quality 8,425 Btu/lb Average lbs SO2 0.69/mmBtu 2011 Proven & Probable Reserves 1.37B tons Youngs Creek Project – WY/MT In-Place Coal ~450M tons of which, Permitted Recoverable ~291M tons Other Controlled Coal |
|
|
6 Strategy for Growth Focus on operational/financial performance Disciplined approach to capital expenditures Generating liquidity for growth opportunities Optimize demand for low-sulfur, pure-play PRB reserves Build from Existing Foundation Optimize Development Opportunities Business Development Evaluate numerous options to develop NPRB projects Support low sodium domestic demand Support potential for expanded export demand Target acquisitions building on core operational strengths Aim to increase higher-margin export exposure Develop opportunities through acquisition of reserves, operations or companies Maximize Exports Leverage NPRB’s advantageous location and coal quality Optimize export logistics (rails and ports) Expand other port options (Northwest, Great Lakes, Gulf Coast, etc.) Have established in-country Korean representative to build our export opportunities |
|
|
First Half 2012 Highlights 7 (1) Reconciliation tables for Adjusted EBITDA are included in the Appendix. Acquired approximately 450 million tons of in-place coal and 38,800 acres of surface land in Northern Powder River Basin (NPRB) Adjusted EBITDA(1) of $141 million down from $171 million for the first six months of 2011 Asian exports of 2.0 million tons – estimate 4.3 million tons for FY 2012 Generated $81 million in cash from operations – total liquidity of $722 million Implemented an oil hedging program for 75% of expected diesel usage through March 2013 |

|
|
Consistent Financial Performance 8 (1) Reconciliation tables for Adjusted EBITDA are included in the Appendix Adjusted EBITDA (1) Resilient Profitability Shipments from Company-Operated Mines Growth Through Exports |
|
|
Challenging External Environment 9 2011/12 fourth warmest winter on record for contiguous U.S. Mild winter resulted in: low electric demand for heating low demand for gas-powered heating Low natural gas prices and coal prices Sluggish U.S. and world economy Coal inventories at generating utilities at record levels Excess supply entering international markets creating weakness We are starting to see signs of improvement – Improving July shipments Hot start to summer Natural gas prices coming off 10-year lows Falling coal inventories |
|
|
Successfully Managing Costs Without Compromising Equipment or Operations 10 Minimize use of high-cost contractors Schedule and plan labor diligently Overtime management Minimize holiday rosters Increase capital scrutiny Antelope Mine dragline pit optimization Fuel reduction project Defer equipment purchase due to focused maintenance programs extending equipment lines Innovative asset management Developed silo wash at Antelope Mine – $1.2 million savings |
|
|
11 Strong Forward Sales Position (tons in millions) (1) Production from company-operated mines. 2012 has 90.5 million tons committed at weighted-average price of $13.34/ton 2013 has 68.6 million tons committed at weighted-average price of $13.83/ton Coal - Total Committed Tons (as of 7/20/12)(1) |
|
|
12 PRB Forward Coal Prices U.S. PRB 8800 Btu Coal Price (per ton) Source: ICAP plc $7.00 $8.00 $9.00 $10.00 $11.00 $12.00 $13.00 $14.00 $15.00 $16.00 $17.00 $18.00 $19.00 2011 2012 2013 2014 2015 Q1-10 Q3-10 Q1-11 Q3-11 Q4-11 Q1-12 7/27/2012 |
|
|
13 Liquidity for Growth 13 Cash and cash equivalents $ 122 Marketable Securities 100 Revolver 500 Total Available Liquidity $ 722 $500M Revolver (Baa3- Rating) $ 0 8¼% Senior Notes due 2017 300 (B1 / BB- rating) (7/26/12 yield 6.5678%) 8½% Senior Notes due 2019 300 (B1 / BB- rating) (7/27/12 yield 7.17%) Total Senior Debt $ 600 Total Borrowed Debt / Adjusted TTM EBITDA(1) 1.9x Liquidity and Obligations (as of June 30, 2012) ($ in millions) (1) Reconciliation tables for Adjusted EBITDA are included in the Appendix |
|
|
14 Effects of EPA Regulations Cross-State Air Pollution Rule (CSAPR), MATS, coal ash regulation, new source performance standard, etc. CSAPR stayed by courts – hearing 4/13/12, finding anticipated midyear Generating uncertainty Potential impacts on utilities Accelerated closure of some older/smaller coal fired power plants Installation of additional scrubbers Switch to natural gas Switch to lower sulfur PRB coal Potential unanticipated consequences? EPA’s cost projections for compliance severely underestimated Rise in electricity prices for consumers Impacts electric reliability Brownouts/blackouts at peak times Potential natural gas limitation due to infrastructure issues Impacts U.S. economy |
|
|
15 Lease Acquisition Strategy Building Reserves Source: Cloud Peak Energy management. Note: Acquired tonnage is not classified as reserve until verified with sufficient technical and economic analysis. Maps not to scale. Cordero Rojo Mine (8425 Btu) Maysdorf II (Tract shown as applied for) Expected bid date 2013 Tonnage estimate to be determined by the BLM (1) (1) The Maysdorf II tract, as applied for, is estimated to contain approximately 434 million recoverable tons. The BLM determined that certain surface owners met the criteria for being a “qualified surface owner” and set a deadline to obtain surface owner consent, which was not obtained. Accordingly, the BLM is expected to reconfigure the nominated tract to exclude such lands along with other adjustments, that CPE believes would result in a significant reduction of the applied for tonnage. WAII North and South Tracts – 383 million recoverable tons (1) Ridgerunner lease previously acquired – 81 million recoverable tons Extends mine life by approximately 12 years at current production rates (1) Environmental organizations challenged certain actions of the BLM and Secretary of the Interior relating to the North and South tract leases. On July 30, 2012, the U.S. District Court rejected these challenges. If the District Court’s decision is successfully overturned on any appeal, the ultimate outcome could adversely impact or delay our ability to mine the coal subject to the leases. Antelope Mine (8875 Btu) Ridgerunner Lease South Tract Acquired 2011 North Tract Acquired 2011 AWARDED Spring Creek Mine (9350 Btu) AWARDED 48 million recoverable tons Lease modification completed in 2010 Extends mine life by 2 to 3 years at current production rates Lease Modification LBA Mined Area (2009/1010) Leased Coal |

|
|
16 Export Strategy Strong International Demand Spring Creek is the Primary Exporter of PRB Coal Youngs Creek Assets Crow Potential Port Developments |
|
|
17 Increasing International Demand Supports Powder River Basin Exports 2011 U.S. exports up 32% (81 million tons 2010 to 107 million tons 2011) Estimated 2012 U.S. exports of 115 to 118 million tons East and Gulf Coast 95 to 97 million tons West Coast 11 to 12 million tons North America 9 million tons Sources: Company estimates |
|
|
18 Northern PRB Export Assets – Geographic Advantage Spring Creek and Youngs Creek are approximately 200 miles closer to West Coast ports than SPRB mines |
|
|
Northern PRB Mines – Export Quality Advantage 19 Northern PRB (Spring Creek and Youngs Creek) coal: Coal quality ~ 9,350 Btu Converts to 4,850 Kcal/kg NAR Premium subbituminous coal in the international market 19 4700-4850 4544 Average Source: Company estimates |

|
|
Youngs Creek – Coal Assets Acquired 20 Greenfield project seven miles south of Spring Creek 450 million in-place tons, $195 million, of which 291 million tons in mining permit 267 million tons at 8% royalty rate 9,220 Btu, low sulfur, and lower sodium than Spring Creek Mine Complementary to existing reserves of 311 million tons* at Spring Creek Multiple development options, production rates, timing and capex Permitted at 6 million tons in 2015, increasing to 14 million tons by 2019 Potential synergies with facilities, equipment, and reserves expansion * As of 12/31/2011 |
|
|
Youngs Creek – Land Assets Acquired 21 38,800 acres of surface land, $105 million Key location connecting Spring Creek, Youngs Creek, and potential Crow Exploration Area Will support access for Multiple development options of Youngs Creek Existing Spring Creek operations Future Spring Creek LBAs Air permits Rail corridors and access |
|
|
Youngs Creek Acquisition – Prudent Investment 22 Total purchase price of $300 million, financed from Cloud Peak Energy’s cash balance 450 million tons of in-place coal, of which 291 million tons under Youngs Creek mining permits 267 million tons at 8% royalty rate (vs. 12.5% normal federal royalty rate) Compares favorably with recent Wyoming LBA pricing 38,800 acres of surface land Adds value to stand-alone Spring Creek Mine – air permits, access to previously leased coal Large surface land holding will allow multiple development options for Spring Creek and Youngs Creek Surface land covers Youngs Creek, north to Spring Creek, west onto the Crow Indian Reservation, east to the Decker Mine Surface land provides access for potential synergies with existing operations Continued strong and stable balance sheet Acquisition purchase price financed from cash balance No additional debt required Retaining strong liquidity No debt and no employee obligations assumed |

|
|
Crow Tribal Legislature to Approve Tentative Agreements 23 Overview and process Exploration Agreement and Option Agreement to lease up to 1.4 billion tons of in-place Northern PRB coal submitted to the Crow Tribal Legislature for requested approval. If approved by the Legislature, the Crow Tribe and Cloud Peak Energy will execute the agreements and Cloud Peak Energy will pay the Tribe $2.25 million. The executed agreements would then be submitted to the U.S. Department of the Interior for up to 180 days for review and requested approval by the Bureau of Indian Affairs. If approved, Cloud Peak Energy will pay the Tribe an additional $1.5 million. |

|
|
Crow Tribal Legislature – Tentative Agreements 24 Exploration Agreement To complete delineation of the potentially economic coal tonnages subject to the options. Option Agreement Three exclusive options to lease three separate coal deposits. Initial five-year term, with potential extensions through 2035 if certain conditions are met. Total option payments of up to $10 million over the initial term, with additional annual option payments through any extension periods. Option exercise payments equal to $0.08 to $0.15 per ton, variable by deposit. |

|
|
25 Brownfield and Greenfield West Coast Port Expansions and Developments Capesize opportunities: Westshore 29 million tons to 33 million tons, 2012 Ridley 12 million tons to 24 million tons, ~ 2014 Pacific Gateway at Cherry Point, 48 million tons, ~ 2017/2018 Panamax opportunities: Numerous potential Panamax opportunities Cloud Peak Energy is working with others to further expansion of ports, construction of new ports, and alternative shipping options |

|
|
26 Northern PRB Assets Building Valuable Export Position Export focused coal assets – geographic and quality advantages over SPRB Youngs Creek Project adds value to existing Spring Creek operations and development options Acquisition compares favorably with SPRB LBA pricing Well positioned to meet rapidly growing Asian demand Working to create additional export terminal opportunities Continued strong balance sheet and low liabilities |
|
|
27 Looking Forward Large, resilient domestic business and developing export position Strong, low-sulfur reserve holdings in best positioned U.S. basin Efficient operations 81.2 million tons committed for 2013 Actively working on terminal expansion and new terminal projects in Pacific Northwest Strong balance sheet provides financial flexibility Significant cash generation Proportionally low, long-term operational liabilities |
|
|
Appendices (Cloud Peak Energy Inc.) 28 |
|
|
29 2012 Guidance – Estimates and 2011 Actuals 2012 (estimated) 2011 (actual) (1) Excluding impact of Tax Receivable Agreement. (2) Excluding capitalized interest and federal coal lease payments. Coal shipments for our three operated mines 90 - 93 million tons 95.6 million tons Committed sales with fixed prices Approximately 90.5 million tons n/a Anticipated realized price of produced coal with fixed prices Approximately $13.34 per ton $12.92 per ton Adjusted EBITDA $300 - $330 million $351.7 million Net interest expense Approximately $30 million $33.7 million Depreciation, depletion and accretion $105 - $115 million $99.6 million Effective income tax rate (1) Approximately 36% 5.7% Capital expenditures (2) $60 - $80 million $108.7 million Committed federal coal lease payments $129 million $133.2 million |
|
|
30 Average Cost of Produced Coal (1) Represents average cost of product sold for produced coal for our three company-operated mines. $8.57/ton for company-operated mines(1) $9.12/ton for company-operated mines(1) 2010 2011 |
|
|
31 Statement of Operations Data (in millions, except per share amounts) Three Months Ended June 30, Six Months Ended June 30, 2012 2011 2012 2011 Revenues $ 343.2 $ 387.7 $ 716.1 $ 744.2 Operating income 58.7 74.7 105.8 128.6 Net income 33.7 94.6 60.3 121.4 Earnings per common share – basic Net income $ 0.56 $ 1.58 $ 1.00 $ 2.02 Earnings per share – diluted Net income $ 0.55 $ 1.56 $ 0.99 $ 2.00 |
|
|
32 Statement of Operations Data (in millions, except per share amounts) Revenues $ 1,553.7 $ 1,370.8 $1,398.2 $1,239.7 $1,053.2 Operating income 250.5 211.9 255.0 124.9 102.7 Income from continuing operations 189.8 117.2 182.5 88.3 53.8 Income (loss) from discontinued operations — — 211.1 (25.2) (21.5) Net income 189.8 117.2 393.6 63.1 32.3 Amounts attributable to controlling interest: Income from continuing operations 189.8 33.7 170.6 88.3 53.8 Income (loss) from discontinued operations — — 211.1 (25.2) (21.5) Net income attributable to controlling interest $ 189.8 $ 33.7 $ 381.7 $ 63.1 $ 32.3 Earnings per share – basic Income from continuing operations $ 3.16 $ 1.06 $ 3.01 $ 1.47 $ 0.90 Income (loss) from discontinued operations — — 3.73 (0.42) (0.36) Net income $ 3.16 $ 1.06 $ 6.74 $ 1.05 $ 0.54 Earnings per share attributed to controlling interest – diluted Income from continuing operations $ 3.13 $ 1.06 $ 2.97 $ 1.47 $ 0.90 Income (loss) from discontinued operations — — 3.52 (0.42) (0.36) Net income $ 3.13 $ 1.06 $ 6.49 $ 1.05 $ 0.54 Year Ended December 31, 2011 2010 2009 2008 2007 |
|
|
33 Balance Sheet Data (in millions) Cash, cash equivalents and investments $ 221.8 $ 479.5 $ 340.1 $ 268.3 $ 15.9 $ 23.6 Restricted cash — 71.2 182.1 80.2 — — Property, plant and equipment, net 1,645.9 1,350.1 1,008.3 987.1 927.9 719.7 Total assets 2,299.8 2,319.3 1,915.1 1,677.6 1,785.2 1,781.2 Senior notes, net of unamortized discount 596.3 596.1 595.7 595.3 — — Federal coal lease obligations 239.4 288.3 118.3 169.1 206.3 67.6 Asset retirement obligations, net of current portion 196.3 192.7 182.2 175.9 164.2 159.1 Total liabilities 1,482.1 1,568.9 1,383.9 1,232.1 800.0 1,446.2 Controlling interest equity 817.6 750.4 531.2 252.9 985.2 335.0 Noncontrolling interest equity — — — 192.6 — — June 30, December 31, 2012 2011 2010 2009 2008 2007 |
|
|
34 Reconciliation of Non-GAAP Measures – Adjusted EBITDA (in millions) Nine Months Ended September 30, 2010 2009 (1) Changes to related deferred taxes are included in income tax expense. (2) Derivative financial instruments including unrealized mark-to-market amounts and cash settlements realized. Net income $ 33.7 $ 94.6 $ 60.3 $ 121.4 $ 128.7 Interest income (0.3) (0.2) (0.8) (0.3) (1.1) Interest expense 7.9 8.5 13.8 20.7 27.0 Income tax expense (benefit) 18.8 (69.5) 33.9 (54.2) 99.5 Depreciation and depletion 22.3 9.1 45.7 34.2 98.6 Accretion 3.4 3.1 6.1 6.4 12.1 EBITDA $ 85.8 $ 45.6 $ 159.0 $ 128.2 $ 364.9 Tax agreement expense (1) — 42.7 — 42.7 (22.9) Derivative financial instruments (2) (20.2) — (17.6) — (19.9) Expired significant broker contract — — — — — Adjusted EBITDA $ 65.6 $ 88.3 $ 141.4 $ 170.9 $ 322.1 Three Months Ended June 30, Six Months Ended June 30, Trailing Twelve Months 2012 2011 2012 2011 |
|
|
35 Reconciliation of Non-GAAP Measures – Adjusted EBITDA (in millions) Year Ended December 31, 2011 2010 2009 2008 2007 Net income $ 189.8 $ 117.2 $ * $ * $ * Net income from continuing operations * * 182.5 88.3 53.8 Interest income (0.6) (0.6) (0.3) (2.9) (7.3) Interest expense 33.9 46.9 6.0 20.4 40.9 Income tax expense (benefit) 11.4 32.0 68.2 25.3 18.1 Depreciation and depletion 87.1 100.0 97.9 89.0 80.1 Amortization (1) — 3.2 28.7 46.0 34.5 Accretion 12.5 12.5 12.6 12.7 12.2 EBITDA $ 334.1 $ 311.3 $ 395.6 $ 278.9 $ 232.3 Tax agreement expense (2) 19.9 19.7 — — — Derivative financial instruments (3) (2.3) — — — — Expired significant broker contract (1) — (8.2) (75.0) (71.6) (72.5) Adjusted EBITDA $ 351.7 $ 322.7 $ 320.6 $ 207.2 $ 159.8 * For 2009 and prior periods, Cloud Peak Energy reported discontinued operations. Accordingly, for such periods, net income from continuing operations is the comparable U.S. GAAP financial measure for Adjusted EBITDA. (1) The impact of the expired significant broker contract on the Statement of Operations is a combination of net income and the amortization expense related to the contract. All amortization expense for the periods presented was attributable to the significant broker contract. (2) Changes to related deferred taxes are included in income tax expense. (3) Derivative financial instruments including unrealized mark-to-market amounts and cash settlements realized. |
|
|
36 Reconciliation of Non-GAAP Measures – Adjusted EPS (1) Derivative financial instruments including unrealized mark-to-market amounts and cash settlements realized. Three Months Ended June 30, Six Months Ended June 30, 2012 2011 2012 2011 Diluted earnings per common share $ 0.55 $ 1.56 $ 0.99 $ 2.00 Tax agreement expense including tax impacts of IPO and Secondary Offering — (0.84) — (0.84) Derivative financial instruments (1) (0.21) — (0.19) — Expired significant broker contract — — — — Adjusted EPS $ 0.34 $ 0.72 $ 0.81 $ 1.16 Weighted-average dilutive shares outstanding (in millions) 60.9 60.6 60.8 60.6 |
|
|
37 Diluted earnings per common share attributable to controlling interest $ 3.13 $ 1.06 $ * $ * $ * Diluted earnings per common share attributable to controlling interest from continuing operations * * 2.97 1.47 0.90 Tax agreement expense including tax impacts of IPO and Secondary Offering (0.63) 0.78 — — — Derivative financial instruments (1) (0.02) — — — — Expired significant broker contract — (0.10) (0.49) (0.41) (0.44) Adjusted EPS $ 2.47 $ 1.74 $ 2.48 $ 1.06 $ 0.46 Weighted-average shares outstanding (in millions) 60.6 31.9 60.0 60.0 60.0 Reconciliation of Non-GAAP Measures – Adjusted EPS Year Ended December 31, 2011 2010 2009 2008 2007 * For 2009 and prior periods, Cloud Peak Energy reported discontinued operations. Accordingly, for such periods, diluted earnings (loss) per share attributable to controlling interest from continuing operations is the comparable U.S. GAAP financial measure for Adjusted EPS. (1) Derivative financial instruments including unrealized mark-to-market amounts and cash settlements realized. |
|
|
38 Other Data (1) Represents only the three company-operated mines. Three Months Ended June 30, Six Months Ended June 30, Trailing Twelve Months 2012 2011 2012 2011 Total tons sold (in millions) (1) 20.1 23.0 42.6 46.1 92.2 Average realized price per ton sold (in millions) (1) $ 13.11 $ 12.94 $ 13.21 $ 12.86 $ 13.09 Average cost of product sold per ton(1) $ 10.09 $ 9.23 $ 9.93 $ 9.09 $ 9.51 |
|
|
39 Other Data (in millions) Tons sold – company owned and operated mines 95.6 93.7 90.9 93.7 90.7 Total tons sold– Decker Mine (50% share) 1.5 1.5 2.3 3.3 3.5 Tons sold from all production * 97.2 95.1 93.2 97.0 94.2 Tons purchased and resold 1.6 1.7 10.1 8.1 8.1 Year Ended December 31, 2011 2010 2009 2008 2007 * Total reflects rounding |
|
|
40 Sulfur Content by Basin Source: SNL U.S. Coal Consumption by Region Region/ Avg Btu Average lbs SO2 PRB/ 8,600 0.5 – 1.0/mmBtu Rocky Mountain 11,500 0.9 – 1.4/mmBtu Illinois Basin 11,500 2.5 – 6.0/mmBtu Appalachia 12,000 1.2 – 7.0/mmBtu Lignite 6,000 1.4 – 4.0/mmBtu Cloud Peak Energy Mines Antelope 8,875 0.52/mmBtu Cordero Rojo 8,425 0.69/mmBtu Spring Creek 9,350 0.71/mmBtu Source: Public record |