Attached files
| file | filename |
|---|---|
| EX-99.1 - NEWS RELEASE ISSUED BY XYLEM INC. ON AUGUST 2, 2012 - Xylem Inc. | d389267dex991.htm |
| 8-K - FORM 8-K - Xylem Inc. | d389267d8k.htm |
 Q2
2012 Earnings Release August 2, 2012 |
 Forward
Looking Statements 2
This
document
contains
information
that
may
constitute
“forward-looking
statements.”
Forward-looking
statements
by
their
nature
address
matters
that
are,
to
different
degrees,
uncertain.
Generally,
the
words
“anticipate,”
“estimate,”
“expect,”
“project,”
“intend,”
“plan,”
“believe,”
“target”
and similar expressions identify forward-looking statements, which
generally are not historical in nature. However, the absence of these words or
similar expressions does not mean that a statement is not
forward-looking. These forward-looking statements include, but are
not limited to, statements about the separation of Xylem Inc. (the
“Company”) from ITT Corporation, the terms and the effect of the
separation, the nature and impact of the separation, capitalization of the
Company, future strategic plans and other statements that describe the Company’s business
strategy, outlook, objectives, plans, intentions or goals, and any discussion of
future operating or financial performance. All statements that address
operating performance, events or developments that we expect or anticipate will occur in
the
future
—
including statements relating to orders, revenues, operating margins and earnings
per share growth, and statements
expressing
general
views
about
future
operating
results
—
are forward-looking statements.
Caution should be taken not to place undue reliance on any such forward-looking
statements because they involve risks, uncertainties and other factors that
could cause actual results to differ materially from those expressed or implied
in,
or
reasonably
inferred
from,
such
statements.
The Company undertakes no obligation to publicly update or revise
any forward-looking statements, whether as a result of new information, future
events or otherwise, except as required by law. In addition,
forward-looking statements are subject to certain risks and uncertainties that could cause actual
results to differ materially from the Company’s historical experience and our
present expectations or projections. These risks and uncertainties include,
but are not limited to, those set forth in Item 1A of our Annual Report on Form 10-K, and
those described from time to time in subsequent reports filed with the Securities
and Exchange Commission. |
 Q2’12 Xylem Results
3
Strong Operating Performance
Strong Operating Performance
* See Appendix for Non-GAAP Reconciliations
Financial Performance Summary
Financial Performance Summary
Orders
Revenue
Gross Margin
Operating Margin *
EPS *
Free Cash Flow *
$970M
$966M
39.6%
14.0%
54% Conversion
$0.49
$86M
Book to Bill 1.00
+4% (Constant Currency)*
+60 bps
14.8% ex. Stand-Alone Costs, +100 bps
+4% Normalized Growth |
 Business Update
4
Advancing Our Strategic Position
•
Growing the Analytical Instrumentation Platform
•
Expanding Dewatering Services into Attractive Markets in Brazil
Deploying Innovative New Product Applications and Services
•
Strong Order Rate for Treatment in Q2’12
•
New Generation YSI EXO Sonde
Continued Strong Execution
•
Q2’12 Emerging Markets Growth of 22% (Constant Currency Basis)
•
Driving Customer Excellence and Cost Reduction Initiatives
Strengthening Foundation & Positioning for Future Growth
Strengthening Foundation & Positioning for Future Growth
•
MJK Automation Acquisition
Xylem Total Care - Energy Audits Identify Customer Savings & Retrofit Opportunities • |
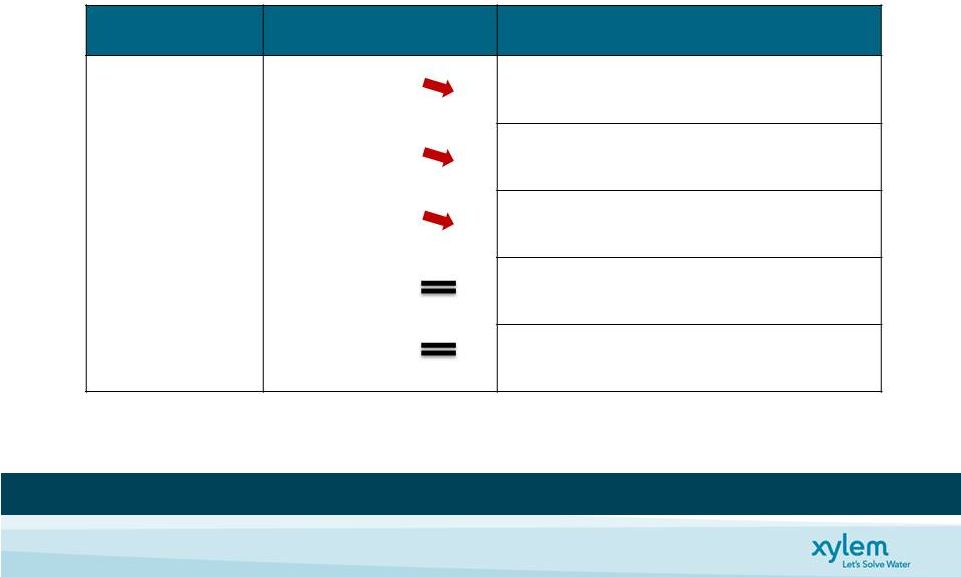
 1H’12 Organic Revenue Performance
5
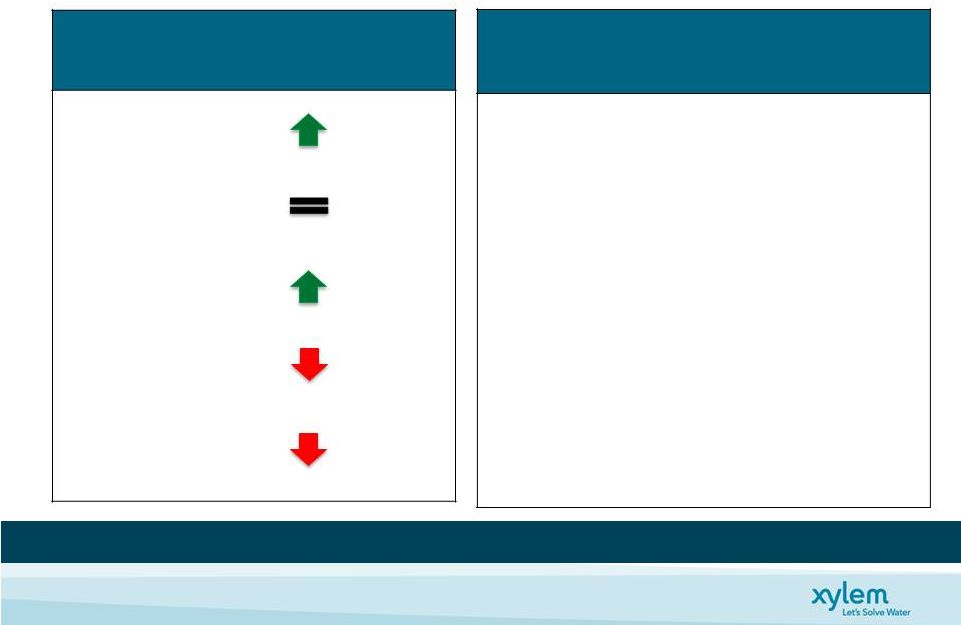
End Market
(% of 2011 Revenue)
1H’12 Organic
Growth vs. PY
Industrial
(~40%)
Public Utility
(~36%)
Commercial
(~12%)
Residential
(~9%)
Agriculture
(~3%)
1H’12 Organic
Growth vs. PY
Mid
Single
Low
Single
Low
Single
Mid
Single
Major Geographic Region
(% of 2011 Revenue)
Organic
Growth vs. PY
U.S. (~36%)
+
Industrial & Residential Strength
+
Commercial Up (Moderating)
–
Public Utility (Dewatering & Projects)
Europe (~37%)
–
Industrial Down Slightly
–
Residential & Commercial Weakness
=
Public Utility Flat
Emerging Markets (19%)
+
Up Across All Regions
Total Growth
+3%
-1%
+11%
+1%
U.S.
U.S.
&
&
EM
EM
Strength
Strength
Partially
Partially
Offset
Offset
by
by
Europe
Europe
…
…
Public
Public
Utility
Utility
Stable
Stable |
 Full
Year Outlook 6
Challenging Market Dynamics
•
Slower Growth in the Developed Markets
•
FX Headwinds Continue
Productivity & Strong Execution Continues While Investing for Growth
•
Disciplined Capital Deployment
•
Maintaining Operating Margin Expansion Target
Accelerating Restructuring & Realignment Actions In Face of Economic
Uncertainty Updating 2012 Guidance, Reflecting Lower Organic Growth
•
Full Year Revenue ~$3.8B; Organic Growth 1% to 3%
•
Adjusted EPS Mid Point of $1.77*
•
*See appendix for non-GAAP reconciliations
•
Investing $15M to $20M
Navigating Through a Tougher Macro Environment
Navigating Through a Tougher Macro Environment |
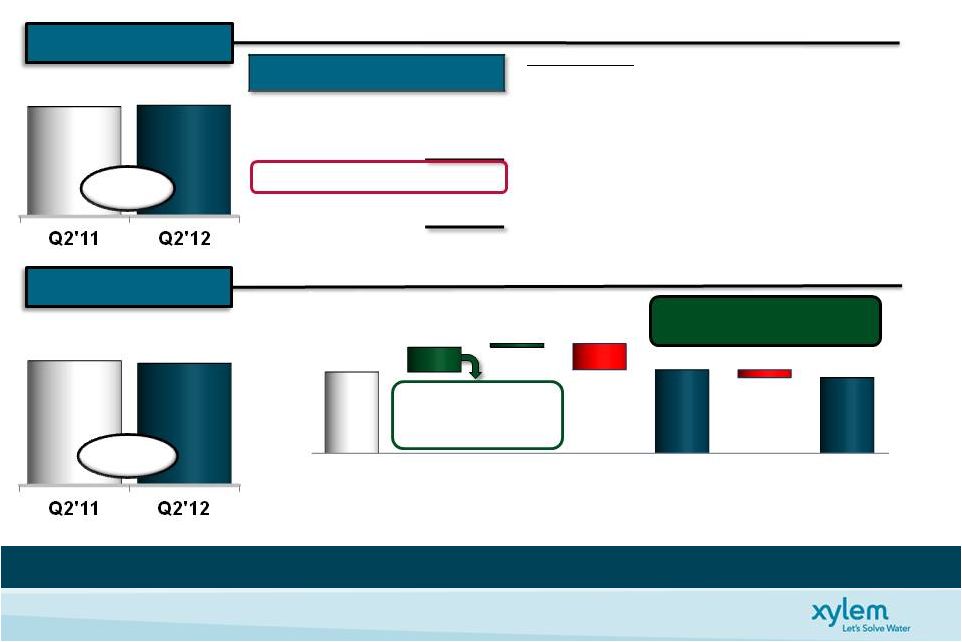
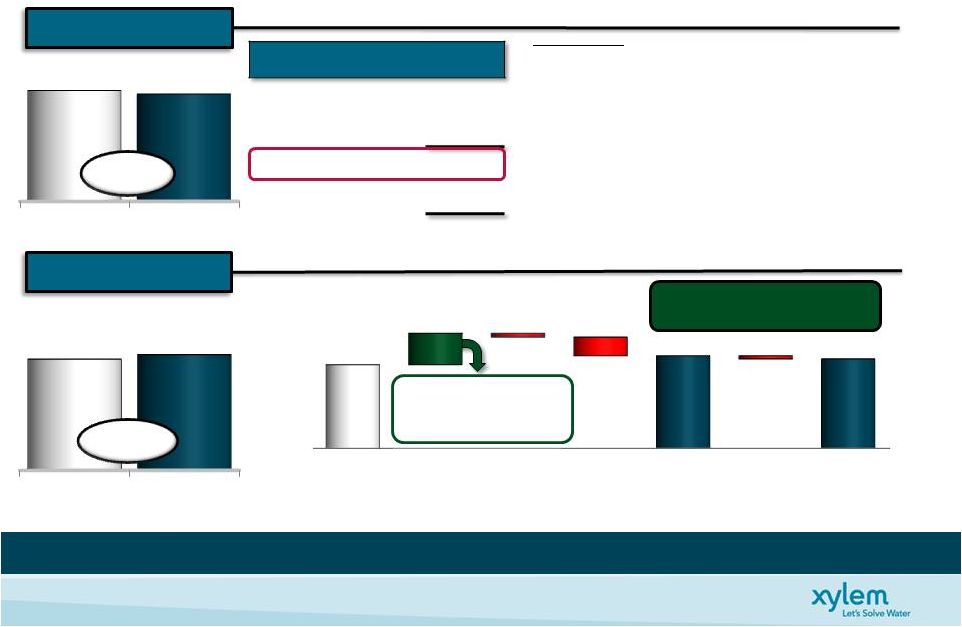
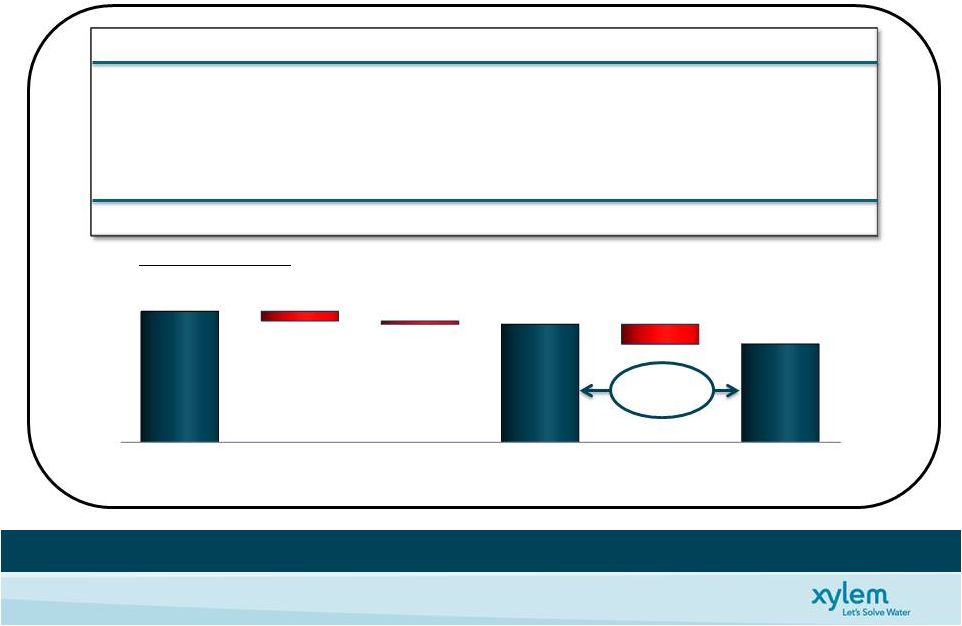
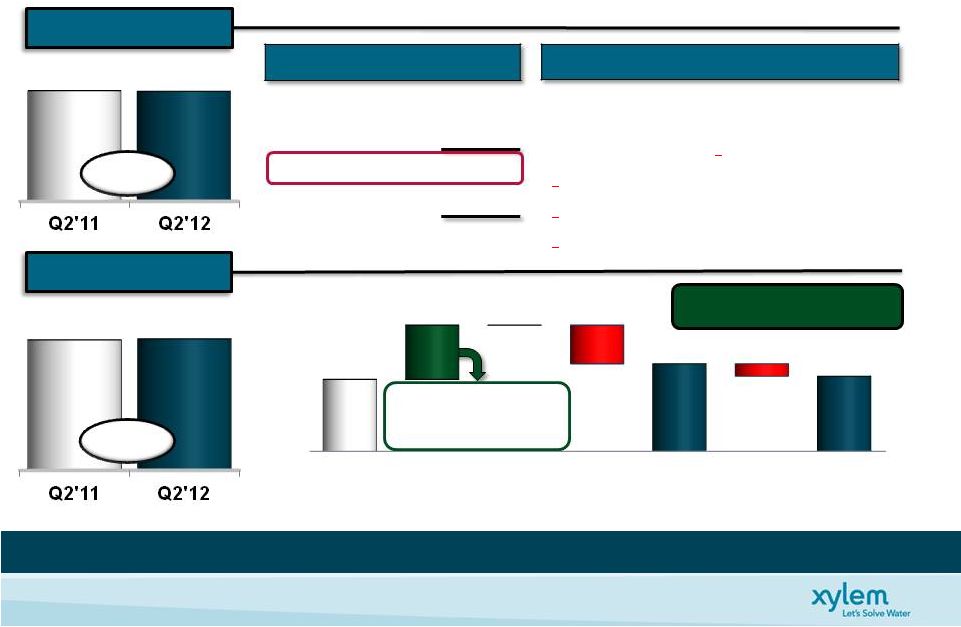 Q2’12 Xylem Performance
7
Revenue Up 4%* …
Revenue Up 4%* …
Op Margin Before Stand Alone Costs + 100 Bps
Op Margin Before Stand Alone Costs + 100 Bps
-
1%
•
*See appendix for non-GAAP reconciliations
(Dollars, In Millions)
(Dollars, In Millions)
+1%
Incremental Margin ~36%
(Ex. FX & Stand Alone Costs)
Q2 Growth
Organic
+1%
Acquisition
+3%
Constant Currency
+4%
FX
-5%
Total
-1%
Cost Reductions
+3.1%
Price
+1.4%
Acquisitions
+0.4%
Vol/Mix/Invest
-
1.1%
Organic Performance
By End Market
By Geography
+
Industrial
+
U.S.
+
Public Utility
Europe
Commercial
+
Emerging Markets
Residential
Agriculture
Revenue
Operating Income *
971
966
134
135
Q2'11
Op Margin*
13.8%
3.8%
0.0%
2.8%
14.8%
0.8%
14.0%
Operations
FX
Inflation
Q2'11
Op Margin
Before Stand-
Alone Costs*
Stand-
Alone
Costs
Q2’12
Op Margin* |
 Q2’12 Xylem Performance
8
Core Operations & YSI Drive Significant Earnings Growth
Core Operations & YSI Drive Significant Earnings Growth
Interest
($0.06)
Stand-Alone
($0.03)
Separation Costs
$0.15
Special Tax
$0.02
Q2’12 EPS *
4% Normalized
EPS Growth
* See Appendix for Non-GAAP Reconciliations
Operational Performance:
+
+
Separation Costs
($0.02)
Special Tax
$0.01
$0.39
$0.08
$0.47
$0.02
$0.49
$0.48
Q2’11
GAAP EPS
Adjustments
Normalized
Q2’11 EPS
Operational
Performance
Adjusted
Q2’12EPS
Adjustments
Q2’12
GAAP EPS
$0.01
Core Operations
$0.04
YSI Acquisition
$0.03
Operating Tax Rate
($0.01)
FX Translation
($0.04) |
 Q2’12 Water Infrastructure Performance
9
Resilient Portfolio …
Resilient Portfolio …
Outstanding YSI Performance
Outstanding YSI Performance
+1%
* See appendix for non-GAAP reconciliations
Revenue
Operating Income *
Operating Income *
(Dollars, In Millions)
(Dollars, In Millions)
-2%
Price & Productivity More Than
Offset Inflation/Mix
(Constant
Currency)
•
Transport +6%
+
Public Utility …
Emerging Markets Up, Europe Flat
+
Industrial …
Up in Most Regions, U.S. Flat
–
Drought Condition Impact on Dewatering
•
Treatment -11%
–
Lower Project Deliveries; Key Wins for 2013
•
Test +58% (Incl. YSI Acquisition $32M)
–
Europe Weaker
Q2 Growth
Organic
+2%
Acquisition
+5%
Constant Currency
+7%
FX
-6%
Total
+1%
602
609
96
94
15.9%
2.4%
0.4%
2.6%
16.1%
0.7%
15.4%
Q2'11
Op Margin*
Operations
FX
Inflation
Q2'11
Op Margin
Before
Stand-Alone
Stand-
Alone
Q2’12
Op Margin*
Cost Reductions
Price
Acquisitions
Vol/Mix/Invest
+2.6%
+1.0%
+0.5%
-
1.7% |
 Q2’12 Applied Water Performance
10
Productivity & Price Initiatives Drive Strong Op Margin Expansion
Productivity & Price Initiatives Drive Strong Op Margin Expansion
* See appendix for non-GAAP reconciliations
(Dollars, In Millions)
(Dollars, In Millions)
(Constant Currency)
•
–
Commercial …
Slowing Institutional Spend
–
Residential …
Europe Down
+
U.S. Up Mid Single Digits
•
+
Double-Digit U.S. Growth
–
Europe Weaker
•
+
U.S. Up Double Digits
-3%
+4%
Significant Margin Expansion
Significant Margin Expansion
+140 bps before Stand Alone
+140 bps before Stand Alone
Q2 Growth
Q2 Growth
Q2 Growth
Q2 Growth
Constant Currency
Flat
Flat
Organic
Acquisition
FX
Total
-%
-3%
-3%
Revenue
Revenue
Operating Income *
Operating Income *
Cost Reductions
+3.8%
Price
+2.1%
Vol/Mix/Invest
-
1.0%
50
52
385
373
Q2'11
Op Margin
Operations
FX
Inflation
Q2'12
Op Margin
Before
Stand-Alone
Stand-
Alone
Q2'12
Op Margin *
13.0%
14.4%
13.9%
0.6%
2.9%
0.5%
4.9%
Building Services -2%
Industrial Water +4%
Irrigation -4%
Q2'11
Q2'12
Q2'11
Q2'12 |
 Xylem
Financial Position 11
FY
FY
Cash
Cash
Flow
Flow
On
On
Track
Track
…
…
Strong Balance Sheet Provides Flexibility
Strong Balance Sheet Provides Flexibility
•
Free Cash Flow $86M
•
‘12 Includes $36M and $26M of
Incremental Tax & Interest Pmts
•
Working Capital Investment $10M
•
Capex > 1 Reinvestment Ratio
•
Strong Cash Position
•
No Significant Debt Maturities Until 2016
•
30% Net Debt to Net Capital
•
1.3x Net Debt/Adj. TTM EBITDA
•
$600M
Revolving
Credit
Facility
-
Unutilized
•
Access
to
Commercial
Paper
-
Unutilized
FCF%
75%
54%
W/C%**
24.8%
23.6%
June 30, 2012
Cash
358
Debt
1,206
Net Debt
848
Stockholders’
Equity
1,948
Net Capital
2,796
Net Debt to Net Capital
30%
(Dollars, In Millions)
(Dollars, In Millions)
(Dollars, In Millions)
* See Appendix for Non-GAAP Reconciliations
** (AR+INV-AP)/ TTM Revenue (Adjusted for Acquisitions)
Free Cash Flow *
Free Cash Flow *
Working Capital
Working Capital
Capital Summary/Liquidity
Capital Summary/Liquidity
134
86
86
900
910
910
Q2’11 YTD
Q2’12 YTD
Q2’11
Q2’12 |
 2012 Guidance |
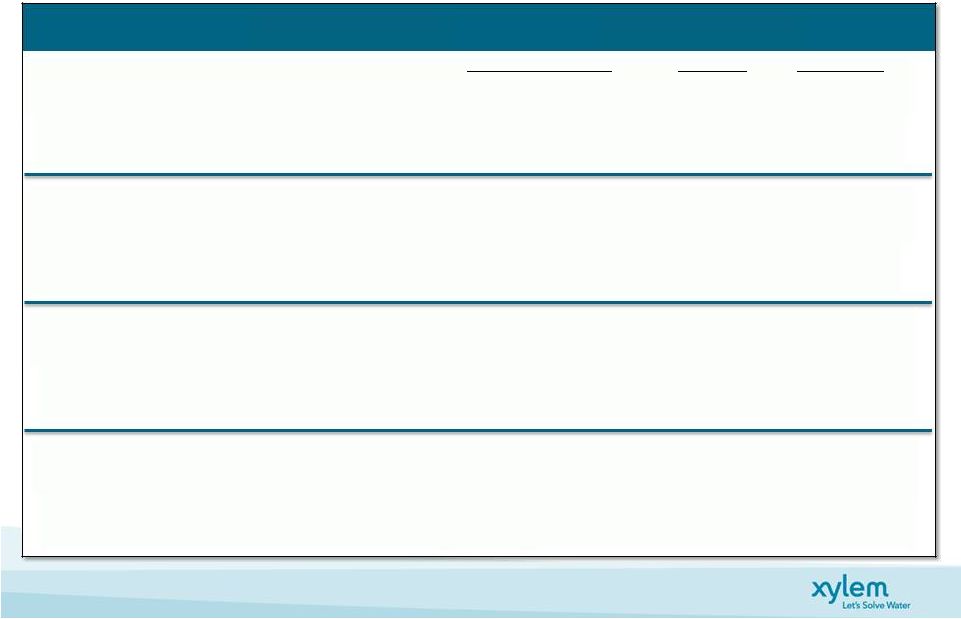
 End
Market Performance 13
Challenging
Challenging
Market
Market
Dynamics
Dynamics
…
…
Europe
Europe
Weaker
Weaker
Industrial
Public Utility
Commercial
Residential
Agriculture
Up Low -
Mid
Single Digit
Flat -
Up Low
Single Digit
Up Low
Single Digit
Up Low
Single Digit
Down Low
Single Digit -
Flat
•
Weaker Europe
•
Drought Conditions Continue
•
Moderate Sequential Growth (2H vs. 1H)
•
US/Europe MRO Stable
•
Shippable 2012 project backlog down (Capex)
•
Moderate Sequential Growth (2H vs. 1H)
•
Energy Efficient Solutions
•
Flat to Up Slightly (2H vs. 1H)
•
U.S. Stable …
Weaker Europe
•
Flat to Up Slightly (2H vs. 1H)
•
Favorable U.S. Conditions Continue
vs. Previous
vs. Previous
Outlook
Outlook
2H Planning Assumptions
2H Planning Assumptions
FY’
12
vs.
PY |
 Guidance Roll-Forward
14
Lower
Revenue
Outlook
…
Cost
Savings
Plan
Mitigates
EPS
Impact
Mid-Point Roll-Forward
Revenue
EPS
Note
Previous Guidance
$3.95B
$1.87
Based on Organic Growth 4%-6%
FX Translation
($50M)
($0.03)
Euro Rate at $1.22 (Previously $1.31)
MJK Acquisition
$6M
($0.01)
Not Included in Prior Guidance
Market Dynamics
($105M)
($0.16)
Organic Growth 1%-3%; -3 pt. Revision
Cost Savings Actions
-
Paced Investments, Discretionary Costs
$0.10
Revised Guidance
~3.8B
$1.77
3% Operational EPS Reduction
Previous
Guidance
FX
Translation
MJK
Acquisition
Reset
FX & MJK
Operational
Performance
Revised
Guidance
$1.87
$1.83
$1.77
$0.03
$0.01
$0.06
EPS
Midpoint
Illustration
-
-
3%
3% |
 2012
Financial Guidance Summary 15
* See Appendix for Non-GAAP Reconciliations
Revenue
Xylem Consolidated
Water Infrastructure
Applied Water
Segment Margin *
Operating Margin *
EPS *
Free Cash Flow Conversion
Guidance Assumptions:
Stand-Alone Costs
Operating Tax Rate
Share Count
Items Excluded from Guidance:
(1) Separation Costs
(2) Restructuring &
Realignment Costs
~$3.8B
~$2.4B
~$1.4B
14.2% -
14.6%
12.7% -
13.3%
$1.72 -
$1.82
95%
$25M -
$30M
~25%
~186.3M
$15M -
$20M
$15M -
$20M
Constant Currency
Organic
Acquisition
3% to
5% 1% to 3%
2% 5% to
7% 1% to 3%
4% 0% to
3% 0% to 3%
0% +20 to +60 bps
+0 to +60 bps
+4% to +10% on Normalized Basis
Excluding one-time separation costs
Included in EPS Guidance; In Line with Expectations
Excludes Special Tax Items
In Line with Expectations
$9M-$10M Annual Savings Beginning 2013
2012 Full Year
2012 Full Year
Financial Outlook
Financial Outlook
Growth
Growth
2012E vs. 2011
2012E vs. 2011 |
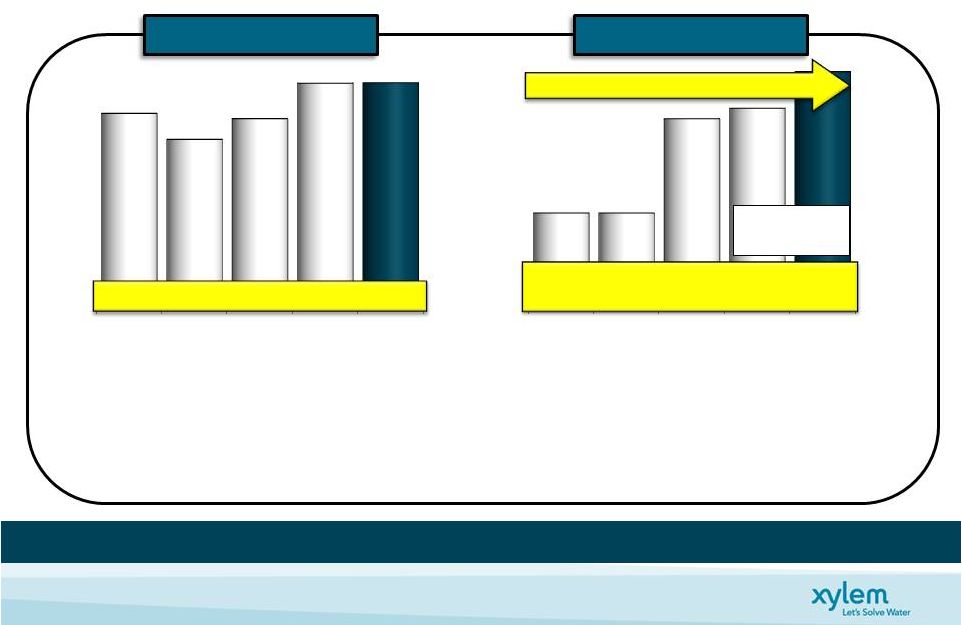 Resilient Portfolio, Discipline & Strategic Focus
…
…
Provides
Provides
Confidence
Confidence
in
in
2H
2H
Execution
Execution
and
and
Ability
Ability
to
to
Position
Position
For
For
2013
2013
16
•
Resilient
Portfolio
…
Despite Challenging End Market Conditions
•
Management Discipline …Proactive Actions (~$100M of Restructuring &
Realignment ‘08-’12) •
Operational
Excellence
…
Driving Productivity Initiatives
•
Continued Investment Driving Growth in Core Business
•
(2012E At Mid-Point Guidance)
Revenue
Revenue
Revenue Up ~$510M …
+15%
Op Income Up ~$165M …
~46%
Incremental Margin ~32%
Incl. Stand-
Alone Costs
12.7% 13.0%
Expansion +290 Bps On Comp Basis
2008
2009
2010
2011
2012E
2,849
3,202
3,803
~3.8B
3,291
2008
2009
2010
10.8%
10.8%
12.6%
12.8%
13.7%
2011
2012E
Operating
Margin
*
* Excludes the impact of restructuring and stand alone costs for all periods. See Appendix for
Non-GAAP Reconciliations Key Acquisitions … Transitioning Portfolio to Higher Profitability Levels |
 Key
Takeaways 17
Strong Q2 Operating Performance
Executing Long-Term Strategy …
MJK Bolt-On Acquisition & New Product
Applications
Stable Business Performance In Challenging Macro Environment
Top-Line
Challenges
…
Driven
by
Europe
Resilient Portfolio & Large Installed Base Dampens Unfavorable Macro
Conditions Positioning Cost Structure for Stronger Operating Leverage
Customer Excellence & Operational Discipline
Taking Actions and Investing for Future Growth
Strong Financial Position & Strong Cash Flow Generation
Flexibility to Execute Long-Term Strategy |
 Appendix |
 2012
EPS Outlook 19
Mid Point 7% Earnings Growth On Normalized Basis
Illustration of Mid Point Guidance
* See Appendix for Non-GAAP Reconciliations
Includes
unfavorable tax
rate change of 1%
Operational Performance:
+
Core Operations
$0.15
+
Acquisitions (YSI & MJK)
$0.08
–
Operating Tax Rate
($0.02)
–
FX Translation
($0.10)
Adjusted
FY'11 EPS*
Incremental
Interest
Expense
Incremental
Stand-
Alone Costs
Normalized
FY'11 EPS*
Operational
Performance
Adjusted
FY'12 EPS*
$1.93
$1.66
$1.77
$0.16
$0.11
$0.11
7% Normalized
7% Normalized
EPS Growth
EPS Growth |
 Quarterly Financial Performance
20
($M, Except
EPS)
Q1’10
Q2’10
Q3’10
Q4’10
FY’10
Q1’11
Q2’11
Q3’11
Q4’11
FY’11
Q1’12
Q2’12
Revenue
686
775
806
935
3,202
890
971
939
1,003
3,803
925
966
COGS
431
484
497
576
1,988
553
592
574
623
2,342
562
583
Gross Profit
255
291
309
359
1,214
337
379
365
380
1,461
363
383
SG&A
164
170
183
220
737
210
219
215
233
877
231
220
R&D
18
17
18
21
74
24
26
23
27
100
28
28
Separation Costs
-
-
-
-
-
3
18
46
20
87
5
6
Restructuring &
Asset
Impairment
Charges, net
4
3
1
7
15
-
-
2
-
2
-
-
Op Income
69
101
107
111
388
100
116
79
100
395
99
129
Interest Expense
-
-
-
-
-
-
1
1
15
17
14
13
Other Non-Op
-2
-1
3
-
-
1
-
4
-
5
(1)
(1)
Income before
Tax
67
100
110
111
388
101
115
82
85
383
84
115
Tax
11
15
19
14
59
23
43
5
33
104
21
26
Net Income
56
85
91
97
329
78
72
77
52
279
63
89
EPS –
Diluted *
$0.30
$0.46
$0.49
$0.53
$1.78
$0.42
$0.39
$0.42
$0.28
$1.50
$0.34
$0.48
* On October 31, 2011, Xylem Inc. completed the spin-off through a
tax-free stock dividend to ITT Corporation’s shareholders. ITT
Corporation shareholders received one share of our common stock for each share of
ITT common stock. As a result on October 31, 2011, periods presented
prior to the spin-off. we had 184.6 million shares of common stock outstanding and this
share amount is being utilized to calculate earnings per share for all |
 Non-GAAP Measures
21
Xylem Inc. Non- GAAP Measures
Management views key performance indicators including revenue, gross margins, segment operating
income and margins, orders growth, free cash flow, working capital, and backlog, among
others. In addition, we consider certain measures to be useful to management and investors evaluating our operating performance for the periods presented,
and provide a tool for evaluating our ongoing operations, liquidity and management of assets.
This information can assist investors in assessing our financial performance and
measures our ability to generate capital for deployment among competing strategic alternatives
and initiatives. These metrics, however, are not measures of financial performance
under GAAP and should not be considered a substitute for revenue, operating income, net income, earnings per share (basic and diluted) or net cash from
operations as determined in accordance with GAAP. We consider the following non-GAAP
measures, which may not be comparable to similarly titled measures reported by other
companies, to be key performance indicators: defined as revenue and orders,
respectively, excluding the impact of foreign currency fluctuations, intercompany transactions, and
contributions from acquisitions and divestitures. Divestitures include sales of portions of
our business that did not meet the criteria for classification as a discontinued operation
or insignificant portions of our business that we did not classify as a discontinued
operation. The period-over-period change resulting from foreign currency fluctuations assumes
no change in exchange rates from the prior period.
“Organic revenue" and "Organic orders” “Constant
currency”
defined as financial results adjusted for currency by translating current period and prior
period activity using the same currency conversion rate. This
approach is used for countries whose functional currency is not the U.S. dollar.
“EBITDA”
“Operating Income * ”, "Adjusted Operating Income" and “Adjusted
EPS”
defined as operating income and earnings per share, adjusted to exclude restructuring and
“Normalized
EPS”
defined as adjusted earnings per share, as well as adjustments to reflect the incremental
current period amount of interest expense and stand alone costs in the prior comparable period.
“Free Cash
Flow”
defined as net cash from operating activities, as reported in the Statement of Cash Flow,
less capital expenditures as well as adjustments for other significant
“Adjusted
EBITDA”
defined as earnings before interest, taxes, depreciation, amortization expense, and
share-based compensation.
reflects the adjustment to EBITDA to exclude for one-time separation costs associated
with the Xylem spin-off from ITT Corporation. items that impact current
results which management believes are not related to our ongoing operations and performance. Our definition of free cash flows does not
consider non- discretionary cash payments, such as debt.
realignment and one- time separation costs associated with the Xylem spin- off from
ITT Corporation and tax- related special items. |
 Non-GAAP Reconciliation:
Organic & Constant Currency Revenue Growth
22
Constant Currency
(A)
(B)
(C)
(D)
(E)
(F) = B+C+D+E
(G) = F/A
(H) = (B + D) / A
Change
% Change
Change
% Change
Revenue
Revenue
2012 v. 2011
2012 v. 2011
FX Contribution
Eliminations
Adj. 2012 v. 2011
Adj. 2012 v. 2011
2012
2011
Six Months Ended June 30
Xylem Inc.
1,891
1,861
30
1.6%
(66)
63
-
27
1.5%
5.0%
Water infrastructure
1,193
1,153
40
3.5%
(66)
47
-
21
1.8%
7.5%
Applied Water
728
740
(12)
-1.6%
-
18
(1)
5
0.7%
0.8%
Quarter Ended June 30
Xylem Inc.
966
971
(5)
-0.5%
(32)
49
-
12
1.2%
4.5%
Water infrastructure
609
602
7
1.2%
(32)
37
(1)
11
1.8%
7.3%
Applied Water
373
385
(12)
-3.1%
-
13
(1)
-
0.0%
0.3%
Quarter Ended March 31
Xylem Inc.
925
890
35
3.9%
(34)
14
-
15
1.7%
5.5%
Water infrastructure
584
551
33
6.0%
(34)
10
1
10
1.8%
7.8%
Applied Water
355
355
-
0.0%
-
5
-
5
1.4%
1.4%
Note: Due to rounding the sum of segment amounts may not agree to Xylem totals.
Acquisitions /
Divestitures
Xylem Inc. Non-GAAP Reconciliation
Reported vs. Organic & Constant Currency Revenue
($ Millions)
(As Reported -
GAAP)
(As Adjusted -
Organic) |
 Non-GAAP Reconciliation:
Organic & Constant Currency Order Growth
23
Constant Currency
(A)
(B)
(C)
(D)
(E)
(F) = B+C+D+E
(G) = F/A
(H) = (B + D) / A
Change
% Change
Change
% Change
Orders
Orders
2012 v. 2011
2012 v. 2011
FX Contribution
Eliminations
Adj. 2012 v. 2011
Adj. 2012 v. 2011
2012
2011
Six Months Ended June 30
Xylem Inc.
1,974
1,976
(2)
-0.1%
(67)
69
-
-
0.0%
3.4%
Water infrastructure
1,255
1,244
11
0.9%
(67)
53
-
(3)
-0.2%
5.1%
Applied Water
752
764
(12)
-1.6%
-
18
(3)
3
0.4%
0.8%
Quarter Ended June 30
Xylem Inc.
970
998
(28)
-2.8%
(30)
51
-
(7)
-0.7%
2.3%
Water infrastructure
617
632
(15)
-2.4%
(30)
40
-
(5)
-0.8%
4.0%
Applied Water
370
383
(13)
-3.4%
-
13
(2)
(2)
-0.5%
0.0%
Quarter Ended March 31
Xylem Inc.
1,004
978
26
2.7%
(37)
18
-
7
0.7%
4.5%
Water infrastructure
638
612
26
4.2%
(37)
13
-
2
0.3%
6.4%
Applied Water
382
381
1
0.3%
-
5
(1)
5
1.3%
1.6%
Note: Due to rounding the sum of segment amounts may not agree to Xylem totals.
Acquisitions /
Divestitures
Xylem Inc. Non-GAAP Reconciliation
Reported vs. Organic & Constant Currency Order Growth
($ Millions)
(As Reported -
GAAP)
(As Adjusted -
Organic) |
 Non-GAAP Reconciliation: Adjusted Diluted EPS
24
Q1 2012
Q2 2012
YTD 2012
Net Income
63
89
152
Separation costs, net of tax
4
4
8
Adjusted Net Income before Special Tax Items
67
93
160
Special Tax Items
-
(1)
(1)
Adjusted Net Income
67
92
159
Diluted Earnings per Share
$0.34
$0.48
$0.82
Separation costs per Share
$0.02
$0.02
$0.04
Adjusted diluted EPS before Special Tax Items
$0.36
$0.50
$0.86
Special Tax Items per Share
$0.00
($0.01)
($0.01)
Adjusted diluted EPS
$0.36
$0.49
$0.85
Q1 2011
Q2 2011
YTD 2011
Net Income
78
72
150
Separation costs, net of tax
2
27
29
Adjusted Net Income before Special Tax Items
80
99
179
Special Tax Items
-
4
4
Adjusted Net Income
80
103
183
Diluted Earnings per Share
$0.42
$0.39
$0.82
Separation costs per Share
$0.01
$0.15
$0.16
Adjusted diluted EPS before Special Tax Items
$0.43
$0.54
$0.97
Special Tax Items per Share
$0.00
$0.02
$0.02
Adjusted diluted EPS
$0.43
$0.56
$0.99
Adjusted Diluted EPS
For The Three and Six Months Ended June 30, 2012 & 2011
($ Millions, except per share amounts)
Xylem Inc. Non-GAAP Reconciliation |
 Non-GAAP Reconciliation: Normalized and Adjusted EPS
25
Q2 2011
Q2 2012
As Reported
Adjustments
Adjusted
Adjustments
Normalized
As Reported
Adjustments
Adjusted
Total Revenue
971
971
971
966
966
Operating Income
116
18
a
134
(8)
c
126
129
6
a
135
Operating Margin
11.9%
13.8%
13.0%
13.4%
14.0%
Interest Expense
(1)
(1)
(13)
d
(14)
(13)
(13)
Other Non-Operating Income (Expense)
-
-
-
(1)
(1)
Income before Taxes
115
18
133
(21)
112
115
6
121
Provision for Income Taxes
(43)
13
b
(30)
5
e
(25)
(26)
(3)
b
(29)
Net Income
72
31
103
(16)
87
89
3
92
Diluted Shares
184.6
184.6
186.2
186.2
Diluted EPS
0.39
$
0.17
$
0.56
$
(0.09)
$
0.47
$
0.48
$
0.01
$
0.49
$
a
One time separation costs
b
Tax impact of one time separation costs and special tax items
c
Incremental stand alone costs incurred in 2012
d
Incremental interest expense on long-term debt entered into in conjunction with the
spin. e
Tax
impact
of
incremental
interest
expense
and
stand
alone
costs
incurred
in
2012
Xylem Inc. Non-GAAP Reconciliation
Normalized and Adjusted Diluted EPS
($ Millions, except per share amounts) |
 26
Non-GAAP Reconciliation: Segment Operating Income
Adjusted Segment Operating Income
Q1
Q2
YTD
'12
'11
'12
'11
'12
'11
Total Revenue
•
Water Infrastructue
584
551
609
602
1,193
1,153
•
Applied Water
355
355
373
385
728
740
Operating Income
•
Water Infrastructue
75
64
93
94
167
158
•
Applied Water
40
46
52
50
92
96
Separation Costs
•
Water Infrastructue
2
-
1
2
3
2
•
Applied Water
1
-
-
-
1
-
Adjusted Operating Income*
•
Water Infrastructue
77
64
94
96
170
160
•
Applied Water
41
46
52
50
93
96
Operating Margin
•
Water Infrastructue
12.8%
11.6%
15.2%
15.6%
14.0%
13.7%
•
Applied Water
11.3%
13.0%
13.9%
13.0%
12.6%
13.0%
Adjusted Operating Margin*
•
Water Infrastructue
13.2%
11.6%
15.4%
15.9%
14.2%
13.9%
•
Applied Water
11.5%
13.0%
13.9%
13.0%
12.8%
13.0%
*Adjusted Operating Income excludes non-recurring separation costs
Xylem Inc. Non-GAAP Reconciliation
Segment Operating Income
($ Millions) |
  Non-GAAP Reconciliation: Free Cash Flow
27
2012
2011
Net Cash - Operating Activities
125
161
Capital Expenditures
(57)
(53)
Free Cash Flow, including separation costs
68
108
Separation Costs (Cash Paid incl. Capex)
18
26
Free Cash Flow, excluding separation costs
86
134
Net Income
152
150
Separation Costs, net of tax (incl. tax friction)
8
29
Adjusted Net Income
160
179
Free Cash Flow Conversion
54%
75%
Xylem Inc. Non-GAAP Reconciliation
Net Cash - Operating Activities vs. Free Cash Flow
For The Six Months Ended June 30, 2012 & 2011
($ Millions)
Six Months Ended |
 28
Non-GAAP Reconciliation: 2012 Xylem EBITDA & Adj. EBITDA
Q1
Q2
YTD
Income Before Taxes
84
115
199
Interest, net
13
13
26
Depreciation
23
21
44
Amortization
11
12
23
Stock Compensation
5
5
10
EBITDA
136
166
302
Separation Costs
5
6
11
Adjusted EBITDA
141
172
313
Revenue
925
966
1,891
Adjusted EBITDA Margin
15.2%
17.8%
16.6%
Xylem Inc. Non-GAAP Reconciliation
EBITDA and Adjusted EBITDA by Quarter
Total Xylem
($ Millions)
2012 |
  29
Non-GAAP Reconciliation: 2011 Xylem EBITDA & Adj. EBITDA
Q1
Q2
YTD
Income Before Taxes
101
115
216
Interest, net
-
-
-
Depreciation
22
25
47
Amortization
11
10
21
Stock
Compensation 3
2
5
EBITDA
137
152
289
Separation Costs
3
18
21
Adjusted
EBITDA 140
170
310
Revenue
890
971
1,861
Adjusted EBITDA Margin
15.7%
17.5%
16.7%
2011
Xylem Inc. Non-GAAP Reconciliation
EBITDA and Adjusted EBITDA by Quarter
Total Xylem
($ Millions) |
  30
Non-GAAP Reconciliation: 2012 Water Infrastructure EBITDA & Adj. EBITDA
Q1
Q2
YTD
Income Before Taxes
75
93
168
Interest, net
-
-
-
Depreciation
16
15
31
Amortization
10
9
19
Stock
Compensation 1
1
2
EBITDA
102
118
220
Separation Costs
2
1
3
Adjusted EBITDA
104
119
223
Revenue
584
609
1,193
Adjusted EBITDA Margin
17.8%
19.5%
18.7%
Xylem Inc. Non-GAAP Reconciliation
EBITDA and Adjusted EBITDA by Quarter
Water Infrastructure
($ Millions)
2012 |
  31
Non-GAAP Reconciliation: 2011 Water Infrastructure EBITDA & Adj. EBITDA
Q1
Q2
YTD
Income Before Taxes
65
93
158
Interest, net
-
-
-
Depreciation
16
19
35
Amortization
9
9
18
Stock
Compensation -
-
-
EBITDA
90
121
211
Separation Costs
-
2
2
Adjusted EBITDA
90
123
213
Revenue
551
602
1,153
Adjusted EBITDA Margin
16.3%
20.4%
18.5%
2011
Xylem Inc. Non-GAAP Reconciliation
EBITDA and Adjusted EBITDA by Quarter
Water Infrastructure
($ Millions) |
  32
Non-GAAP Reconciliation: 2012 Applied Water EBITDA & Adj. EBITDA
Q1
Q2
YTD
Income Before Taxes
40
52
92
Interest,
net -
-
-
Depreciation
6
6
12
Amortization
1
1
2
Stock Compensation
1
-
1
EBITDA
48
59
107
Separation Costs
1
-
1
Adjusted EBITDA
49
59
108
Revenue
355
373
728
Adjusted EBITDA Margin
13.8%
15.8%
14.8%
Xylem Inc. Non-GAAP Reconciliation
EBITDA and Adjusted EBITDA by Quarter
Applied Water
($ Millions)
2012 |
  33
Non-GAAP Reconciliation: 2011 Applied Water EBITDA & Adj. EBITDA
Q1
Q2
YTD
Income Before Taxes
46
51
97
Interest,
net -
-
-
Depreciation
6
6
12
Amortization
2
1
3
Stock Compensation
-
-
-
EBITDA
54
58
112
Separation Costs
-
-
-
Adjusted EBITDA
54
58
112
Revenue
355
385
740
Adjusted EBITDA Margin
15.2%
15.1%
15.1%
2011
Xylem Inc. Non-GAAP Reconciliation
EBITDA and Adjusted EBITDA by Quarter
Applied Water
($ Millions) |
 Non-GAAP Reconciliation: Guidance
34
Illustration of Mid Point Guidance
2012 Guidance
FY '11
FY '12
As Reported
Adjustments
Adjusted
Adjustments
Normalized
As Projected
Adjustments
Adjusted
Total Revenue
3,803
3,803
3,803
3,800
3,800
Segment Operating Income
503
29
a
532
(10)
d
522
524
25
h,i
549
Segment Operating Margin
13.2%
14.0%
13.7%
13.8%
14.4%
Corporate Expense
108
(58)
b
50
18
e
68
66
(11)
h
55
Operating Income
395
87
482
(28)
454
458
36
494
Operating Margin
10.4%
12.7%
11.9%
12.1%
13.0%
Interest Expense
(17)
(17)
(39)
f
(56)
(54)
(54)
Other Non-Operating Income (Expense)
5
5
5
(2)
(2)
Income before Taxes
383
87
470
(67)
403
402
36
438
Provision for Income Taxes
(104)
(8)
c
(112)
16
g
(96)
(99)
(10)
j
(109)
Net Income
279
79
358
(51)
307
303
26
329
Diluted Shares
185.3
185.3
186.3
186.3
Diluted EPS
1.50
$
0.43
$
1.93
$
(0.27)
$
1.66
1.63
0.14
1.77
a
One time separation costs incurred at the segment level
b
One time separation costs incurred at the corporate level
c
Net
tax
impact
of
above
items,
plus
the
addition
of
2011
special
tax
items
d
Incremental stand alone costs to be incurred in 2012 at the segment level ($10M)
e
Incremental stand alone costs to be incurred in 2012 at the corporate level ($18M)
f
Incremental interest expense on long-term debt to be incurred in 2012
g
Tax
impact
of
incremental
interest
expense
and
stand
alone
costs
to
be
incurred
in
2012
h
Expected one time separation costs of $7M and $11M to be incurred at the segments and
headquarters, respectively. i
Restructuring & realignment costs of $18M to be incurred at the segments.
j
Tax impact of one time separation, restructuring & realignment costs expected to be
incurred in 2012 and tax special items realized through Q2 2012. Xylem Inc. Non-GAAP
Reconciliation Guidance
($ Millions, except per share amounts) |
 Non-GAAP Reconciliation: Adj. Operating Income & Margin
35
Mid Point Guidance
2008
2009
2010
2011
2012E
Revenue
3,291
2,849
3,202
3,803
3,800
Operating Income
315
276
388
395
458
Operating Margin
9.6%
9.7%
12.1%
10.4%
12.1%
Restructuring & Realignment
41
31
15
-
18
Separation Costs
-
-
-
87
18
Adjusted Operating
Income 356
307
403
482
494
Adjusted Operating Margin
10.8%
10.8%
12.6%
12.7%
13.0%
Standalone Costs
-
-
-
5
28
Adj. Operating Income, excl.
Standalone Costs 356
307
403
487
522
Adjusted Operating Margin, excl.
Standalone Costs 10.8%
10.8%
12.6%
12.8%
13.7%
Xylem Inc. Non-GAAP Reconciliation
Adjusted Operating Income
($ Millions) |
 36
Phil De Sousa, Investor Relations Officer
(914) 323-5930
Janice Tedesco, Investor Relations Coordinator
(914) 323-5931
http://investors.xyleminc.com
NYSE: XYL |