Attached files
| file | filename |
|---|---|
| 8-K - FORM 8-K - REDWOOD TRUST INC | d386902d8k.htm |
| EX-99.1 - PRESS RELEASE DATED AUGUST 2, 2012 - REDWOOD TRUST INC | d386902dex991.htm |

|
|
|
TABLE OF CONTENTS
|

| Introduction |
4 | |||
| Shareholder Letter |
5 | |||
| Quarterly Overview |
7 | |||
| Financial Insights |
12 | |||
| u Balance Sheet |
12 | |||
| u GAAP Income |
16 | |||
| u REIT Taxable Income and Dividends |
20 | |||
| u Cash Flow |
21 | |||
| Sequoia Residential Mortgage Loan Business |
23 | |||
| Residential Real Estate Securities |
24 | |||
| Commercial Real Estate Business |
27 | |||
| Investments in Consolidated Entities |
29 | |||
| Appendix |
31 | |||
| Eminent Domain Discussion |
32 | |||
| Accounting Discussion |
33 | |||
| Glossary |
34 | |||
| Financial Tables |
41 | |||
| THE REDWOOD REVIEW | 2ND QUARTER 2012 | 1 |
|
|
|
CAUTIONARY STATEMENT
|
This Redwood Review contains forward-looking statements within the meaning of the safe harbor provisions of the Private Securities Litigation Reform Act of 1995. Forward-looking statements involve numerous risks and uncertainties. Our actual results may differ from our expectations, estimates, and projections and, consequently, you should not rely on these forward-looking statements as predictions of future events. Forward-looking statements are not historical in nature and can be identified by words such as “anticipate,” “estimate,” “will,” “should,” “expect,” “believe,” “intend,” “seek,” “plan,” and similar expressions or their negative forms, or by references to strategy, plans, or intentions. These forward-looking statements are subject to risks and uncertainties, including, among other things, those described in our Annual Report on Form 10-K for the year ended December 31, 2011 under the caption “Risk Factors.” Other risks, uncertainties, and factors that could cause actual results to differ materially from those projected are described below and may be described from time to time in reports we file with the Securities and Exchange Commission, including reports on Forms 10-K, 10-Q, and 8-K. We undertake no obligation to update or revise forward-looking statements, whether as a result of new information, future events, or otherwise.
Statements regarding the following subjects, among others, are forward-looking by their nature: (i) our statements relating to our overall outlook for Redwood and where Redwood is headed in the future, our statement relating to our ability to pivot in response to changes in the mortgage finance market, our statement that we like the new opportunities that are opening up for our business, our statement that recent developments and the stabilizing housing sector have us well positioned for the second half of 2012 and for 2013, our statement that our residential business has the potential to generate sustainable earnings power, and statements relating to our plan to drive earnings higher; (ii) our statements relating to opportunities to invest in residential securities, our belief that there will continue to be sufficient market liquidity for the types of residential securities investments that we are financing in part with short-term debt, and any statements relating to how we might use various types of debt financing to finance residential securities investments in the future; (iii) any statements relating to future activities we may engage, including that we hope to be an active seller of loans to the GSE by the end of the fourth quarter of 2012 and any statements relating to our future level of investment in mortgage servicing rights and the profitability of such investments, future sales of whole loans (other than through securitization transactions) and the profitability of such sales; (iv) any statements relating to our competitive position and our ability to compete in the future (and our statement that on the competitive front, things are slowly improving due to certain large banks reducing or eliminating their wholesale lending channels), including our ability to effectively compete to acquire residential securities and residential mortgage loans and our ability to compete to originate and acquire commercial debt investments; (v) any statements relating to our future investment strategy and our ability to find investments with attractive risk return profiles, including, without limitation, statements relating to our efforts to acquire residential mortgage loans, make commercial debt investments, and make investments in residential securities in the secondary market; (vi) our statement that we are on track to reach our goal of investing $400 million or more of equity capital in third-party residential securities, new Sequoia residential securities, and commercial debt investments; (vii) our statement that, in our opinion, proposed programs under which municipalities would acquire mortgage loans through eminent domain as a means by which to modify the terms of those loans for homeowners will not gain meaningful nationwide traction; (viii) our statement that we are currently on track to meet or exceed our 2012 goal of purchasing of $2 billion of residential mortgage loans in 2012, our statements relating to acquiring the residential mortgage loans included in our pipeline of residential mortgage loans that we have identified for purchase or plan to purchase, including the amount of such loans that we planned to purchase or have identified for purchase at June 30, 2012 and July 31, 2012, and our statement that it is our intent to
| 2 | THE REDWOOD REVIEW | 2ND QUARTER 2012 |
|
|
|
CAUTIONARY STATEMENT
|
finance our residential mortgage loans held for sale primarily through the use of warehouse lines of credit; (ix) statements relating to future residential loan securitization and sale transactions, the timing of the completion of those future transactions, and the number and size of those transactions we expect to complete in 2012 and future periods, which future transactions may not be completed when planned or at all, and, more generally, statements regarding the likelihood and timing of, and our participation in, future transactions of these types and our ability to finance residential loan acquisitions through the execution of these types of transactions, and the profitability of these transactions; (x) our statement that we expect to recover an aggregate of $5 million of loan loss reserves that relate to none Sequoia securitization entities in future periods upon the payoff or deconsolidation of those entities; (xi) any statements relating to the cash flows we expect to receive from our investments; (xii) our statements relating to our estimate of our investment capacity (including that we estimate our investment capacity was $90 million at June 30, 2012) and our statement that we believe this level of investment capacity should sustain our capital needs into the fourth quarter of 2012; (xiii) any statements relating to future market and economic conditions and the future volume of transactions in those markets, including, without limitation, future conditions in the residential and commercial real estate markets and related financing markets, and the related potential opportunities for our residential and commercial businesses; (ivx) our beliefs about, and our outlook for, the future direction of housing market fundamentals, including, without limitation, home prices, household formation and demand for housing, delinquency rates, foreclosure rates, prepayment rates, inventory of homes for sale, and mortgage interest rates and their potential impact on our business and results of operations and our beliefs that certain delinquency trends should eventually cause total mortgage delinquencies to fall, that, absent a second recession, low interest rates should protect from additional downside movement in home prices, that we believe housing prices are in the process of stabilizing, and that we do not expect housing, in general, to be a significantly appreciating asset class for several years; (xv) any statements relating to the future direction of commercial real estate fundamentals and statements regarding the competitive landscape for, and availability of, financing for commercial real estate; (xvi) our statements that we expect that mezzanine lending opportunities will continue to drive our commercial investment activity for the next few quarters, that we believe we can originate (and are targeting) between $200 and $250 million in commercial mezzanine loans in 2012, that we anticipate an increase in our senior commercial loan origination activity in the near term (and any statements about the potential to generate fees or other income by originating such senior mortgage loans), and that we currently plan on establishing a financing facility for our commercial loans by the end of 2012 and plan on eventually completing a non-recourse term financing of our commercial loans in later 2012 or 2013; (xvii) our expectations regarding credit reserves, credit losses, the adequacy of credit support, and impairments and their impact on our investments (including as compared to our original expectations and credit reserve levels) and the timing of losses and impairments, and statements that the amount of credit reserves we designate are adequate or may require changes in the future; (xviii) any statements relating to our expectations regarding future interest income and net interest income, future earnings, future gains, future earnings volatility, and future trends in operating expenses and the factors that may affect those trends, including that we expect the level of operating expense in the third quarter of 2012 to be similar to the level of operating expense in the second quarter of 2012; (ixx) our Board of Directors’ intention to pay a regular dividend of $0.25 per share per quarter in 2012; and (xx) our expectations and estimates relating to the characterization for income tax purposes of our dividend distributions and our expectations and estimates relating to tax accounting and our anticipation of additional credit losses for tax purposes in future periods (and, in particular, our statement that, for tax purposes, we expect an additional $130 million of credit losses on residential securities to be realized over an estimated three-to-five year period).
| THE REDWOOD REVIEW | 2ND QUARTER 2012 | 3 |
|
|
|
INTRODUCTION
|
Note to Readers:
We file annual reports (on Form 10-K) and quarterly reports (on Form 10-Q) with the Securities and Exchange Commission. These filings and our earnings press releases provide information about Redwood and our financial results in accordance with generally accepted accounting principles (GAAP). We urge you to review these documents, which are available through our web site, www.redwoodtrust.com.
This document, called The Redwood Review, is an additional format for providing information about Redwood through a discussion of many GAAP as well as non-GAAP metrics, such as taxable income and economic book value. Supplemental information is also provided in the Financial Tables in this Review to facilitate more detailed understanding and analysis of Redwood. When we use non-GAAP metrics it is because we believe that these figures provide additional insight into Redwood’s business. In each case in which we discuss a non-GAAP metric you will find an explanation of how it has been calculated, why we think the figure is important, and a reconciliation between the GAAP and non-GAAP figures.
References herein to “Redwood,” the “company,” “we,” “us,” and “our” include Redwood Trust, Inc. and its consolidated subsidiaries. References to “at Redwood” exclude all consolidated securitization entities (with the exception of the resecuritization we completed in the third quarter of 2011) in order to present our operations in the way management analyzes them.
Note that because we round numbers in the tables to millions, except per share amounts, some numbers may not foot due to rounding.
We hope you find this Review helpful to your understanding of our business. We thank you for your input and suggestions, which have resulted in our changing the form and content of The Redwood Review over time.
We welcome your continued interest and comments.
|
Selected Financial Highlights
| ||||||||||||
| Quarter: Year | GAAP Income (Loss) per Share |
REIT Taxable Income (Loss) per Share(1) |
Annualized GAAP Return on Equity |
GAAP
Book Value per Share |
Non-GAAP Economic Value per Share (2) |
Dividends per Share | ||||||
| Q210 | $0.35 | $0.04 | 11% | $12.71 | $13.37 | $0.25 | ||||||
| Q310 | $0.25 | ($0.11) | 8% | $13.02 | $13.73 | $0.25 | ||||||
| Q410 | $0.18 | ($0.01) | 6% | $13.63 | $14.31 | $0.25 | ||||||
| Q111 | $0.22 | $0.09 | 8% | $13.76 | $14.45 | $0.25 | ||||||
| Q211 | $0.11 | $0.02 | 4% | $13.04 | $13.81 | $0.25 | ||||||
| Q311 | $0.01 | $0.09 | 1% | $12.22 | $13.33 | $0.25 | ||||||
| Q411 | ($0.03) | $0.04 | (1%) | $11.36 | $12.45 | $0.25 | ||||||
| Q112 | $0.37 | $0.13 | 13% | $12.22 | $13.18 | $0.25 | ||||||
| Q212 | $0.24 | $0.22 | 8% | $12.00 | $12.87 | $0.25 | ||||||
| (1) REIT taxable income (loss) per share for 2011 and 2012 are estimates until we file tax returns for those years. | ||||||||||||
| (2) Non-GAAP economic value per share is calculated using estimated bid-side values (which take into account available bid-side marks) for our financial assets and estimated offer-side values (which take into account available offer-side marks) for our financial liabilities and we believe it more accurately reflects liquidation value than does GAAP book value per share. Non-GAAP economic value per share is reconciled to GAAP book value per share in the Financial Insights section and in Table 3 in the Financial Tables in this Review. | ||||||||||||
| 4 | THE REDWOOD REVIEW | 2ND QUARTER 2012 |
|
|
|
SHAREHOLDER LETTER
|
Dear Fellow Shareholders:
At the mid-year point, we are on track to deliver on our “three big themes” for 2012: improving our capital efficiency, getting fully invested, and building the franchise value of our residential and commercial businesses.
Our arduous two-year effort to rebuild and reposition our residential and commercial loan businesses is beginning to pay off. It increasingly looks like we made some good calls in handicapping the investment landscape and in positioning our businesses so they have options to pivot in response to changes in the evolving mortgage finance market. We are a long way from declaring victory, but we like our steady progress, the way the playing field is slowly tilting in our direction, and the new opportunities that are opening up for our businesses.
Our basic strategy for success — in a deleveraging world, one awash with liquidity and dominated by government intervention — is to build operating businesses capable of creating their own investments and fee-generating opportunities. That means building flexible and scalable loan platforms and having the right skill sets to unite and bring value to lenders and investors. The upfront investment has been a drag on earnings. Now, with the operating leverage we have built into our businesses, the plan is to ramp loan volume and seek to drive earnings higher.
On the residential front, we are making good progress toward this goal. In June, we completed our third jumbo-loan securitization of 2012, compared to completing only two securitizations in all of 2011, and we have laid the groundwork for additional securitizations in the second half of 2012. Each of our six securitizations in the post-crisis period has been met with strong investor demand. More importantly, the economics of our deals have remained attractive, the number of sellers we buy loans from is increasing, and the volume of loans we have identified to purchase is rising.
Outside our securitization activities, we have also been active in buying and selling hybrid mortgage loans to generate fee income. Our next step is to add conforming loans to our product menu. We are now in the process of getting approval to sell loans to Fannie Mae and Freddie Mac. We hope to be an active GSE loan seller by the end of the fourth quarter.
On the competitive front, things are also slowly improving. All four of the biggest U.S. banks have announced a significant reduction or complete elimination of their wholesale lending channels. Many small originators will now need to find new buyers, such as Redwood, to purchase their loans.
We are also hopeful that the stabilizing housing market will reduce pressure on Congress to maintain the government’s current dominant presence in the mortgage market. The decision in the Fall of 2011 to allow the temporary increase in the conforming loan limits to lapse did not have an adverse effect on the housing market, as the private sector immediately stepped up and provided mortgage financing to this portion of the market on attractive terms to borrowers.
On the commercial side, our team had its biggest production quarter to date for mezzanine loans. We are focused on a number of initiatives, including obtaining interim and permanent financing to increase the returns on our commercial portfolio and recycle capital for reinvestment. We expect to continue to originate attractive mezzanine loans and eventually transition to originating senior loans that can be sold to investors and generate fee income as well as additional mezzanine lending opportunities. We completed our first such senior loan transaction in the second quarter.
| THE REDWOOD REVIEW | 2ND QUARTER 2012 | 5 |
|
|
|
SHAREHOLDER LETTER
|
Our ramped up investment pace will likely cause us to consider options for raising capital toward the end of the year. Rest assured, our financial incentives are closely aligned with yours and we “get it” when it comes to potential dilution from issuing common equity. As an internally managed company, our compensation is tied to return on equity, and is not based on the amount of equity. Additionally, we are shareholders as well. Our decision process will be based on what we believe is in the best long-term interest of shareholders.
Building anything valuable almost always seems to cost more and take longer. At the end of the day, the most important thing is — did you build it right? Your team at Redwood is bullish about where we are and where we are headed.
As an aside, we are loath to add to the media hype surrounding the proposed use of eminent domain by several California municipalities to acquire performing underwater mortgages out of private-label securitization trusts, but here are some of our thoughts and we have included a summary discussion of this topic in an Appendix. In our opinion, at the end of the day (which likely means years), this program will not gain meaningful nationwide traction. It faces constitutional and other legal hurdles, and strong investor opposition. Additionally, there does not appear to be meaningful Federal support for the plan, which, if implemented broadly, would be detrimental to the GSEs and federally insured banks. Importantly, it is likely that if a municipality adopts the program, its homeowners will face higher mortgage rates, as the providers of the capital who fund residential loans need assurance that mortgage loans won’t be cherry-picked and seized for private gain. We would not be surprised if some lenders ring-fenced participating municipalities and cut off financing completely.
As always, thank you for your patience and continued support.

|

| |
| Martin S. Hughes | Brett D. Nicholas | |
| CEO | President |
| 6 | THE REDWOOD REVIEW | 2ND QUARTER 2012 |
|
|
|
QUARTERLY OVERVIEW
|
Second Quarter 2012 Results
Overview
We made steady progress in the second quarter of 2012, particularly in the face of a slowing U.S. economy and an escalating fiscal crisis in Europe. We continued to put excess capital to work, we completed our third securitization in 2012 with good economics, and we added a number of new loan sellers to our residential conduit. Additionally, the size of our residential loan pipeline grew at a rate that exceeded our projections and could potentially allow us to complete another two securitizations before the end of the year. Our commercial business was able to more than double its loan production from the first quarter of 2012 and is making headway into the senior commercial loan origination space. We believe that these developments — along with a stabilizing housing sector that bucked the overall downward economic trend we observed in the second quarter — have us well positioned for the second half of 2012 and for 2013.
In the second quarter of 2012, we were successful in growing investment income, supplementing this income with mortgage banking profits, and containing our overhead expenses. Our reported GAAP earnings were $0.24 per share for the second quarter of 2012 and reflected a $3 million (or 11%) increase in net interest income compared to the first quarter of 2012, primarily as a result of interest generated by new assets we acquired after ramping up our investment activity in the first half of the year. While our $2 million of income from mortgage banking activities was lower than the $4 million we reported in the first quarter of 2012, the overall decline in mortgage banking income was largely due to timing — our first quarter results included an additional securitization (in January 2012) made up of loans from our 2011 pipeline (loans we hold for sale and loans we plan to purchase). The economics of our recent securitizations continued to improve in the second quarter of 2012 and we became active in the whole loan sales market. As we detail in the Sequoia Residential Mortgage Loan Business section of this Quarterly Overview, we are currently on track to meet or exceed our 2012 goals for the volume of residential loans acquired and Sequoia securitizations completed.
Our second quarter 2012 GAAP income was also affected by a $5 million mark-to-market (MTM) decline in the value of our residential interest-only (IO) securities due to declining mortgage rates during the quarter. But, not surprisingly, there is more to the story from an earnings standpoint. We hold IOs as investments, but also consider potential valuation changes due to their sensitivity to interest movements as part of our overall risk management strategy for our pipeline. Why? Generally speaking, we would expect the value of our pipeline to move in the opposite direction of our IO securities (i.e., if mortgage rates decline, then the pipeline value should increase). At June 30, 2012, we believe that economically the $5 million MTM decline on our IO securities was offset by pipeline gains. However, for accounting purposes at quarter end, we are not allowed to recognize any of our pipeline gains until the loans are accumulated and sold. On the other hand, we are required to recognize the MTM declines on our IO securities. We expect this accounting timing difference to reverse as we sell loans in the third and fourth quarters of 2012. For your sake, we wish it was not that complicated.
To us, an important take-away from our GAAP results for the second quarter of 2012 is that our residential business has the potential to generate sustainable earnings power that could result from continued positive margins on our sales or securitizations of residential loans, and additional long-term investments in Sequoia securities that we believe will generate attractive returns over time. The “GAAP Income” section of this Redwood Review provides additional details on our earnings for the second quarter of 2012.
| THE REDWOOD REVIEW | 2ND QUARTER 2012 | 7 |
|
|
|
QUARTERLY OVERVIEW
|
Overview (continued)
We paid a quarterly dividend of $0.25 per share for both the first and second quarters of 2012. While our GAAP earnings of $0.61 per share through the first half of 2012 exceeded the $0.50 per share we distributed to shareholders over the same period, our REIT taxable income of $0.35 per share continues to be affected by the timing of credit losses on legacy investments and remains subdued. As we further describe in the REIT Taxable Income section of this Redwood Review, the credit losses we currently expect to realize in 2012 to determine our taxable income were substantially reserved for in prior years for GAAP reporting purposes.
Our GAAP book value declined to $12.00 per share at June 30, 2012. While net income nearly offset our dividend, the rally in Treasury prices during the quarter reduced the value of our hedge for our long-term debt by $0.19 per share. Combining these and other factors, our GAAP book value decreased to $12.00 per share in the second quarter of 2012 from $12.22 per share at the end of the first quarter of 2012, as detailed in the following table.
|
Changes in GAAP Book Value Per Share |
||||||||||||
| ($ in per share)
|
| |||||||||||
| Q2 2012 | Q1 2012 | Variance | ||||||||||
|
Beginning book value |
$ | 12.22 | $ | 11.36 | $ | 0.86 | ||||||
| Net income |
0.24 | 0.37 | (0.13 | ) | ||||||||
| Dividends |
(0.25 | ) | (0.25 | ) | - | |||||||
| Unrealized (losses) gains on hedges |
(0.19 | ) | 0.18 | (0.37 | ) | |||||||
| Unrealized gains on securities |
0.03 | 0.52 | (0.49 | ) | ||||||||
| Other, net
|
(0.05 | ) | 0.04 | (0.09 | ) | |||||||
|
Ending book value |
$ | 12.00 | $ | 12.22 | $ | (0.22 | ) | |||||
During the second quarter of 2012, our estimate of non-GAAP economic value decreased by $0.31 per share to $12.87 per share. The decrease was a result from $0.26 per share valuation change in our long-term debt and associated hedge liabilities, $0.21 per share of cash operating and interest expense, $0.25 per share of dividends paid to shareholders, and $0.05 per share from other items. These decreases were offset by $0.46 in cash flow and net positive market valuations on our securities and investments.
| 8 | THE REDWOOD REVIEW | 2ND QUARTER 2012 |
|
|
|
QUARTERLY OVERVIEW
|
Investment and Portfolio Sales Activity
During the second quarter of 2012, our capital deployment remained elevated and on track to reach our goal of investing $400 million or more of equity capital during 2012. We put $112 million of equity capital to work during the second quarter of 2012 to acquire $195 million of investments (and used $83 million of short-term debt to finance a portion of these new investments). Highlights of the quarter included our June Sequoia securitization, additional secondary investments in senior third-party residential mortgage-backed securities (RMBS), and investments in eight newly originated commercial mezzanine loans. The following table summarizes our first half of 2012 investment activity.
|
Quarterly Investment Activity |
| |||||||||||||||
| ($ in millions)
|
| |||||||||||||||
| Q2 2012 | Q1 2012 | YTD 2012 | ||||||||||||||
|
New Sequoia RMBS |
$ | 23 | $ | 61 | $ | 84 | ||||||||||
| Third-party RMBS |
103 | 223 | 326 | |||||||||||||
| Less: Short-term debt |
(83 | ) | (175 | ) | (258 | ) | ||||||||||
| Total residential |
43 | 109 | 152 | |||||||||||||
| Commercial loans
|
69 | 27 | 96 | |||||||||||||
| Equity capital invested |
$ | 112 | $ | 136 | $ | 248 | ||||||||||
In the second quarter, we sold $49 million of third-party RMBS and realized GAAP gains of $7 million on these sales.
At June 30, 2012, we estimate our investment capacity, defined as the amount of capital we have readily available for long-term investments, was $90 million, compared to $183 million at March 31, 2012. Based on our current expectation for new investment activity and our ability to recycle capital, we believe this capacity should sustain our capital needs into the fourth quarter of 2012. Our efforts to raise capital for new investments could include freeing up additional capital internally through sales or asset-specific financings, the issuance of corporate debt or preferred equity, or the issuance of common equity. Our approach to raising capital will continue to be based on what we believe to be in the best long-term interest of shareholders.
| THE REDWOOD REVIEW | 2ND QUARTER 2012 | 9 |
|
|
|
QUARTERLY OVERVIEW
|
Residential Loan Business
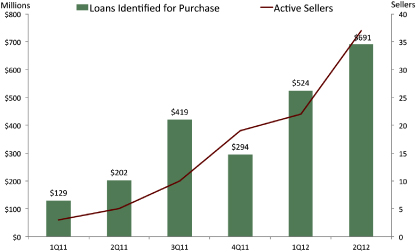
Our residential loan business continues to gain momentum. In the second quarter of 2012, we completed one $294 million securitization (SEMT 2012-3), our third securitization this year, and retained $23 million (market value) of securities for our investment portfolio. We also completed two whole loan sales totaling $86 million. We added 17 loan sellers to our conduit during the second quarter to increase the total to 37 at June 30, 2012. Perhaps most notably, the volume of loans we identified for purchase increased to $691 million in the second quarter, up from $524 million in the first quarter and $294 million in the fourth quarter of 2011.
Our second quarter securitization produced a GAAP gain of $4 million before hedge costs. Similar to our March 2012 securitization, by entering into a preliminary agreement with the underwriter of the transaction, we were able to reduce our hedging timeframe and costs, which contributed to the positive results from executing this transaction.
In anticipation of future securitizations, we held $254 million of residential loans at June 30, 2012, and at July 31, 2012, we held $383 million and had identified another $518 million that we planned to purchase. We currently expect to complete our next securitization in the third quarter of 2012. We are selectively adding regional and community banks as well as independent mortgage companies to our seller list. We continue to find growing interest from loan sellers who want to work with an established loan aggregator like Redwood, which works to our advantage because there are fewer of us as a result of the financial crisis and the reduction in wholesale origination at the major banks. Additionally, bank loan sellers appreciate that Redwood is not a bank and, therefore, not a competitor for their customer relationships. With 37 loan sellers at June 30, 2012, we are comfortably on track to exceed our year-end 2012 goal of 40 sellers and now expect 50 sellers by the end of the year. We continue to target purchasing at least $2 billion of residential loans in 2012 and believe we are on track to meet or exceed that amount.
At the end of the second quarter of 2012, we owned mortgage servicing rights (MSRs) on $364 million of prime-quality jumbo residential loans that were sourced through our conduit. The capitalized value of these MSRs was $2 million, or 55 basis points of the mortgage loans. We earn fees from these MSRs, but do not service any loans in-house, nor do we currently plan to do so.
| 10 | THE REDWOOD REVIEW | 2ND QUARTER 2012 |
|
|
|
QUARTERLY OVERVIEW
|
Commercial Real Estate Business
We originated eight additional commercial loans totaling $69 million in the second quarter of 2012, up from five loans and $27 million in the first quarter of 2012. At June 30, 2012, our commercial portfolio is comprised of 26 loans totaling $247 million made in connection with third parties (banks, insurance companies, and Freddie Mac) that originated nearly $1.6 billion of new commercial mortgages on multifamily, office, self-storage, and hospitality properties. As we expected, the pace of our investment activity increased from the prior quarter, and we expect that mezzanine lending opportunities will continue to drive our commercial investment activity for the next few quarters. Currently, our commercial portfolio generates a gross yield of 10% and is funded entirely with equity capital.
While we believe we can originate between $200 million and $250 million of commercial loans in 2012, we are currently allocating no more than $300 million of equity capital to our commercial business. We expect this business to grow organically through the future establishment of a repurchase facility and eventual completion of term financing through a non-recourse securitization of our loan portfolio in late 2012 or 2013.
Residential Securities Portfolio
From the standpoint of non-agency RMBS investors, the second quarter of 2012 was volatile in sentiment without a sustained bullish or bearish trend in pricing. Prices were well supported through the middle of the second quarter, with good liquidity and steady two-way demand for buying and selling securities. Concerns about Europe began to resurface during the second half of the quarter, with many market makers unwilling to add to their investment positions. The tone changed again in mid-July, and the general level of prices increased for non-agency RMBS. We continue to expect volatility and select buying opportunities as the market remains sensitive to macroeconomic indicators and the headlines coming from Europe.
In the second quarter of 2012, we continued employing what we believe to be prudent amounts of short-term recourse financing against our securities portfolio in order to free up equity capital for additional long-term investments. Most of the RMBS we are currently financing are more liquid senior securities that have demonstrated strong investor demand. We believe there will continue to be sufficient market liquidity for these types of RMBS investments, particularly with the changes to regulatory capital rules that were announced for banks in early June. These capital requirements are substantially reduced for seasoned, higher-quality non-investment grade RMBS with sufficient credit support.
At June 30, 2012, our residential securities portfolio totaled $1 billion and was financed with a combination of $360 million of short-term debt, $193 million of non-recourse resecuritization debt, and $447 million of equity capital.
| THE REDWOOD REVIEW | 2ND QUARTER 2012 | 11 |
|
|
|
FINANCIAL INSIGHTS
|
Balance Sheet
| u | The following table shows the components of our balance sheet at June 30, 2012. |
|
Consolidating Balance Sheet |
| |||||||||||
| June 30, 2012 ($ in millions)
|
| |||||||||||
| At Redwood |
Consolidated Entities |
Redwood
Consolidated |
||||||||||
| Residential loans |
$ | 256 | $ | 3,216 | $ | 3,472 | ||||||
| Commercial loans |
247 | 12 | 259 | |||||||||
| Real estate securities - Third party |
983 | 255 | 1,237 | |||||||||
| Real estate securities - Sequoia |
74 | - | 74 | |||||||||
| Cash and cash equivalents |
70 | - | 70 | |||||||||
| Total earning assets |
1,629 | 3,483 | 5,112 | |||||||||
| Other assets
|
97 | 37 | 134 | |||||||||
| Total assets |
$ | 1,726 | $ | 3,520 | $ | 5,246 | ||||||
| Short-term debt |
$ | 455 | $ | - | $ | 455 | ||||||
| Other liabilities |
74 | 62 | 136 | |||||||||
| Asset-backed securities issued |
193 | 3,371 | 3,564 | |||||||||
| Long-term debt |
140 | - | 140 | |||||||||
| Total liabilities |
862 | 3,433 | 4,295 | |||||||||
| Stockholders’ equity
|
864 | 87 | 951 | |||||||||
| Total liabilities and equity |
$ | 1,726 | $ | 3,520 | $ | 5,246 | ||||||
| u | We present this table to highlight the impact that our Consolidated Entities had on our GAAP balance sheet at June 30, 2012. As shown, Redwood’s $87 million GAAP investment in these consolidated entities increased our consolidated assets by $3.5 billion and liabilities by $3.4 billion. |
| u | We are required under GAAP to consolidate the assets and liabilities of certain Sequoia and Acacia securitizations that are treated as secured borrowing transactions. However, the securitized assets of these entities are not available to Redwood. Similarly, the liabilities of these entities are obligations payable only from the cash flow generated by their securitized assets and are not obligations of Redwood. |
| u | Included in Consolidated Entities are $3.2 billion of assets related to Sequoia securitizations (representing securitizations that were completed before 2012 and accounted for under GAAP as secured borrowings) and $303 million of assets related to Acacia securitization entities. The three securitizations that we completed since the beginning of 2012 were accounted for under GAAP as sales of assets. As a result, these securitizations were not consolidated and are not reflected in Consolidated Entities. The securities we retained from those securitizations are reflected on our balance sheet in Real Estate Securities — Sequoia. |
| u | The consolidating balance sheet presents the assets and liabilities of the resecuritization we completed during the third quarter of 2011 at Redwood, although these assets and liabilities are owned by the resecuritization entity and are legally not ours and we own only the securities and interests that we acquired from the resecuritization entity. At June 30, 2012, the resecuritization accounted for $325 million of assets ($323 million of available-for-sale securities at fair value and $2 million of other assets) and $193 million of asset-backed securities issued (at historical cost). Our $132 million investment in this resecuritization equals the difference between these assets and liabilities. |
| 12 | THE REDWOOD REVIEW | 2ND QUARTER 2012 |
|
|
|
FINANCIAL INSIGHTS
|
Balance Sheet (continued)
Real Estate Loans
| u | At June 30, 2012, we had $256 million of unsecuritized residential real estate loans, as compared to $303 million at March 31, 2012. The decrease reflects $339 million of residential loan acquisitions less $5 million of principal payments, $86 million of whole loan sales, and $294 million from the most recent securitization. The majority of our unsecuritized residential real estate loans (and others we have identified for future acquisition) is intended to be securitized in future periods. See the Sequoia Residential Mortgage Loan Business section on page 23 for more information. |
| u | At June 30, 2012, we had $247 million of commercial loans (excluding $12 million of legacy commercial loans at Acacia), as compared to $178 million at March 31, 2012. The increase reflects the origination of eight loans totaling $69 million. See the Commercial Real Estate Business section beginning on page 27 for more information. |
Real Estate Securities
| u | The following table presents the fair value of real estate securities at Redwood at June 30, 2012. We segment our securities portfolio by vintage (the year(s) the securities were issued), priority of cash flow (senior, re-REMIC, and subordinate), and by the quality of underlying loans (prime and non-prime). |
|
Real Estate Securities at Redwood (1) June 30, 2012 ($ in millions) |
||||||||||||||||||||||||
| % of Total | ||||||||||||||||||||||||
| <=2004 | 2005 | 2006-2008 | 2012 (3) | Total | Securities | |||||||||||||||||||
| Residential |
||||||||||||||||||||||||
| Prime |
$ | 25 | $ | 184 | $ | 282 | $ | 16 | $ | 507 | 48 | % | ||||||||||||
| Non-prime (2) |
100 | 159 | 6 | - | 265 | 25 | % | |||||||||||||||||
| Total Seniors |
$ | 125 | $ | 343 | $ | 288 | $ | 16 | $ | 772 | 73 | % | ||||||||||||
| Re-REMIC |
||||||||||||||||||||||||
| Prime |
$ | 2 | $ | 56 | $ | 89 | $ | - | $ | 147 | 14 | % | ||||||||||||
| Total Re-REMIC |
$ | 2 | $ | 56 | $ | 89 | $ | - | $ | 147 | 14 | % | ||||||||||||
| Subordinates |
||||||||||||||||||||||||
| Prime |
$ | 56 | $ | 7 | $ | 3 | $ | 58 | $ | 124 | 11 | % | ||||||||||||
| Non-prime (2) |
8 | - | - | - | 8 | 1 | % | |||||||||||||||||
| Total Subordinates |
$ | 64 | $ | 7 | $ | 3 | $ | 58 | $ | 132 | 12 | % | ||||||||||||
| Total Residential |
$ | 191 | $ | 406 | $ | 380 | $ | 74 | $ | 1,051 | 99 | % | ||||||||||||
| Commercial subordinates
|
$
|
5
|
|
$
|
1
|
|
$
|
-
|
|
$
|
-
|
|
$
|
6
|
|
|
1
|
%
| ||||||
|
Total real estate securities |
$ | 196 | $ | 407 | $ | 380 | $ | 74 | $ | 1,057 | 100 | % | ||||||||||||
(1) Included in the residential securities table above are $323 million of senior securities that are included in a resecuritization that we completed in July 2011. Under GAAP accounting, we account for the resecuritization as a financing even though these securities are owned by the resecuritization entity and are legally not ours. We own only the securities and interests that we acquired from the resecuritization entity, which amounted to $128 million at June 30, 2012. As a result, to adjust at June 30, 2012 for the legal and economic interests that resulted from the resecuritization, Total Residential Senior Securities would be decreased by $323 million to $449 million, Total Re-REMIC Residential Securities would be increased by $128 million to $275 million, and Total Residential Securities would be reduced by $195 million to $856 million.
(2) Non-prime residential securities consist of $271 million of Alt-A senior and subordinate and $2 million of subprime subordinate securities.
(3) All of the securities from the 2012 vintage have been retained from our Sequoia securitizations.
| THE REDWOOD REVIEW | 2ND QUARTER 2012 | 13 |
|
|
|
FINANCIAL INSIGHTS
|
Balance Sheet (continued)
Real Estate Securities (continued)
| u | The table below details the change in fair value of securities at Redwood during the second and first quarters of 2012. |
|
Real Estate Securities at Redwood |
| |||||||
| ($ in millions)
|
| |||||||
| Three Months Ended | ||||||||
| 6/30/2012 | 3/31/2012 | |||||||
| Beginning fair value |
$ | 1,009 | $ | 751 | ||||
| Acquisitions |
126 | 284 | ||||||
| Sales |
(49 | ) | (53 | ) | ||||
| Gain on sale |
7 | 6 | ||||||
| Effect of principal payments |
(33 | ) | (20 | ) | ||||
| Change in fair value, net |
(3 | ) | 41 | |||||
| Ending fair value |
$ | 1,057 | $ | 1,009 | ||||
| u | Our acquisitions in the second quarter included $95 million of prime senior securities, $14 million of Alt-A senior securities, and $17 million of prime subordinate securities. These acquisitions include $23 million of retained securities from our most recent securitization. The amount of equity capital deployed for these acquisitions was $43 million, net of short-term borrowings. |
Investments in the Securitization Entities
| u | Our investments in Consolidated Entities, as estimated for GAAP, totaled $87 million at June 30, 2012. This amount reflects the estimated book value of our retained investments in these entities based on the difference between the consolidated assets and liabilities of the entities in the aggregate according to their GAAP carrying amounts. Management’s estimate of the non-GAAP economic value of our investments in Consolidated Entities was $94 million. Of this amount, $46 million consisted of IOs at Sequoia entities and $48 million consisted of senior and subordinate securities we retained at Sequoia and Acacia entities. To determine this estimate of non-GAAP economic value, we used the same valuation process that we follow to fair value our other real estate securities as described in the Accounting Discussion in the Appendix. |
| 14 | THE REDWOOD REVIEW | 2ND QUARTER 2012 |
|
|
|
FINANCIAL INSIGHTS
|
Balance Sheet (continued)
Debt
| u | At June 30, 2012, we had short-term mortgage warehouse debt outstanding of $95 million, which was used to finance a portion of our $256 million inventory of residential mortgage loans held for sale. At June 30, 2012, we had two uncommitted mortgage warehouse facilities with an aggregate borrowing capacity of $400 million. In addition, subsequent to June 30, 2012, we established an additional uncommitted warehouse facility with a borrowing capacity of $200 million. It is our intent to finance our residential mortgage loans held for sale primarily through the use of warehouse lines. |
| u | At June 30, 2012, we had short-term debt incurred through securities repurchase facilities of $360 million secured by $473 million of our RMBS at market value, resulting in a debt-to-equity leverage ratio for these RMBS of 3.2x (excluding the portion of our cash we designate as a liquidity capital cushion related to these short-term borrowings). |
| u | At June 30, 2012, we had $193 million outstanding of asset-backed debt issued at a stated interest rate of 1-month LIBOR plus 200 basis points related to our resecuritization of senior securities with a market value of $323 million. For GAAP, Redwood’s investment in the resecuritized assets is the difference between the outstanding balance of the resecuritized securities (including other assets of $2 million) and the balance of the asset-backed debt, or $132 million. We estimate the non-GAAP economic value or our investment to be $126 million because we estimate the fair value of the $193 million of debt (at historical cost) to be $199 million using the same valuation process we used to fair value our other financial assets and liabilities. |
| u | At June 30, 2012, we had $140 million of long-term debt outstanding due in 2037 with a stated interest rate of three-month LIBOR plus 225 basis points. In 2010, we effectively fixed the interest rate on this long-term debt at a rate of approximately 6.75% (excluding deferred debt issuance costs) through interest rate swaps. Although we report our long-term debt in accordance with GAAP based on its $140 million historical cost, we estimate the non-GAAP economic value of this debt at $73 million based on its stated interest rate using the same valuation process used to fair value our other financial assets and liabilities. |
Capital and Cash
| u | At June 30, 2012, our total capital was $1.1 billion, including $951 million of shareholders’ equity and $140 million of long-term debt. We use our capital to invest in earning assets, meet lender capital requirements, and to fund our operations and working capital needs. |
| u | Our cash balance was $70 million at June 30, 2012. We hold cash for two main reasons. First, we hold cash in an amount we believe will be sufficient to comply with covenants, to fund haircuts (or the difference between the amounts advanced to us by our lenders and the value of the pledged loans and securities) on our warehouse and repo borrowing facilities, to meet potential margin calls, and to cover near-term cash operating expenses. Second, we hold cash in anticipation of having opportunities to invest at attractive yields. |
| u | We estimate that our investment capacity was $90 million at June 30, 2012. |
| THE REDWOOD REVIEW | 2ND QUARTER 2012 | 15 |
|
|
|
FINANCIAL INSIGHTS
|
GAAP Income
| u | The following table provides a summary of our consolidated GAAP income for the second and first quarters of 2012. |
|
GAAP Income |
| |||||||
| ($ in millions, except per share data)
|
| |||||||
| Three Months Ended | ||||||||
| 6/30/2012 | 3/31/2012 | |||||||
| Interest income | $ | 60 | $ | 59 | ||||
| Interest expense | (29 | ) | (31 | ) | ||||
| Net interest income | 31 | 28 | ||||||
| Provision for loan losses | 1 | - | ||||||
| Other market valuation adjustments, net | (5 | ) | (1 | ) | ||||
| Net interest income after provision and other market valuation adjustments | 27 | 27 | ||||||
| Mortgage banking activities, net | 2 | 4 | ||||||
| Operating expenses | (15 | ) | (15 | ) | ||||
| Realized gains, net | 7 | 14 | ||||||
| Provision for income taxes | (1 | ) | - | |||||
| GAAP income | $ | 20 | $ | 30 | ||||
| GAAP income per share | $ | 0.24 | $ | 0.37 | ||||
| u | Our consolidated GAAP net income for the second quarter of 2012 was $20 million, or $0.24 per share, as compared to $30 million, or $0.37 per share, for the first quarter of 2012. The $10 million decrease resulted from lower realized gains and mortgage banking activities income, partially offset by higher net interest income and recovery of prior period loan loss provision expenses. |
| 16 | THE REDWOOD REVIEW | 2ND QUARTER 2012 |
|
|
|
FINANCIAL INSIGHTS
|
GAAP Income (continued)
| u | The following tables show the estimated effect that Redwood and our Consolidated Entities had on GAAP income for the second and first quarters of 2012. |
|
Consolidating Income Statement |
| |||||||||||
| Three Months Ended June 30, 2012 | ||||||||||||
| ($ in millions)
|
| |||||||||||
| At Redwood |
Consolidated Entities |
Redwood Consolidated |
||||||||||
| Interest income | $ | 27 | $ | 27 | $ | 53 | ||||||
| Net discount (premium) amortization | 8 | (2 | ) | 7 | ||||||||
| Total interest income | 35 | 25 | 60 | |||||||||
| Interest expense | (6 | ) | (23 | ) | (29 | ) | ||||||
| Net interest income | 29 | 2 | 31 | |||||||||
| Provision for loan losses | - | 2 | 1 | |||||||||
| Other market valuation adjustments, net | (6 | ) | 1 | (5 | ) | |||||||
| Net interest income after provision and other market valuation adjustments | 22 | 4 | 27 | |||||||||
| Mortgage banking activities, net | 2 | - | 2 | |||||||||
| Operating expenses | (15 | ) | - | (15 | ) | |||||||
| Realized gains, net | 7 | - | 7 | |||||||||
| Provision for income taxes | (1 | ) | - | (1 | ) | |||||||
| Net income | $ | 16 | $ | 4 | $ | 20 | ||||||
|
Consolidating Income Statement |
| |||||||||||
| Three Months Ended March 31, 2012 | ||||||||||||
| ($ in millions)
|
| |||||||||||
| At Redwood |
Consolidated Entities |
Redwood Consolidated |
||||||||||
| Interest income | $ | 24 | $ | 28 | $ | 52 | ||||||
| Net discount (premium) amortization | 8 | (1 | ) | 7 | ||||||||
| Total interest income | 32 | 27 | 59 | |||||||||
| Interest expense | (6 | ) | (25 | ) | (31 | ) | ||||||
| Net interest income | 26 | 2 | 28 | |||||||||
| Provision for loan losses | - | - | - | |||||||||
| Other market valuation adjustments, net | - | - | (1 | ) | ||||||||
| Net interest income after provision and other market valuation adjustments | 26 | 2 | 27 | |||||||||
| Mortgage banking activities, net | 4 | - | 4 | |||||||||
| Operating expenses | (15 | ) | - | (15 | ) | |||||||
| Realized gains, net | 6 | 7 | 14 | |||||||||
| Provision for income taxes | - | - | - | |||||||||
| Net income | $ | 21 | $ | 9 | $ | 30 | ||||||
| THE REDWOOD REVIEW | 2ND QUARTER 2012 | 17 |
|
|
|
FINANCIAL INSIGHTS
|
GAAP Income (continued)
Redwood Parent
| u | Net interest income at Redwood was $29 million for the second quarter of 2012, as compared to $26 million for the first quarter of 2012, an increase of $3 million. The increase was primarily the result of higher interest income from residential securities. |
| u | Total interest income from our securities portfolio was $26 million for the second quarter of 2012, an increase of $3 million compared to $23 million in the first quarter of 2012. Declining investment yields were offset by increasing average balances, as acquisitions of $126 million outpaced principal repayments and sales. |
| u | Residential loans at Redwood generated $4 million of interest income during the second quarter of 2012, a slight increase from the first quarter of 2012, as the average balance of loans rose modestly. These loans are financed at Redwood prior to being pooled and securitized through our Sequoia program, or sold as whole loans. The amount of interest earned at Redwood is dependent upon prevailing mortgage rates and the pace of our loan purchase and sale activity. |
| u | Commercial loans at Redwood generated $5 million of interest income in both the second and first quarters of 2012. We originated $69 million of commercial loans in the second quarter of 2012, as compared to $27 million in the first quarter of 2012, bringing the total portfolio to $247 million as of June 30, 2012. |
| u | Interest expense at Redwood was $6 million in both the second and first quarters of 2012. This interest expense was derived from $140 million of long-term debt at an effective cost of 6.88%, $198 million (average balance) of ABS issued debt (related to the resecuritization of certain of our senior residential securities) at a cost of LIBOR plus 2%, as well as interest paid on short-term repurchase and warehouse facilities utilized during the second quarter. The realized portion of deferred security issuance costs is also reflected in interest expense. |
| u | Net negative market valuation adjustments on securities and derivatives were $6 million for the second quarter, an increase from less than $1 million in the first quarter of 2012. This increase was primarily a result of lower market valuations on IO securities retained from recent securitization transactions. These IO securities help us to manage risks associated with our residential loan pipeline and consequently reduce the amount of risk management derivatives we may otherwise use to manage our pipeline. |
| u | Our income from mortgage banking activities, net, was $2 million in the second quarter of 2012, a decline of $2 million compared to the first quarter of 2012. This decline is largely the result of timing — our first quarter results included gains from both a January securitization (made up of loans from our 2011 pipeline) and one completed later in the quarter. On a per securitization basis, the $5 million GAAP gain on sale from our June securitization was our largest since we restarted our Sequoia securitization platform in 2010. These gains were offset by a $1 million increase, as compared to the first quarter, in negative valuation adjustments on MSRs and derivatives used to manage risks associated with our residential loan pipeline. |
| u | During the second quarter of 2012, we recognized $7 million of gains from the sale of securities compared to $6 million recognized in the first quarter of 2012. |
| u | Operating expenses at Redwood were $15 million during both the second and first quarters of 2012. We expect a similar level of quarterly operating expenses in the third quarter of 2012. |
| 18 | THE REDWOOD REVIEW | 2ND QUARTER 2012 |
|
|
|
FINANCIAL INSIGHTS
|
GAAP Income (continued)
Consolidated Entities
| u | We recognized net income of $4 million for the second quarter from our investments in Legacy Sequoia and Acacia securitization entities, as compared to a net income of $8 million for the previous quarter. This decrease in net income is primarily a result of $7 million in gains recognized upon deconsolidation of certain Sequoia securitization entities during the first quarter. The remaining assets at Consolidated Entities continue to decline with no new reinvestment. |
| u | We released a net $2 million of loan loss reserves during the second quarter of 2012 due to credit stability in our legacy Sequoia portfolio and our belief that expected future loan losses will be covered by our $55 million reserve at June 30, 2012. In future quarters, seasonal factors in housing as well as a sustained economic slowdown could require us to resume recording loan loss provisions. |
| u | There are currently nine Sequoia entities for which we have aggregate loan loss reserves of $5 million in excess of our reported investment for GAAP purposes, an amount we expect to recover in future periods upon the payoff or deconsolidation of those entities. During the first quarter of 2012, we sold variable interests in five Sequoia securitizations issued between 2001 and 2003 and determined upon completion of an accounting analysis that we should derecognize the associated assets and liabilities of these securitizations for financial reporting purposes. We deconsolidated $307 million of real estate loans and other assets and $307 million of ABS issued and other liabilities and realized gains of $7 million that were comprised of both recoveries of excess provisions as well as cash raised by selling our interests in these entities. |
| THE REDWOOD REVIEW | 2ND QUARTER 2012 | 19 |
|
|
|
FINANCIAL INSIGHTS
|
REIT Taxable Income and Dividends
Summary
As a REIT, Redwood is required to distribute to shareholders at least 90% of its REIT taxable income (and meet certain other requirements), although Redwood’s Board of Directors can declare dividends in excess of this minimum requirement. REIT taxable income is defined as income as calculated for tax that is earned at Redwood and its qualified REIT subsidiaries. Redwood also earns taxable income at its taxable subsidiaries, which it is not required to distribute. To the extent Redwood retains taxable income that is not distributed to shareholders, it is taxed at corporate tax rates. A reconciliation of GAAP and taxable income is set forth in Table 2 in the Financial Tables in this Review.
Overview
| u | Redwood’s estimate of REIT taxable income for the second quarter of 2012 was $17 million, or $0.22 per share, as compared to estimated REIT taxable income of $10 million, or $0.13 per share, for the first quarter of 2012. |
| u | Credit losses from legacy investments decreased in the second quarter and continue to have a significant but declining impact on our REIT taxable income. In the second quarter of 2012, realized credit losses as calculated for tax purposes totaled $5 million, as compared to $10 million in the first quarter of 2012, and were charged directly to REIT taxable income since the tax code does not allow for the establishment of credit reserves. |
| u | Our REIT taxable income will likely continue to vary from period to period due to the timing of realized credit losses. Based on the securities we currently own, we expect an additional $130 million of credit losses to be realized over an estimated three- to five-year period for tax purposes. |
| u | Redwood’s estimated total taxable income, defined as the sum of REIT taxable income plus the taxable income at our taxable REIT subsidiaries, was $17 million, or $0.22 per share in the second quarter of 2012, as compared to estimated taxable income of $8 million, or $0.11 per share in the first quarter of 2012. From a tax perspective, our taxable REIT subsidiaries, taken together, did not generate taxable income. However, we recorded a tax provision for GAAP at the taxable REIT subsidiary level in the second quarter for tax we expect to pay on excess inclusion income passed through from certain Sequoia securitization entities completed since 2010. The excess inclusion income was not earned at the REIT and will not affect the tax characterization of our 2012 dividends. |
| u | On May 17, 2012, our Board of Directors declared a regular dividend of $0.25 per share for the second quarter, which was paid on June 29, 2012, to shareholders of record on June 15, 2012. |
| u | On August 2, 2012, our Board of Directors declared a regular dividend of $0.25 per share for the third quarter, which will be paid on September 28, 2012, to shareholders of record on September 14, 2012. |
| u | In November 2011, the Board of Directors announced its intention to pay a regular dividend of $0.25 per share per quarter in 2012. |
| 20 | THE REDWOOD REVIEW | 2ND QUARTER 2012 |
|
|
|
FINANCIAL INSIGHTS
|
Cash Flow
| u | The sources and uses of cash in the table below are derived from our GAAP Consolidated Statements of Cash Flow for the second and first quarters of 2012, aggregating and netting all items in a manner consistent with the way management analyzes them. This table excludes the gross cash flow generated by our Sequoia and Acacia securitization entities (cash flow that is not available to Redwood), but does include the cash flow distributed to Redwood as a result of our investments in these entities. The beginning and ending cash balances presented in the table below are GAAP amounts. |
|
Redwood Sources and Uses of Cash |
| |||||||
| ($ in millions)
|
| |||||||
| Three Months Ended | ||||||||
| 6/30/2012 | 3/31/2012 | |||||||
| Beginning cash balance | $ | 150 | $ | 267 | ||||
| Business cash flow (1) | ||||||||
| Loans, securities, and investments (2) |
63 | 60 | ||||||
| Operating expenses |
(12 | ) | (12 | ) | ||||
| Interest expense on other borrowed funds |
(5 | ) | (4 | ) | ||||
| Dividends |
(20 | ) | (20 | ) | ||||
| Net business cash flow | 26 | 24 | ||||||
| Investment-related cash flow | ||||||||
| Acquisition of residential loans |
(339 | ) | (660 | ) | ||||
| Origination/acquisition of commercial debt investments |
(69 | ) | (27 | ) | ||||
| Acquisition of securities, net (3) |
(51 | ) | (164 | ) | ||||
| Investments in New Sequoia Entities |
(23 | ) | (61 | ) | ||||
| Total investment-related cash flow |
(482 | ) | (912 | ) | ||||
| Financing and other cash flow | ||||||||
| Proceeds from residential loan sales |
387 | 753 | ||||||
| Proceeds from repo debt, net |
56 | 183 | ||||||
| Repayment of warehouse debt, net |
(42 | ) | (170 | ) | ||||
| Margin (posted) returned, net |
(20 | ) | 21 | |||||
| Derivative pair-off |
(5 | ) | (11 | ) | ||||
| Changes in working capital |
- | (5 | ) | |||||
| Net financing and other cash flow
|
376 | 771 | ||||||
| Ending cash balance | $ | 70 | $ | 150 | ||||
| (1) | Cash flow from securities and investments can be volatile from quarter to quarter depending on the level of invested capital, the timing of credit losses, acquisitions, sales, and changes in prepayments and interest rates. Therefore, (i) cash flow generated by these investments in a given period is not necessarily reflective of the long-term economic return we will earn on these investments; and, (ii) it is difficult to determine what portion of the cash received from an investment is a return “of” principal and what portion is a return “on” principal in a given period. |
| (2) | Sources of cash from residential securities include the cash received from the securities that were included in the resecuritization we engaged in during the third quarter of 2011, net of the principal and interest payments made in respect of the ABS issued in that resecuritization. |
| (3) | Total sales of securities in the second quarter of 2012 were $49 million. Securities sales of $6 million made in the first quarter that settled in April are reflected in the second quarter cash flow. Total acquisitions of securities in the second quarter of 2012 were $103 million. Securities acquisitions of $3 million made in the first quarter that settled in April are reflected in the second quarter cash flow. There were no unsettled trades at the end of the fourth quarter of 2011 or the second quarter of 2012. |
| THE REDWOOD REVIEW | 2ND QUARTER 2012 | 21 |
|
|
|
FINANCIAL INSIGHTS
|
Cash Flow (continued)
| u | Business cash flow totaled $26 million in the second quarter of 2012, as compared to $24 million in the first quarter. Contributing to the $2 million increase in business cash flow was a $3 million increase in principal and interest payments from residential loans, securities and investments, which was partially offset by a $1 million increase in interest expense. |
| u | The $63 million of cash flow from our loans, securities, and investments continued to exceed the sum of our cash operating expenses of $12 million, interest expense on borrowed funds of $5 million, and dividends of $20 million. |
| u | Notable sources of cash in the second quarter included $300 million from the proceeds from our residential securitization, $87 million from whole loan sales, and $56 million from repurchase facilities used to finance a portion of our third-party RMBS acquisitions. |
| u | Notable uses of cash in the second quarter included $339 million for the acquisition of residential loans, as compared to $660 million in the first quarter when we completed two securitizations, $42 million to reduce warehouse debt, and $20 million for dividends. |
| u | Our uses of cash for long-term investments totaled $143 million, consisting of $69 million for commercial loan investments, $51 million for the acquisition of seasoned third-party RMBS (net of sales of $49 million), and $23 million to acquire securities from SEMT 2012-3, which was completed in the second quarter of 2012. |
|
Cash Used for Long-term Investments |
| |||||||||||||||||||
| ($ in millions)
|
| |||||||||||||||||||
| Three Months Ended | ||||||||||||||||||||
| 6/30/12 | 3/31/12 | 12/31/11 | 9/30/11 | 6/30/11 | ||||||||||||||||
|
Commercial |
$ |
69 |
|
$ |
27 |
|
$ |
60 |
|
$ |
27 |
|
$ |
29 |
| |||||
| RMBS, net of sales |
51 | 164 | 35 | 48 | 15 | |||||||||||||||
| New Sequoia
|
|
23
|
|
|
61
|
|
|
-
|
|
|
19
|
|
|
-
|
| |||||
| Total cash used for long-term investments |
$ | 143 | $ | 252 | $ | 95 | $ | 94 | $ | 44 | ||||||||||
| u | Cash flow from securities and investments can be volatile from quarter to quarter depending on the level of invested capital, the timing of credit losses, acquisitions, sales, and changes in prepayments and interest rates. |
| 22 | THE REDWOOD REVIEW | 2ND QUARTER 2012 |
|
|
|
SEQUOIA RESIDENTIAL MORTGAGE LOAN BUSINESS
|
Summary
We purchase newly originated loans (mainly prime jumbo loans) that meet our collateral criteria from approved originators on a flow or bulk basis. Loans acquired through this process (our “conduit”) are expected to be securitized through Sequoia securitization entities, which acquire residential mortgage loans from our conduit and issue RMBS backed by these loans, or are sold privately as whole loans. Most of the senior or investment-grade rated RMBS issued by Sequoia Entities are sold to third-party investors; Redwood generally acquires the subordinate or non-investment grade securities but has also acquired senior securities and interest-only securities from the Sequoia Entities.
Quarterly Update
| u | On June 27, 2012, we closed SEMT 2012-3, a $294 million securitization of 331 prime jumbo mortgage loans, which marked our third securitization in 2012 and our sixth in the post-financial crisis period. Our initial investment in SEMT 2012-3 was $23 million. |
| u | At June 30, 2012, we held $115 million (estimated economic value) of RMBS issued from these six Sequoia securitizations that total $1.9 billion. Included in the $115 million are $41 million of investments from the 2010 and 2011 deals which we have consolidated and accounted for as financings under GAAP and $74 million in securities we retained from the 2012 deals that were accounted for as sales under GAAP. We are currently holding less than we initially retained from these six securitizations, as after we close a transaction we may subsequently sell certain securities that we initially retained. |
| u | As of June 30, 2012, there were no delinquencies in the loans underlying these six securitizations and there have not been any credit losses relating to these securitizations. |
| u | At June 30, 2012, residential loans purchased and held on our balance sheet for future securitization or loan sales totaled $254 million, and the pipeline of residential loans we have identified for purchase totaled $476 million. |
| u | At July 31, 2012, residential loans purchased and held on our balance sheet for future securitization or loan sales totaled $383 million and the pipeline of residential loans we have identified for purchase totaled $518 million. |
| u | At June 30, 2012, we had 37 active sellers, up from 28 at April 30, 2012. We are comfortably on track to exceed our year-end 2012 goal of 40 active sellers and are now targeting 50 active sellers by the end of the year. |
| THE REDWOOD REVIEW | 2ND QUARTER 2012 | 23 |
|
|
|
RESIDENTIAL REAL ESTATE SECURITIES
|
Summary
Redwood invests in securities that are backed by pools of residential loans. Some of these investments in residential securities consist of senior prime and non-prime securities, and non-senior securities. Residential prime securities are mortgage-backed securities backed by prime residential mortgage loans. Residential non-prime securities are mortgage-backed securities backed by non-prime (Alt-A, Option ARM, and Subprime) residential mortgage loans. Non-senior securities include subordinate and re-REMIC securities.
Senior securities are those interests in a securitization that have the first right to cash flows and are last in line to absorb losses. Subordinate securities are those interests in a securitization that have the last right to cash flows and are first in line to absorb losses. A re-REMIC is a resecuritization of RMBS where the cash flow from and any credit losses absorbed by the underlying RMBS are allocated among the securities issued in the resecuritization transaction in a variety of ways.
The following discussion refers only to the residential securities owned by Redwood, but excludes securities owned by Acacia entities, and exclusive of Redwood’s investments in Acacia.
This discussion includes the securities that we resecuritized during the third quarter of 2011.
In the Financial Tables in the Appendix, information on the residential securities we own and underlying loan characteristics is set forth in Tables 5 through 8B.
Quarterly Update
| u | Interest income generated by our residential securities was $25 million in the second quarter of 2012, resulting in an annualized unlevered yield of 11% on the $937 million average amortized cost of these securities. |
| u | We financed our holdings of residential securities with short-term debt secured by securities (repo debt), through the resecuritization transaction we completed during the third quarter of 2011 (resecuritization debt), and with equity capital. During the second quarter, average repo debt amounted to $342 million and the average resecuritization debt amounted to $198 million. |
| u | At June 30, 2012, the fair value of the residential securities we own totaled $1.05 billion, consisting of $507 million in prime senior securities, $265 million in non-prime senior securities, $147 million in re-REMIC securities, and $132 million in subordinate securities. Each of these categories is further discussed on the following pages. |
| u | At June 30, 2012, 40% of the residential securities we held were fixed-rate assets, 18% were adjustable-rate assets, 26% were hybrid assets that reset within the next year, 10% were hybrid assets that reset between 12 and 36 months, and 6% were hybrid assets that reset after 36 months. |
| 24 | THE REDWOOD REVIEW | 2ND QUARTER 2012 |
|
|
|
RESIDENTIAL REAL ESTATE SECURITIES
|
Quarterly Update (continued)
| u | The following table presents information on residential securities at Redwood at June 30, 2012. For GAAP, we account for the large majority of these securities as available-for-sale (AFS) and others as trading securities, and in both cases the securities are reported at their fair value at the report date. |
|
Residential Securities at Redwood |
| |||||||||||||||||||
| June 30, 2012 | ||||||||||||||||||||
| ($ in millions)
|
| |||||||||||||||||||
| Senior | ||||||||||||||||||||
| Prime | Non-prime | Re-REMIC | Subordinate | Total | ||||||||||||||||
| Available-for-sale securities (1) |
||||||||||||||||||||
| Current face |
$ | 540 | $ | 313 | $ | 237 | $ | 273 | $ | 1,363 | ||||||||||
| Credit reserve |
(35 | ) | (19 | ) | (58 | ) | (109 | ) | (221 | ) | ||||||||||
| Net unamortized discount |
(53 | ) | (60 | ) | (74 | ) | (38 | ) | (225 | ) | ||||||||||
| Amortized cost |
452 | 234 | 105 | 126 | 917 | |||||||||||||||
| Unrealized gains |
41 | 13 | 43 | 10 | 107 | |||||||||||||||
| Unrealized losses |
(2 | ) | (5 | ) | (1 | ) | (5 | ) | (13 | ) | ||||||||||
| Trading securities
|
|
16
|
|
|
23
|
|
|
-
|
|
|
1
|
|
|
40
|
| |||||
| Fair value of residential securities |
$ | 507 | $ | 265 | $ | 147 | $ | 132 | $ | 1,051 | ||||||||||
| Fair value of AFS securities as a % of face value (2) |
91 | % | 77 | % | 62 | % | 48 | % | 74 | % | ||||||||||
| Amortized cost of AFS securities as a % of face value (2) |
84 | % | 75 | % | 44 | % | 46 | % | 67 | % | ||||||||||
(1) Included in the residential securities table above are $323 million of senior securities that are included in a resecuritization that we completed in July 2011. Under GAAP accounting, we account for the resecuritization as a financing even though these securities are owned by the resecuritization entity and are legally not ours. We own only the securities and interests that we acquired from the resecuritization entity, which amounted to $128 million at June 30, 2012. As a result, to adjust at June 30, 2012 for the legal and economic interests that resulted from the resecuritization, Total Residential Senior Securities would be decreased by $323 million to $449 million, Total Re-REMIC Residential Securities would be increased by $128 million to $275 million, and Total Residential Securities would be reduced by $195 million to $856 million.
(2) Does not include trading securities.
| u | Securities are acquired assuming a range of outcomes based on modeling of expected performance at the individual loan level for both delinquent and current loans. Over time, the performance of these securities may require a change in the amount of credit reserves we designate. |
| u | In the second quarter of 2012, credit losses on our residential securities at Redwood totaled $12 million, as compared to credit losses of $14 million in the first quarter of 2012. In each quarter, all of the losses came from our subordinate securities. We expect future losses to extinguish a large percentage of the subordinate securities as reflected by the $109 million of credit reserves we have provided for the $273 million face value of those securities. Until the losses occur, we will generally continue to earn interest on the face value of those securities. |
| u | Additional information on interest income and yields for our securities portfolio is reported in the Financial Tables in the Appendix. |
| THE REDWOOD REVIEW | 2ND QUARTER 2012 | 25 |
|
|
|
RESIDENTIAL REAL ESTATE SECURITIES
|
Housing Prices
| u | Our outlook for housing is unchanged from three months ago. If you compare house prices to local incomes, housing is inexpensive by historical standards in most of the country. Record low interest rates are providing an additional boost to home affordability, and in general this should protect from additional downside movement in prices, absent a second recession. There is still an overhang of supply, especially from “shadow” inventory not listed on the market, but the situation is improving: the National Association of Realtors reported that existing home inventories in June 2012 declined 24% year-over-year, and are at the lowest level since 2002. We believe housing is in the process of stabilizing, but we do not expect housing, in general, to be a significantly appreciating asset class for several years. |
Delinquencies
| u | Delinquencies fell in the second quarter, but remain at historically elevated levels. According to LoanPerformance data, serious (90+ day) delinquencies fell by 0.17% quarter-over-quarter to 10.92% for prime loans and fell 0.92% quarter-over-quarter to 28.49% for Alt-A loans. The loans underlying Redwood’s portfolio of RMBS that were issued prior to 2008 have lower delinquency rates than the market as a whole: 7.33% of our prime loans, and 17.16% of our Alt-A loans, are 90+ days delinquent. |
| u | Early-stage roll rates (from loans “always current” to 30 days delinquent) improved in the second quarter. Of previously “always current” prime loans, 0.49% missed their first payment in June 2012, down from 0.56% in March 2012, while the same metric for Alt-A fell 0.21% to 0.87%. These roll rates are high by historical standards but well below 2008 — 2011 levels, and are showing no sign of a “double dip” in mortgage performance. This trend should eventually cause total delinquencies to fall, but for now the slowdown in new defaults is being balanced by an extension in liquidation timelines. |
Prepayments
| u | Prepayment speeds rose during the second quarter. Prime borrowers with loan-to-value (LTV) ratios below 100% prepaid at 19% CPR in June 2012 (up from 17% in March 2012), while Alt-A borrowers with equity paid at 8% CPR, up from 7%. The uptick was likely due to falling interest rates — according to Freddie Mac, the monthly average rate for new loans fell from 3.95% in March 2012 to an all time low of 3.68% in June 2012. Borrowers without equity prepaid very slowly regardless of credit quality, with prime and Alt-A loans with LTV ratios above 100% prepaying at only 6% and 1% CPR, respectively, in line with the prior quarter. |
| 26 | THE REDWOOD REVIEW | 2ND QUARTER 2012 |
|
|
|
COMMERCIAL REAL ESTATE BUSINESS
|
Summary
Redwood’s commercial origination platform provides debt solutions for borrowers on commercial properties. Redwood collaborates with other lending institutions (including major banks, life insurance companies, commercial mortgage-backed securities (CMBS) issuers, and the GSEs) to originate subordinate debt investments (typically mezzanine loans or other forms of subordinated financing such as preferred equity or B-Notes, referred to as “loans”) for its portfolio. Redwood may also originate loans on stabilized commercial properties, creating and retaining the subordinate investments while creating and selling senior loans. Redwood also owns a small balance of legacy commercial securities that were acquired prior to 2008. This discussion is exclusive of commercial securities and loans owned by Acacia entities.
Quarterly Update
| u | During the second quarter, we closed eight loans for $69 million, including six with new senior lending partners. |
| u | To date, we have closed our loans in collaboration with 17 different senior lenders, including six banks, an insurance company, a GSE, and nine CMBS conduits. Our ability to work with multiple capital sources is central to our commercial lending strategy. |
| u | At June 30, 2012, our commercial loan portfolio totaled $247 million. On average, these investments have a weighted average maturity of nearly six years, an unlevered annual yield in excess of 10%, a loan-to-value ratio of 72% at origination, and a debt service coverage ratio at origination of 1.20x based on our underwritten cash flows. |
| u | During the second quarter, our commercial loan portfolio generated interest income of $5 million. At June 30, 2012, all of these loans continue to be current and, in fact, the underlying properties are generally performing as expected or better than at origination. For many of these underlying properties, we have seen improvement in the underlying cash flows and overall our estimate of current debt service coverage for this portfolio is approximately 1.28x. |
| u | In the second quarter, we originated and sold our first senior loan in conjunction with a retained mezzanine loan. We anticipate an increase in this activity in the near term. |
| u | In July 2012, we originated one additional loan for $6 million. Given the pace of our originations over the first half, we are now targeting originations of between $200 and $250 million in 2012. |
| u | We are working to establish a financing facility for our commercial loans, which will enable us to further aggregate loans in anticipation of a more permanent financing solution. We currently plan on closing such a facility by the end of the year. |
| THE REDWOOD REVIEW | 2ND QUARTER 2012 | 27 |
|
|
|
COMMERCIAL REAL ESTATE BUSINESS
|
Quarterly Update (continued)
| u | The following table and charts provide information on the portfolio as of June 30, 2012. |
| Weighted Average | Weighted Average | Average | ||||||
| Property Type | Number Of Loans | DSCR(2) | LTV(2) | Loan Size ($ millions) | ||||
|
Multifamily
|
10 | 1.13X | 77% | $5.3 | ||||
|
Office
|
7 | 1.23X | 72% | $11.2 | ||||
|
Retail
|
3 | 1.17X | 76% | $15.4 | ||||
|
Hospitality
|
3 | 1.27X | 62% | $17.6 | ||||
|
Self Storage(1)
|
3 | 1.12X | 79% | $6.0 | ||||
|
Total
|
26 | 1.20X | 72% | $9.5 |
(1) Two of these loans are recourse to the borrowers.
(2) At origination.
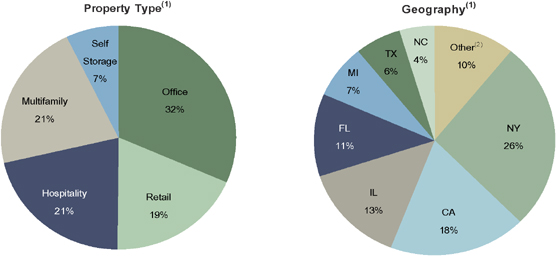
(1) Percentages based on current loan balances to the total portfolio.
(2) Other includes NJ, KY, TN, GA, SC, PA, MS, MN, MA, each with 3% or less.
| 28 | THE REDWOOD REVIEW | 2ND QUARTER 2012 |
|
|
|
INVESTMENTS IN CONSOLIDATED ENTITIES
|
Summary
Prior to 2012, we sponsored Sequoia securitization entities, and prior to 2008 we sponsored Acacia securitization entities, that acquired mortgage loans and securities, created and issued ABS backed by these loans and securities, and the securitizations were accounted for under GAAP as secured borrowings resulting in those entities being consolidated on our financial statements. Starting in 2012, we began to use sale accounting for our Sequoia Securitizations and as a result, we no longer consolidate securitizations that are accounted for as a sale of assets. As a result, we expect our investment in consolidated entities to decline over time.
Quarterly Update
| u | In the second quarter of 2012, combined net income from Consolidated Entities totaled $4 million, as compared to $8 million in the first quarter of 2012. This decrease in net income primarily reflects the absence of any legacy Sequoia-related deconsolidations, which produced $7 million in gains in the first quarter. Partially offsetting the lack of gains were $2 million in recovery of loan loss allowance and $1 million in positive net market valuation adjustments. |
| u | At June 30, 2012, the loan loss allowance for consolidated securitizations totaled $55 million, or 1.71% of $3.2 billion of outstanding loans. Serious delinquencies (90+ days delinquent) totaled $117 million at June 30, 2012, compared to $124 million at March 31, 2012. Net charge-offs in the second quarter amounted to $2 million, or 0.06% of outstanding loans, compared to $3 million in the first quarter, or 0.11% of outstanding loans. |
| u | At June 30, 2012, consolidated Sequoia assets totaled $3.2 billion and Acacia assets totaled $0.3 billion. Our $87 million investment in Consolidated Entities was almost entirely attributable to Sequoia. |
| u | The consolidation of the assets and liabilities of securitization entities may lead to potentially volatile reported earnings for a variety of reasons, including the amortization of premiums on the loans and liabilities of Sequoia entities, changes in credit loss provisions for loans held by Sequoia entities, fair value adjustments for the assets and liabilities of the Acacia entities, and deconsolidation events. |
| THE REDWOOD REVIEW | 2ND QUARTER 2012 | 29 |
This Page Intentionally Left Blank
| 30 |

|
|
|
EMINENT DOMAIN DISCUSSION
|
The following is a summary of our current understanding (based on published descriptions) of some of the major aspects of the “Homeownership Protection Program” (the Program) that has been proposed by Mortgage Resolution Partners (MRP), a private entity, for San Bernardino County, California and which may be considered by other municipalities. Under the Program, the government’s power of eminent domain could be used to acquire and then modify (through refinancing) mortgage loans secured by residential real estate within the county. Among others, the public purposes for the Program that have been put forth by its advocates include reducing potential foreclosures and the associated economic blight.
In June 2012, the County of San Bernardino along with the cities of Ontario and Fontana decided to jointly explore the Program. In summary, MRP would manage the Program, which would have the municipalities acquire performing mortgage loans that are underwater (the home value is less than the principal balance of the mortgage) out of private-label RMBS trusts by negotiated agreement or through eminent domain. Generally speaking, under the Program a portion of the principal balance of acquired loans would be forgiven, and the mortgage loans would be refinanced into new FHA-insured loans. The stated public purpose of the Program is to preserve home ownership and occupancy for homeowners who have negative equity, avoid the negative economic impacts of underwater loans, and enhance the economic vitality of the communities.
While we are sympathetic to the plight of underwater borrowers, we believe this Program is seriously flawed and appears to not be focused on assisting homeowners who are currently delinquent on their mortgage and are at imminent risk of foreclosure. Instead, the Program appears to be focused on assisting homeowners who are not necessarily at risk of default or foreclosure — a focus that we presume results from the fact it is only through providing refinancing to this subset of homeowners that private investors can take advantage of the governmental power of eminent domain for their own significant profit. We are troubled by the following aspects of the Program, among other concerns:
| u | Our analysis shows that before costs and profit sharing with the municipalities, gross unleveraged investment returns to private investors in the Program could equal 28%, which seems inconsistent with the stated public purpose of the Program. |
| u | The Program is aimed at a small subset of all first-lien mortgage loans (approximately 9%, if measured nationwide) and targets only performing loans, not non-performing loans or foreclosed properties that are more likely to lead to economic blight. |
Under the Program, it has been suggested that loans would be acquired at a price of 80-85% of the mortgaged home’s current market value, even though there is research that shows the fair market value of such loans is closer to 96% of the current market value of the property.1 These loans are valued in the market at the present value of their future expected cash flow, not based on some percentage of the related mortgaged property (house). If you assume that these loans are refinanced and packaged into Ginnie Mae securities that can currently be sold for prices close to 108% of par, it is clear that the proposed purchase price is grossly unfair.
There are several publicly available articles, broker-issued research reports, editorials, and opinion pieces on the subject for those who want more information. Among others, we recommend “An Eminently Bad Idea,” an editorial that appeared the Wall Street Journal on July 11, 2012.
1By way of reference, researchers have estimated that the “fair market value” for a residential mortgage loan with the following characteristics: 660 FICO, 140% LTV, and 3.7% interest rate would be at least 96% of the current market value of the related mortgaged property. See “Global Securitized Products Weekly,” Credit Suisse, July 12, 2012 at p12. http://www.americansecuritization.com/ uploadedFiles/CS_Eminent_Domain_20120711.pdf.
| 32 | THE REDWOOD REVIEW | 2ND QUARTER 2012 |
|
|
|
ACCOUNTING DISCUSSION
|
Mark-to-Market Valuation Process
| u | Market values reflect an “exit price,” or the amount we believe we would realize if we sold an asset or would pay if we repurchased a liability in an orderly transaction, even though we generally have no intention — nor would we be required — to sell assets or repurchase liabilities. Establishing market values is inherently subjective and requires us to make a number of assumptions, including the future of interest rates, prepayment rates, discount rates, credit loss rates, and the timing of credit losses. The assumptions we apply are specific to each asset or liability. |
| u | We rely on our internal calculations to compute the fair value of our securities and we request and consider indications of value (marks) from third-party dealers to assist us in our mark-to-market valuation process. For June 30, 2012, we received dealer marks on 48% of our securities and 52% of our ABS issued. In the aggregate, our internal valuations of the securities on which we received dealer marks were 2% lower than the aggregate dealer marks, and our internal valuations of our ABS issued on which we received dealer marks were 7% higher (i.e., more conservative) than the aggregate dealer marks. |
Determining Other-Than-Temporary Impairments
| u | The multi-step process for determining whether an investment security has other-than-temporary impairment is presented below. |
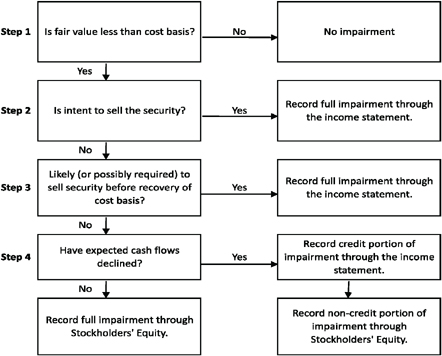
| THE REDWOOD REVIEW | 2ND QUARTER 2012 | 33 |
|
|
|
GLOSSARY
|
ACACIA
Acacia is the brand name for the collateralized debt obligation (CDO) securitizations Redwood sponsored.
ADJUSTABLE-RATE MORTGAGES (ARMs)
Adjustable-rate mortgages are loans that have coupons that adjust at least once per year. We make a distinction between ARMs (loans with a rate adjustment at least annually) and hybrids (loans that have a fixed-rate period of 2 -10 years and then become adjustable-rate).
AGENCY
Agency refers to government-sponsored enterprises (GSEs), including Federal National Mortgage Association (Fannie Mae), Federal Home Loan Mortgage Corporation (Freddie Mac), and Government National Mortgage Association (Ginnie Mae).
ALT-A SECURITIES and ALT-A LOANS
Alt-A securities are residential mortgage-backed securities backed by loans that have higher credit quality than subprime and lower credit quality than prime. Alt-A originally represented loans with alternative documentation, but the definition has shifted over time to include loans with additional risk characteristics and in some cases investor loans. In an Alt-A loan, the borrower’s income may not be verified, and in some cases, may not be disclosed on the loan application. Alt-A loans may also have expanded criteria that allow for higher debt-to-income ratios with higher accompanying loan-to-value ratios than would otherwise be permissible for prime loans.
AMORTIZED COST
Amortized cost is the initial acquisition cost of an available-for-sale (AFS) security, minus principal repayments or principal reductions through credit losses, plus or minus premium or discount amortization. At the point in time an AFS security is deemed other-than-temporarily impaired, the amortized cost is adjusted (by changing the amount of unamortized premium or discount) by the amount of other-than temporary impairment taken through the income statement.
ASSET-BACKED SECURITIES (ABS)
Asset-backed securities (ABS) are securities backed by financial assets that generate cash flows. Each ABS issued from a securitization entity has a unique priority with respect to receiving principal and interest cash flows and absorbing any credit losses from the assets owned by the entity.
AVAILABLE-FOR-SALE (AFS)
An accounting method for debt and equity securities in which the securities are reported at their fair value. Positive changes in the fair value are accounted for as increases to stockholders’ equity and do not flow through the income statement. Negative changes in fair value may be recognized through the income statement or balance sheet, as further detailed in the Accounting Discussion section.
B-NOTES
B-Notes are subordinate interests in commercial mortgage debt which are either (i) evidenced by a subordinated promissory note secured by the same mortgage that also secures the senior debt relating to the same property or (ii) junior participation interests in mortgage debt that are subordinate to senior participation interests in the same mortgage debt. B-Notes typically provide the holder with certain rights to approve modifications to related lending agreements and to trigger foreclosure under the mortgage following an event of default. B-Notes also typically provide the holder certain limited rights to cure a borrower default under senior debt secured by the same mortgage in order to keep the senior debt current and avoid foreclosure.
| 34 | THE REDWOOD REVIEW | 2ND QUARTER 2012 |
|
|
|
GLOSSARY
|
BOOK VALUE (GAAP)
Book value is the value of our common equity in accordance with GAAP.
COLLATERALIZED DEBT OBLIGATION (CDO) SECURITIZATIONS
The securitization of a diverse pool of assets.
COMMERCIAL MORTGAGE-BACKED SECURITIES (CMBS)
A type of mortgage-backed security that is secured by one or more loans on commercial properties.
CONSTANT (or CONDITIONAL) PREPAYMENT RATE (CPR)
Constant (or conditional) prepayment rate (CPR) is an industry-standard measure of the speed at which mortgage loans prepay. It approximates the annual percentage rate at which a pool of loans is paying down due to unscheduled principal prepayments.
CORE EQUITY
Core equity is not a measure calculated in accordance with GAAP. GAAP equity includes mark-to-market adjustments for some of our assets and interest rate agreements in “accumulated other comprehensive income (loss).” Core equity excludes accumulated other comprehensive income (loss). Core equity in some ways approximates what our equity value would be if we used historical amortized cost accounting exclusively. A reconciliation of core equity to GAAP appears in the Table 3 in the Financial Tables in this Review.
CREDIT SUPPORT
Credit support is the face amount of securities subordinate (or junior) to the applicable security that protects the security from credit losses and is generally expressed as a percentage of the securitization’s underlying pool balance.
DEBT
Debt is an obligation of Redwood. See Long-term debt and Short-term debt.
ECONOMIC VALUE (MANAGEMENT’S ESTIMATE OF ECONOMIC VALUE)
Economic value closely relates to liquidation value and is calculated using the bid-side marks (or estimated bid-side values) for all of our financial assets, and offered-side marks (or estimated offered-side values) for all of our financial liabilities. We calculate management’s estimate of economic value as a supplemental measure to book value calculated under GAAP. Our economic value estimates on a per-share basis are reconciled to GAAP book values per share in Table 3 in the Financial Tables of this Review.
FASB
Financial Accounting Standards Board.
FHFA
The FHFA refers to the Federal Housing Finance Authority.
GAAP
Generally Accepted Accounting Principles in the United States.
| THE REDWOOD REVIEW | 2ND QUARTER 2012 | 35 |
|
|
|
GLOSSARY
|
GOVERNMENT SPONSORED ENTERPRISE (GSE)
A government sponsored enterprise is a financial services corporation created by the United States Congress to enhance the flow of credit to targeted sectors of the economy. Among the GSEs charted by Congress are Fannie Mae, Freddie Mac, and Ginnie Mae.
INTEREST-ONLY SECURITIES (IOs)
Interest-only securities (IOs) are specialized securities created by securitization entities where the projected cash flows generated by the underlying assets exceed the cash flows projected to be paid to the securities that are issued with principal balances. Typically, IOs do not have a principal balance and they will not receive principal payments. Interest payments to IOs usually equal an interest rate formula multiplied by a “notional” principal balance. The notional principal balances for IOs are typically reduced over time as the actual principal balance of the underlying pool of assets pays down, thus reducing the cash flows to the IOs over time. Cash flows on IOs are typically reduced more quickly when asset prepayments increase.
INVESTMENT CAPACITY
The amount of capacity we estimate that we have to invest in new assets. Our estimate of our investment capacity takes into account, among other things, cash on hand, cash we estimate we could raise by prudently increasing short-term borrowings, and cash needed to cover short-term operations, working capital, and a liquidity cushion.
JUMBO LOAN
A jumbo loan is a mortgage loan that generally conforms to the underwriting standards of Fannie Mae and Freddie Mac except that the dollar amount of the loan exceeds the maximum limit set by the two GSEs for loans salable to the two companies.
LEVERAGE RATIOS
When determining Redwood’s financial leverage, traditional leverage ratios may be misleading in some respects if consolidated ABS issued from securitization entities are included as part of Redwood’s obligations when calculating this or similar ratios. Because of the requirement to consolidate the independent securitization entities for GAAP accounting purposes, it appears that Redwood is highly leveraged, with total consolidated liabilities significantly greater than equity. The obligations of these securitization entities are not obligations of Redwood.
LONG-TERM DEBT
Long-term debt is debt that is an obligation of Redwood that is not payable within a year and includes junior subordinated notes and trust preferred securities. We generally treat long-term debt as part of our capital base when it is not payable in the near future.
MARK-TO-MARKET (MTM) ACCOUNTING
Mark-to-market accounting uses estimated fair values of assets, liabilities, and hedges. Many assets on our consolidated balance sheet are carried at their fair value rather than amortized cost. Taxable income is generally not affected by market valuation adjustments.
MARKET VALUATION ADJUSTMENTS (MVAs)
Market valuation adjustments (MVAs) are changes in market values for certain assets and liabilities that are reported through our GAAP income statement. They include all changes in market values for assets and liabilities accounted for at fair value, such as trading securities and derivatives. They also include the credit portion of other-than-temporary impairments on securities available-for-sale, as well as impairments of loans held-for-sale and REO properties.
| 36 | THE REDWOOD REVIEW | 2ND QUARTER 2012 |
|
|
|
GLOSSARY
|
MEZZANINE LOAN
A mezzanine loan is a loan secured by the membership interests, partnership interests, and/or stock in a single purpose entity formed to own a commercial property, for example. If the mezzanine borrower fails to make its payments or otherwise defaults under the mezzanine loan documents, the mezzanine lender may pursue its remedies, including taking control of the single purpose entity that owns the property.
MORTGAGE SERVICING RIGHT (MSR)
A mortgage servicing right (MSR) gives the holder the contractual right to service a mortgage loan. MSRs typically include the right to collect monthly mortgage principal and interest payments, as well as related tax and insurance payments, from borrowers, disburse funds to the mortgage debt holders and remit related insurance and tax payments, collect late payments, and process modifications and foreclosures. MSRs are created when mortgage loans are sold in a transaction in which the seller retains the right to service the loans. The holder of an MSR receives a monthly servicing fee (which generally ranges from 0.25% to 0.375% per annum of the outstanding principal balance of the related mortgage loan), which is deducted from the borrower’s monthly interest payments. For accounting purposes, MSRs are capitalized at the net present value of the servicing fee less the servicing cost. When Redwood holds MSRs relating to residential mortgage loans, it retains a sub-servicer to carry out actual servicing functions, as Redwood does not directly service residential mortgage loans.
NON-GAAP METRICS
Not all companies and analysts calculate non-GAAP metrics in the same manner. As a result, certain metrics as calculated by Redwood may not be comparable to similarly titled metrics reported by other companies. Redwood uses non-GAAP metrics such as management’s estimate of economic value and core equity to provide greater transparency for investors. Our non-GAAP metrics are reconciled to GAAP in the Financial Tables in this Review.
NON-PRIME SECURITIES
Non-prime securities are Alt-A, option ARM, and subprime securities. See definitions of Alt-A, option ARM, and subprime securities.
OPTION ARM LOAN
An option ARM loan is a residential mortgage loan that generally offers a borrower monthly payment options such as: 1) a minimum payment that results in negative amortization; 2) an interest-only payment; 3) a payment that would fully amortize the loan over an original 31-year amortization schedule; and, 4) a payment that would fully amortize the loan over a 15-year amortization schedule. To the extent the borrower has chosen an option that is not fully amortizing the loan (or negatively amortizing the loan), after a period — usually five years or once the negatively amortized loan balance reaches a certain level (generally 15% to 25% higher than the original balance) — the loan payments are recast. This recast provision resets the payment at a level that fully amortizes the loan over its remaining life and the new payment may be materially different than under the borrowers’ previous option.
PREFERRED EQUITY
A preferred equity investment is an investment in preferred equity of a special purpose entity that directly or indirectly owns a commercial property. An investor in preferred equity is typically entitled to a preferred return (relative to a holder of common equity of the same entity) and has the right, if the preferred return is not paid, to take control of the entity (and thereby control the underlying commercial property).
| THE REDWOOD REVIEW | 2ND QUARTER 2012 | 37 |
|
|
|
GLOSSARY
|
PRIME RESIDENTIAL REAL ESTATE LOANS
Prime loans are residential loans with higher quality credit characteristics, such as borrowers with higher FICO credit scores, lower loan-to-value ratios, lower debt-to-income ratios, greater levels of other assets, and more documentation.
PRIME SECURITIES
Prime securities are residential mortgage-backed securities backed by prime loans, generally with balances greater than conforming loan limits. Prime securities are typically backed by loans that have relatively high weighted average FICO scores (700 or higher), low weighted average LTVs (75% or less), limited concentrations of investor properties, and low percentages of loans with low FICO scores or high loan-to-value ratios.
PROFITABILITY RATIOS
Many financial institution analysts use asset-based profitability ratios such as interest rate spread and interest rate margin when analyzing financial institutions. These are asset-based measures. Since we consolidate the assets and liabilities of securitization entities for GAAP purposes, our total GAAP assets and liabilities may vary over time, and may not be comparable to assets typically used in profitability calculations for other financial institutions. As a result, we believe equity-based profitability ratios may be more appropriate than asset-based measures for analyzing Redwood’s operations and results. We believe, for example, that net interest income as a percentage of equity is a useful measure of profitability. For operating expenses, we believe useful measures are operating efficiency ratio (operating expenses as a percentage of net interest income) and operating expenses as a percentage of equity. We provide various profitability ratios in Table 4 in the Financial Tables in this Review.
REAL ESTATE INVESTMENT TRUST (REIT)
A real estate investment trust (REIT) is an entity that makes a tax election to be taxed as a REIT, invests in real estate assets, and meets other REIT qualifications, including the distribution as dividends of at least 90% of REIT taxable income. A REIT’s profits are not taxed at the corporate level to the extent that these profits are distributed as dividends to stockholders, providing an operating cost savings. On the other hand, the requirement to pay out as dividends most of the REIT’s taxable profits means it can be harder for a REIT to grow using only internally-generated funds (as opposed to raising new capital).
REAL ESTATE OWNED (REO)
Real estate owned (REO) refers to real property owned by the lender or loan owner that has been acquired through foreclosure.
REIT SUBSIDIARY
A REIT subsidiary is a subsidiary of a REIT that is taxed as a REIT.
REIT TAXABLE INCOME
REIT taxable income is not a measure calculated in accordance with GAAP. REIT taxable income is pretax income calculated for tax purposes at Redwood including only its qualifying REIT subsidiaries (i.e., excluding its taxable subsidiaries). REIT taxable income is an important measure as it is the basis of our dividend distribution requirements. We must distribute at least 90% of REIT taxable income as dividends to shareholders over time. As a REIT, we are not subject to corporate income taxes on the REIT taxable income we distribute. We pay income tax on the REIT taxable income we retain, if any (and we are permitted to retain up to 10% of total REIT taxable income). A reconciliation of REIT taxable income to GAAP income appears in Table 2 in the Financial Tables in this Review.
| 38 | THE REDWOOD REVIEW | 2ND QUARTER 2012 |
|
|
|
GLOSSARY
|
REMIC
A real estate mortgage investment conduit (REMIC) is a special purpose vehicle used to pool real estate mortgages and issue mortgage-backed securities. REMICs are typically exempt from tax at the entity level. REMICs may invest only in qualified mortgages and permitted investments, including single family or multifamily mortgages, commercial mortgages, second mortgages, mortgage participations, and federal agency pass-through securities.
RE-REMIC SECURITY
A re-REMIC is a re-securitization of asset-backed securities. The cash flows from and any credit losses absorbed by the underlying assets can be redirected to the resulting re-REMIC securities in a variety of ways.
RESECURITIZATION
A resecuritization is a securitization of two or more mortgage-backed securities into a new mortgage-backed security.
RESIDENTIAL MORTGAGE-BACKED SECURITIES (RMBS)
A type of mortgage-backed security that is backed by a pool of mortgages on residential properties.
RETURN ON EQUITY (ROE) and ADJUSTED RETURN ON EQUITY
ROE is the amount of profit we generate each year per dollar of equity capital and equals GAAP income divided by GAAP equity. Adjusted ROE is not a measure calculated in accordance with GAAP — it is GAAP income divided by core equity.
SENIOR SECURITIES
Generally, senior securities have the least credit risk in a securitization transaction because they are generally the last securities to absorb credit losses. In addition, the senior securities have the highest claim on the principal and interest payments (after the fees to servicers and trustees are paid.) To further reduce credit risk, most if not all, principal collected from the underlying asset pool is used to pay down the senior securities until certain performance tests are satisfied. If certain performance tests are satisfied, principal payments are shared between the senior securities and the subordinate securities, generally on a pro rata basis. At issuance, senior securities are generally triple A-rated.
SEQUOIA
Sequoia is the brand name for securitizations of residential real estate loans Redwood sponsors. Sequoia entities are independent securitization entities that acquire residential mortgage loans and create and issue asset-backed securities (ABS) backed by these loans. Most of the loans that Sequoia entities acquire are prime-quality loans. Most of the senior ABS created by Sequoia are sold to third-party investors. Redwood usually acquires most of the subordinated ABS and occasionally acquires the interest-only securities (IOs).
SHORT-TERM DEBT
Short-term debt is debt that is an obligation of Redwood and payable within a year. We may obtain this debt from a variety of Wall Street firms, banks, and other institutions. In the past, as another form of short term debt, we have issued collateralized commercial paper. We may issue these or other forms of short term debt in the future. We may use short-term debt to finance the accumulation of assets prior to sale to a securitization entity and to finance investments in loans and securities.
| THE REDWOOD REVIEW | 2ND QUARTER 2012 | 39 |
|
|
|
GLOSSARY
|
SUBORDINATE DEBT INVESTMENTS
Subordinate Debt Investments mean Mezzanine Loans, Preferred Equity, and B-Notes.
SUBORDINATE SECURITIES (JUNIOR SECURITIES or NON-SENIOR SECURITIES)
Subordinate securities absorb the initial credit losses from a securitization structure, thus protecting the senior securities. Subordinate securities have a lower priority to receive principal and interest payments than the senior securities. Subordinate securities receive little, if any, principal payments until certain performance tests are satisfied. If certain performance tests are satisfied, principal payments are shared between the senior securities and the subordinate securities, generally on a pro rata basis. Subordinate securities generally receive interest payments even if they do not receive principal payments. At issuance, subordinate securities are generally rated double-A or below.
SUBPRIME SECURITIES
Subprime securities are residential mortgage-backed securities backed by loans to borrowers who typically have lower credit scores and/or other credit deficiencies that prevent them from qualifying for prime or Alt-A mortgages and may have experienced credit problems in the past, such as late payments or bankruptcies. To compensate for the greater risks and higher costs to service the loans, subprime borrowers pay higher interest rates, points, and origination fees.
TAXABLE INCOME
Taxable income is not a measure calculated in accordance with GAAP. Taxable income is pre-tax income for Redwood and all its subsidiaries as calculated for tax purposes. Taxable income calculations differ significantly from GAAP income calculations. A reconciliation of taxable income to GAAP income appears in Table 2 in the Financial Tables in this Review.
TAXABLE SUBSIDIARY
A taxable subsidiary is a subsidiary of a REIT that is not taxed as a REIT and thus pays taxes on its income. A taxable subsidiary is not limited to investing in real estate and it can choose to retain all of its after-tax profits.
| 40 | THE REDWOOD REVIEW | 2ND QUARTER 2012 |


|
Table 1: GAAP Earnings ($ in thousands, except per share data) | 42
| ||
|
2012 Q2 |
2012 Q1 |
2011 Q4 |
2011 Q3 |
2011 Q2 |
2011 Q1 |
2010 Q4 |
2010 Q3 |
2010 Q2 |
Six Months 2012 |
Six Months 2011 |
||||||||||||||||||||||||||||||||||
| Interest income |
$ | 52,629 | $ | 51,355 | $ | 48,512 | $ | 45,096 | $ | 44,126 | $ | 44,025 | $ | 44,956 | $ | 49,249 | $ | 47,730 | $ | 103,984 | $ | 88,151 | ||||||||||||||||||||||
| Discount amortization on securities, net |
8,318 | 8,258 | 9,339 | 10,179 | 10,513 | 12,104 | 12,671 | 10,991 | 10,821 | 16,576 | 22,617 | |||||||||||||||||||||||||||||||||
| Other investment interest income |
- | - | - | - | - | - | - | 2 | 4 | - | - | |||||||||||||||||||||||||||||||||
| Premium amortization expense on loans |
(1,424 | ) | (872 | ) | (1,356 | ) | (1,879 | ) | (1,684 | ) | (1,796 | ) | (1,874 | ) | (1,227 | ) | (1,985 | ) | (2,296 | ) | (3,480 | ) | ||||||||||||||||||||||
| Total interest income |
59,523 | 58,741 | 56,495 | 53,396 | 52,955 | 54,333 | 55,753 | 59,015 | 56,570 | 118,264 | 107,288 | |||||||||||||||||||||||||||||||||
| Interest expense on short-term debt |
(2,299 | ) | (1,827 | ) | (764 | ) | (78 | ) | (7 | ) | (182 | ) | (43 | ) | (2 | ) | (36 | ) | (4,126 | ) | (189 | ) | ||||||||||||||||||||||
| Interest expense on ABS |
(22,350 | ) | (24,564 | ) | (24,030 | ) | (19,907 | ) | (19,509 | ) | (17,827 | ) | (17,800 | ) | (19,582 | ) | (17,582 | ) | (46,914 | ) | (37,336 | ) | ||||||||||||||||||||||
| ABS issuance expense amortization |
(602 | ) | (569 | ) | (630 | ) | (545 | ) | (568 | ) | (559 | ) | (370 | ) | (575 | ) | (475 | ) | (1,171 | ) | (1,127 | ) | ||||||||||||||||||||||
| ABS interest rate agreement expense |
(1,136 | ) | (1,204 | ) | (1,171 | ) | (1,233 | ) | (1,252 | ) | (1,134 | ) | (1,189 | ) | (1,104 | ) | (1,127 | ) | (2,340 | ) | (2,386 | ) | ||||||||||||||||||||||
| ABS issuance premium amortization (expense) income |
(115 | ) | (115 | ) | (136 | ) | (170 | ) | 78 | 96 | 168 | 187 | 196 | (230 | ) | 174 | ||||||||||||||||||||||||||||
| Total ABS expense consolidated from trusts |
(24,203 | ) | (26,452 | ) | (25,967 | ) | (21,855 | ) | (21,251 | ) | (19,424 | ) | (19,191 | ) | (21,074 | ) | (18,988 | ) | (50,655 | ) | (40,675 | ) | ||||||||||||||||||||||
| Interest expense on long-term debt |
(2,379 | ) | (2,376 | ) | (2,384 | ) | (2,384 | ) | (2,375 | ) | (2,367 | ) | (2,390 | ) | (2,619 | ) | (2,140 | ) | (4,755 | ) | (4,742 | ) | ||||||||||||||||||||||
| Net interest income |
30,642 | 28,086 | 27,380 | 29,079 | 29,322 | 32,360 | 34,129 | 35,320 | 35,406 | 58,728 | 61,682 | |||||||||||||||||||||||||||||||||
| Reversal of (provision for) loan losses |
1,340 | (275 | ) | (7,784 | ) | (3,978 | ) | (1,581 | ) | (2,808 | ) | (7,902 | ) | (2,436 | ) | (4,321 | ) | 1,065 | (4,389 | ) | ||||||||||||||||||||||||
| Other market valuation adjustments, net |
(5,449 | ) | (568 | ) | (9,682 | ) | (13,448 | ) | (11,147 | ) | (5,740 | ) | 380 | (1,573 | ) | (7,125 | ) | (6,017 | ) | (16,887 | ) | |||||||||||||||||||||||
| Net interest income after provision and other market valuation adjustments |
26,533 | 27,243 | 9,914 | 11,653 | 16,594 | 23,812 | 26,607 | 31,311 | 23,960 | 53,776 | 40,406 | |||||||||||||||||||||||||||||||||
| Mortgage banking activities, net |
1,756 | 4,242 | - | - | - | - | - | - | - | 5,998 | - | |||||||||||||||||||||||||||||||||
| Fixed compensation expense |
(4,373 | ) | (5,035 | ) | (3,799 | ) | (3,702 | ) | (3,797 | ) | (4,144 | ) | (3,402 | ) | (3,314 | ) | (3,661 | ) | (9,408 | ) | (7,941 | ) | ||||||||||||||||||||||
| Variable compensation expense |
(3,024 | ) | (2,594 | ) | (721 | ) | (863 | ) | (646 | ) | (600 | ) | (2,152 | ) | (2,206 | ) | (1,303 | ) | (5,618 | ) | (1,246 | ) | ||||||||||||||||||||||
| Equity compensation expense |
(2,958 | ) | (2,176 | ) | (2,371 | ) | (1,929 | ) | (2,707 | ) | (2,060 | ) | (1,710 | ) | (1,507 | ) | (2,077 | ) | (5,134 | ) | (4,767 | ) | ||||||||||||||||||||||
| Other operating expense |
(4,810 | ) | (4,829 | ) | (5,683 | ) | (5,013 | ) | (4,937 | ) | (4,709 | ) | (5,673 | ) | (5,218 | ) | (4,186 | ) | (9,639 | ) | (9,646 | ) | ||||||||||||||||||||||
| Total operating expenses |
(15,165 | ) | (14,634 | ) | (12,574 | ) | (11,507 | ) | (12,087 | ) | (11,513 | ) | (12,937 | ) | (12,245 | ) | (11,227 | ) | (29,799 | ) | (23,600 | ) | ||||||||||||||||||||||
| Realized gains on sales, net |
6,995 | 13,507 | - | 313 | 5,433 | 3,956 | 786 | 72 | 16,080 | 20,502 | 9,389 | |||||||||||||||||||||||||||||||||
| Realized gains (losses) on calls, net |
- | 113 | 102 | 832 | 401 | (91 | ) | 726 | 1,494 | - | 113 | 310 | ||||||||||||||||||||||||||||||||
| Realized gains, net |
6,995 | 13,620 | 102 | 1,145 | 5,834 | 3,865 | 1,512 | 1,566 | 16,080 | 20,615 | 9,699 | |||||||||||||||||||||||||||||||||
| Noncontrolling interest |
- | - | - | 20 | (888 | ) | 2,015 | (447 | ) | (532 | ) | (186 | ) | - | 1,127 | |||||||||||||||||||||||||||||
| Provision for income taxes |
(592 | ) | (8 | ) | - | (14 | ) | (14 | ) | (14 | ) | (26 | ) | (202 | ) | (26 | ) | (600 | ) | (28 | ) | |||||||||||||||||||||||
| Net income (loss) |
$ | 19,527 | $ | 30,463 | $ | (2,558 | ) | $ | 1,297 | $ | 9,439 | $ | 18,165 | $ | 14,709 | $ | 19,898 | $ | 28,601 | $ | 49,990 | $ | 27,604 | |||||||||||||||||||||
| Diluted average shares |
78,815 | 79,892 | 78,370 | 78,471 | 79,478 | 79,372 | 78,944 | 78,961 | 78,852 | 79,965 | 79,425 | |||||||||||||||||||||||||||||||||
| Net income (loss) per share |
$ | 0.24 | $ | 0.37 | $ | (0.03 | ) | $ | 0.01 | $ | 0.11 | $ | 0.22 | $ | 0.18 | $ | 0.25 | $ | 0.35 | $ | 0.61 | $ | 0.34 | |||||||||||||||||||||
| THE REDWOOD REVIEW 2ND QUARTER 2012
|
Table 1: GAAP Earnings | |||
|
|
Table 2: Taxable and GAAP Income (Loss)1 Differences and Dividends ($ in thousands, except per share data | |||
| Estimated 2012 Q2 (2) | Estimated Twelve Months 2011 | Actual Twelve Months 2010 | ||||||||||||||||||||||||||||||||||
| Taxable Income |
GAAP Income |
Differences | Taxable Income |
GAAP Income |
Differences | Taxable (Loss) Income |
GAAP Income |
Differences | ||||||||||||||||||||||||||||
| Taxable and GAAP Income (Loss) Differences |
||||||||||||||||||||||||||||||||||||
| Interest income |
$ | 41,860 | $ | 59,523 | $ | (17,663 | ) | $ | 128,353 | $ | 118,264 | $ | 10,089 | $ | 136,750 | $ | 107,288 | $ | 29,462 | |||||||||||||||||
| Interest expense |
(5,570 | ) | (28,881 | ) | 23,311 | (16,759 | ) | (59,536 | ) | 42,777 | (8,545 | ) | (45,606 | ) | 37,061 | |||||||||||||||||||||
| Net interest income |
36,290 | 30,642 | 5,648 | 111,594 | 58,728 | 52,866 | 128,205 | 61,682 | 66,523 | |||||||||||||||||||||||||||
| Provision for loan losses |
- | 1,340 | (1,340 | ) | - | 1,065 | (1,065 | ) | - | (4,389 | ) | 4,389 | ||||||||||||||||||||||||
| Realized credit losses |
(5,298 | ) | - | (5,298 | ) | (57,526 | ) | - | (57,526 | ) | (99,586 | ) | 0 | (99,586 | ) | |||||||||||||||||||||
| Other market valuation adjustments, net |
- | (5,449 | ) | 5,449 | - | (6,017 | ) | 6,017 | - | (16,887 | ) | 16,887 | ||||||||||||||||||||||||
| Mortgage banking activities, net |
(552 | ) | 1,756 | (2,308 | ) | - | - | - | - | - | - | |||||||||||||||||||||||||
| Operating expenses |
(13,044 | ) | (15,165 | ) | 2,121 | (45,459 | ) | (29,799 | ) | (15,660 | ) | (44,804 | ) | (23,600 | ) | (21,204 | ) | |||||||||||||||||||
| Realized gains, net |
- | 6,995 | (6,995 | ) | - | 20,615 | (20,615 | ) | 230 | 9,699 | (9,469 | ) | ||||||||||||||||||||||||
| Provision for income taxes |
(5 | ) | (592 | ) | 587 | (15 | ) | (600 | ) | 585 | (8 | ) | (28 | ) | 20 | |||||||||||||||||||||
| Less: Net (loss) income attributable to noncontrolling interest
|
- | - | - | - | - | - | - | (1,127 | ) | 1,127 | ||||||||||||||||||||||||||
| Income (Loss) |
$ | 17,391 | $ | 19,527 | $ | (2,136 | ) | $ | 8,594 | $ | 43,992 | $ | (35,398 | ) | $ | (15,963 | ) | $ | 27,604 | $ | (43,567 | ) | ||||||||||||||
| REIT taxable income |
$ | 17,415 | $ | 19,269 | $ | 3,383 | ||||||||||||||||||||||||||||||
| Taxable (loss) income at taxable subsidiaries |
(24 | ) | (10,675 | ) | (19,346 | ) | ||||||||||||||||||||||||||||||
| Taxable income (loss) |
$ | 17,391 | $ | 8,594 | $ | (15,963 | ) | |||||||||||||||||||||||||||||
| Shares used for taxable EPS calculation |
79,263 | 78,382 | 78,041 | |||||||||||||||||||||||||||||||||
| REIT taxable income per share (3) |
$ | 0.22 | $ | 0.24 | $ | 0.05 | ||||||||||||||||||||||||||||||
| Taxable (loss) income at taxable subsidiaries per share |
$ | (0.00 | ) | $ | (0.13 | ) | $ | (0.25 | ) | |||||||||||||||||||||||||||
| Taxable income (loss) per share (3) |
$ | 0.22 | $ | 0.11 | $ | (0.20 | ) | |||||||||||||||||||||||||||||
| Dividends |
||||||||||||||||||||||||||||||||||||
| Dividends declared |
$ | 19,767 | $ | 78,382 | $ | 77,942 | ||||||||||||||||||||||||||||||
| Regular dividend per share (4)
|
$ | 0.25 | $ | 1.00 | $ | 1.00 | ||||||||||||||||||||||||||||||
(1) Taxable income (loss) for 2011 and 2012 are estimates until we file our tax returns.
(2) Reconciliation of GAAP income to taxable income (loss) for prior quarters is provided in the respective Redwood Reviews for those quarters.
(3) REIT taxable income (loss) per share and taxable income (loss) per share are based on the number of shares outstanding at the end of each quarter. The annual REIT taxable income (loss) per share and taxable income (loss) per share are the sum of the four quarterly per share estimates.
(4) The characteristics of our 2012 dividend will be determined after the completion of our 2012 tax year. To the extent the REIT has taxable income or net capital gains in 2012, these amounts will be characterized as ordinary income. Dividends in 2011 were characterized as 25% ordinary income, or $19 million, and 75% return of capital, or $59 million. The 2010 dividends were characterized as 62% ordinary income, or $48 million, and 38% return of capital, or $30 million. The portion of Redwood's dividends characterized as a return of capital are not taxable to a shareholder and reduces a shareholder's basis for shares held at each quarterly distribution date.
| THE REDWOOD REVIEW 2ND QUARTER 2012
|
Table 2: Taxable and GAAP Income (Loss) Differences and Dividends |
43
| ||
|
|
Table 3: Book Value and Financial Ratios ($ in millions, except per share data) | 44
| ||
| 2012 Q2 |
2012 Q1 |
2011 Q4 |
2011 Q3 |
2011 Q2 |
2011 Q1 |
2010 Q4 |
2010 Q3 |
2010 Q2 |
||||||||||||||||||||||||||||
| Short-term debt |
$ | 455 | $ | 441 | $ | 428 | $ | - | $ | 41 | $ | - | $ | 44 | $ | - | $ | - | ||||||||||||||||||
| Long-term debt |
140 | 140 | 140 | 140 | 140 | 140 | 140 | 140 | 140 | |||||||||||||||||||||||||||
| Redwood debt (1) |
$ | 595 | $ | 581 | $ | 568 | $ | 140 | $ | 181 | $ | 140 | $ | 184 | $ | 140 | $ | 140 | ||||||||||||||||||
| Redwood debt |
$ | 595 | $ | 581 | $ | 568 | $ | 140 | $ | 181 | $ | 140 | $ | 184 | $ | 140 | $ | 140 | ||||||||||||||||||
| ABS obligations of consolidated securitization entities and resecuritization |
3,564 | 3,704 | 4,139 | 4,293 | 3,839 | 3,957 | 3,943 | 3,832 | 3,961 | |||||||||||||||||||||||||||
| Consolidated GAAP Debt |
$ | 4,159 | $ | 4,285 | $ | 4,707 | $ | 4,433 | $ | 4,020 | $ | 4,097 | $ | 4,127 | $ | 3,972 | $ | 4,101 | ||||||||||||||||||
| GAAP stockholders’ equity |
$ | 951 | $ | 962 | $ | 893 | $ | 959 | $ | 1,025 | $ | 1,075 | $ | 1,065 | $ | 1,016 | $ | 991 | ||||||||||||||||||
| Redwood debt to equity |
0.6x | 0.6x | 0.6x | 0.1x | 0.2x | 0.1x | 0.2x | 0.1x | 0.1x | |||||||||||||||||||||||||||
| Redwood debt to (equity + debt) |
38% | 38% | 39% | 13% | 15% | 12% | 15% | 12% | 12% | |||||||||||||||||||||||||||
| Consolidated GAAP Debt to equity |
4.4x | 4.5x | 5.3x | 4.6x | 3.9x | 3.8x | 3.7x | 3.9x | 4.0x | |||||||||||||||||||||||||||
| Consolidated GAAP Debt to (equity + GAAP debt) |
81% | 82% | 84% | 82% | 80% | 79% | 79% | 80% | 81% | |||||||||||||||||||||||||||
| GAAP stockholders’ equity |
$ | 951 | $ | 962 | $ | 893 | $ | 959 | $ | 1,025 | $ | 1,075 | $ | 1,065 | $ | 1,016 | $ | 991 | ||||||||||||||||||
| Balance sheet mark-to-market adjustments |
24 | 12 | (13 | ) | 32 | 81 | 122 | 112 | 61 | 38 | ||||||||||||||||||||||||||
| Core equity (non-GAAP) |
$ | 927 | $ | 950 | $ | 906 | $ | 927 | $ | 944 | $ | 953 | $ | 953 | $ | 955 | $ | 953 | ||||||||||||||||||
| Shares outstanding at period end (in thousands) |
79,263 | 78,756 | 78,556 | 78,495 | 78,555 | 78,139 | 78,125 | 77,984 | 77,908 | |||||||||||||||||||||||||||
| GAAP equity per share |
$ | 12.00 | $ | 12.22 | $ | 11.36 | $ | 12.22 | $ | 13.04 | $ | 13.76 | $ | 13.63 | $ | 13.02 | $ | 12.71 | ||||||||||||||||||
| Adjustments: GAAP equity to estimated economic value (2) |
||||||||||||||||||||||||||||||||||||
| Investments in Consolidated Entities |
0.09 | 0.10 | 0.07 | 0.06 | (0.01 | ) | (0.06 | ) | (0.16 | ) | (0.28 | ) | (0.34 | ) | ||||||||||||||||||||||
| Long-term debt |
0.85 | 0.93 | 1.06 | 1.06 | 0.78 | 0.75 | 0.84 | 0.99 | 1.00 | |||||||||||||||||||||||||||
| ABS issued - Resecuritization |
(0.07 | ) | (0.07 | ) | (0.04 | ) | (0.01 | ) | - | - | - | - | - | |||||||||||||||||||||||
| Estimate of economic value per share (non-GAAP) |
$ | 12.87 | $ | 13.18 | $ | 12.45 | $ | 13.33 | $ | 13.81 | $ | 14.45 | $ | 14.31 | $ | 13.73 | $ | 13.37 | ||||||||||||||||||
(1) Excludes obligations of consolidated securitization entities and the resecuritization we engaged in during the third quarter of 2011.
(2) Differences between GAAP and economic value per share reflect our estimate of the economic value of investments in Consolidated Entitie, our long-term debt, and ABS issued - Resecuritization. See paged 14 and 15 for an explanation of these adjustments. In reviewing the components of book value and economic value, there are a number of important factors and limitations to consider. Book value and economic value are calculated as of particular points in time based on our existing assets and liabilities and do not incorporate other factors that may have a significant impact on that value, most notably the impact of future business activities. As a result, these values do not necessarily represent an estimate of our net realizable value, liquidation value, or our market value as a whole. Amounts we ultimately realize from the disposition of assets or settlement of liabilities may vary significantly from these values. Because temporary changes in market conditions can substantially affect value, we do not believe that short-term fluctuations in the value of our assets and liabilities are necessarily representative of the effectiveness of our investment strategy or the long-term underlying value of our business. When quoted market prices or observable market data are not available to estimate fair value, we rely on unobservable inputs, which are generally more subjective and involve a high degree of management judgment and assumptions. These assumptions may have a significant effect on our estimates of value, and the use of different assumptions as well as changes in market conditions could have a material effect on our results of operations or financial condition.
| THE REDWOOD REVIEW 2ND QUARTER 2012
|
Table 3: Book Value and Financial Ratios | |||
|
|
Table 4: Yields and Profitability Ratios1 ($ in thousands) | |||
|
2012 Q2 |
2012 Q1 |
2011 Q4 |
2011 Q3 |
2011 Q2 |
2011 Q1 |
2010 Q4 |
2010 Q3 |
2010 Q2 |
Six Months 2012 |
Six Months 2011 |
||||||||||||||||||||||||||||||||||
| Interest income |
$ | 59,523 | $ | 58,741 | $ | 56,495 | $ | 53,396 | $ | 52,955 | $ | 54,333 | $ | 55,753 | $ | 59,015 | $ | 56,570 | $ | 118,264 | $ | 107,288 | ||||||||||||||||||||||
| Average consolidated earning assets |
$ | 5,144,382 | $ | 5,351,918 | $ | 5,419,721 | $ | 5,143,814 | $ | 5,080,343 | $ | 5,107,979 | $ | 4,980,935 | $ | 5,030,680 | $ | 5,139,945 | $ | 5,248,149 | $ | 5,094,229 | ||||||||||||||||||||||
| Asset yield |
4.63% | 4.39% | 4.17% | 4.15% | 4.17% | 4.25% | 4.48% | 4.69% | 4.40% | 4.51% | 4.21% | |||||||||||||||||||||||||||||||||
| Interest expense |
$ | (28,881 | ) | $ | (30,655 | ) | $ | (29,115 | ) | $ | (24,317 | ) | $ | (23,633 | ) | $ | (21,973 | ) | $ | (21,624 | ) | $ | (23,695 | ) | $ | (21,164 | ) | $ | (59,536 | ) | $ | (45,606 | ) | |||||||||||
| Average consolidated interest-bearing liabilities |
$ | 4,208,287 | $ | 4,424,247 | $ | 4,481,303 | $ | 4,105,088 | $ | 4,025,216 | $ | 3,977,010 | $ | 3,937,895 | $ | 4,016,680 | $ | 4,077,992 | $ | 4,316,267 | $ | 4,001,246 | ||||||||||||||||||||||
| Cost of funds |
2.75% | 2.77% | 2.60% | 2.37% | 2.35% | 2.21% | 2.20% | 2.36% | 2.08% | 2.76% | 2.28% | |||||||||||||||||||||||||||||||||
| Asset yield |
4.63% | 4.39% | 4.17% | 4.15% | 4.17% | 4.25% | 4.48% | 4.69% | 4.40% | 4.51% | 4.21% | |||||||||||||||||||||||||||||||||
| Cost of funds |
(2.75% | ) | (2.77% | ) | (2.60% | ) | (2.37% | ) | (2.35% | ) | (2.21% | ) | (2.20% | ) | (2.36% | ) | (2.08% | ) | (2.76% | ) | (2.28% | ) | ||||||||||||||||||||||
| Interest rate spread |
1.88% | 1.62% | 1.57% | 1.78% | 1.82% | 2.04% | 2.28% | 2.33% | 2.33% | 1.75% | 1.93% | |||||||||||||||||||||||||||||||||
| Net interest income |
$ | 30,642 | $ | 28,086 | $ | 27,380 | $ | 29,079 | $ | 29,322 | $ | 32,360 | $ | 34,129 | $ | 35,320 | $ | 35,406 | $ | 58,728 | $ | 61,682 | ||||||||||||||||||||||
| Average consolidated earning assets |
$ | 5,144,382 | $ | 5,351,918 | $ | 5,419,721 | $ | 5,143,814 | $ | 5,080,343 | $ | 5,107,979 | $ | 4,980,935 | $ | 5,030,680 | $ | 5,139,945 | $ | 5,248,149 | $ | 5,094,229 | ||||||||||||||||||||||
| Net interest margin |
2.38% | 2.10% | 2.02% | 2.26% | 2.31% | 2.53% | 2.74% | 2.81% | 2.76% | 2.24% | 2.42% | |||||||||||||||||||||||||||||||||
| Operating expenses |
$ | (15,165 | ) | $ | (14,634 | ) | $ | (12,574 | ) | $ | (11,507 | ) | $ | (12,087 | ) | $ | (11,513 | ) | $ | (12,937 | ) | $ | (12,245 | ) | $ | (11,227 | ) | $ | (29,799 | ) | $ | (23,600 | ) | |||||||||||
| Average total assets |
$ | 5,307,961 | $ | 5,505,797 | $ | 5,577,206 | $ | 5,303,614 | $ | 5,263,529 | $ | 5,310,376 | $ | 5,141,550 | $ | 5,161,498 | $ | 5,263,730 | $ | 5,406,878 | $ | 5,286,967 | ||||||||||||||||||||||
| Average total equity |
$ | 945,805 | $ | 926,138 | $ | 912,051 | $ | 976,676 | $ | 1,035,063 | $ | 1,092,580 | $ | 1,038,045 | $ | 1,003,372 | $ | 1,005,212 | $ | 935,971 | $ | 1,063,663 | ||||||||||||||||||||||
| Operating expenses / net interest income |
49.49% | 52.10% | 45.92% | 39.57% | 41.22% | 35.58% | 37.91% | 34.67% | 31.71% | 50.74% | 38.26% | |||||||||||||||||||||||||||||||||
| Operating expenses / average total assets |
1.14% | 1.06% | 0.90% | 0.87% | 0.92% | 0.87% | 1.01% | 0.95% | 0.85% | 1.10% | 0.89% | |||||||||||||||||||||||||||||||||
| Operating expenses / average total equity |
6.41% | 6.32% | 5.51% | 4.71% | 4.67% | 4.21% | 4.99% | 4.88% | 4.47% | 6.37% | 4.44% | |||||||||||||||||||||||||||||||||
| GAAP net income (loss) |
$ | 19,527 | $ | 30,463 | $ | (2,558 | ) | $ | 1,297 | $ | 9,439 | $ | 18,165 | $ | 14,709 | $ | 19,898 | $ | 28,601 | $ | 49,990 | $ | 27,604 | |||||||||||||||||||||
| GAAP net income (loss) / average total assets |
1.47% | 2.21% | (0.18% | ) | 0.10% | 0.72% | 1.37% | 1.14% | 1.54% | 2.17% | 1.85% | 1.04% | ||||||||||||||||||||||||||||||||
| GAAP net income (loss) / average equity (GAAP ROE) |
8.26% | 13.16% | (1.12% | ) | 0.53% | 3.65% | 6.65% | 5.67% | 7.93% | 11.38% | 10.68% | 5.19% | ||||||||||||||||||||||||||||||||
| GAAP net income (loss) / average core equity (adjusted ROE) (2) |
8.47% | 13.33% | (1.13% | ) | 0.56% | 4.04% | 7.53% | 6.14% | 8.25% | 12.00% | 10.89% | 5.82% | ||||||||||||||||||||||||||||||||
| Average core equity (2) |
$ | 921,663 | $ | 914,052 | $ | 908,915 | $ | 921,048 | $ | 934,205 | $ | 964,554 | $ | 958,194 | $ | 964,249 | $ | 953,720 | $ | 917,857 | $ | 949,296 | ||||||||||||||||||||||
(1) All percentages in this table are shown on an annualized basis.
(2) Core equity is a non-GAAP metric and is equal to GAAP equity excluding accumulated other comprehensive income (loss).
| THE REDWOOD REVIEW 2ND QUARTER 2012
|
Table 4: Yields and Profitability Ratios |
45
| ||
|
|
Table 5: Average Balance Sheet ($ in thousands) | 46
| ||
| 2012 Q2 |
2012 Q1 |
2011 Q4 |
2011 Q3 |
2011 Q2 |
2011 Q1 |
2010 Q4 |
2010 Q3 |
2010 Q2 |
Six Months 2012 |
Six Months 2011 |
||||||||||||||||||||||||||||||||||
| Real estate assets at Redwood |
||||||||||||||||||||||||||||||||||||||||||||
| Commercial loans |
$ | 199,440 | $ | 169,432 | $ | 123,367 | $ | 79,445 | $ | 59,545 | $ | 36,434 | $ | 14,095 | $ | 242 | $ | 243 | $ | 184,436 | $ | 48,053 | ||||||||||||||||||||||
| Residential loans |
363,882 | 319,353 | 306,869 | 313,763 | 123,914 | 204,847 | 169,691 | 16,463 | 2,299 | 341,618 | 164,157 | |||||||||||||||||||||||||||||||||
| Senior residential securities |
||||||||||||||||||||||||||||||||||||||||||||
| Prime |
457,549 | 325,619 | 248,211 | 244,502 | 246,957 | 255,884 | 262,048 | 270,286 | 278,472 | 391,584 | 251,396 | |||||||||||||||||||||||||||||||||
| Non-prime |
262,084 | 280,970 | 280,066 | 283,043 | 283,784 | 307,253 | 321,655 | 316,089 | 302,461 | 271,527 | 295,454 | |||||||||||||||||||||||||||||||||
| Total senior residential securities |
719,633 | 606,589 | 528,277 | 527,545 | 530,741 | 563,137 | 583,703 | 586,375 | 580,933 | 663,111 | 546,850 | |||||||||||||||||||||||||||||||||
| Residential Re-REMIC securities |
105,281 | 87,001 | 74,560 | 41,598 | 30,447 | 32,648 | 32,917 | 33,250 | 34,385 | 96,141 | 31,541 | |||||||||||||||||||||||||||||||||
| Subordinate residential securities |
||||||||||||||||||||||||||||||||||||||||||||
| Prime |
104,078 | 81,253 | 69,477 | 72,199 | 63,141 | 53,046 | 45,914 | 35,794 | 38,079 | 92,665 | 58,121 | |||||||||||||||||||||||||||||||||
| Non-prime |
8,325 | 9,721 | 11,433 | 10,885 | 11,183 | 12,140 | 11,890 | 9,181 | 7,708 | 9,023 | 11,659 | |||||||||||||||||||||||||||||||||
| Total subordinate residential securities |
112,403 | 90,974 | 80,910 | 83,084 | 74,324 | 65,186 | 57,804 | 44,975 | 45,787 | 101,688 | 69,780 | |||||||||||||||||||||||||||||||||
| Commercial subordinate securities |
3,980 | 3,946 | 4,272 | 4,720 | 5,200 | 6,288 | 6,948 | 7,274 | 7,417 | 3,963 | 5,741 | |||||||||||||||||||||||||||||||||
| CDO |
14 | 762 | 960 | 1,247 | 1,297 | 1,252 | 973 | 1,103 | 1,207 | 388 | 1,275 | |||||||||||||||||||||||||||||||||
| Total real estate assets at Redwood |
1,504,633 | 1,278,057 | 1,119,215 | 1,051,402 | 825,468 | 909,792 | 866,131 | 689,682 | 672,270 | 1,391,345 | 867,397 | |||||||||||||||||||||||||||||||||
| Earning assets at Acacia |
262,959 | 252,907 | 255,801 | 285,985 | 315,039 | 347,786 | 311,949 | 292,468 | 290,060 | 257,933 | 331,467 | |||||||||||||||||||||||||||||||||
| Earning assets at Consolidated Sequoia |
3,258,137 | 3,597,081 | 3,838,327 | 3,600,122 | 3,684,680 | 3,576,778 | 3,587,904 | 3,710,002 | 3,751,384 | 3,427,609 | 3,631,027 | |||||||||||||||||||||||||||||||||
| Earning assets at the Fund (2) |
- | - | - | - | 4,948 | 22,280 | 33,001 | 34,334 | 35,526 | - | 13,566 | |||||||||||||||||||||||||||||||||
| Total earning assets at Other Consolidated Entities |
3,521,096 | 3,849,988 | 4,094,128 | 3,886,107 | 4,004,667 | 3,946,844 | 3,932,854 | 4,036,804 | 4,076,970 | 3,685,542 | 3,976,060 | |||||||||||||||||||||||||||||||||
| Cash and cash equivalents |
94,511 | 211,786 | 203,242 | 150,677 | 149,350 | 123,317 | 102,099 | 265,071 | 339,212 | 153,148 | 136,405 | |||||||||||||||||||||||||||||||||
| Earning assets |
5,120,240 | 5,339,831 | 5,416,585 | 5,088,186 | 4,979,485 | 4,979,953 | 4,901,084 | 4,991,557 | 5,088,452 | 5,230,035 | 4,979,862 | |||||||||||||||||||||||||||||||||
| Balance sheet mark-to-market adjustments |
24,142 | 12,087 | 3,136 | 55,628 | 100,858 | 128,026 | 79,851 | 39,123 | 51,493 | 18,114 | 114,367 | |||||||||||||||||||||||||||||||||
| Earning assets - reported value |
5,144,382 | 5,351,918 | 5,419,721 | 5,143,814 | 5,080,343 | 5,107,979 | 4,980,935 | 5,030,680 | 5,139,945 | 5,248,149 | 5,094,229 | |||||||||||||||||||||||||||||||||
| Other assets |
163,579 | 153,879 | 157,485 | 159,800 | 183,186 | 202,397 | 160,615 | 130,818 | 123,785 | 158,729 | 192,738 | |||||||||||||||||||||||||||||||||
| Total assets |
$ | 5,307,961 | $ | 5,505,797 | $ | 5,577,206 | $ | 5,303,614 | $ | 5,263,529 | $ | 5,310,376 | $ | 5,141,550 | $ | 5,161,498 | $ | 5,263,730 | $ | 5,406,878 | $ | 5,286,967 | ||||||||||||||||||||||
| Short-term debt |
$ | 474,053 | $ | 362,107 | $ | 157,992 | $ | 18,116 | $ | 1,797 | $ | 47,976 | $ | 11,265 | $ | - | $ | 7,920 | $ | 418,080 | $ | 24,759 | ||||||||||||||||||||||
| Consolidated Sequoia ABS issued |
3,166,476 | 3,504,155 | 3,738,132 | 3,510,089 | 3,589,286 | 3,487,214 | 3,513,293 | 3,623,816 | 3,662,974 | 3,335,316 | 3,538,532 | |||||||||||||||||||||||||||||||||
| Resecuritization ABS issued |
197,808 | 211,440 | 222,652 | 180,769 | - | - | - | - | - | 204,624 | - | |||||||||||||||||||||||||||||||||
| Acacia ABS issued |
231,673 | 208,281 | 224,273 | 257,872 | 295,902 | 303,601 | 274,630 | 254,244 | 268,715 | 219,977 | 299,730 | |||||||||||||||||||||||||||||||||
| Other liabilities |
153,869 | 155,412 | 183,852 | 221,592 | 200,708 | 232,062 | 151,332 | 126,428 | 164,764 | 154,640 | 216,443 | |||||||||||||||||||||||||||||||||
| Long-term debt |
138,277 | 138,264 | 138,254 | 138,242 | 138,231 | 138,219 | 138,707 | 138,620 | 138,383 | 138,270 | 138,225 | |||||||||||||||||||||||||||||||||
| Total liabilities |
4,362,156 | 4,579,659 | 4,665,155 | 4,326,680 | 4,225,924 | 4,209,072 | 4,089,227 | 4,143,108 | 4,242,755 | 4,470,907 | 4,217,689 | |||||||||||||||||||||||||||||||||
| Noncontrolling interest |
- | - | - | 258 | 2,542 | 8,724 | 14,278 | 15,018 | 15,763 | - | 5,615 | |||||||||||||||||||||||||||||||||
| Core equity (1) |
921,663 | 914,052 | 908,915 | 921,048 | 934,205 | 964,554 | 958,194 | 964,249 | 953,720 | 917,857 | 949,296 | |||||||||||||||||||||||||||||||||
| Accumulated other comprehensive income (loss) |
24,142 | 12,086 | 3,136 | 55,628 | 100,858 | 128,026 | 79,851 | 39,123 | 51,493 | 18,114 | 114,367 | |||||||||||||||||||||||||||||||||
| Total equity |
945,805 | 926,138 | 912,051 | 976,676 | 1,035,063 | 1,092,580 | 1,038,045 | 1,003,372 | 1,005,212 | 935,971 | 1,063,663 | |||||||||||||||||||||||||||||||||
| Total liabilities and equity |
$ | 5,307,961 | $ | 5,505,797 | $ | 5,577,206 | $ | 5,303,614 | $ | 5,263,529 | $ | 5,310,376 | $ | 5,141,550 | $ | 5,161,498 | $ | 5,263,730 | $ | 5,406,878 | $ | 5,286,967 | ||||||||||||||||||||||
(1) Core equity is a non-GAAP metric and is equal to GAAP equity excluding accumulated other comprehensive income (loss).
(2) Refers to the Redwood Opportunity Fund, which liquidated in the the third quarter of 2011.
| THE REDWOOD REVIEW 2ND QUARTER 2012
|
Table 5: Average Balance Sheet | |||
|
|
Table 6: Balances & Yields by Securities Portfolio at Redwood(1) ($ in thousands) | |||
|
2012 Q2 |
2012 Q1 |
2011 Q4 |
2011 Q3 |
2011 Q2 |
2011 Q1 |
2012 Q2 |
2012 Q1 |
2011 Q4 |
2011 Q3 |
2011 Q2 |
2011 Q1 |
|||||||||||||||||||||||||||||||||||||||||
| Residential Prime Senior AFS |
|
Residential Non-Prime Subordinate AFS |
|
|||||||||||||||||||||||||||||||||||||||||||||||||
| Principal balance |
$ | 540,032 | $ | 490,141 | $ | 341,780 | $ | 329,466 | $ | 336,876 | $ | 346,317 | Principal balance |
$ | 21,123 | $ | 22,342 | $ | 29,864 | $ | 26,063 | $ | 26,940 | $ | 29,095 | |||||||||||||||||||||||||||
| Unamortized discount |
(52,686 | ) | (57,193 | ) | (58,424 | ) | (59,415 | ) | (71,985 | ) | (78,306 | ) | Unamortized discount |
(7,682 | ) | (7,403 | ) | (9,495 | ) | (7,783 | ) | (8,196 | ) | (8,466 | ) | |||||||||||||||||||||||||||
| Credit reserve |
(34,990 | ) | (31,011 | ) | (27,806 | ) | (28,330 | ) | (18,433 | ) | (16,679 | ) | Credit reserve |
(5,299 | ) | (6,566 | ) | (8,477 | ) | (7,639 | ) | (7,913 | ) | (9,469 | ) | |||||||||||||||||||||||||||
| Unrealized gains, net |
38,446 | 34,846 | 22,690 | 35,204 | 39,488 | 54,860 | Unrealized (losses) gains, net |
(275 | ) | (231 | ) | (739 | ) | (180 | ) | 46 | 868 | |||||||||||||||||||||||||||||||||||
| Fair value |
$ | 490,802 | $ | 436,783 | $ | 278,240 | $ | 276,925 | $ | 285,946 | $ | 306,192 | Fair value |
$ | 7,867 | $ | 8,142 | $ | 11,153 | $ | 10,461 | $ | 10,877 | $ | 12,028 | |||||||||||||||||||||||||||
| Average amortized cost |
$ | 442,296 | $ | 316,505 | $ | 248,211 | $ | 244,502 | $ | 246,957 | $ | 255,884 | Average amortized cost |
$ | 8,237 | $ | 9,599 | $ | 11,283 | $ | 10,727 | $ | 11,017 | $ | 11,957 | |||||||||||||||||||||||||||
| Interest income |
$ | 9,006 | $ | 7,161 | $ | 6,651 | $ | 6,894 | $ | 7,099 | $ | 7,479 | Interest income |
$ | 419 | $ | 489 | $ | 509 | $ | 502 | $ | 531 | $ | 598 | |||||||||||||||||||||||||||
| Annualized yield |
8.14% | 9.05% | 10.72% | 11.28% | 11.50% | 11.69% | Annualized yield |
20.35% | 20.38% | 18.04% | 18.73% | 19.27% | 20.01% | |||||||||||||||||||||||||||||||||||||||
| Residential Non-Prime Senior AFS |
|
Commercial Subordinate AFS |
|
|||||||||||||||||||||||||||||||||||||||||||||||||
| Principal balance |
$ | 312,897 | $ | 329,182 | $ | 349,385 | $ | 357,809 | $ | 367,209 | $ | 372,394 | Principal balance |
$ | 42,602 | $ | 43,226 | $ | 50,499 | $ | 54,061 | $ | 58,127 | $ | 74,782 | |||||||||||||||||||||||||||
| Unamortized discount |
(60,341 | ) | (68,101 | ) | (75,661 | ) | (71,365 | ) | (81,672 | ) | (87,569 | ) | Unamortized discount |
(5,532 | ) | (5,651 | ) | (3,554 | ) | (2,551 | ) | (4,361 | ) | (4,784 | ) | |||||||||||||||||||||||||||
| Credit reserve |
(18,891 | ) | (15,829 | ) | (16,536 | ) | (24,663 | ) | (19,129 | ) | (17,292 | ) | Credit reserve |
(33,013 | ) | (33,668 | ) | (43,012 | ) | (47,197 | ) | (48,987 | ) | (64,717 | ) | |||||||||||||||||||||||||||
| Unrealized (losses) gains, net |
8,342 | 10,027 | (1,464 | ) | 16,380 | 22,310 | 30,225 | Unrealized gains, net |
1,704 | 1,931 | 1,512 | 1,574 | 1,086 | 1,081 | ||||||||||||||||||||||||||||||||||||||
| Fair value |
$ | 242,007 | $ | 255,279 | $ | 255,724 | $ | 278,161 | $ | 288,718 | $ | 297,758 | Fair value |
$ | 5,761 | $ | 5,838 | $ | 5,445 | $ | 5,887 | $ | 5,865 | $ | 6,362 | |||||||||||||||||||||||||||
| Average amortized cost |
$ | 239,711 | $ | 260,546 | $ | 259,281 | $ | 263,760 | $ | 265,130 | $ | 287,991 | Average amortized cost |
$ | 3,980 | $ | 3,946 | $ | 4,272 | $ | 4,720 | $ | 5,199 | $ | 6,288 | |||||||||||||||||||||||||||
| Interest income |
$ | 5,402 | $ | 5,984 | $ | 6,436 | $ | 7,199 | $ | 7,418 | $ | 8,338 | Interest income |
$ | 605 | $ | 480 | $ | 377 | $ | 553 | $ | 558 | $ | 492 | |||||||||||||||||||||||||||
| Annualized yield |
9.01% | 9.19% | 9.93% | 10.92% | 11.19% | 11.58% | Annualized yield |
60.80% | 48.65% | 35.33% | 46.87% | 42.95% | 31.30% | |||||||||||||||||||||||||||||||||||||||
| Residential Re-REMIC AFS |
|
CDO Subordinate AFS |
|
|||||||||||||||||||||||||||||||||||||||||||||||||
| Principal balance |
$ | 236,470 | $ | 252,941 | $ | 220,697 | $ | 194,245 | $ | 131,860 | $ | 131,860 | Principal balance |
$ | 7,275 | $ | 7,244 | $ | 10,717 | $ | 10,689 | $ | 11,863 | $ | 11,837 | |||||||||||||||||||||||||||
| Unamortized discount |
(73,438 | ) | (81,817 | ) | (78,226 | ) | (68,861 | ) | (52,375 | ) | (54,855 | ) | Unamortized discount |
- | - | - | (1,082 | ) | (1,083 | ) | (1,082 | ) | ||||||||||||||||||||||||||||||
| Credit reserve |
(58,618 | ) | (63,702 | ) | (60,563 | ) | (58,106 | ) | (49,033 | ) | (46,546 | ) | Credit reserve |
(7,275 | ) | (7,244 | ) | (10,717 | ) | (9,607 | ) | (10,780 | ) | (10,755 | ) | |||||||||||||||||||||||||||
| Unrealized gains, net |
43,023 | 47,239 | 37,458 | 45,822 | 47,123 | 55,038 | Unrealized gains, net |
50 | 50 | 50 | 50 | 100 | - | |||||||||||||||||||||||||||||||||||||||
| Fair value |
$ | 147,437 | $ | 154,661 | $ | 119,366 | $ | 113,100 | $ | 77,575 | $ | 85,497 | Fair value |
$ | 50 | $ | 50 | $ | 50 | $ | 50 | $ | 100 | $ | - | |||||||||||||||||||||||||||
| Average amortized cost |
$ | 105,281 | $ | 87,001 | $ | 74,560 | $ | 41,598 | $ | 30,447 | $ | 32,648 | Average amortized cost |
$ | - | $ | - | $ | - | $ | - | $ | - | $ | - | |||||||||||||||||||||||||||
| Interest income |
$ | 3,184 | $ | 2,823 | $ | 2,473 | $ | 1,675 | $ | 1,437 | $ | 1,480 | Interest income |
$ | - | $ | - | $ | - | $ | - | $ | - | $ | 34 | |||||||||||||||||||||||||||
| Annualized yield |
12.10% | 12.98% | 13.27% | 16.11% | 18.87% | 18.13% | Annualized yield |
N/A | N/A | N/A | N/A | N/A | N/A | |||||||||||||||||||||||||||||||||||||||
| Residential Prime Subordinate AFS |
|
Trading Securities |
|
|||||||||||||||||||||||||||||||||||||||||||||||||
| Principal balance |
$ | 252,207 | $ | 247,498 | $ | 207,226 | $ | 227,562 | $ | 248,331 | $ | 258,615 | ||||||||||||||||||||||||||||||||||||||||
| Unamortized discount |
(30,677 | ) | (24,019 | ) | (14,027 | ) | (22,097 | ) | (29,434 | ) | (24,016 | ) | Residential Senior |
$ | 39,263 | $ | 41,540 | $ | 20,608 | $ | 20,756 | $ | 18,686 | $ | 18,868 | |||||||||||||||||||||||||||
| Credit reserve |
(103,628 | ) | (118,510 | ) | (128,879 | ) | (134,116 | ) | (146,391 | ) | (179,587 | ) | Residential Subordinate |
571 | 488 | 473 | 483 | 462 | 537 | |||||||||||||||||||||||||||||||||
| Unrealized (losses) gains, net |
5,103 | 819 | (5,603 | ) | (1,071 | ) | (963 | ) | 3,858 | CDO Subordinate |
14 | 14 | 960 | 960 | 1,303 | 1,296 | ||||||||||||||||||||||||||||||||||||
| Fair value |
$ | 123,005 | $ | 105,788 | $ | 58,717 | $ | 70,278 | $ | 71,543 | $ | 58,870 | Fair value |
$ | 39,848 | $ | 42,042 | $ | 22,041 | $ | 22,199 | $ | 20,451 | $ | 20,701 | |||||||||||||||||||||||||||
| Average amortized cost |
$ | 103,635 | $ | 80,903 | $ | 69,148 | $ | 71,873 | $ | 62,786 | $ | 52,642 | Average fair value |
$ | 38,171 | $ | 30,773 | $ | 22,223 | $ | 21,014 | $ | 20,472 | $ | 21,101 | |||||||||||||||||||||||||||
| Interest income |
$ | 4,106 | $ | 3,709 | $ | 3,709 | $ | 3,618 | $ | 3,582 | $ | 4,110 | Interest income |
$ | 3,099 | $ | 2,534 | $ | 1,883 | $ | 2,032 | $ | 2,008 | $ | 2,124 | |||||||||||||||||||||||||||
| Annualized yield |
15.85% | 18.34% | 21.46% | 20.14% | 22.82% | 31.23% | Annualized yield |
32.47% | 32.94% | 33.89% | 38.68% | 39.24% | 40.27% | |||||||||||||||||||||||||||||||||||||||
(1) Annualized yields for AFS portfolios are based on average amortized cost. Cash flows from many of our subordinate securities can be volatile and in certain cases (e.g., when the fair value of certain securities are close to zero) any interest income earned can result in unusually high reported yields that are not sustainable and not necessarily meaningful.
| THE REDWOOD REVIEW 2ND QUARTER 2012
|
Table 6: Balances & Yields by Securities Portfolio at Redwood |
47
| ||
|
|
Table 7: Securities and Loans Portfolio Activity at Redwood ($ in thousands) | 48
| ||
|
2012 Q2 |
2012 Q1 |
2011 Q4 |
2011 Q3 |
2011 Q2 |
2011 Q1 |
2012 Q2 |
2012 Q1 |
2011 Q4 |
2011 Q3 |
2011 Q2 |
2011 Q1 |
|||||||||||||||||||||||||||||||||||||||||
| Residential Prime Senior |
|
Commercial Subordinate |
|
|||||||||||||||||||||||||||||||||||||||||||||||||
| Beginning fair value |
$ | 458,648 | $ | 278,240 | $ | 276,925 | $ | 285,946 | $ | 306,192 | $ | 315,891 | Beginning fair value |
$ | 5,838 | $ | 5,445 | $ | 5,887 | $ | 5,865 | $ | 6,362 | $ | 7,496 | |||||||||||||||||||||||||||
| Acquisitions |
94,702 | 193,837 | 20,373 | 2,433 | 8,844 | 3,317 | Acquisitions |
- | - | - | - | - | - | |||||||||||||||||||||||||||||||||||||||
| Sales |
(24,775 | ) | (20,954 | ) | - | - | (8,554 | ) | (2,825 | ) | Sales |
- | - | - | - | - | (2,116 | ) | ||||||||||||||||||||||||||||||||||
| Effect of principal payments |
(20,623 | ) | (10,550 | ) | (8,411 | ) | (9,235 | ) | (11,019 | ) | (11,655 | ) | Effect of principal payments |
- | - | - | - | - | - | |||||||||||||||||||||||||||||||||
| Change in fair value, net |
(849 | ) | 18,075 | (10,647 | ) | (2,219 | ) | (9,517 | ) | 1,464 | Change in fair value, net |
(77 | ) | 393 | (442 | ) | 22 | (497 | ) | 982 | ||||||||||||||||||||||||||||||||
| Ending fair value |
$ | 507,103 | $ | 458,648 | $ | 278,240 | $ | 276,925 | $ | 285,946 | $ | 306,192 | Ending fair value |
$ | 5,761 | $ | 5,838 | $ | 5,445 | $ | 5,887 | $ | 5,865 | $ | 6,362 | |||||||||||||||||||||||||||
| Residential Non-Prime Senior |
|
CDO Subordinate |
|
|||||||||||||||||||||||||||||||||||||||||||||||||
| Beginning fair value |
$ | 274,954 | $ | 276,332 | $ | 298,917 | $ | 307,404 | $ | 316,626 | $ | 346,107 | Beginning fair value |
$ | 64 | $ | 1,010 | $ | 1,010 | $ | 1,403 | $ | 1,296 | $ | 1,038 | |||||||||||||||||||||||||||
| Acquisitions |
13,783 | 19,521 | 1,299 | 1,202 | 3,154 | - | Acquisitions |
- | - | - | - | - | - | |||||||||||||||||||||||||||||||||||||||
| Sales |
(14,018 | ) | (25,408 | ) | - | - | - | (24,486 | ) | Sales |
- | (859 | ) | - | - | - | - | |||||||||||||||||||||||||||||||||||
| Effect of principal payments |
(8,607 | ) | (7,164 | ) | (7,880 | ) | (8,509 | ) | (7,613 | ) | (9,033 | ) | Effect of principal payments |
- | - | - | - | - | - | |||||||||||||||||||||||||||||||||
| Change in fair value, net |
(1,142 | ) | 11,673 | (16,004 | ) | (1,180 | ) | (4,763 | ) | 4,038 | Change in fair value, net |
- | (87 | ) | - | (393 | ) | 107 | 258 | |||||||||||||||||||||||||||||||||
| Ending fair value |
$ | 264,970 | $ | 274,954 | $ | 276,332 | $ | 298,917 | $ | 307,404 | $ | 316,626 | Ending fair value |
$ | 64 | $ | 64 | $ | 1,010 | $ | 1,010 | $ | 1,403 | $ | 1,296 | |||||||||||||||||||||||||||
| Residential Re-REMIC |
|
Residential Loans |
|
|||||||||||||||||||||||||||||||||||||||||||||||||
| Beginning fair value |
$ | 154,661 | $ | 119,366 | $ | 113,100 | $ | 77,575 | $ | 85,497 | $ | 85,077 | Beginning carrying value |
$ | 303,106 | $ | 395,237 | $ | 228,906 | $ | 205,301 | $ | 54,870 | $ | 254,936 | |||||||||||||||||||||||||||
| Acquisitions |
- | 26,135 | 14,800 | 36,888 | - | - | Acquisitions |
338,898 | 660,008 | 174,767 | 404,597 | 152,042 | 98,960 | |||||||||||||||||||||||||||||||||||||||
| Sales |
(2,983 | ) | (2,527 | ) | - | - | - | (5,230 | ) | Sales |
(381,808 | ) | - | (235 | ) | - | - | - | ||||||||||||||||||||||||||||||||||
| Effect of principal payments |
- | - | - | - | - | - | Transfers to Securitization Entities |
- | (745,262 | ) | - | (376,226 | ) | - | (295,103 | ) | ||||||||||||||||||||||||||||||||||||
| Change in fair value, net |
(4,241 | ) | 11,687 | (8,534 | ) | (1,363 | ) | (7,922 | ) | 5,650 | Principal repayments |
(4,524 | ) | (6,970 | ) | (8,189 | ) | (5,115 | ) | (1,616 | ) | (3,922 | ) | |||||||||||||||||||||||||||||
| Ending fair value |
$ | 147,437 | $ | 154,661 | $ | 119,366 | $ | 113,100 | $ | 77,575 | $ | 85,497 | Transfers to REO |
- | - | - | - | - | - | |||||||||||||||||||||||||||||||||
| Changes in fair value, net |
405 | 93 | (12 | ) | 349 | 5 | (1 | ) | ||||||||||||||||||||||||||||||||||||||||||||
| Residential Prime Subordinate |
|
Ending carrying value |
$ | 256,077 | $ | 303,106 | $ | 395,237 | $ | 228,906 | $ | 205,301 | $ | 54,870 | ||||||||||||||||||||||||||||||||||||||
| Beginning fair value |
$ | 106,189 | $ | 59,060 | $ | 70,606 | $ | 71,845 | $ | 59,239 | $ | 54,232 | ||||||||||||||||||||||||||||||||||||||||
| Acquisitions |
17,267 | 44,543 | - | 3,491 | 21,277 | 9,906 | Commercial Loans |
|
||||||||||||||||||||||||||||||||||||||||||||
| Sales |
- | - | - | - | - | - | Beginning carrying value |
$ | 178,415 | $ | 157,726 | $ | 98,060 | $ | 71,168 | $ | 42,483 | $ | 30,537 | |||||||||||||||||||||||||||||||||
| Effect of principal payments |
(3,211 | ) | (2,386 | ) | (2,301 | ) | (1,995 | ) | (1,743 | ) | (2,073 | ) | Originations |
68,620 | 26,888 | 60,297 | 26,908 | 28,660 | 11,925 | |||||||||||||||||||||||||||||||||
| Change in fair value, net |
3,227 | 4,972 | (9,245 | ) | (2,735 | ) | (6,928 | ) | (2,826 | ) | Principal repayments |
(87 | ) | (6,091 | ) | (59 | ) | (25 | ) | (2 | ) | (2 | ) | |||||||||||||||||||||||||||||
| Ending fair value |
$ | 123,472 | $ | 106,189 | $ | 59,060 | $ | 70,606 | $ | 71,845 | $ | 59,239 | Provision for loan losses |
(376 | ) | (274 | ) | (608 | ) | - | - | - | ||||||||||||||||||||||||||||||
| Discount/fee amortization |
211 | 166 | 36 | 9 | 27 | 23 | ||||||||||||||||||||||||||||||||||||||||||||||
| Residential Non-Prime Subordinate |
|
Ending carrying value |
$ | 246,783 | $ | 178,415 | $ | 157,726 | $ | 98,060 | $ | 71,168 | $ | 42,483 | ||||||||||||||||||||||||||||||||||||||
| Beginning fair value |
$ | 8,229 | $ | 11,283 | $ | 10,616 | $ | 11,036 | $ | 12,196 | $ | 13,376 | ||||||||||||||||||||||||||||||||||||||||
| Acquisitions |
- | - | 1,582 | - | - | - | ||||||||||||||||||||||||||||||||||||||||||||||
| Sales |
- | (3,149 | ) | - | - | - | (703 | ) | ||||||||||||||||||||||||||||||||||||||||||||
| Effect of principal payments |
(260 | ) | (229 | ) | (364 | ) | (287 | ) | (336 | ) | (354 | ) | ||||||||||||||||||||||||||||||||||||||||
| Change in fair value, net |
1 | 324 | (551 | ) | (133 | ) | (824 | ) | (123 | ) | ||||||||||||||||||||||||||||||||||||||||||
| Ending fair value |
$ | 7,970 | $ | 8,229 | $ | 11,283 | $ | 10,616 | $ | 11,036 | $ | 12,196 | ||||||||||||||||||||||||||||||||||||||||
| THE REDWOOD REVIEW 2ND QUARTER 2012
|
Table 7: Securities and Loans Portfolio Activity at Redwood | |||
|
|
Table 8A: Residential Prime Securities at Redwood and Underlying Loan Characteristics1 ($ in thousands) | |||
| 2012 Q2 |
2012 Q1 |
2011 Q4 |
2011 Q3 |
2011 Q2 |
2011 Q1 |
2010 Q4 |
2010 Q3 |
|||||||||||||||||||||||||
| Senior AFS |
$ | 490,802 | $ | 436,783 | $ | 278,240 | $ | 276,925 | $ | 285,946 | $ | 306,192 | $ | 315,891 | $ | 315,934 | ||||||||||||||||
| Subordinate AFS |
123,005 | 105,788 | 58,717 | 70,278 | 71,543 | 58,870 | 53,846 | 33,024 | ||||||||||||||||||||||||
| Fair value |
16,768 | 22,266 | 343 | 328 | 302 | 369 | 386 | 360 | ||||||||||||||||||||||||
| Total Residential Prime Securities |
$ | 630,575 | $ | 564,837 | $ | 337,300 | $ | 347,531 | $ | 357,791 | $ | 365,431 | $ | 370,123 | $ | 349,318 | ||||||||||||||||
| Number of loans |
63,986 | 81,085 | 85,702 | 92,071 | 101,149 | 109,221 | 121,173 | 124,536 | ||||||||||||||||||||||||
| Total loan face |
$ | 27,988,787 | $ | 30,222,071 | $ | 31,848,071 | $ | 34,816,750 | $ | 39,160,316 | $ | 43,242,656 | $ | 49,071,513 | $ | 52,490,472 | ||||||||||||||||
| Average loan size |
$ | 437 | $ | 373 | $ | 372 | $ | 378 | $ | 387 | $ | 396 | $ | 405 | $ | 421 | ||||||||||||||||
| Year 2012 origination |
1% | 0% | 0% | 0% | 0% | 0% | 0% | 0% | ||||||||||||||||||||||||
| Year 2011 origination |
2% | 2% | 0% | 0% | 0% | 0% | 0% | 0% | ||||||||||||||||||||||||
| Year 2010 origination |
0% | 0% | 0% | 0% | 0% | 0% | 0% | 0% | ||||||||||||||||||||||||
| Year 2009 origination |
0% | 0% | 0% | 0% | 0% | 0% | 0% | 0% | ||||||||||||||||||||||||
| Year 2008 origination |
0% | 0% | 0% | 0% | 0% | 0% | 0% | 0% | ||||||||||||||||||||||||
| Year 2007 origination |
12% | 11% | 10% | 10% | 9% | 10% | 9% | 11% | ||||||||||||||||||||||||
| Year 2006 origination |
3% | 3% | 1% | 1% | 1% | 11% | 11% | 11% | ||||||||||||||||||||||||
| Year 2005 origination |
17% | 17% | 19% | 19% | 18% | 17% | 17% | 16% | ||||||||||||||||||||||||
| Year 2004 origination and earlier |
65% | 67% | 70% | 70% | 72% | 62% | 63% | 62% | ||||||||||||||||||||||||
| Geographic concentration |
||||||||||||||||||||||||||||||||
| Southern CA |
23% | 23% | 23% | 23% | 24% | 24% | 24% | 25% | ||||||||||||||||||||||||
| Northern CA |
21% | 21% | 21% | 21% | 21% | 22% | 22% | 22% | ||||||||||||||||||||||||
| New York |
7% | 7% | 6% | 6% | 6% | 6% | 7% | 7% | ||||||||||||||||||||||||
| Florida |
6% | 6% | 6% | 6% | 6% | 6% | 6% | 6% | ||||||||||||||||||||||||
| Virginia |
3% | 3% | 4% | 4% | 4% | 4% | 4% | 4% | ||||||||||||||||||||||||
| New Jersey |
3% | 3% | 3% | 3% | 3% | 3% | 3% | 3% | ||||||||||||||||||||||||
| Illinois |
3% | 3% | 3% | 3% | 3% | 3% | 3% | 3% | ||||||||||||||||||||||||
| Other states |
34% | 34% | 34% | 34% | 33% | 32% | 31% | 30% | ||||||||||||||||||||||||
| Wtd Avg Original LTV |
69% | 68% | 68% | 68% | 68% | 68% | 68% | 68% | ||||||||||||||||||||||||
| Original LTV: 0 - 50 |
11% | 12% | 12% | 12% | 13% | 12% | 13% | 13% | ||||||||||||||||||||||||
| Original LTV: 50.01 - 60 |
11% | 11% | 11% | 11% | 12% | 11% | 12% | 11% | ||||||||||||||||||||||||
| Original LTV: 60.01 - 70 |
23% | 23% | 23% | 23% | 23% | 22% | 22% | 22% | ||||||||||||||||||||||||
| Original LTV: 70.01 - 80 |
51% | 50% | 49% | 49% | 48% | 50% | 49% | 49% | ||||||||||||||||||||||||
| Original LTV: 80.01 - 90 |
3% | 3% | 3% | 3% | 3% | 3% | 3% | 3% | ||||||||||||||||||||||||
| Original LTV: 90.01 - 100 |
1% | 1% | 2% | 2% | 1% | 2% | 1% | 2% | ||||||||||||||||||||||||
| Unknown |
0% | 0% | 0% | 0% | 0% | 0% | 0% | 0% | ||||||||||||||||||||||||
| Wtd Avg Original FICO |
735 | 735 | 735 | 735 | 735 | 736 | 737 | 738 | ||||||||||||||||||||||||
| Original FICO: < = 680 |
11% | 11% | 11% | 11% | 11% | 10% | 10% | 8% | ||||||||||||||||||||||||
| Original FICO: 681 - 700 |
11% | 10% | 10% | 10% | 10% | 10% | 10% | 10% | ||||||||||||||||||||||||
| Original FICO: 701 - 720 |
14% | 14% | 14% | 14% | 14% | 14% | 14% | 14% | ||||||||||||||||||||||||
| Original FICO: 721 - 740 |
15% | 15% | 15% | 15% | 15% | 14% | 14% | 15% | ||||||||||||||||||||||||
| Original FICO: 741 - 760 |
16% | 16% | 16% | 16% | 16% | 16% | 16% | 16% | ||||||||||||||||||||||||
| Original FICO: 761 - 780 |
17% | 17% | 17% | 17% | 17% | 18% | 18% | 19% | ||||||||||||||||||||||||
| Original FICO: 781 - 800 |
12% | 12% | 12% | 12% | 12% | 13% | 13% | 13% | ||||||||||||||||||||||||
| Original FICO: > = 801 |
3% | 3% | 3% | 3% | 3% | 3% | 3% | 3% | ||||||||||||||||||||||||
| Original Unknown |
1% | 2% | 2% | 2% | 2% | 2% | 2% | 2% | ||||||||||||||||||||||||
| Conforming balance % (2) |
52% | 54% | 55% | 54% | 60% | 59% | 59% | 58% | ||||||||||||||||||||||||
| > $1 MM % |
9% | 9% | 8% | 8% | 8% | 8% | 9% | 9% | ||||||||||||||||||||||||
| 2nd Home % |
7% | 7% | 7% | 7% | 7% | 7% | 7% | 7% | ||||||||||||||||||||||||
| Investment Home % |
2% | 2% | 2% | 2% | 2% | 2% | 2% | 2% | ||||||||||||||||||||||||
| Purchase |
41% | 40% | 40% | 39% | 39% | 42% | 42% | 43% | ||||||||||||||||||||||||
| Cash Out Refi |
23% | 23% | 23% | 23% | 23% | 23% | 23% | 22% | ||||||||||||||||||||||||
| Rate-Term Refi |
36% | 36% | 36% | 37% | 37% | 34% | 34% | 34% | ||||||||||||||||||||||||
| Other |
0% | 1% | 1% | 1% | 1% | 1% | 1% | 1% | ||||||||||||||||||||||||
| Full Doc |
55% | 53% | 51% | 51% | 51% | 50% | 50% | 50% | ||||||||||||||||||||||||
| No Doc |
4% | 6% | 6% | 6% | 6% | 5% | 6% | 5% | ||||||||||||||||||||||||
| Other Doc (Lim, Red, Stated, etc) |
38% | 38% | 40% | 40% | 40% | 42% | 41% | 42% | ||||||||||||||||||||||||
| Unknown/Not Categorized |
3% | 3% | 3% | 3% | 3% | 3% | 3% | 3% | ||||||||||||||||||||||||
| 2-4 Family |
2% | 2% | 1% | 1% | 1% | 1% | 2% | 1% | ||||||||||||||||||||||||
| Condo |
9% | 9% | 9% | 9% | 9% | 10% | 10% | 10% | ||||||||||||||||||||||||
| Single Family |
88% | 88% | 89% | 89% | 89% | 88% | 87% | 88% | ||||||||||||||||||||||||
| Other
|
1% | 1% | 1% | 1% | 1% | 1% | 1% | 1% | ||||||||||||||||||||||||
(1) Only the loan groups providing direct cash flow to securities we own are included.
(2) The definition of a conforming loan has significantly changed over time. For Q3 2011 and subsequent periods, the conforming balance definition that went into effect on October 1, 2011 was used (which had a maximum loan balance of $625,500). For all periods prior to Q3 2011, the conforming balance definition available in June 2011 was used (which had a maximum loan balance of $729,750).
| THE REDWOOD REVIEW 2ND QUARTER 2012
|
Table 8A:Residential Prime Securities at Redwood and Underlying Loan Characteristics |
49
| ||
|
|
Table 8B: Residential Non-Prime Securities at Redwood and Underlying Loan Characteristics1 ($ in thousands) | 50
| ||
| 2012 Q2 |
2012 Q1 |
2011 Q4 |
2011 Q3 |
2011 Q2 |
2011 Q1 |
2010 Q4 |
2010 Q3 |
|||||||||||||||||||||||||
| Senior AFS |
$ | 242,007 | $ | 255,279 | $ | 255,724 | $ | 278,161 | $ | 288,718 | $ | 297,758 | $ | 326,365 | $ | 332,829 | ||||||||||||||||
| Subordinate AFS |
7,867 | 8,142 | 11,153 | 10,461 | 10,877 | 12,028 | 13,188 | 9,812 | ||||||||||||||||||||||||
| Fair value |
23,066 | 19,762 | 20,738 | 20,911 | 18,845 | 19,036 | 19,930 | 21,506 | ||||||||||||||||||||||||
| Total Residential Non-prime Securities |
$ | 272,940 | $ | 283,183 | $ | 287,615 | $ | 309,533 | $ | 318,440 | $ | 328,822 | $ | 359,483 | $ | 364,147 | ||||||||||||||||
| Number of loans |
34,815 | 35,452 | 54,717 | 54,538 | 55,830 | 57,542 | 65,949 | 67,713 | ||||||||||||||||||||||||
| Total loan face |
$ | 7,019,443 | $ | 7,241,685 | $ | 11,730,410 | $ | 11,878,085 | $ | 12,250,760 | $ | 12,723,531 | $ | 14,615,940 | $ | 15,181,465 | ||||||||||||||||
| Average loan size |
$ | 202 | $ | 204 | $ | 214 | $ | 218 | $ | 219 | $ | 221 | $ | 222 | $ | 224 | ||||||||||||||||
| Year 2008 origination |
0% | 0% | 0% | 0% | 0% | 0% | 0% | 0% | ||||||||||||||||||||||||
| Year 2007 origination |
0% | 0% | 0% | 0% | 0% | 0% | 0% | 0% | ||||||||||||||||||||||||
| Year 2006 origination |
1% | 1% | 14% | 14% | 15% | 15% | 18% | 18% | ||||||||||||||||||||||||
| Year 2005 origination |
54% | 54% | 50% | 51% | 50% | 50% | 49% | 49% | ||||||||||||||||||||||||
| Year 2004 origination and earlier |
45% | 45% | 36% | 35% | 35% | 35% | 33% | 33% | ||||||||||||||||||||||||
| Geographic concentration |
||||||||||||||||||||||||||||||||
| Southern CA |
22% | 22% | 21% | 21% | 21% | 21% | 20% | 21% | ||||||||||||||||||||||||
| Northern CA |
16% | 16% | 15% | 15% | 15% | 14% | 14% | 14% | ||||||||||||||||||||||||
| Florida |
8% | 9% | 9% | 9% | 9% | 9% | 9% | 9% | ||||||||||||||||||||||||
| New York |
6% | 5% | 5% | 5% | 5% | 5% | 5% | 5% | ||||||||||||||||||||||||
| Virginia |
2% | 2% | 3% | 3% | 3% | 3% | 4% | 4% | ||||||||||||||||||||||||
| New Jersey |
3% | 3% | 3% | 3% | 3% | 3% | 3% | 3% | ||||||||||||||||||||||||
| Illinois |
3% | 3% | 3% | 3% | 3% | 3% | 3% | 3% | ||||||||||||||||||||||||
| Other states |
40% | 40% | 41% | 41% | 41% | 42% | 42% | 41% | ||||||||||||||||||||||||
| Wtd Avg Original LTV |
72% | 72% | 73% | 73% | 73% | 73% | 73% | 73% | ||||||||||||||||||||||||
| Original LTV: 0 - 50 |
7% | 7% | 6% | 7% | 7% | 6% | 7% | 7% | ||||||||||||||||||||||||
| Original LTV: 50.01 - 60 |
9% | 9% | 8% | 8% | 8% | 8% | 8% | 8% | ||||||||||||||||||||||||
| Original LTV: 60.01 - 70 |
19% | 19% | 18% | 18% | 18% | 18% | 18% | 18% | ||||||||||||||||||||||||
| Original LTV: 70.01 - 80 |
57% | 57% | 58% | 58% | 58% | 58% | 58% | 58% | ||||||||||||||||||||||||
| Original LTV: 80.01 - 90 |
6% | 6% | 7% | 6% | 6% | 7% | 6% | 6% | ||||||||||||||||||||||||
| Original LTV: 90.01 - 100 |
2% | 2% | 3% | 3% | 3% | 3% | 3% | 3% | ||||||||||||||||||||||||
| Unknown |
0% | 0% | 0% | 0% | 0% | 0% | 0% | 0% | ||||||||||||||||||||||||
| Wtd Avg Original FICO |
713 | 714 | 710 | 710 | 710 | 711 | 711 | 711 | ||||||||||||||||||||||||
| Original FICO: < = 680 |
25% | 25% | 27% | 27% | 27% | 27% | 28% | 27% | ||||||||||||||||||||||||
| Original FICO: 681 - 700 |
14% | 14% | 14% | 14% | 14% | 14% | 14% | 14% | ||||||||||||||||||||||||
| Original FICO: 701 - 720 |
15% | 15% | 14% | 14% | 14% | 14% | 14% | 14% | ||||||||||||||||||||||||
| Original FICO: 721 - 740 |
12% | 12% | 12% | 12% | 12% | 12% | 12% | 12% | ||||||||||||||||||||||||
| Original FICO: 741 - 760 |
12% | 12% | 12% | 12% | 12% | 12% | 11% | 12% | ||||||||||||||||||||||||
| Original FICO: 761 - 780 |
10% | 10% | 10% | 10% | 10% | 10% | 10% | 10% | ||||||||||||||||||||||||
| Original FICO: 781 - 800 |
7% | 7% | 7% | 7% | 7% | 7% | 7% | 7% | ||||||||||||||||||||||||
| Original FICO: > = 801 |
2% | 2% | 2% | 2% | 2% | 2% | 2% | 2% | ||||||||||||||||||||||||
| Original Unknown |
3% | 3% | 2% | 2% | 2% | 2% | 2% | 2% | ||||||||||||||||||||||||
| Conforming balance % (2) |
86% | 86% | 83% | 82% | 86% | 86% | 86% | 86% | ||||||||||||||||||||||||
| > $1 MM % |
2% | 3% | 3% | 3% | 3% | 3% | 3% | 3% | ||||||||||||||||||||||||
| 2nd Home % |
4% | 4% | 4% | 4% | 4% | 4% | 4% | 4% | ||||||||||||||||||||||||
| Investment Home % |
15% | 15% | 14% | 14% | 13% | 13% | 13% | 13% | ||||||||||||||||||||||||
| Purchase |
42% | 41% | 41% | 41% | 41% | 42% | 42% | 42% | ||||||||||||||||||||||||
| Cash Out Refi |
42% | 42% | 42% | 42% | 42% | 41% | 41% | 41% | ||||||||||||||||||||||||
| Rate-Term Refi |
15% | 16% | 16% | 16% | 16% | 16% | 16% | 16% | ||||||||||||||||||||||||
| Other |
1% | 1% | 1% | 1% | 1% | 1% | 1% | 1% | ||||||||||||||||||||||||
| Full Doc |
39% | 38% | 38% | 39% | 38% | 39% | 38% | 38% | ||||||||||||||||||||||||
| No Doc |
6% | 6% | 5% | 4% | 4% | 4% | 3% | 3% | ||||||||||||||||||||||||
| Other Doc (Lim, Red, Stated, etc) |
53% | 54% | 56% | 56% | 56% | 56% | 57% | 57% | ||||||||||||||||||||||||
| Unknown/Not Categorized |
2% | 2% | 1% | 1% | 2% | 1% | 2% | 2% | ||||||||||||||||||||||||
| 2-4 Family |
8% | 8% | 8% | 8% | 8% | 8% | 8% | 8% | ||||||||||||||||||||||||
| Condo |
8% | 8% | 8% | 8% | 8% | 8% | 8% | 8% | ||||||||||||||||||||||||
| Single Family |
84% | 84% | 84% | 84% | 84% | 84% | 84% | 84% | ||||||||||||||||||||||||
| Other
|
0% | 0% | 0% | 0% | 0% | 0% | 0% | 0% | ||||||||||||||||||||||||
(1) Only the loan groups providing direct cash flow to securities we own are included.
(2) The definition of a conforming loan has significantly changed over time. For Q3 2011 and subsequent periods, the conforming balance definition that went into effect on October 1, 2011 was used (which had a maximum loan balance of $625,500). For all periods prior to Q3 2011, the conforming balance definition available in June 2011 was used (which had a maximum loan balance of $729,750).
| THE REDWOOD REVIEW 2ND QUARTER 2012
|
Table 8B: Residential Non-Prime Securities at Redwood and Underlying Loan Characteristics | |||
|
|
Table 9: Residential Real Estate Loan Characteristics1 ($ in thousands) | |||
|
2012 Q2 |
2012 Q1 |
2011 Q4 |
2011 Q3 |
2011 Q2 |
2011 Q1 |
2010 Q4 |
2010 Q3 |
|||||||||||||||||||||||||
| Residential loans principal balance |
$ | 3,493,755 | $ | 3,682,379 | $ | 4,231,324 | $ | 4,190,773 | $ | 3,892,161 | $ | 3,819,692 | $ | 3,818,659 | $ | 3,754,053 | ||||||||||||||||
| Number of loans |
10,773 | 11,079 | 12,490 | 12,526 | 12,258 | 12,301 | 12,413 | 12,500 | ||||||||||||||||||||||||
| Average loan balance |
$ | 324 | $ | 332 | $ | 339 | $ | 335 | $ | 318 | $ | 311 | $ | 308 | $ | 300 | ||||||||||||||||
| Adjustable % |
75% | 73% | 72% | 74% | 81% | 84% | 86% | 90% | ||||||||||||||||||||||||
| Hybrid % |
8% | 9% | 9% | 10% | 10% | 11% | 10% | 10% | ||||||||||||||||||||||||
| Fixed % |
18% | 18% | 19% | 16% | 9% | 5% | 4% | 0% | ||||||||||||||||||||||||
| Amortizing % |
20% | 21% | 22% | 19% | 11% | 8% | 7% | 5% | ||||||||||||||||||||||||
| Interest-only % |
80% | 79% | 78% | 81% | 89% | 92% | 93% | 95% | ||||||||||||||||||||||||
| Northern California |
15% | 16% | 14% | 14% | 12% | 11% | 11% | 10% | ||||||||||||||||||||||||
| Florida |
12% | 11% | 11% | 12% | 12% | 13% | 13% | 13% | ||||||||||||||||||||||||
| Southern California |
11% | 12% | 12% | 12% | 12% | 11% | 11% | 11% | ||||||||||||||||||||||||
| New York |
7% | 7% | 7% | 8% | 8% | 8% | 7% | 8% | ||||||||||||||||||||||||
| Texas |
5% | 5% | 6% | 5% | 5% | 5% | 5% | 5% | ||||||||||||||||||||||||
| Georgia |
4% | 4% | 4% | 5% | 5% | 5% | 5% | 5% | ||||||||||||||||||||||||
| New Jersey |
4% | 4% | 4% | 4% | 4% | 4% | 4% | 4% | ||||||||||||||||||||||||
| Colorado |
3% | 3% | 3% | 3% | 3% | 4% | 4% | 4% | ||||||||||||||||||||||||
| Virginia |
3% | 3% | 3% | 2% | 3% | 3% | 3% | 3% | ||||||||||||||||||||||||
| Arizona |
2% | 2% | 2% | 2% | 2% | 2% | 2% | 2% | ||||||||||||||||||||||||
| Illinois |
2% | 2% | 3% | 2% | 2% | 2% | 2% | 2% | ||||||||||||||||||||||||
| Other states |
30% | 31% | 31% | 31% | 32% | 32% | 33% | 33% | ||||||||||||||||||||||||
| Year 2012 origination |
6% | 4% | 0% | 0% | 0% | 0% | 0% | 0% | ||||||||||||||||||||||||
| Year 2011 origination |
5% | 9% | 13% | 9% | 3% | 0% | 0% | 0% | ||||||||||||||||||||||||
| Year 2010 origination |
8% | 8% | 9% | 10% | 8% | 7% | 5% | 2% | ||||||||||||||||||||||||
| Year 2009 origination |
3% | 3% | 3% | 4% | 4% | 5% | 5% | 5% | ||||||||||||||||||||||||
| Year 2008 origination |
0% | 0% | 0% | 0% | 0% | 0% | 0% | 0% | ||||||||||||||||||||||||
| Year 2007 origination |
2% | 2% | 2% | 2% | 2% | 2% | 2% | 2% | ||||||||||||||||||||||||
| Year 2006 origination |
5% | 5% | 4% | 4% | 5% | 5% | 5% | 5% | ||||||||||||||||||||||||
| Year 2005 origination |
4% | 3% | 3% | 3% | 3% | 4% | 4% | 4% | ||||||||||||||||||||||||
| Year 2004 origination or earlier |
68% | 66% | 66% | 68% | 75% | 77% | 79% | 82% | ||||||||||||||||||||||||
| Wtd Avg Original LTV |
66% | 66% | 66% | 66% | 66% | 66% | 66% | 66% | ||||||||||||||||||||||||
| Original LTV: 0 - 50 |
19% | 19% | 19% | 20% | 19% | 19% | 19% | 19% | ||||||||||||||||||||||||
| Original LTV: 50 - 60 |
13% | 13% | 13% | 13% | 13% | 13% | 12% | 12% | ||||||||||||||||||||||||
| Original LTV: 60 - 70 |
22% | 22% | 22% | 21% | 21% | 21% | 21% | 21% | ||||||||||||||||||||||||
| Original LTV: 70 - 80 |
41% | 41% | 40% | 40% | 40% | 40% | 41% | 41% | ||||||||||||||||||||||||
| Original LTV: 80 - 90 |
2% | 2% | 2% | 2% | 2% | 2% | 2% | 2% | ||||||||||||||||||||||||
| Original LTV: 90 - 100 |
4% | 4% | 4% | 4% | 5% | 5% | 5% | 5% | ||||||||||||||||||||||||
| Wtd Avg FICO |
739 | 740 | 740 | 739 | 736 | 735 | 734 | 733 | ||||||||||||||||||||||||
| FICO: < = 600 |
0% | 0% | 0% | 1% | 1% | 1% | 1% | 1% | ||||||||||||||||||||||||
| FICO: 601 - 620 |
1% | 1% | 1% | 1% | 1% | 1% | 1% | 1% | ||||||||||||||||||||||||
| FICO: 621 - 640 |
1% | 1% | 1% | 2% | 2% | 2% | 2% | 2% | ||||||||||||||||||||||||
| FICO: 641 - 660 |
3% | 3% | 3% | 3% | 3% | 3% | 3% | 4% | ||||||||||||||||||||||||
| FICO: 661 - 680 |
6% | 6% | 6% | 6% | 7% | 7% | 7% | 7% | ||||||||||||||||||||||||
| FICO: 681 - 700 |
10% | 9% | 9% | 9% | 10% | 10% | 11% | 11% | ||||||||||||||||||||||||
| FICO: 701 - 720 |
12% | 12% | 12% | 12% | 12% | 13% | 13% | 13% | ||||||||||||||||||||||||
| FICO: 721 - 740 |
13% | 12% | 12% | 12% | 13% | 13% | 13% | 13% | ||||||||||||||||||||||||
| FICO: 741 - 760 |
14% | 14% | 14% | 14% | 14% | 14% | 14% | 14% | ||||||||||||||||||||||||
| FICO: 761 - 780 |
18% | 18% | 19% | 18% | 18% | 17% | 17% | 17% | ||||||||||||||||||||||||
| FICO: 781 - 800 |
17% | 17% | 18% | 17% | 15% | 15% | 14% | 13% | ||||||||||||||||||||||||
| FICO: > = 801 |
5% | 6% | 5% | 5% | 4% | 4% | 4% | 4% | ||||||||||||||||||||||||
| Conforming balance % (2) |
43% | 42% | 41% | 42% | 49% | 50% | 51% | 53% | ||||||||||||||||||||||||
| % balance in loans > $1mm per loan |
20% | 22% | 22% | 22% | 20% | 20% | 20% | 18% | ||||||||||||||||||||||||
| 2nd home % |
11% | 10% | 11% | 11% | 11% | 11% | 12% | 12% | ||||||||||||||||||||||||
| Investment home % |
3% | 3% | 3% | 3% | 3% | 3% | 4% | 4% | ||||||||||||||||||||||||
| Purchase |
33% | 33% | 33% | 33% | 32% | 31% | 31% | 31% | ||||||||||||||||||||||||
| Cash out refinance |
28% | 28% | 28% | 29% | 31% | 33% | 33% | 34% | ||||||||||||||||||||||||
| Rate-term refinance |
37% | 38% | 38% | 37% | 36% | 35% | 35% | 34% | ||||||||||||||||||||||||
| Other |
1% | 1% | 1% | 1% | 1% | 1% | 1% | 1% | ||||||||||||||||||||||||
(1) This table presents characteristics of residential loans held by consolidated Sequoia entities and residential loans held by Redwood and intended to be securitized by future Sequoia entities or sold to third parties.
(2) The definition of a conforming loan has significantly changed over time. For Q3 2011 and subsequent periods, the conforming balance definition that went into effect on October 1, 2011 was used (which had a maximum loan balance of $625,500). For all periods prior to Q3 2011, the conforming balance definition available in June 2011 was used (which had a maximum loan balance of $729,750).
| THE REDWOOD REVIEW 2ND QUARTER 2012
|
Table 9: Residential Real Estate Loan Characteristics |
51
| ||
|
|
Table 10: Commercial Loan Characteristics1 ($ in thousands) | 52
| ||
|
2012 Q2 |
2012 Q1 |
2011 Q4 |
2011 Q3 |
2011 Q2 |
2011 Q1 |
2010 Q4 |
2010 Q3 |
|||||||||||||||||||||||||
| Commercial loans principal balance |
$ | 251,686 | $ | 182,803 | $ | 158,847 | $ | 158,846 | $ | 98,600 | $ | 71,651 | $ | 42,953 | $ | 30,955 | ||||||||||||||||
| Number of loans |
26 | 19 | 15 | 16 | 12 | 9 | 6 | 4 | ||||||||||||||||||||||||
| Average loan balance |
$ | 9,680 | $ | 9,621 | $ | 9,928 | $ | 9,928 | $ | 8,217 | $ | 7,961 | $ | 7,159 | $ | 7,739 | ||||||||||||||||
| Fixed % |
94% | 92% | 91% | 91% | 100% | 100% | 100% | 100% | ||||||||||||||||||||||||
| Hybrid % |
6% | 8% | 9% | 9% | 0% | 0% | 0% | 0% | ||||||||||||||||||||||||
| Amortizing % |
16% | 16% | 19% | 19% | 14% | 1% | 1% | 1% | ||||||||||||||||||||||||
| Interest-only % |
84% | 84% | 81% | 81% | 86% | 99% | 99% | 99% | ||||||||||||||||||||||||
| New York |
25% | 17% | 16% | 16% | 19% | 26% | 43% | 60% | ||||||||||||||||||||||||
| California |
18% | 20% | 21% | 21% | 18% | 10% | 1% | 1% | ||||||||||||||||||||||||
| Illinois |
13% | 18% | 21% | 21% | 12% | 17% | 28% | 39% | ||||||||||||||||||||||||
| Florida |
12% | 13% | 4% | 4% | 6% | 8% | 14% | 0% | ||||||||||||||||||||||||
| Michigan |
7% | 7% | 8% | 8% | 13% | 0% | 0% | 0% | ||||||||||||||||||||||||
| Texas |
6% | 5% | 2% | 2% | 4% | 0% | 0% | 0% | ||||||||||||||||||||||||
| North Carolina |
4% | 0% | 0% | 0% | 0% | 0% | 0% | 0% | ||||||||||||||||||||||||
| Delaware |
4% | 0% | 0% | 0% | 0% | 0% | 0% | 0% | ||||||||||||||||||||||||
| Kentucky |
2% | 2% | 3% | 3% | 4% | 6% | 0% | 0% | ||||||||||||||||||||||||
| Massachusetts |
1% | 0% | 4% | 4% | 6% | 8% | 14% | 0% | ||||||||||||||||||||||||
| Other |
8% | 18% | 21% | 21% | 18% | 25% | 0% | 0% | ||||||||||||||||||||||||
| Year 2012 origination |
38% | 15% | 0% | 0% | 0% | 0% | 0% | 0% | ||||||||||||||||||||||||
| Year 2011 origination |
50% | 68% | 81% | 81% | 69% | 57% | 28% | 0% | ||||||||||||||||||||||||
| Year 2010 origination |
12% | 17% | 19% | 19% | 31% | 43% | 71% | 99% | ||||||||||||||||||||||||
| Year 2004 origination |
< 1% | < 1% | < 1% | < 1% | < 1% | < 1% | 1% | 1% | ||||||||||||||||||||||||
| Office |
32% | 32% | 37% | 37% | 38% | 51% | 86% | 100% | ||||||||||||||||||||||||
| Multi-family |
22% | 23% | 14% | 14% | 14% | 14% | 14% | 0% | ||||||||||||||||||||||||
| Hospitality |
21% | 18% | 20% | 20% | 18% | 25% | 0% | 0% | ||||||||||||||||||||||||
| Retail |
18% | 25% | 29% | 29% | 30% | 10% | 0% | 0% | ||||||||||||||||||||||||
| Self-storage |
7% | 2% | 0% | 0% | 0% | 0% | 0% | 0% | ||||||||||||||||||||||||
(1) This table presents characteristics of commercial loans held-for-investment by Redwood.
| THE REDWOOD REVIEW 2ND QUARTER 2012
|
Table 10: Commercial Loan Characteristics | |||
REDWOOD TRUST CORPORATE INFORMATION
For more information about Redwood Trust, please visit our website at: www.redwoodtrust.com