Attached files
| file | filename |
|---|---|
| 8-K - FORM 8-K - NEWTEK BUSINESS SERVICES, INC. | d390587d8k.htm |
 Newtek Business Services, Inc.
NASDAQ: NEWT
Second Quarter 2012
Financial Results Conference Call
July 31, 2012 4:15 PM
Hosted By:
Barry Sloane, CEO and Chairman
Jennifer C. Eddelson, CAO
Investor Relations
Public Relations
Newtek Investor Relations
Rubenstein Public Relations, Inc.
Jayne Cavuto
(212) 356-9571
jcavuto@thesba.com
Jonathan Goldberg
(212) 843-9335
jgoldberg@rubensteinpr.com
Jennifer Seley
(212) 843-8295
jseley@rubensteinpr.com
Exhibit 99.1 |
 Safe Harbor Statement
The statements in this slide presentation including statements regarding
anticipated future financial performance, Newtek's beliefs, expectations,
intentions or strategies for the future, may be "forward-looking
statements" under the Private Securities Litigation Reform Act of 1995. All
forward-looking statements involve a number of risks and uncertainties that
could cause actual results to differ materially from the plans, intentions
and expectations reflected in or suggested by the forward-looking
statements. Such risks and uncertainties include, among others, intensified
competition,
operating
problems
and
their
impact
on
revenues
and
profit
margins,
anticipated
future business strategies and financial performance, anticipated future number of
customers, business prospects, legislative developments and similar matters.
Risk factors, cautionary statements and other conditions which could cause
Newtek’s actual results to differ from management's current
expectations are contained in Newtek’s filings with the Securities and
Exchange
Commission
and
available
through
http://www.sec.gov
Our Capcos operate under a different set of rules in each of the
six jurisdictions and these place
varying requirements on the structure of our investments. In some cases,
particularly in Louisiana or in certain situations in New York, we do not
control the equity or management of a qualified business, but that cannot
always be presented orally or in written presentations. 2
|
 Second Quarter 2012 Conference Call Agenda
Q2 2012 Financial Performance, Cash Position, Balance Sheet
NEWT Buy Back of Common Stock
Commentary, Developments and Business Trends
Focus on Revenue Growth
New Financing Arrangement with Summit Partners
Reaffirm 2012 Guidance
3 |
 Second Quarter Key Performance Statistics
The Company had consolidated pretax income of $1.9 million; an increase of
$1.8 million, a 1320% improvement, compared to the second quarter of 2011
The Company had consolidated net income of $1.2 million; a $1.5 million
increase, or a 530% improvement compared to the second quarter 2011, and
EPS of $0.03/diluted share compared to a loss of $(0.01)/diluted
share for the
second quarter 2011
The Company had consolidated Modified EBITDA for the second quarter 2012
of $3.7 million, as compared to $1.7 million for the second quarter 2011
The Company had EPS of $0.07 per diluted share for the six months ended
June 30, 2012, as compared to $0.01 per diluted share for the six months
ended June 30, 2011
Electronic payment processing segment pretax income increased 42% to $1.9
million in the second quarter of 2012 as compared to $1.3 million in the second
quarter of 2011
Small business finance segment pretax income increased 43% to $1.5 million in
the second quarter 2012, compared to $1.0 million in the second quarter
2011 4 |
 Second Quarter Key Performance Statistics
Servicing fee income generated through our SBA lender grew 170% period over
period from $729 thousand during the second quarter of 2011, to $2.0 million in
the second quarter of 2012
Our SBA lender closed $52.0 million in loans during the first six months of 2012
as compared to $49.3 million during the same period in 2011
The Company bought back 780,920 shares of its common stock in the open
market under its one million share authorization during the quarter
The Company closed a $10-
$15 million, five year credit agreement with
Summit Partners, of which $10 million was drawn during the quarter. The funds
will be used to support Newtek's continued growth and provide working
capital necessary to expand its product offering
The Company is reaffirming its Full Year 2012 Guidance for EPS of between
$0.10 and $0.14 per diluted share, pretax income between $6.5 million and $8.5
million, and Modified EBITDA between $14.3 million and $16.3 million
5 |
 Second Quarter 2012 Financial Results
Q2 2012 vs. Q2 2011 core operating segment revenue:
–
Electronic Payment Processing: $21.4 million –
up 3% from Q2 2011
(revenue up 11.1% excluding impact of Durbin Amendment)
–
Managed Technology Solutions:
$4.6 million –
down 4% from Q2 2011
–
Small Business Finance:
$6.0 million –
up 30% after adjusting for fair
value accounting adjustment related to timing of recognition of premium
income included in prior quarter
Q2 2012 vs. Q2 2011 core operating segment pretax income:
–
Electronic Payment Processing: $1.9 million –
up 42% from Q2 2011
–
Managed Technology Solutions:
$1.1 million –
up 12% from Q2 2011
–
Small Business Finance:
$1.5 million -
up 43% from Q2 2011
6 |
 Cash Position
•
The Company had $32.0 million in cash and cash equivalents and
restricted cash at June 30, 2012, up from $25.4 million at December
31, 2011
–
Equates to $0.66 cash per share,
–
Equates to $0.91 cash per share when including restricted cash
7 |
 8
Selected Balance Sheet Items
In thousands of dollars
Major changes in Assets and Liabilities
Increase of $11.7 million in Cash and cash equivalents
Increase of $8.1 million in SBA loans held for investment
Increase of $13.1 million in Notes payable
Decrease
of
$5.4
million
in
Credits
and
Notes
payable
in
credits
in
lieu
of
cash
Balance at
June 30, 2012
Balance at
December 31, 2011
Total Assets
$ 142,994
$ 132,010
Total Liabilities
78,986
72,711
Total Equity
64,008
59,299 |
 Reduced Effect of Capco on
Consolidated Results
Balance sheet illusionary leverage
•
$11.6 million –
Credits in lieu of cash
•
$11.6 million –
Notes payable in credits in lieu of cash
Management time
Accounting cost
Other miscellaneous costs
9 |
 Future Year End Balance of Tax Credits
10
$ in millions
$0
$5
$10
$15
$20
$25
$30
$35
$40
2010
2011
2012
2013
2014
2015
2016 |
 Newtek Buy Back of Common Shares
During the second quarter of 2012, the Company repurchased
780,920 shares of common stock under its one million share
authorization
Average buy back price $1.1862
Represents great value to our shareholders
On Friday, July 27, 2012, our stock price closed at $1.50/share,
up 32% since most recent stock repurchase
11 |
 Market Comparable Trends
Market comparables positioning themselves similarly to Newtek
Universal Business Payment Solutions (“UBPS”) announced $179 million
planned acquisition of:
•
a credit and debit card sales organization;
•
a credit and debit card processing company; and
•
a payroll processing and a tax filing company
GoDaddy announced strategic purchase of a cloud-based financial
management application company to reach more small businesses
Newtek has the advantage of:
•
Experience
in
providing
a
“suite
of
services”
to
small
businesses
over
the
past
8
years
•
All of our business divisions operating on a similar, coordinated platform
•
All business service solutions will be available to business owners in the cloud
and available on their iphones and ipads
12
Medallion Financial Corp (TAXI)
Heartland Payment Systems (HPY)
Web.com Group, Inc. (WWWW)
Cbeyond, Inc. (CBEY)
8 x 8, Inc. (EGHT)
ReachLocal, Inc. (RLOC)
Stamps.com, Inc. (STMP)
Marchex, Inc. (MCHX)
Vistaprint, NV (VPRT) |
 Developments in EPP
Q2 2012 EPP revenue up $657 thousand, or 3% compared with year
ago period; excluding impact of Durbin Amendment, revenue
increased by 11.1%
Q2 2012 EPP pretax income of $1.9 million, a 42% increase
compared with Q2 2011
–
Cash flow positive business
–
Significant operating leverage
–
EPP segment does not have any debt
–
eCommerce : Single most important corporate initiative and identifier
13 |
 Managed Technology Solutions Initiatives
Q2 2012 Web hosting and design revenue down 4% compared to year ago
quarter
Q2 2012 MTS pretax income increased by 12% over prior year
–
Decrease in total number of web hosting plans; however,
–
Increase in average revenue per plan resulting from increase in number of cloud
instances and higher-cost plans sold
–
Decrease in professional fees for web design development and other general and
administrative costs
Changeover in management in:
–
Presidency of MTS
–
Customer Service
–
Sales Department
All products cloud-solutions oriented
Improve
our
position
in
products
in
addition
to
Microsoft
®
products
14 |
 Developments in Small Business Finance
Q2 2012 SBF revenue, after adjusting for fair value accounting adjustment
related to timing of recognition of premium income included in prior quarter,
increased 30% over year ago period
Q2 2012 SBF pretax income $1.5 million, a 43% increase compared with
prior year
This sector offers the best opportunity for Newtek stockholders
–
We have a very strong lending infrastructure (origination, underwriting, funding,
servicing, and collection); this infrastructure is valuable more so
today –
111 to 116 pricing on governments
–
FDIC contract
–
We are an S&P-rated commercial servicer
Closed $10-15 million in mezzanine loan in April 2012
This will increase our capability to increase our lending in $100 million
increments; every $100 million in additional originations results in
approximately $4 million in annual pretax dollars
15 |
 16
Small Business Finance
From June 30, 2011 to June 30, 2012, our total servicing portfolio
increased by 74%
We added an additional $128 million in external servicing in the
second
quarter 2012
We anticipate our total servicing portfolio increasing to $650 million by
December 31, 2012
Q2 2012
Q2 2011
Increase
Servicing for our loans
$ 309,500
$ 249,600
$ 59,900
Servicing for others
257,000
75,900
181,100
Total servicing portfolio
$ 566,500
$ 325,500
$ 241,000
Servicing Portfolio:
In thousands of dollars |
 Newtek Payroll Services
Payroll management, payment and reporting service
Competitively priced and ideal for small and medium sized
businesses
Currently servicing customers in 34 states
Complements existing Newtek Products
–
Insurance
–
WC Pay-go
–
“Payroll in the Cloud”
17 |
 Growth Strategy
Market Newtek ®
“The Small Business Authority”
brand through
www.thesba.com
Emphasize cross-selling and cross-marketing into the customer base
Continue to grow alliance channels as outsourcing of our services is
attractive to banks, credit unions and other affinity groups
Outbound campaign with direct focus on small businesses through television
and radio
Grow our presence as a business service provider with all of our
business
applications hosted in the cloud
18 |
 Our Strategy & Mission
We are a thought leader and destination for independent owner
operators
of
small
businesses.
Newtek
®
The
Small
Business
Authority
provides products, services, and data to small and
medium size businesses across the United States to grow their
sales, reduce their expenses, reduce their risk and offer state of
the art efficient business strategies, structures, and content to
run their businesses. |
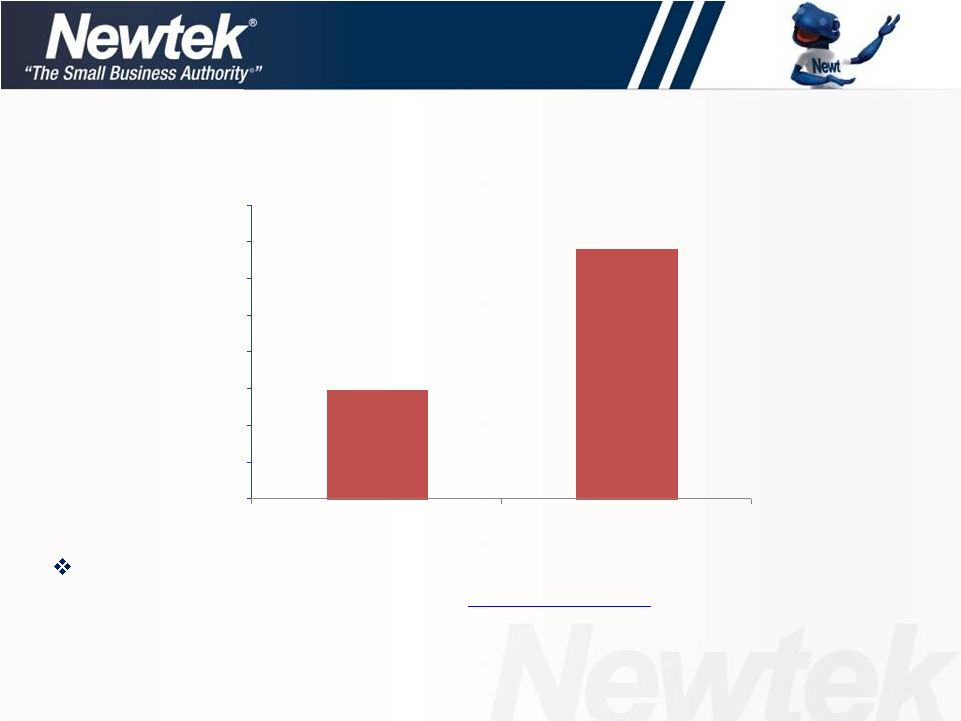
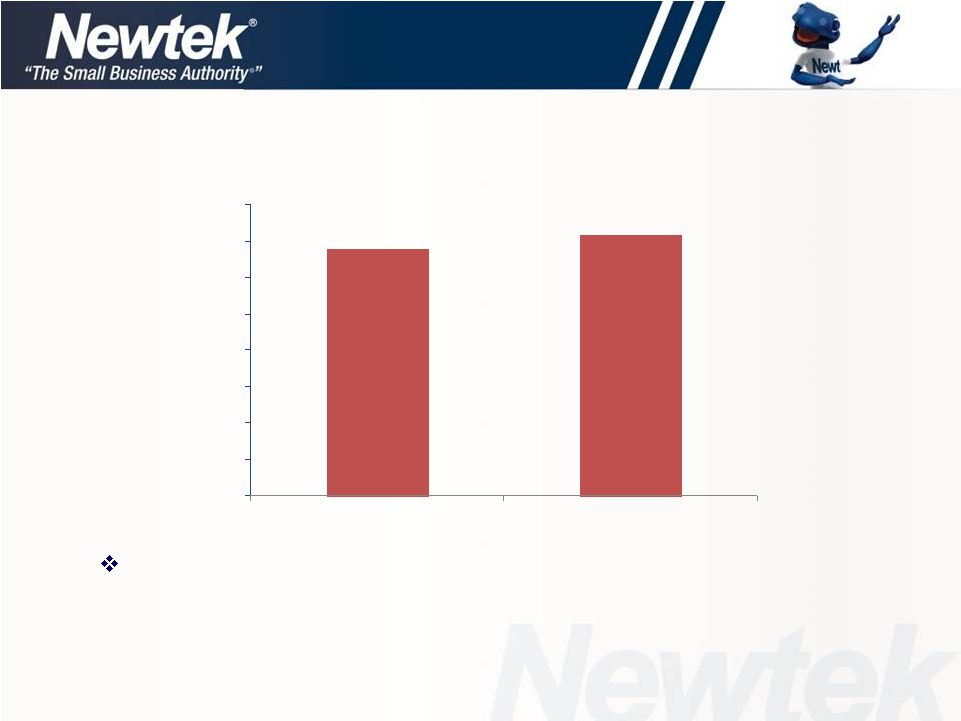 Total Referrals
Total referrals received increased 6% as compared with the year ago
quarter as a result of our new initiatives
6,777
7,181
0
1,000
2,000
3,000
4,000
5,000
6,000
7,000
8,000
Q2'11
Q2'12 |
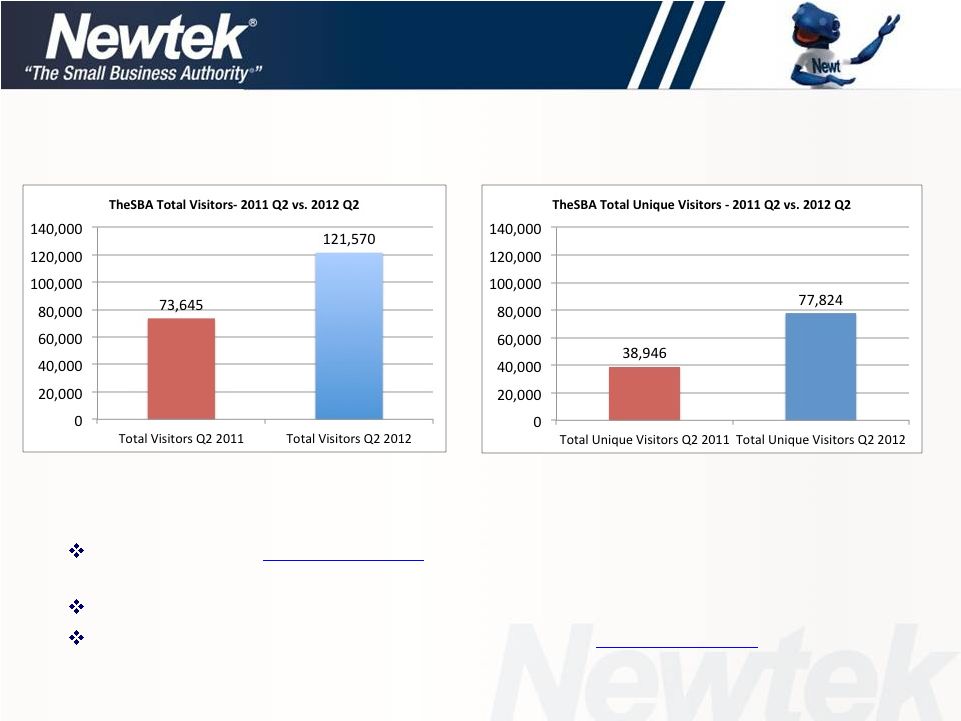 Visitor Trend to www.thesba.com
As a result of our direct marketing initiatives:
Total Visitors to www.thesba.com
increased by 65% in the current quarter
compared to the year ago quarter
Total Unique Visitors increased by nearly 100% in the current quarter
64%
of
Visitors
in
the
current
quarter
are
Unique
to
www.thesba.com |
 Current General Statistics
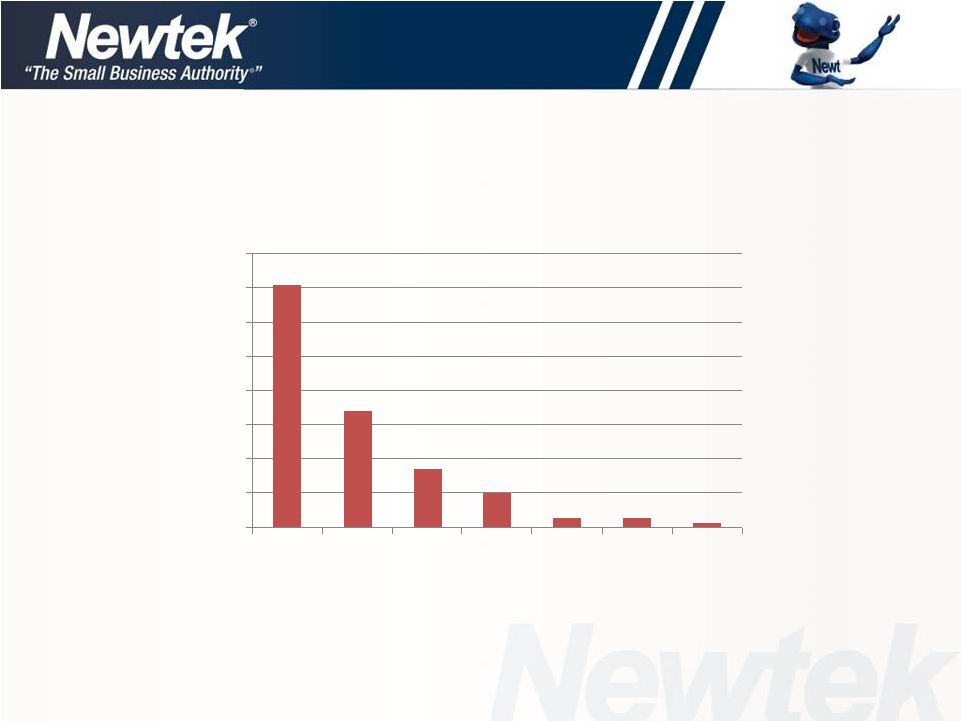
Our Alexa traffic ranking in the U.S. is 42,434 with 568 sites linking in
69% Bounce Rate; average time on site is 1 minute and 51
seconds An average of approximately 1,000 unique visitors per
day 22 |
 Small Business Authority
Branding Achievements
The
Small
Business
Authority
Index
is
published
by
Bloomberg
Newswire monthly
The
Small
Business
Authority
Market
Sentiment
Survey
is
published
on
CNBC, NYDailyNews, Small Business Trends, etc.
Forbes
publishes
The
Small
Business
Authority
Blog
daily
which
can
be
viewed at http://blogs.forbes.com/thesba/
23 |
 Forbes Blog -
The Small Business Authority
Our introductory post which explains what our blog will do can be
viewed
at
http://blogs.forbes.com/thesba/2011/06/15/your-
authority-on-small-business/
Forbes Contributor
Since June 2011
Over 70 published articles regarding issues that affect
entrepreneurs and their companies: health care, small business
lending, small business regulations, taxes, IT costs, insurance)
Some of our posts have received in excess of 20,000 views
24 |
 Current Marketing Strategy
Generate awareness to qualified small business owners through a
National prime-time television advertising campaign with a 50%
increased budget
Media parameters will include National TV exposure through
commercials, online display and search
Key product offerings will include: small business
loans, eCommerce and cloud
services 25 |
 SB Authority Index
Financial barometer for small business economy
Made up of eight primary business and economic components
of the small business economy
SB Authority Index released at beginning of every month
Available in our newsletter with approximately 60,000 in
distribution
Available
on
our
website
now
at
www.thesba.com
26 |
 SB Authority Market Sentiment Survey
On a monthly basis, delivers the pulse of the small business
economy by polling our client base on topical issues like health
care, the lending environment and other important issues
affecting small businesses
Usually poll in excess of 1,200 respondents
Released once per month
Results are available in our newsletter with approximately
60,000 in distribution
Available to all to participate in and view results on our website
at www.thesba.com
27 |
 Marketing Focus |
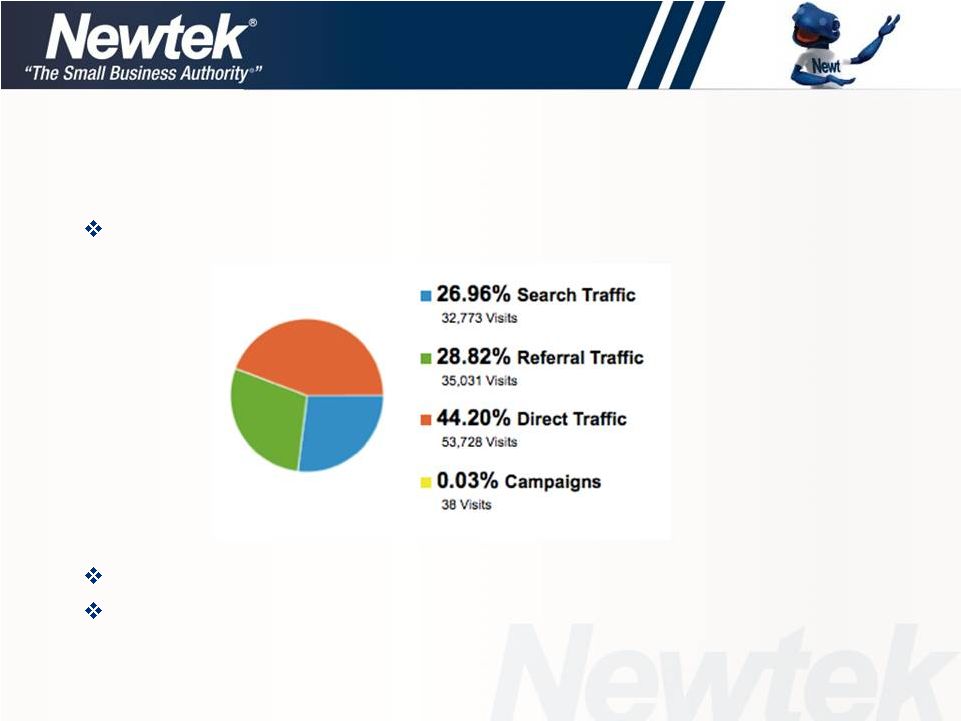
 29
Percent of Referrals from Direct Channel
As a result of our revised marketing message focused on Small Business
Lending, Direct Channel referrals to
www.thesba.com increased from 5.9% to
13.6% over the year ago quarter
5.9%
13.6%
0.0%
2.0%
4.0%
6.0%
8.0%
10.0%
12.0%
14.0%
16.0%
Q2'11
Q2'12 |
 Small Business Authority Channel
Grow internet web based direct business
-
through search
-
through branding on TV, radio, print and public relations
Grow as the destination spot for independent owner/operator
businesses
Increase
recognition
as
being
“The
Authority”
in
business
issues
for small businesses, and in each of the following areas:
-
Lending
-
Electronic payment processing
-
Insurance brokerage
-
Outsourced technology managed services
-
Business information
-
Payroll
-
Data storage
-
Health insurance
30 |
 In Conclusion
31 |
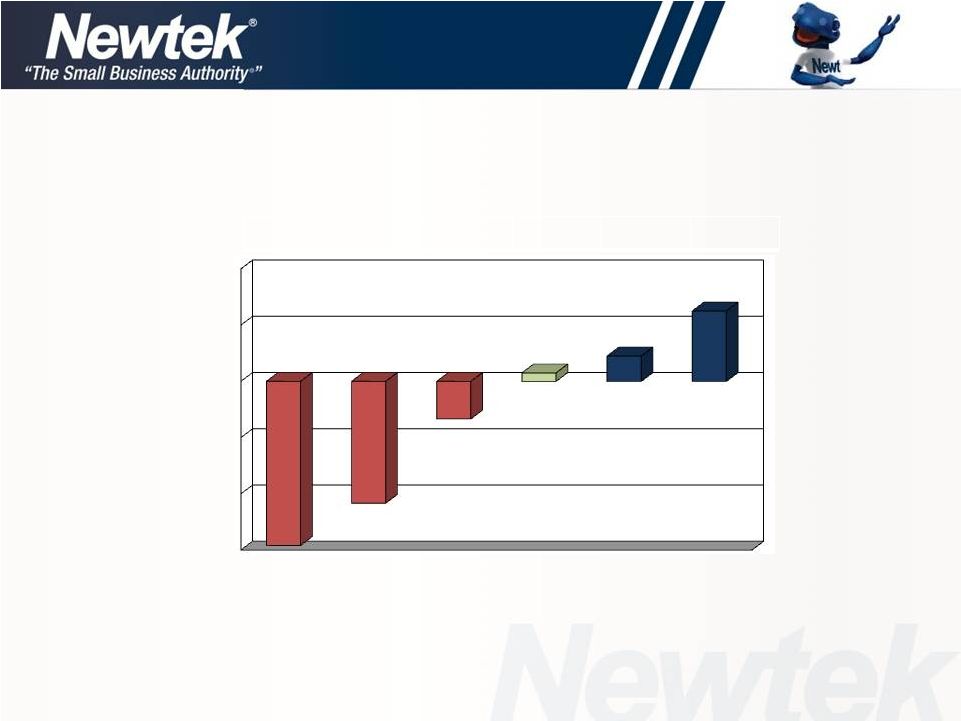 Annual Pretax Income Trend
32
Pretax income (loss), in millions
$(17.5)
$(13.1)
$(4.0)
$0.9
$2.3
$7.5
-$18
-$12
-$6
$0
$6
$12
2007
Actual
2008
Actual
2009
Actual
2010
Actual
2011
Actual
2012
Forecast
Midpoint |
 2012 Segment Guidance
33
*Note: totals may not add due to rounding
In millions of dollars
Electronic
Managed
Small
Total
Payment
Technology
Business
All
Corporate
Business
CAPCO
Intercompany
Processing
Solutions
Finance
Other
Activities
Segments
Segment
Eliminations
Total
Low
High
Low
High
Low
High
Low
High
Low
High
Low
High
Low
High
Low
High
2012 Full Year
Revenue
84.3
85.7
18.8
19.2
24.2
25.2
1.7
2.0
0.8
0.8
129.8
132.9
0.8
0.8
(1.5)
129.1
132.2
Pretax Income (Loss)
8.2
8.6
4.3
4.5
5.5
6.7
(1.0)
(0.9)
(8.5)
(8.4)
8.5
10.5
(2.0)
(2.0)
-
6.5
8.5
Income from tax credits
-
-
-
-
-
-
-
-
-
-
-
-
(0.8)
(0.8)
-
(0.8)
(0.8)
Net change in fair value of
credits in lieu of cash and
notes payable in credits in
lieu of cash
-
-
-
-
-
-
-
-
-
-
-
-
0.1
0.1
-
0.1
0.1
Deferred compensation
expense
-
-
-
-
-
-
-
-
0.4
0.4
0.4
0.4
-
-
-
0.4
0.4
Lease loss amortization
-
-
-
-
-
-
-
-
(0.2)
(0.2)
(0.2)
(0.2)
-
-
-
(0.2)
(0.2)
Interest Expense
-
-
0.1
0.1
3.8
3.8
-
-
-
-
3.9
3.9
0.7
0.7
-
4.6
4.6
Depreciation and
Amortization
0.8
0.8
1.2
1.2
1.5
1.5
-
-
0.2
0.2
3.7
3.7
-
-
-
3.7
3.7
Modified EBITDA
9.0
9.4
5.6
5.8
10.8
12.0
(1.0)
(0.9)
(8.1)
(8.0)
16.3
18.3
(2.0)
(2.0)
-
14.3
16.3 |
 Financial Review
Jennifer C. Eddelson –
CAO |
 Non-GAAP Financial Measures
In evaluating its business, Newtek considers and uses modified EBITDA as a
supplemental measure of its operating performance. The Company defines
modified EBITDA as earnings excluding income from
tax
credits,
net
change
in
fair
value
of
credits
in
lieu
of
cash
and
notes
payable
in
credits
in
lieu
of
cash, interest expense, deferred compensation expense, lease loss expense, taxes,
depreciation and amortization. Newtek uses modified EBITDA as a
supplemental measure to review and assess its operating performance.
The Company also presents modified EBITDA because it believes it is
frequently used by securities analysts, investors and other interested parties as a
measure of financial performance.
The term modified EBITDA is not defined under U.S. generally accepted accounting
principles, or U.S. GAAP, and is not a measure of operating income(loss),
operating performance or liquidity presented in accordance
with
U.S.
GAAP.
Modified
EBITDA
has
limitations
as
a
analytical
tool
and,
when
assessing the Company’s operating performance, investors should not consider
modified EBITDA in isolation, or as a substitute for net income (loss) or
other consolidated income statement data prepared in accordance with U.S.
GAAP. Among other things, modified EBITDA does not reflect the
Company’s
actual
cash
expenditures.
Other
companies
may
calculate
similar
measures
differently
than Newtek, limiting their usefulness as comparative tools. Newtek
compensates for these limitations by relying primarily on its GAAP results
and using modified EBITDA only supplementally. 35
|
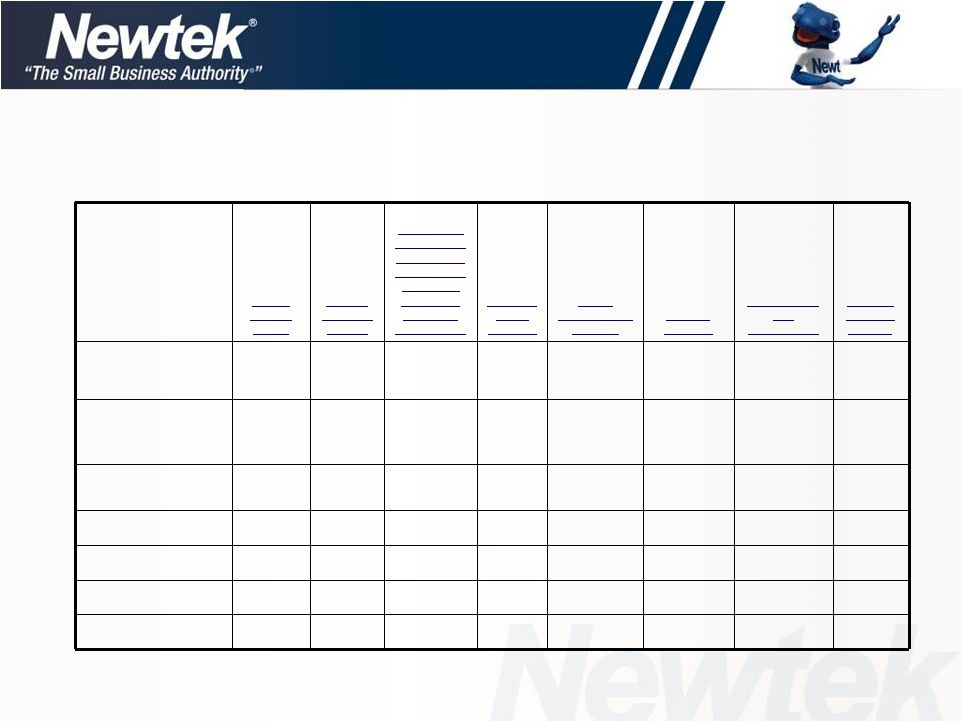
 Q2 2012 Actual vs. Q2 2011 Actual
36
In millions of dollars
Revenue For
The Quarter
Ended
June 30, 2012
Actual
Revenue For
The Quarter
Ended
June 30, 2011
Actual
Pretax Income
(Loss) For The
Quarter Ended
June 30, 2012
Actual
Pretax Income
(Loss) For The
Quarter Ended
June 30, 2011
Actual
MODIFIED
EBITDA For The
Quarter Ended
June 30, 2012
Actual
MODIFIED
EBITDA For The
Quarter Ended
June 30, 2011
Actual
Electronic
Payment
Processing
21.373
20.717
1.904
1.344
2.082
1.735
Managed
Technology
Solutions
4.570
4.767
1.114
.997
1.446
1.386
Small
Business
Finance
5.963
6.299
1.478
1.036
2.669
1.722
All Other
0.451
0.347
(0.238)
(0.342)
(0.228)
(0.314)
Corporate
Activities
0.205
0.304
(1.930)
(2.414)
(1.895)
(2.262)
CAPCO
0.141
0.324
(0.398)
(0.485)
(0.386)
(0.524)
Interco
Eliminations
(0.365)
(0.436)
–
–
–
–
Total
32.338
32.322
1.930
0.136
3.688
1.743
*Note: totals may not add due to rounding |
 2012 Segment Guidance
37
*Note: totals may not add due to rounding
In millions of dollars
Electronic
Managed
Small
Total
Payment
Technology
Business
All
Corporate
Business
CAPCO
Intercompany
Processing
Solutions
Finance
Other
Activities
Segments
Segment
Eliminations
Total
Low
High
Low
High
Low
High
Low
High
Low
High
Low
High
Low
High
Low
High
2012 Full Year
Revenue
84.3
85.7
18.8
19.2
24.2
25.2
1.7
2.0
0.8
0.8
129.8
132.9
0.8
0.8
(1.5)
129.1
132.2
Pretax Income (Loss)
8.2
8.6
4.3
4.5
5.5
6.7
(1.0)
(0.9)
(8.5)
(8.4)
8.5
10.5
(2.0)
(2.0)
-
6.5
8.5
Income from tax credits
-
-
-
-
-
-
-
-
-
-
-
-
(0.8)
(0.8)
-
(0.8)
(0.8)
Net change in fair value of
credits in lieu of cash and
notes payable in credits in
lieu of cash
-
-
-
-
-
-
-
-
-
-
-
-
0.1
0.1
-
0.1
0.1
Deferred compensation
expense
-
-
-
-
-
-
-
-
0.4
0.4
0.4
0.4
-
-
-
0.4
0.4
Lease loss amortization
-
-
-
-
-
-
-
-
(0.2)
(0.2)
(0.2)
(0.2)
-
-
-
(0.2)
(0.2)
Interest Expense
-
-
0.1
0.1
3.8
3.8
-
-
-
-
3.9
3.9
0.7
0.7
-
4.6
4.6
Depreciation and
Amortization
0.8
0.8
1.2
1.2
1.5
1.5
-
-
0.2
0.2
3.7
3.7
-
-
-
3.7
3.7
Modified EBITDA
9.0
9.4
5.6
5.8
10.8
12.0
(1.0)
(0.9)
(8.1)
(8.0)
16.3
18.3
(2.0)
(2.0)
-
14.3
16.3 |
 Going Forward: 2012
Barry Sloane -
CEO |
 Questions & Answers |
 Addendum |
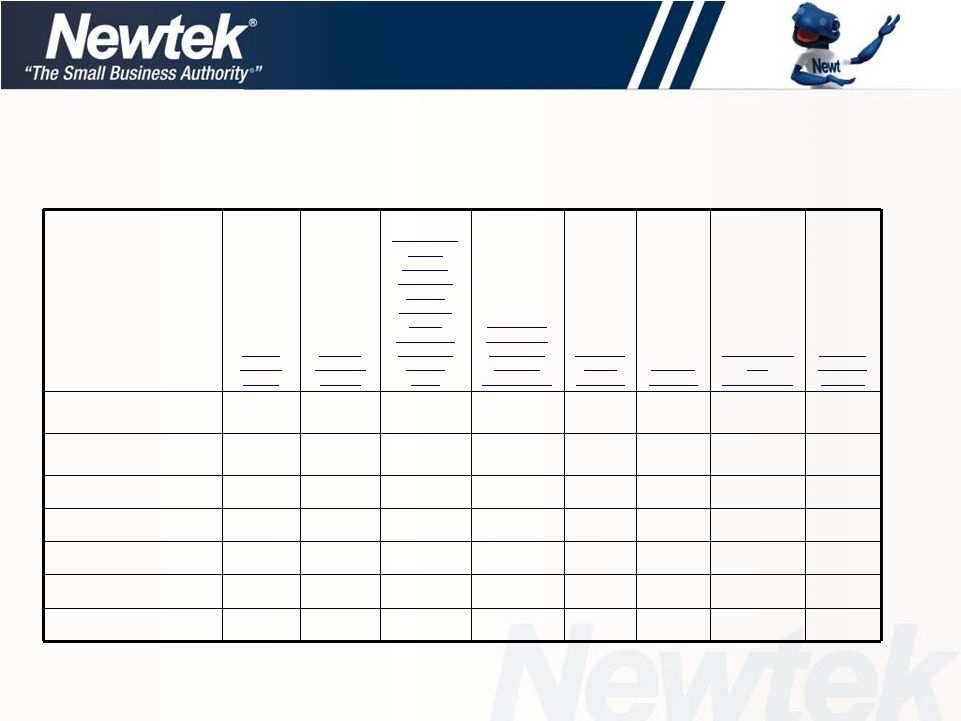
 41
Pretax
Income
(Loss)
Income
from Tax
Credits
Net Change
in Fair Value
of Credits in
Lieu of Cash
and Notes
Payable in
Credits in
Lieu of Cash
Deferred
Comp
Expense
Lease
restructuring
charges
Interest
Expense
Depreciation
and
amortization
Q2 2012
Modified
EBITDA
Electronic Payment
Processing
1.904
-
-
0.009
-
-
0.169
2.082
Managed Technology
Solutions
1.114
-
-
0.008
-
0.021
0.303
1.446
Small Business Finance
1.478
-
-
0.016
-
0.969
0.206
2.669
All Other
(0.238)
-
-
0.008
-
-
0.002
(0.228)
Corporate Activities
(1.930)
-
-
0.077
(0.073)
0.002
0.029
(1.895)
CAPCO
(0.398)
(0.129)
(0.005)
-
-
0.144
0.002
(0.386)
Total
1.930
(0.129)
(0.005)
0.118
(0.073)
1.136
0.711
3.688
Modified EBITDA Reconciliation
Modified EBITDA Reconciliation from Pretax Income (Loss)
For the three months ended June 30, 2012
In millions of dollars
*Note: totals may not add due to rounding |
 42
Pretax
Income
(Loss)
Income
from Tax
Credits
Net Change
in Fair
Value of
Credits in
Lieu of
Cash and
Notes
Payable in
Credits in
Lieu of
Cash
Other than
Temporary
Decline in
Value of
Investments
Deferred
Comp
Expense
Interest
Expense
Depreciation
and
amortization
Q2 2011
Modified
EBITDA
Electronic Payment
Processing
1.344
-
-
-
0.011
-
0.380
1.735
Managed Technology
Solutions
0.997
-
-
-
0.007
0.027
0.355
1.386
Small Business Finance
1.036
-
-
-
0.011
0.451
0.224
1.722
All Other
(0.342)
-
-
-
0.008
-
0.020
(0.314)
Corporate Activities
(2.414)
-
-
-
0.105
-
0.047
(2.262)
CAPCO
(0.485)
(0.317)
(0.001)
(0.051)
-
0.327
0.003
(0.524)
Total
0.136
(0.317)
(0.001)
(0.051)
0.142
0.805
1.029
1.743
Modified EBITDA Reconciliation
Modified EBITDA Reconciliation from Pretax Income (Loss)
For the three months ended June 30, 2011
In millions of dollars
*Note: totals may not add due to rounding |