Attached files
| file | filename |
|---|---|
| 8-K - MSCI INC. 8-K - MSCI Inc. | a50363962.htm |
| EX-99.1 - EXHIBIT 99.1 - MSCI Inc. | a50363962_ex991.htm |
Exhibit 99.2
msci.com ©2012. All rights reserved. msci.com Second Quarter 2012 Earnings Presentation August 2, 2012 MSCI A Clear View of Rish and Return

msci.com ©2012. All rights reserved. 2 msci.com Forward-Looking Statements – Safe Harbor Statement This presentation may contain forward-looking statements within the meaning of the Private Securities Litigation Reform Act of 1995. You should not place undue reliance on forward-looking statements because they involve known and unknown risks, uncertainties and other factors that are, in some cases, beyond our control and that could materially affect actual results, levels of activity, performance or achievements. For a discussion of risk and uncertainties that could materially affect actual results, levels of activity, performance or achievements, please see the Company’s Annual Report on Form 10-K for the fiscal year ended December 31, 2011 and its other reports filed with the SEC. The forward-looking statements included in this presentation represent the Company’s view as of the date of the presentation. The Company assumes no obligation to publicly update or revise these forward-looking statements for any reason, whether as a result of new information, future events, or otherwise.
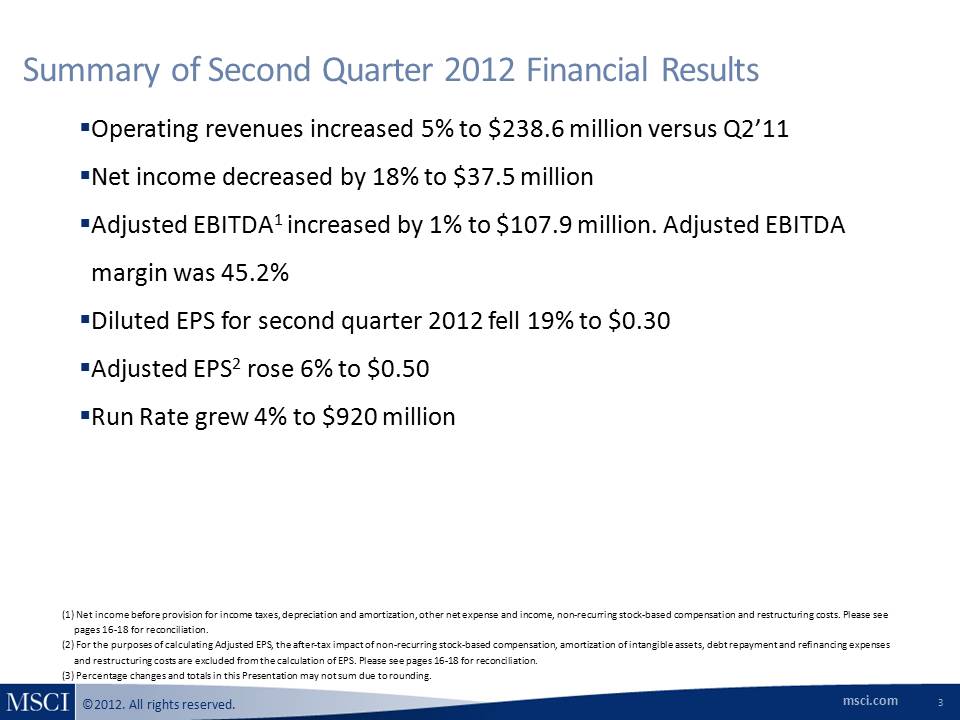
msci.com ©2012. All rights reserved. Summary of Second Quarter 2012 Financial Results 3 Operating revenues increased 5% to $238.6 million versus Q2’11 Net income decreased by 18% to $37.5 million Adjusted EBITDA1 increased by 1% to $107.9 million. Adjusted EBITDA margin was 45.2% Diluted EPS for second quarter 2012 fell 19% to $0.30 Adjusted EPS2 rose 6% to $0.50 Run Rate grew 4% to $920 million (1) Net income before provision for income taxes, depreciation and amortization, other net expense and income, non-recurring stock-based compensation and restructuring costs. Please see pages 16-18 for reconciliation. (2) For the purposes of calculating Adjusted EPS, the after-tax impact of non-recurring stock-based compensation, amortization of intangible assets, debt repayment and refinancing expenses and restructuring costs are excluded from the calculation of EPS. Please see pages 16-18 for reconciliation. (3) Percentage changes and totals in this Presentation may not sum due to rounding.
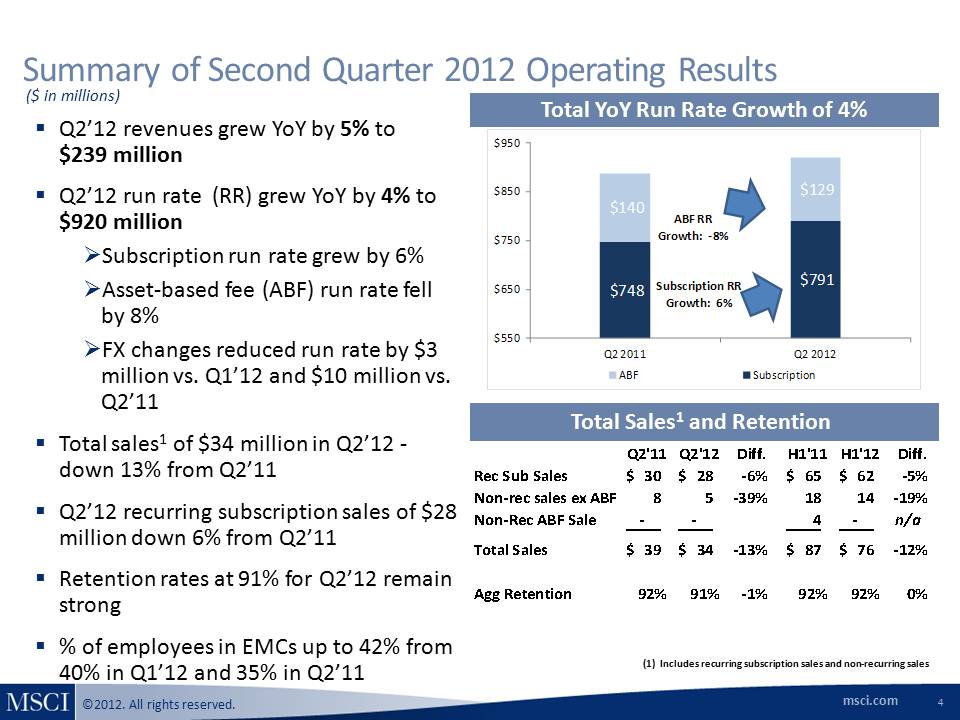
msci.com ©2012. All rights reserved. Summary of Second Quarter 2012 Operating Results 4 Total YoY Run Rate Growth of 4% Total Sales1 and Retention Q2’12 revenues grew YoY by 5% to $239 million Q2’12 run rate (RR) grew YoY by 4% to $920 million Subscription run rate grew by 6% Asset-based fee (ABF) run rate fell by 8% FX changes reduced run rate by $3 million vs. Q1’12 and $10 million vs. Q2’11 Total sales1 of $34 million in Q2’12 -down 13% from Q2’11 Q2’12 recurring subscription sales of $28 million down 6% from Q2’11 Retention rates at 91% for Q2’12 remain strong % of employees in EMCs up to 42% from 40% in Q1’12 and 35% in Q2’11 ($ in millions) (1) Includes recurring subscription sales and non-recurring sales
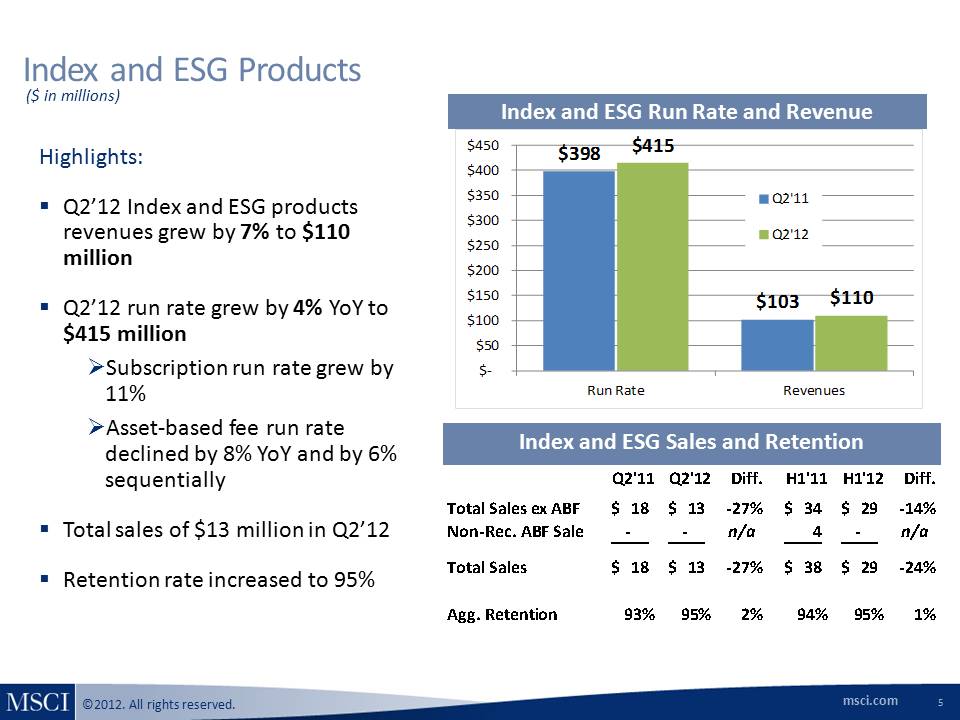
msci.com ©2012. All rights reserved. Index and ESG Products 5 Index and ESG Run Rate and Revenue Highlights: Q2’12 Index and ESG products revenues grew by 7% to $110 million Q2’12 run rate grew by 4% YoY to $415 million Subscription run rate grew by 11% Asset-based fee run rate declined by 8% YoY and by 6% sequentially Total sales of $13 million in Q2’12 Retention rate increased to 95% ($ in millions) Index and ESG Sales and Retention
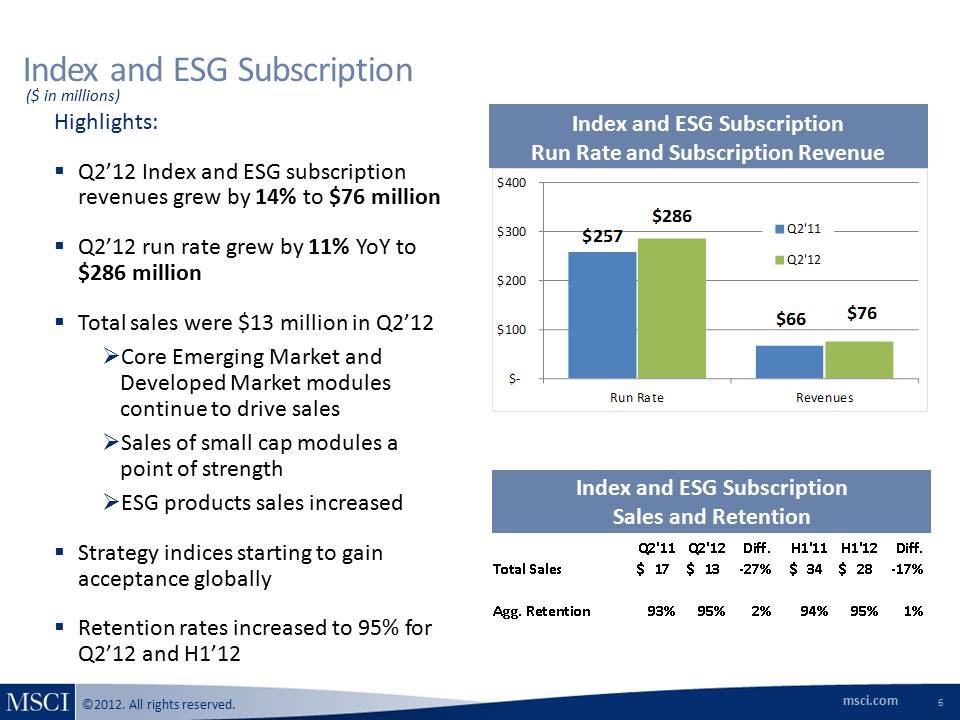
msci.com ©2012. All rights reserved. Index and ESG Subscription Index and ESG Subscription Run Rate and Subscription Revenue Highlights: Q2’12 Index and ESG subscription revenues grew by 14% to $76 million Q2’12 run rate grew by 11% YoY to $286 million Total sales were $13 million in Q2’12 Core Emerging Market and Developed Market modules continue to drive sales Sales of small cap modules a point of strength ESG products sales increased Strategy indices starting to gain acceptance globally Retention rates increased to 95% for Q2’12 and H1’12 ($ in millions) 6 Index and ESG Subscription Sales and Retention $257 $66 $286 $76 $- $100 $200 $300 $400 Run Rate Revenues Q2'11 Q2'12 Q2'11 Q2'12 Diff. H1'11 H1'12 Diff. Total Sales 17 $ 13 $ - 27% 34 $ 28 $ -17% Agg. Retention 93% 95% 2% 94% 95% 1%
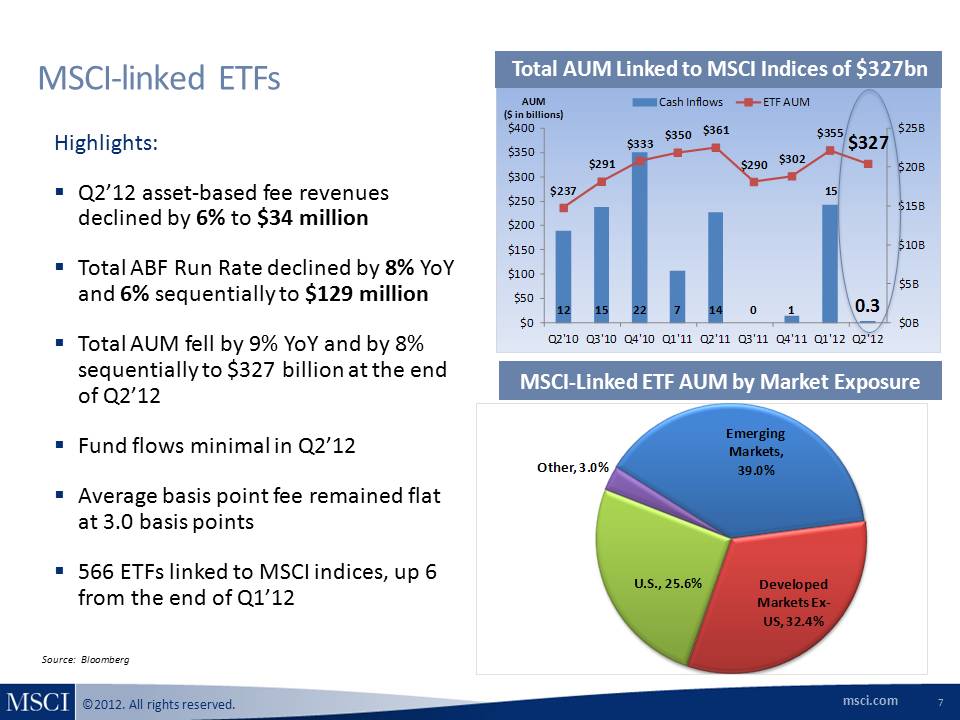
Highlights:-- Q2’12 asset-based fee revenues declined by 6% to $34 million -- Total ABF Run Rate declined by 8% YoY and 6% sequentially to $129 million -- Total AUM fell by 9% YoY and by 8% sequentially to $327 billion at the end of Q2’12 -- Fund flows minimal in Q2’12 -- Average basis point fee remained flat at 3.0 basis points -- 566 ETFs linked to MSCI indices, up 6 from the end of Q1’12
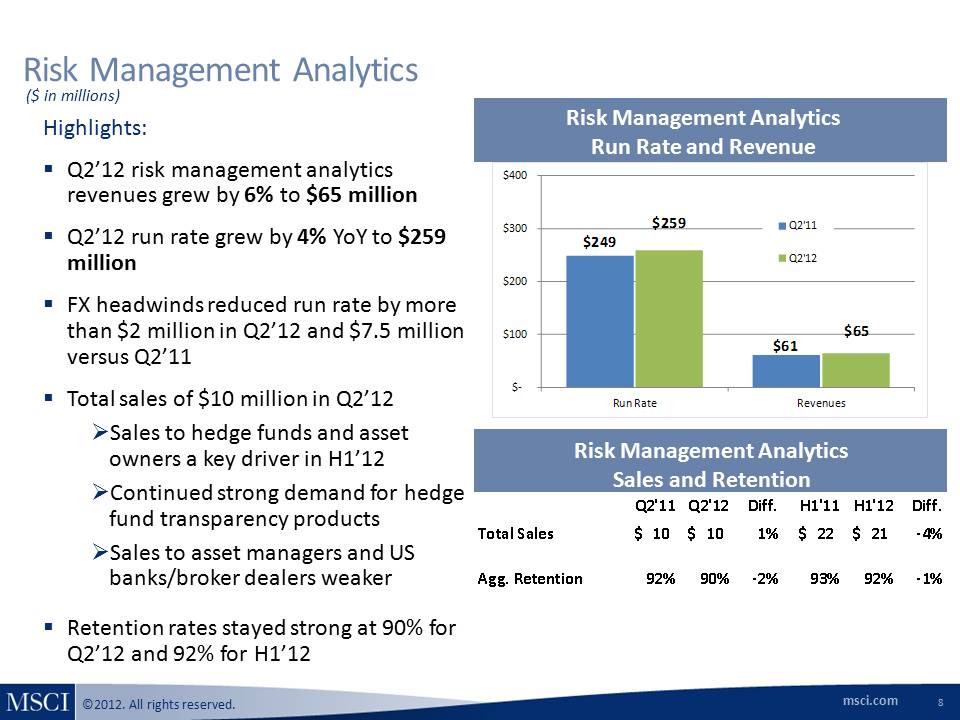
msci.com ©2012. All rights reserved. Portfolio Management Analytics Portfolio Management Analytics Run Rate and Revenue Highlights: Q2’12 portfolio management analytics revenues flat YoY at $29 million Q2’12 run rate declined by 1% YoY to $117 million New market models released in Q2 include Australia, Canada and China Total sales of $4 million in Q2’12 Selling environment remains competitive New products driving increasing percentage of total sales Retention rates dipped to 84% in Q2’12 but were at 88% for H1’12 ($ in millions) 9 Portfolio Management Analytics Sales and Retention $11 8 $29 $11 7 $29 $- $50 $100 $150 $200 Run Rate Revenues Q2'11 Q2'12 Q2'11 Q2'12 Diff. H1'11 H1'12 Diff. Total Sales 3 $4 $ 21% 8 $7 $ - 10% Agg. Retention 91% 84% -7% 90% 88% -2%i.com ©2012. All rights reserved. Risk Management Analytics Risk Management Analytics Run Rate and Revenue Highlights: Q2’12 risk management analytics revenues grew by 6% to $65 million Q2’12 run rate grew by 4% YoY to $259 million FX headwinds reduced run rate by more than $2 million in Q2’12 and $7.5 million versus Q2’11 Total sales of $10 million in Q2’12 Sales to hedge funds and asset owners a key driver in H1’12 Continued strong demand for hedge fund transparency products Sales to asset managers and US banks/broker dealers weaker Retention rates stayed strong at 90% for Q2’12 and 92% for H1’12 ($ in millions) 8 Risk Management Analytics Sales and Retention $249 $61 $259 $65 $- $100 $200 $300 $400 Run Rate Revenues Q2'11 Q2'12 Q2'11 Q2'12 Diff. H1'11 H1'12 Diff. Total Sales 10 $10 $ 1% 22 $21$- 4% Agg. Retention 92% 90% -2% 93% 92% -1%
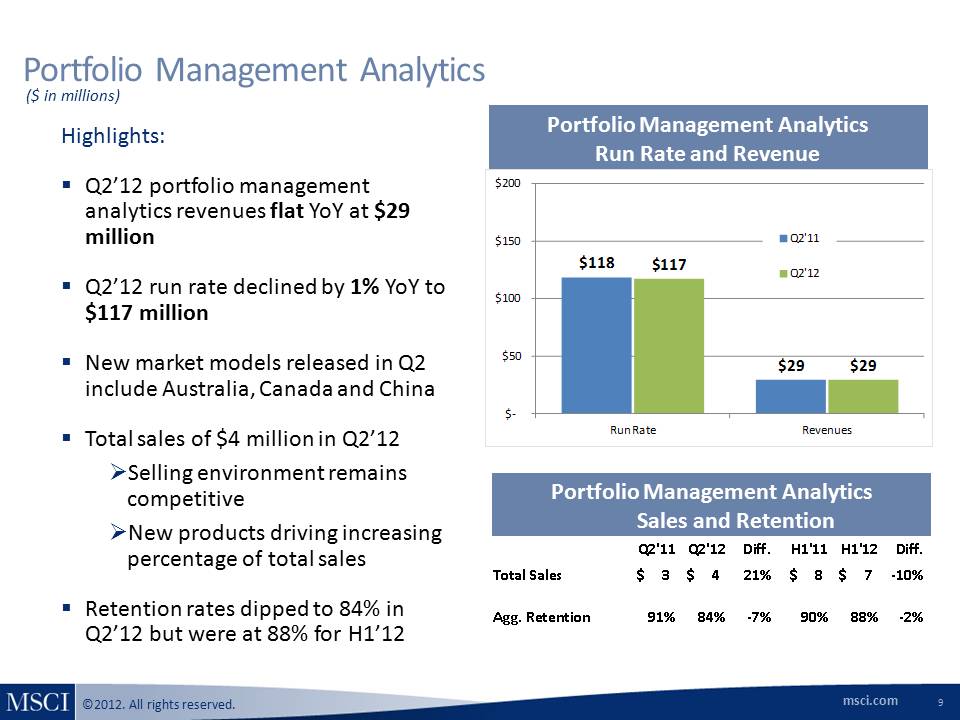
msci.com ©2012. All rights reserved. Portfolio Management Analytics Portfolio Management Analytics Run Rate and Revenue Highlights: Q2’12 portfolio management analytics revenues flat YoY at $29 million Q2’12 run rate declined by 1% YoY to $117 million New market models released in Q2 include Australia, Canada and China Total sales of $4 million in Q2’12 Selling environment remains competitive New products driving increasing percentage of total sales Retention rates dipped to 84% in Q2’12 but were at 88% for H1’12 ($ in millions) 9 Portfolio Management Analytics Sales and Retention $11 8 $29 $11 7 $29 $- $50 $100 $150 $200 Run Rate Revenues Q2'11 Q2'12 Q2'11 Q2'12 Diff. H1'11 H1'12 Diff. Total Sales 3 $4 $ 21% 8 $7 $ - 10% Agg. Retention 91% 84% -7% 90% 88% -2%
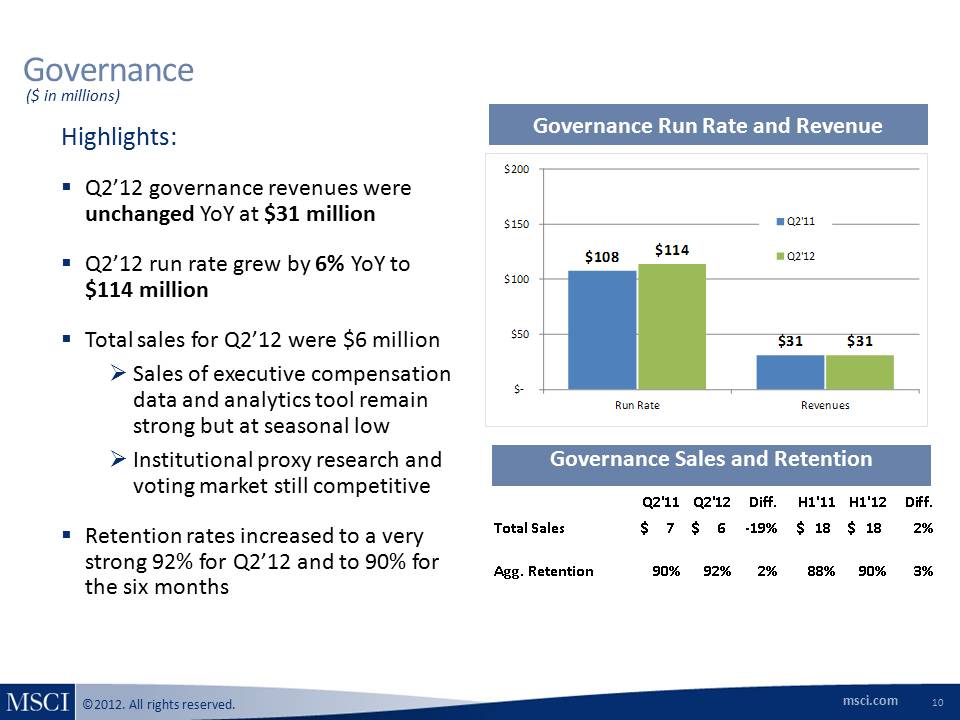
msci.com ©2012. All rights reserved. Governance Governance Run Rate and Revenue Highlights: Q2’12 governance revenues were unchanged YoY at $31 million Q2’12 run rate grew by 6% YoY to $114 million Total sales for Q2’12 were $6 million Sales of executive compensation data and analytics tool remain strong but at seasonal low Institutional proxy research and voting market still competitive Retention rates increased to a very strong 92% for Q2’12 and to 90% for the six months ($ in millions) 10 Governance Sales and Retention
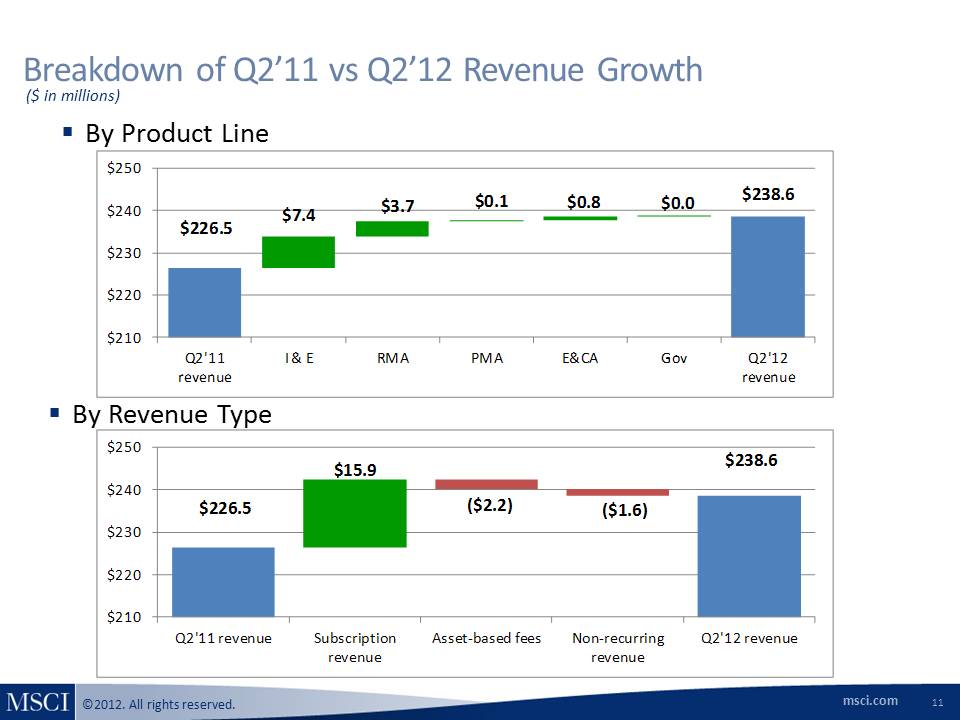
msci.com ©2012. All rights reserved. Breakdown of Q2’11 vs Q2’12 Revenue Growth 11 ($ in millions) By Product Line By Revenue Type $226.5 $238.6 $15.9 $210 $220 $230 $240 $250 Q2'11 revenue Subscription revenue Asset-based fees Non-recurring revenue Q2'12 revenue ($1.6) ($2.2) $226.5 $238.6 $7.4 $3.7 $0.1 $0.8 $0.0 $210 $220 $230 $240 $250 Q2'11 revenue I & E RMA PMA E&CA Gov Q2'12 revenue
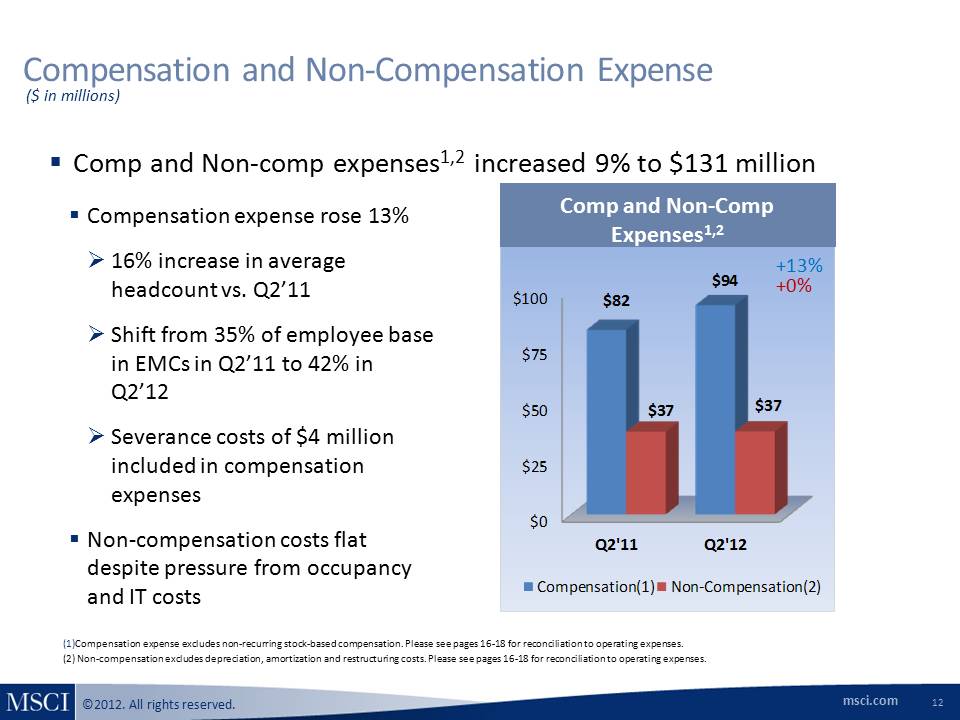
msci.com ©2012. All rights reserved. $0$25$50 $75 $100 Q2'11 Q2'12 $82 $94 $37 $37 Compensation (1) Non-Compensation (2) Compensation and Non-Compensation Expense Comp and Non-Comp Expenses1, 2 +13% ($ in millions) (1) Compensation expense excludes non-recurring stock-based compensation. Please see pages 16-18 for reconciliation to operating expenses. (2) Non-compensation excludes depreciation, amortization and restructuring costs. Please see pages 16-18 for reconciliation to operating expenses. +0% 12 Comp and Non-comp expenses 1, 2 increased 9% to $131 million Compensation expense rose 13% 16% increase in average headcount vs. Q2’11 Shift from 35% of employee base in EMCs in Q2’11 to 42% in Q2’12 Severance costs of $4 million included in compensation expenses Non-compensation costs flat despite pressure from occupancy and IT costs
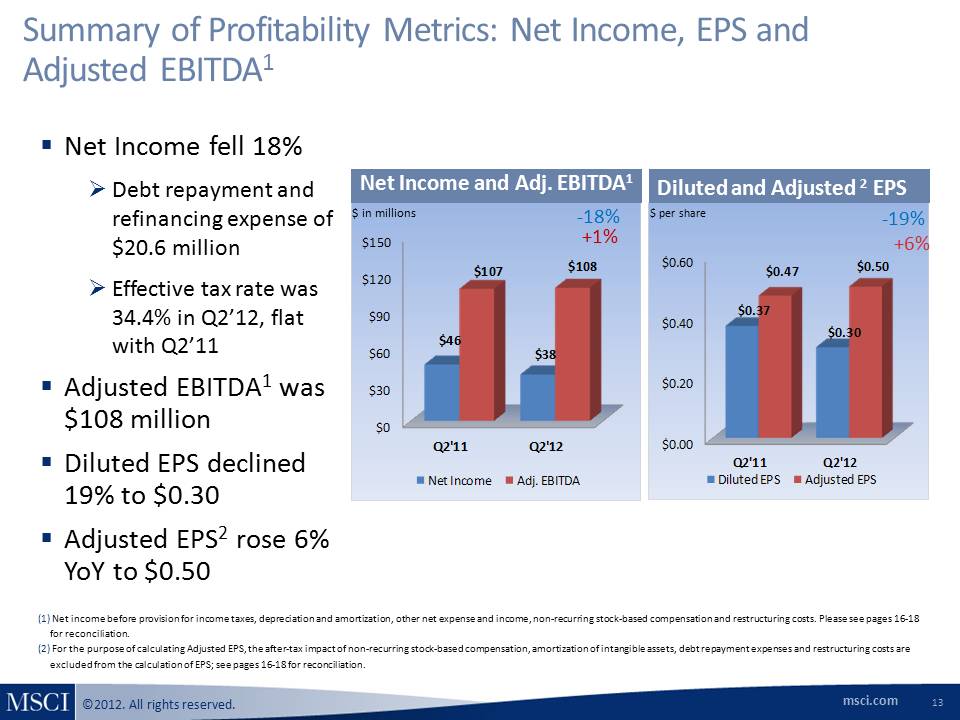
msci.com ©2012. All rights reserved. Summary of Profitability Metrics: Net Income, EPS and Adjusted EBITDA1 13 $ per share -19% +6% Diluted and Adjusted 2 EPS Net Income fell 18% Debt repayment and refinancing expense of $20.6 million Effective tax rate was 34.4% in Q2’12, flat with Q2’11 Adjusted EBITDA1 was $108 million Diluted EPS declined 19% to $0.30 Adjusted EPS2 rose 6% YoY to $0.50 Net Income and Adj. EBITDA1 -18% +1% (1) Net income before provision for income taxes, depreciation and amortization, other net expense and income, non-recurring stock-based compensation and restructuring costs. Please see pages 16-18 for reconciliation. (2) For the purpose of calculating Adjusted EPS, the after-tax impact of non-recurring stock-based compensation, amortization of intangible assets, debt repayment expenses and restructuring costs are excluded from the calculation of EPS; see pages 16-18 for reconciliation. $ in millions
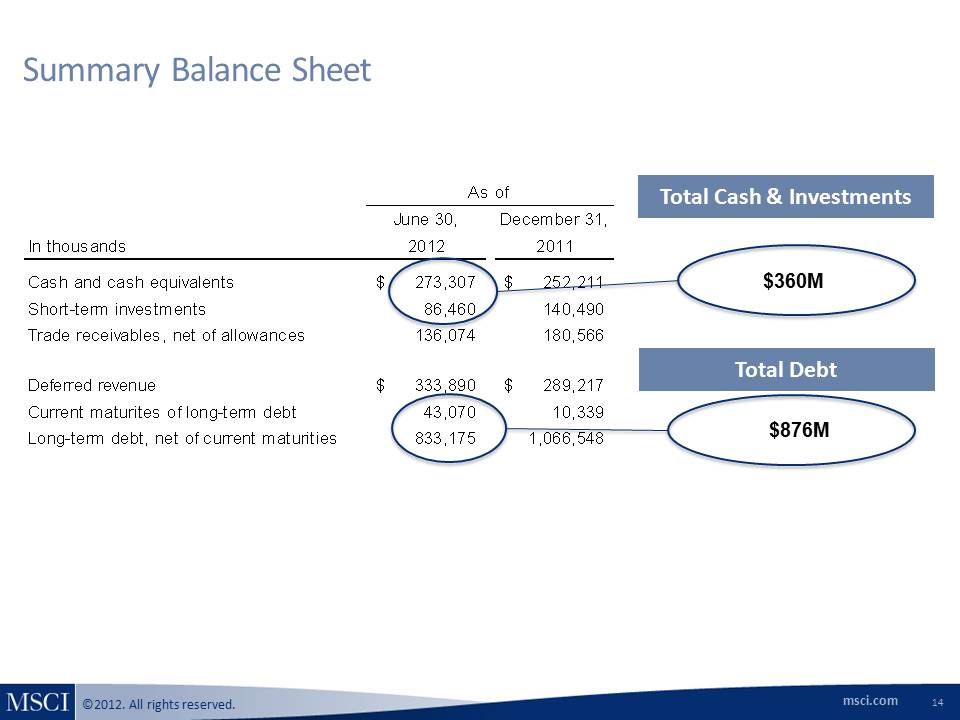
msci.com ©2012. All rights reserved. June 30,December 31, In thousands 2012 2011Cash and cash equivalents 273,307 $ 252,211 $ Short-term investments 86,460 140,490 Trade receivables, net of allowances 136,074 180,566 Deferred revenue 333,890 $ 289,217 $ Current maturites of long-term debt 43,070 10,339 Long-term debt, net of current maturities 833,175 1,066,548 As of 14 $876M Summary Balance Sheet $360M Total Cash & Investments Total Debt
msci.com ©2012. All rights reserved. Use of Non-GAAP Financial Measures MSCI has presented supplemental non-GAAP financial measures as part of this presentation. A reconciliation is provided that reconciles each non-GAAP financial measure with the most comparable GAAP measure. The presentation of non-GAAP financial measures should not be considered as alternative measures for the most directly comparable GAAP financial measures. These measures are used by management to monitor the financial performance of the business, inform business decision making and forecast future results. Adjusted EBITDA is defined as net income before provision for income taxes, other net expense and income, depreciation and amortization, non-recurring stock-based compensation expense and restructuring costs . Adjusted Net Income and Adjusted EPS are defined as net income and EPS, respectively, before provision for non-recurring stock-based compensation expenses, amortization of intangible assets, restructuring costs and the accelerated amortization or write off of deferred financing and debt discount costs as a result of debt repayment (debt repayment and refinancing expenses), as well as for any related tax effects. We believe that adjustments related to restructuring costs and debt repayment and refinancing expenses are useful to management and investors because it allows for an evaluation of MSCI’s underlying operating performance. Additionally, we believe that adjusting for non-recurring stock-based compensation expenses, debt repayment and refinancing expenses and the amortization of intangible assets may help investors compare our performance to that of other companies in our industry as we do not believe that other companies in our industry have as significant a portion of their operating expenses represented by these items. We believe that the non-GAAP financial measures presented in this presentation facilitate meaningful period-to-period comparisons and provide a baseline for the evaluation of future results. Adjusted EBITDA, Adjusted net income and Adjusted EPS are not defined in the same manner by all companies and may not be comparable to other similarly titled measures of other companies. 15
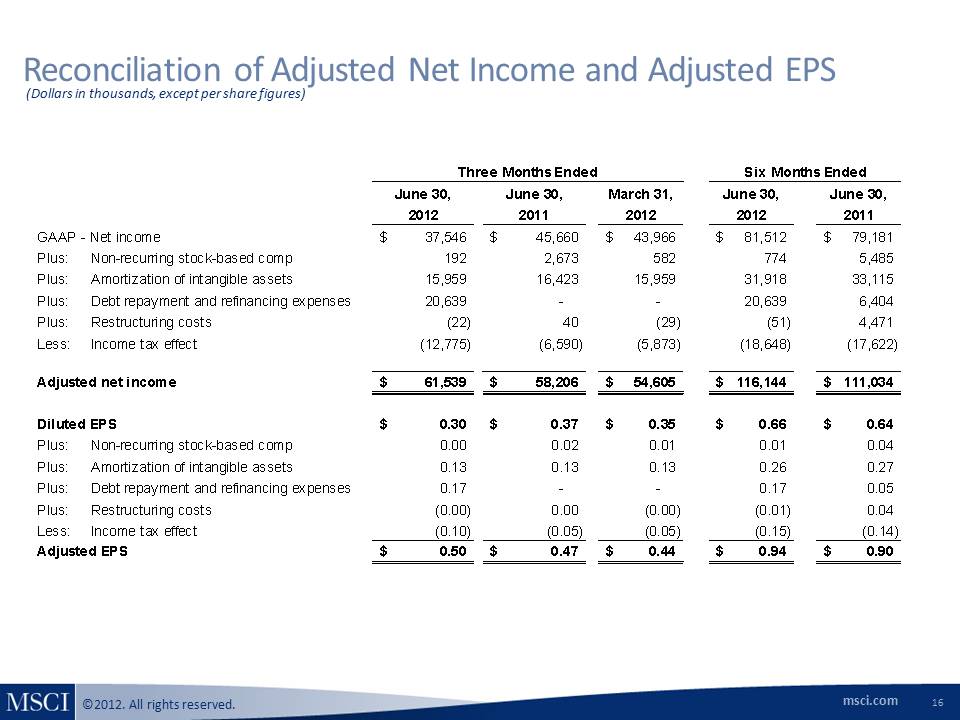
msci.com ©2012. All rights reserved. 16 Reconciliation of Adjusted Net Income and Adjusted EPS (Dollars in thousands, except per share figures) June 30,June 30,March 31,June 30,June 30,20122011201220122011GAAP - Net income37,546$ 45,660$ 43,966$ 81,512$ 79,181$ Plus:Non-recurring stock-based comp192 2,673 582 774 5,485 Plus:Amortization of intangible assets15,959 16,423 15,959 31,918 33,115 Plus:Debt repayment and refinancing expenses20,639 - - 20,639 6,404 Plus:Restructuring costs(22) 40 (29) (51) 4,471 Less:Income tax effect(12,775) (6,590) (5,873) (18,648) (17,622) Adjusted net income61,539$ 58,206$ 54,605$ 116,144$ 111,034$ Diluted EPS0.30$ 0.37$ 0.35$ 0.66$ 0.64$ Plus:Non-recurring stock-based comp0.00 0.02 0.01 0.01 0.04 Plus:Amortization of intangible assets0.13 0.13 0.13 0.26 0.27 Plus:Debt repayment and refinancing expenses0.17 - - 0.17 0.05 Plus:Restructuring costs(0.00) 0.00 (0.00) (0.01) 0.04 Less:Income tax effect(0.10) (0.05) (0.05) (0.15) (0.14) Adjusted EPS0.50$ 0.47$ 0.44$ 0.94$ 0.90$ Three Months EndedSix Months Ended
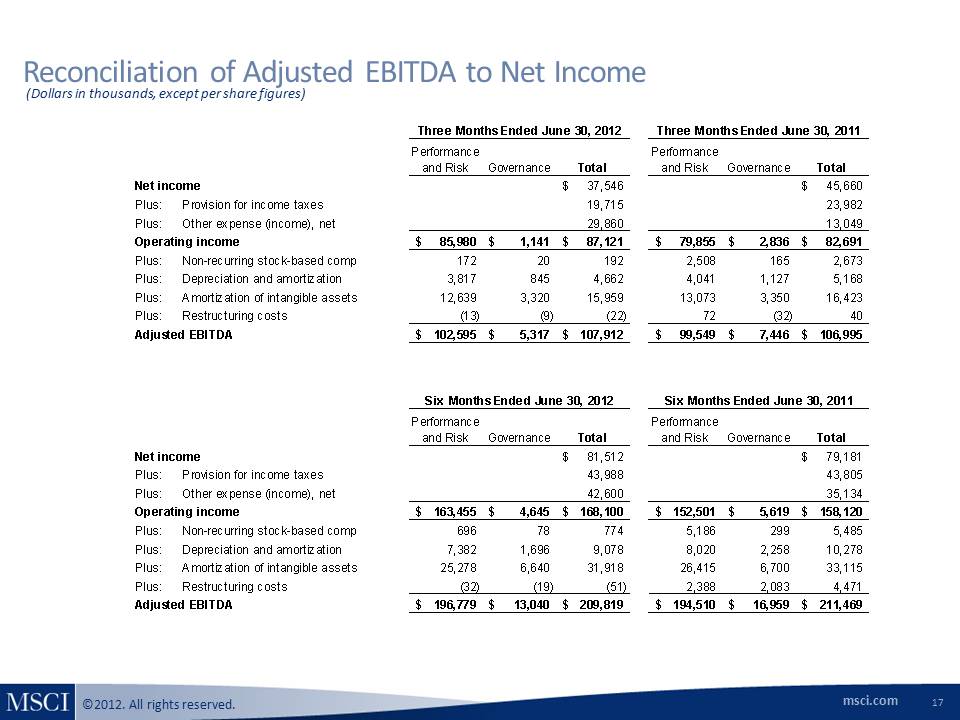
msci.com ©2012. All rights reserved. Reconciliation of Adjusted EBITDA to Net Income 17 (Dollars in thousands, except per share figures) Performance and RiskGovernanceTotalPerformance and RiskGovernanceTotalNet income37,546$ 45,660$ Plus:Provision for income taxes19,715 23,982 Plus:Other expense (income), net29,860 13,049 Operating income85,980$ 1,141$ 87,121$ 79,855$ 2,836$ 82,691$ Plus:Non-recurring stock-based comp172 20 192 2,508 165 2,673 Plus:Depreciation and amortization3,817 845 4,662 4,041 1,127 5,168 Plus:Amortization of intangible assets12,639 3,320 15,959 13,073 3,350 16,423 Plus:Restructuring costs(13) (9) (22) 72 (32) 40 Adjusted EBITDA102,595$ 5,317$ 107,912$ 99,549$ 7,446$ 106,995$ Performance and Risk Governance Total Performance and Risk Governance Total Net income 81,512 $ 79,181$ Plus:Provision for income taxes43,988 43,805 Plus:Other expense (income), net42,600 35,134 Operating income163,455$ 4,645$ 168,100$ 152,501$ 5,619$ 158,120$ Plus:Non-recurring stock-based comp696 78 774 5,186 299 5,485 Plus:Depreciation and amortization7,382 1,696 9,078 8,020 2,258 10,278 Plus:Amortization of intangible assets25,278 6,640 31,918 26,415 6,700 33,115 Plus:Restructuring costs(32) (19) (51) 2,388 2,083 4,471 Adjusted EBITDA196,779$ 13,040$ 209,819$ 194,510$ 16,959$ 211,469$ Three Months Ended June 30, 2012Three Months Ended June 30, 2011Six Months Ended June 30, 2012Six Months Ended June 30, 2011
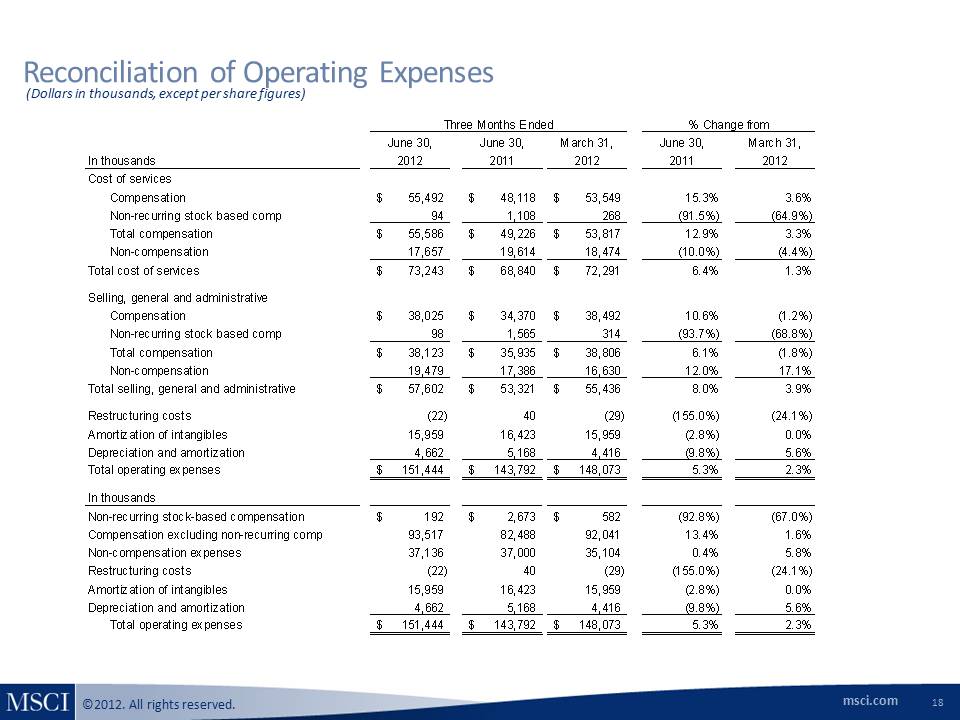
msci.com ©2012. All rights reserved. Reconciliation of Operating Expenses 18 (Dollars in thousands, except per share figures) June 30,June 30,March 31,June 30,March 31,In thousands20122011201220112012Cost of servicesCompensation55,492 $ 48,118 $ 53,549 $ 15.3%3.6% Non-recurring stock based comp94 1,108 268 (91.5%)(64.9%)Total compensation55,586 $ 49,226 $ 53,817 $ 12.9%3.3% Non-compensation17,657 19,614 18,474 (10.0%)(4.4%) Total cost of services 73,243$ 68,840$ 72,291$ 6.4%1.3% Selling, general and administrative Compensation 38,025 $ 34,370 $ 38,492 $ 10.6%(1.2%) Non-recurring stock based comp98 1,565 314 (93.7%) (68.8%)Total compensation38,123 $ 35,935 $ 38,806 $ 6.1% (1.8%) Non-compensation19,479 17,386 16,630 12.0%17.1% Total selling, general and administrative57,602 $ 53,321 $ 55,436 $ 8.0%3.9% Restructuring costs (22) 40 (29) (155.0%) (24.1%) Amortization of intangibles15,959 16,423 15,959 (2.8%)0.0% Depreciation and amortization 4,662 5,168 4,416 (9.8%)5.6% Total operating expenses 151,444$ 143,792$ 148,073$ 5.3%2.3% In thousands Non-recurring stock-based compensation 192 $ 2,673 $ 582 $ (92.8%)(67.0%) Compensation excluding non-recurring comp 93,517 82,488 92,041 13.4%1.6% Non-compensation expenses 37,136 37,000 35,104 0.4%5.8%Restructuring costs(22) 40 (29) (155.0%) (24.1%) Amortization of intangibles15,959 16,423 15,959 (2.8%) 0.0% Depreciation and amortization4,662 5,168 4,416 (9.8%) 5.6% Total operation expenses Total operating expenses151,444 $ 143,792 $ 148,073 $ 5.3% 2.3% Three Months Ended% Change from