Attached files
| file | filename |
|---|---|
| 8-K - FORM 8-K - FIRST BANCORP /PR/ | d390532d8k.htm |
 Financial
Results Second Quarter 2012
Exhibit 99.1 |
 Forward-Looking Statements
2
This presentation contains “forward-looking statements” concerning First
BanCorp’s (the “Corporation”) future economic performance. The words or phrases “would
be,” “will allow,” “intends to,” “will likely result,”
“are expected to,” “expect,” “anticipate,” “look forward,” “should,” “believes” and similar expressions are meant to
identify “forward-looking statements” within the meaning of Section 27A of the
Private Securities Litigation Reform Act of 1995, and are subject to the safe harbor
created by such section. The Corporation wishes to caution readers not to place undue reliance
on any such “forward-looking statements,” which speak only as of the date
made, and to advise readers that various factors, including, but not limited to, uncertainty about whether the Corporation and FirstBank Puerto Rico (“FirstBank”
or “the Bank”) will be able to fully comply with the written agreement dated
June 3, 2010 that the Corporation entered into with the Federal Reserve Bank of New
York (the “FED”) and the order dated June 2, 2010 (the “Order”)that
FirstBank entered into with the FDIC and the Office of the Commissioner of Financial Institutions
of Puerto Rico that, among other things, require FirstBank to maintain certain capital levels
and reduce its special mention, classified, delinquent and non-performing assets;
the risk of being subject to possible additional regulatory actions; uncertainty as to the availability of certain funding sources, such as retail brokered CDs; the
Corporation’s reliance on brokered CDs and its ability to obtain, on a periodic basis,
approval from the FDIC to issue brokered CDs to fund operations and provide
liquidity in accordance with the terms of the Order; the risk of not being able to fulfill the Corporation’s cash obligations or resume paying dividends to the
Corporation’s stockholders in the future due to the Corporation’s inability to
receive approval from the FED to receive dividends from FirstBank or FirstBank’s failure to
generate sufficient cash flow to make a dividend payment to the Corporation; the strength or
weakness of the real estate markets and of the consumer and commercial credit sectors
and their impact on the credit quality of the Corporation’s loans and other assets, including the Corporation’s construction and commercial
real estate loan portfolios, which have contributed and may continue to contribute to, among
other things, the high levels of non-performing assets, charge-offs and the
provision expense and may subject the Corporation to further risk from loan defaults and foreclosures; adverse changes in general economic conditions in the
United States and in Puerto Rico, including the interest rate scenario, market liquidity,
housing absorption rates, real estate prices and disruptions in the U.S. capital
markets, which may reduce interest margins, impact funding sources and affect demand for all
of the Corporation’s products and services and the value of the Corporation’s
assets; an adverse change in the Corporation’s ability to attract new clients and retain existing ones; a decrease in demand for the Corporation’s
products and services and lower revenues and earnings because of the continued recession in
Puerto Rico and the current fiscal problems and budget deficit of the Puerto Rico
government; uncertainty about regulatory and legislative changes for financial services companies in Puerto Rico, the United States and the U.S. and
British Virgin Islands, which could affect the Corporation’s financial performance and
could cause the Corporation’s actual results for future periods to differ materially
from prior results and anticipated or projected results; uncertainty about the effectiveness
of the various actions undertaken to stimulate the United States economy and stabilize
the United States’ financial markets, and the impact such actions may have on the Corporation’s business, financial condition and results of operations;
changes in the fiscal and monetary policies and regulations of the federal government,
including those determined by the Federal Reserve System, the FDIC,
government-sponsored housing agencies and regulators in Puerto Rico and the U.S. and
British Virgin Islands; the risk of possible failure or circumvention of controls and
procedures and the risk that the Corporation’s risk management policies may not be adequate; the risk that the FDIC may further increase the deposit insurance
premium and/or require special assessments to replenish its insurance fund, causing an
additional increase in the Corporation’s non-interest expense; risks of not
being able to recover the assets pledged to Lehman Brothers Special Financing, Inc.; the
impact on the Corporation’s results of operations and financial condition
associated with acquisitions and dispositions; a need to recognize additional impairments on
financial instruments or goodwill relating to acquisitions; risks that downgrades in
the credit ratings of the Corporation’s long-term senior debt will adversely affect the Corporation’s ability to access necessary external funds; the
impact of the Dodd-Frank Wall Street Reform and Consumer Protection Act on the
Corporation’s businesses, business practices and cost of operations; and general
competitive factors and industry consolidation. The Corporation does not undertake, and
specifically disclaims any obligation, to update any “forward-looking
statements” to reflect occurrences or unanticipated events or circumstances after the
date of such statements except as required by the federal securities laws. Investors
should refer to the Corporation’s Annual Report on Form 10-K for the year ended December 31, 2011 for a discussion of such factors and certain risks and
uncertainties to which the Corporation is subject.
|
 Agenda
Second Quarter 2012 Highlights:
Aurelio Alemán, President & Chief Executive Officer
Second Quarter Results of Operations:
Orlando Berges, Executive Vice President & Chief Financial Officer
Summary
Questions & Answers
3 |
 SECOND QUARTER
2012 Highlights |
 Second Quarter
2012 Highlights: ACHIEVED PROFITABILITY
1
st
quarter of profitability achieved since March 2009, through the
implementation and execution of strategic plan.
Focused on the following levers to return to profitability:
Reduction of non-performing and classified assets;
Profitable loan growth;
Core deposit growth;
Non-interest income growth;
Improve efficiencies;
NIM expansion; and
Continued strengthening of governance and risk management.
5
$9.4 million of net income; Diluted EPS $0.05 |
 6
Taking advantage of opportunities within market
Second Quarter 2012 Highlights:
MARKET OPPORTUNITIES Puerto Rico showing signs of
improvement; projected positive GNP growth of 0.9% for 2012
Growing core deposits through focus on enhancing relationships with
responsive team and product offerings
Transaction banking business developed to increase non-interest
income
Re-energizing loan production in key focus areas: consumer, auto,
residential mortgages & small commercial |
 7
Second
Quarter
2012
Highlights:
LOAN
PORTFOLIO
DIVERSIFICATION
($ in millions)
Loan Portfolio
Loan Originations
Significant commercial loan maturities and pay-offs
during Q2 offset by the increase in Consumer due to
the credit card portfolio acquisition.
$-
$2,000
$4,000
$6,000
$8,000
$10,000
$12,000
2Q 2011
3Q 2011
4Q 2011
1Q 2012
2Q 2012
2,881
2,874
2,874
2,799
2,764
1,612
1,577
1,562
1,553
1,950
516
474
428
399
365
4,166
4,123
4,131
4,044
3,738
1,591
1,585
1,565
1,501
1,479
21
14
16
44
60
Residential
Consumer
Construction
Commercial and Industrial
Commercial Real Estate
Loans Held for Sale
10,786
10,647
10,575
10,340
10,357
Implementing strategies to increase Consumer and
Residential Mortgage loan originations
Strong origination activity in Q2 vs. Q1:
Residential
mortgages
increased
$32
million
20%
Consumer:
Auto
loans
increased
$29
million
25%
Consumer:
Personal
loans
increased
$13
million
31%
Consumer:
Credit
card
utilization
activity
of
$34
million
C&I
loan
originations
increased
$151
million
66% |
 8
Acquisition of $406 million credit card portfolio
Second Quarter 2012 Highlights:
CREDIT CARD
PORTFOLIO
On May 31, 2012, completed purchase of a $406 million FirstBank-branded
consumer credit card portfolio from FIA Card Services, N.A.
The portfolio consists of approximately 140,000 active credit card relationships.
Recorded
at
an
initial
fair
value
of
approximately
$369
million,
and
recognized
an intangible asset of $24.4 million.
Diversifies revenue streams and the composition of the loan portfolio.
Provides significant opportunity to broaden and deepen relationships with
customers and accelerates cross sell targets.
Positive contributor to NIM, non-interest income and efficiency ratio since first
month of operation. |
 Successful
execution of deposit growth strategy; deposits (net of brokered CDs) grew $148 million
or 2%; we achieved this while reducing the cost of deposits net of brokered from 1.11%
to 0.99%. Continue expanding electronic services offering to support deposit growth
strategy including electronic banking and mobile banking enhancements
Reduced reliance on brokered deposits
35% of deposits are brokered, a decrease of $156 million or 4% compared to Q1 2012
9
($ in millions)
Deposits, Net of Brokered CDs
Total Deposit Composition
Second Quarter Highlights:
DEPOSIT MIX $-
$6,500
Q2 2011
Q3 2011
Q4 2011
Q1 2012
Q2 2012
2,476
2,584
2,654
2,782
2,826
772
866
915
963
959
2,137
2,195
2,126
2,055
2,066
481
520
481
487
584
$5,866
$6,164
$6,176
$6,286
$6,434
Retail
Commercial
CDs & IRAs
Public Funds
Interest
Bearing
57%
Non-interest
Bearing
8%
Brokered CDs
35% |
 SECOND QUARTER
2012 Results of Operations |
 Interest
income 153,652
$
152,107
$
1,545
$
Interest expense
44,947
50,241
(5,294)
Net interest income
108,705
101,866
6,839
Provision for loan and lease losses
24,884
36,197
(11,313)
Non-interest income
16,513
14,711
1,802
Equity in losses of unconsolidated entities
(2,491)
(6,236)
3,745
Total non-interest income
14,022
8,475
5,547
Personnel expense
31,101
31,611
(509)
Occupancy and equipment expense
15,181
15,676
(495)
Insurance and supervisory fees
13,302
13,008
294
REO expense
6,786
3,443
3,343
Other operating expenses
20,572
21,455
(839)
Pre-tax income (loss)
10,901
(11,049)
17,139
Income tax expense
1,545
2,133
(588)
Net income (loss)
9,356
$
(13,182)
$
22,537
$
Adjusted Pre-tax, pre-provision income
37,913
$
34,797
$
3,116
$
Fully diluted EPS
0.05
$
(0.06)
$
0.11
$
Book value per share
6.72
$
6.65
$
0.07
$
Tangible book value per share
6.42
$
6.46
$
(0.04)
$
Common stock price
3.96
$
4.40
$
(0.44)
$
Net Interest Margin (GAAP)
3.46%
3.20%
0.26%
Efficiency ratio
70.7%
77.2%
(6.5%)
11
($ in thousands, except per share data)
Select Financial Information
Q2 2012
Q1 2012
Variance
Results of Operations: SECOND QUARTER
2012 FINANCIAL HIGHLIGHTS
|
 12
Net interest income
growth of 7% and 15%
when compared to Q1
2012 and Q2 2011,
respectively.
Revenue growth due to:
Growth in higher yield
consumer loan
segment including
$406 million credit card
portfolio acquisition in
May 2012;
Growth in core
deposits of $148
million; and
Reduction in cost of
funds.
* Non interest income is net of debentures
Results of Operations:
REVENUE GROWTH & MARGIN EXPANSION |
 13
The average rate paid on non-brokered
deposits, including interest-bearing
checking accounts, savings and retail
CDs, declined by 12 basis points to
1.13% during the second quarter while
the average volume increased by $114.0
million.
Cost of total deposits net of brokered
also decreased to 0.99% from 1.11% in
Q1 2012
Cost of other borrowed funds declined 20 basis points due to:
The
maturity
of
a
$100
million
repurchase
agreement
that
carried
a
cost
of
4.38%;
The
maturity
of
a
$40
million
public
fund
CD
that
carried
a
cost
of
4.66%;
The prepayment of a $15.4 million medium-term note that carried a cost of 6%; and
Growth in core deposits
Further reductions in interest expense and the average cost of funds could be realized during
2012, as maturing brokered CDs and advances are renewed at lower current rates.
$2.2 billion of brokered CDs at an average cost of 2.04% mature in the next twelve
months. (Renewals at current rates range between 75 and 125 basis points).
Cost of Deposits
1.54%
1.48%
1.39%
1.25%
1.13%
1.35%
1.32%
1.23%
1.11%
0.99%
0.00%
2.00%
2Q 2011
3Q 2011
4Q 2011
1Q 2012
2Q 2012
Interest Bearing Deposits, Net of Brokered CDs
Total Deposits, Net of Brokered CDs
Results of Operations: COST OF
FUNDS
|
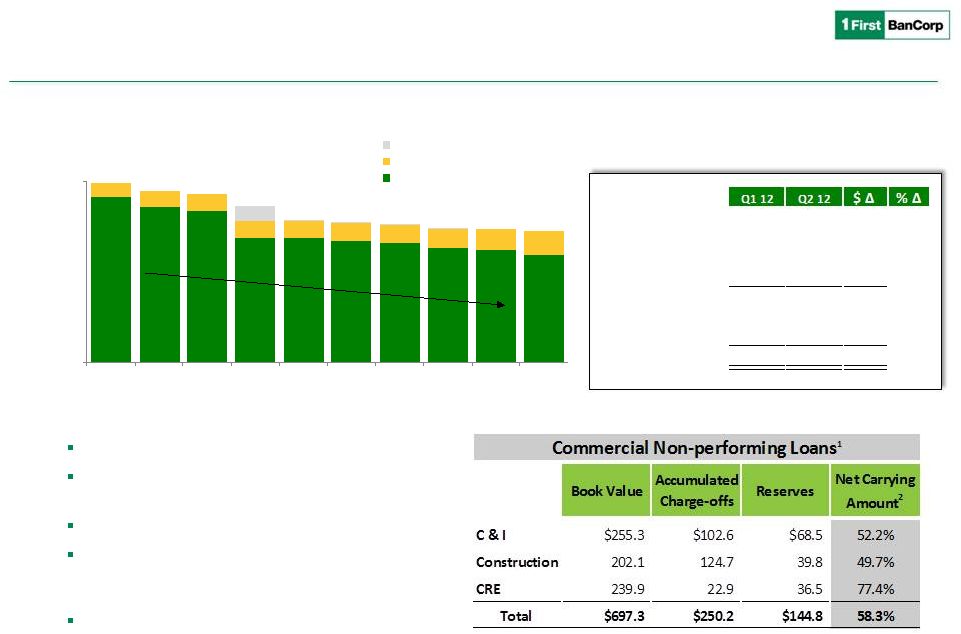  1,639
1,066
$1,790
$1,701
$1,669
$1,562
$1,410
$1,390
$1,377
$1,337
$1,332
$1,308
$-
$1,800
Q1 10
Q2 10
Q3 10
Q4 10
Q1 11
Q2 11
Q3 11
Q4 11
Q1 12
Q2 12
Loans Held for Sale
Repossessed Assets & Other
Non-performing Loans
Reduced NPLs by 35% since peak in 1Q 2010
Reduced exposure to construction loans by 70%
since peak, a major driver of losses
Stabilized migration to NPL
OREO increased $30MM mainly due to foreclosed
commercial properties as a result of Special Asset
Group’s workout / legal strategies
Commercial NPLs are being carried at 58% of
unpaid principal balance, net of specific reserves
($ in millions)
1 As of June 30, 2012
2 Net Carrying Amount = % of unpaid principal balance net of reserves and accumulated
charge-offs Non-performing Assets
Residential
341
$
333
$
(8)
$
(2%)
Consumer
39
35
(4)
(10%)
C&I and CRE
508
495
(13)
(3%)
Construction
231
202
(29)
(13%)
NPLs
1,119
1,066
(54)
(5%)
Repossessed Assets
148
178
30
20%
Other
65
65
-
0%
NPAs
1,332
$
1,308
$
(24)
$
(2%)
14
Results of Operations: ASSET QUALITY
|
 15
($ in millions)
Total net charge-offs for 2Q 2012 were $51.7 million
or 2.03% of average loans on an annualized basis, a
$5.5 million increase compared to 1Q 2012:
–
CRE loans net charge-offs were $6.3 million, up
from $3.6 million, the increase related to
foreclosures.
–
C&I loans net charge-offs were $8.4 million, or an
annualized 0.9% of related average loans, down
from $12.7 million
–
Residential Mortgages: $14.2 million, or an
annualized 2.0% of related average loans, up from
$5.7 million, due to a higher level of properties
subject to updated appraisals.
Net Charge-offs
Allowance coverage ratio of 4.4%
$80
The increase in charge-offs for the quarter did not
represent a need for additional provision since 67%
of the commercial and construction charge-offs
recorded in the quarter were against previously
established reserves.
ALLL & Coverage Ratios
* Annualized
$
$90
2Q 2011
3Q 2011
4Q 2011
1Q 2012
2Q 2012
9
16
9
6
14
10
9
8
9
8
11
23
17
13
8
3
3
14
4
6
47
17
19
15
15
Construction
Commercial Real Estate
Commercial and Industrial
Consumer
Residential
$541
$520
$494
$484
$457
5.02%
4.89%
4.68%
4.70%
4.44%
2.91%
2.50%
2.55%
1.78%
2.03%
0.0%
2.0%
4.0%
6.0%
$-
$200
$400
$600
2Q 2011
3Q 2011
4Q 2011
1Q 2012
2Q 2012
ALLL
ALLL to Loans
NCOs to Average Loans *
$80
$68
$68
$46
$52
Net Charge-offs |
 16
Results
of
Operations:
CAPITAL
POSITION
The
Corporation’s
total
stockholders’
equity
amounted
to
$1.45
billion
as
of
June
30,
2012,
an
increase
of
$15.9
million from March 31, 2012, driven by internal capital generation including the net income of
$9.4 million The capital levels continue to be strong as First BanCorp executes on its
strategic plan. Capital Ratios
12.4%
17.4%
17.3%
11.1%
16.0%
16.0%
8.0%
12.3%
12.5%
4.9%
13.1%
13.1%
3.8%
10.2%
10.3%
0.0%
5.0%
10.0%
15.0%
20.0%
Q2 11
Q3 11
Q4 11
Q1 12
Q2 12
Total Capital
Tier 1
Leverage
Tier 1 Common
Tangible Common |
 SECOND QUARTER
2012 Summary |
 18
Summary
Strong capital position:
–
Total capital, Tier 1 capital and Leverage ratios of the Corporation of 17.3%, 16.0% and
12.5%, respectively.
Provision for loan and lease losses of $25 million, down $11 million.
Stable asset quality:
–
Non-performing
assets
-
decreased
by
$24
million.
–
Non-performing
loans
-
decreased
by
$54
million.
Net income of $9.4 million is the first quarterly profit since 2009 first quarter.
Growth in Net Interest Income and Margin:
–
Net
interest
income,
excluding
fair value
adjustments,
increased
by
$6.6
million.
–
Net
interest
margin,
excluding
fair
value
adjustments,
increased
by
24
basis
points
to
3.44%.
Re-entered the credit card business with the acquisition of an approximate $406 million
portfolio of First Bank-branded credit card accounts from FIA Card Services
(FIA). Strong
loan
originations
amounted
to
$838
million
for
the
second
quarter,
excluding
the
purchase
of
the
credit card portfolio.
Growth of $148 million in deposits, net of brokered CDs, while brokered CDs decreased by $156
million. |
 SECOND QUARTER
2012 Q&A |
 EXHIBITS
|
 Average loans
& leases: Residential mortgage loans
(6,359)
(0.26%)
(1,918)
Construction loans
(33,156)
0.10%
(103)
C&I and commercial mortgage loans
(295,723)
0.05%
(2,322)
Consumer loans
132,622
0.67%
6,247
Total average loans
(206,017)
0.18%
1,818
Average total interest-earning assets
(153,737)
0.12%
1,803
Interest-bearing liabilities:
Brokered CDs
(163,139)
(0.12%)
1,930
Other interest-bearing deposits
114,031
(0.12%)
1,315
Other borrowed funds
(79,747)
(0.20%)
1,248
Average total interest-bearing liabilities
(148,108)
(0.15%)
4,706
Increase in net interest income *
6,509
$
21
Q1 vs. Q2 Change in Average Interest Earning Assets & Interest Bearing Liabilities
* On a tax equivalent basis and excluding valuations
$
in
%
in
Average
Average
Volume
Rate
Net Interest
Income
Changes
Results
of
Operations:
SECOND
QUARTER
KEY
MARGIN
DRIVERS |
 June 30,
March 31,
December 31,
September 30,
June 30,
2012
2012
2011
2011
2011
Tangible Common Equity
(In thousands, except ratios and per share information)
Total equity -
GAAP
$ 1,448,959
$ 1,433,023
$ 1,444,144
$ 986,847
$ 1,009,578
Preferred equity
(63,047)
(63,047)
(63,047)
(430,498)
(428,703)
Goodwill
(28,098)
(28,098)
(28,098)
(28,098)
(28,098)
Purchased credit card relationship
(24,342)
-
-
-
-
Core deposit intangible
(10,512)
(11,100)
(11,689)
(12,277)
(12,866)
Tangible common equity
$ 1,322,960
$ 1,330,778
$ 1,341,310
$ 515,974
$
539,911 Total assets -
GAAP
$ 12,913,650
$ 13,085,623
$ 13,127,275
$ 13,475,572
$ 14,113,973
Goodwill
(28,098)
(28,098)
(28,098)
(28,098)
(28,098)
Purchased credit card relationship
(24,342)
-
-
-
-
Core deposit intangible
(10,512)
(11,100)
(11,689)
(12,277)
(12,866)
Tangible assets
$ 12,850,698
$ 13,046,425
$ 13,087,488
$ 13,435,197
$ 14,073,009
Common shares outstanding
206,134
206,134
205,134
21,304
21,304
Tangible common equity ratio
10.29%
10.20%
10.25%
3.84%
3.84%
Tangible book value per common share
6.42
$
6.46
$
6.54
$
24.22
$
25.34
$
Tangible Equity:
Tangible Assets:
22
Use of Non-GAAP Financial Measures
Basis of Presentation
Use of Non-GAAP Financial Measures
This presentation may contain non-GAAP financial measures. Non-GAAP
financial measures are set forth when management believes they will be helpful to an
understanding of the Corporation’s results of operations or financial
position. Where non-GAAP financial measures are used, the comparable GAAP financial
measure, as well as the reconciliation to the comparable GAAP financial measure,
can be found in the text or in the attached tables to the earnings release.
Tangible Common Equity Ratio and Tangible Book Value per Common Share
The tangible common equity ratio and tangible book value per common share are
non-GAAP measures generally used by the financial community to evaluate capital
adequacy. Tangible common equity is total equity less preferred equity, goodwill,
core deposit intangibles and purchased credit card relationship intangible. Tangible
assets are total assets less goodwill, core deposit intangibles and purchased
credit card relationship intangible. Management and many stock analysts use the tangible
common
equity
ratio
and
tangible
book
value
per
common
share
in
conjunction
with
more
traditional
bank
capital
ratios
to
compare
the
capital
adequacy
of
banking
organizations with significant amounts of goodwill or other intangible assets,
typically stemming from the use of the purchase method of accounting for mergers and
acquisitions.
Neither
tangible
common
equity
nor
tangible
assets,
or
the
related
measures
should
be
considered
in
isolation
or
as
a
substitute
for
stockholders’
equity,
total assets or any other measure calculated in accordance with GAAP. Moreover, the
manner in which the Corporation calculates its tangible common equity,
tangible assets and any other related measures may differ from that of other
companies reporting measures with similar names. |
  23
Use of Non-GAAP Financial Measures
Basis of Presentation
Use of Non-GAAP Financial Measures
This presentation may contain non-GAAP financial measures. Non-GAAP
financial measures are set forth when management believes they will be helpful to an
understanding of the Corporation’s results of operations or financial
position. Where non-GAAP financial measures are used, the comparable GAAP financial
measure, as well as the reconciliation to the comparable GAAP financial measure,
can be found in the text or in the attached tables to the earnings release.
Tier 1 Common Equity to Risk-Weighted Assets Ratio
The Tier 1 common equity to risk-weighted assets ratio is calculated by
dividing (a) tier 1 capital less non-common elements including qualifying perpetual
preferred
stock
and
qualifying
trust
preferred
securities
by
(b)
risk-weighted
assets,
which
assets
are
calculated
in
accordance
with
applicable
bank
regulatory
requirements. The Tier 1 common equity ratio is not required by GAAP or on a
recurring basis by applicable bank regulatory requirements. However, this ratio will
be required under Basel III capital standards as proposed. Management is
currently monitoring this ratio, along with the other ratios discussed above, in evaluating
the Corporation’s capital levels and believes that, at this time, the ratio
may be of interest to investors. Tier 1 Common Equity to Risk-Weighted Assets
(Dollars in thousands)
June 30,
March 31,
December 31,
September 30,
June 30,
2012
2012
2011
2011
2011
Total
equity
-
GAAP
1,448,959
$
1,433,023
$
1,444,144
$
$ 986,847
$ 1,009,578
Qualifying preferred stock
(63,047)
(63,047)
(63,047)
(430,498)
(428,703)
Unrealized gain on available-for-sale securities
(1)
(26,623)
(20,233)
(19,234)
(13,957)
(12,659)
Disallowed deferred tax asset
(2)
(41)
(25)
-
(267)
(272)
Goodwill
(28,098)
(28,098)
(28,098)
(28,098)
(28,098)
Core deposit intangible
(10,512)
(11,100)
(11,689)
(12,277)
(12,866)
Cumulative change gain in fair value of liabilities
accounted for under a fair value option
-
(2,434)
(2,009)
(952)
(1,889)
Other disallowed assets
(2,917)
(807)
(922)
(907)
(808)
Tier 1 common equity
$ 1,317,721
$ 1,307,279
$ 1,319,145
$ 499,890
$
524,283 Total risk-weighted assets
$ 10,046,284
$ 9,947,559
$ 10,180,226
$ 10,432,804
$ 10,630,162
Tier 1 common equity to risk-weighted assets ratio
13.12%
13.14%
12.96%
4.79%
4.93%
As of
Tier 1 Common Equity:
1- Tier 1 capital excludes net unrealized gains (losses) on
available-for-sale debt securities and net unrealized gains on available-for-sale
equity securities with readily determinable fair values, in accordance
with regulatory risk-based capital guidelines. In arriving at
Tier 1 capital, institutions are required to deduct net unrealized
losses on available-for-sale equity securities with readily determinable
fair values, net of tax.
2- Approximately $12 million of the Corporation's deferred
tax assets at June 30, 2012 (March 31, 2012 - $12 million; December 31, 2011 - $13 million;
September 30, 2011 - $12 million; June 30, 2011 - $11 million)
was included without limitation in regulatory capital pursuant to the risk-based capital guidelines,
while approximately $41k of such assets at June 30, 2012 (March 31,
2012 - $25k; December 31, 2011 - $0; September 30, 2011 - $0.3 million;
June 30, 2011 - $0.3 million) exceeded the limitation imposed by
these guidelines and, as "disallowed deferred tax assets," was deducted in arriving at Tier 1 capital.
According to regulatory capital guidelines, the deferred tax assets
that are dependent upon future taxable income are limited for
inclusion in Tier 1 capital to the lesser of: (i) the amount of such
deferred tax asset that the entity expects to realize within one year of
the calendar quarter end-date, based on its projected future
taxable income for that year, or (ii) 10% of the amount of the entity's
Tier 1 capital. Approximately $7 million of the Corporation's
other net deferred tax liability at June 30, 2012 (March 31, 2012 - $7 million;
December 31, 2011 - $8 million; September 30, 2011 - $7
million; June 30, 2011 - $5 million) represented primarily the deferred tax effects of unrealized gains and losses on
available-for-sale debt securities, which are permitted to be
excluded prior to deriving the amount of net deferred tax assets subject to limitation under the guidelines. |
 24
Use of Non-GAAP Financial Measures
Basis of Presentation
Use of Non-GAAP Financial Measures
This presentation may contain non-GAAP financial measures. Non-GAAP
financial measures are set forth when management believes they will be helpful to an
understanding of the Corporation’s results of operations or financial
position. Where non-GAAP financial measures are used, the comparable GAAP financial
measure, as well as the reconciliation to the comparable GAAP financial measure,
can be found in the text or in the attached tables to the earnings release.
Adjusted Pre-Tax, Pre-Provision Income
One non-GAAP performance metric that management believes is useful in analyzing
underlying performance trends, particularly in times of economic stress, is
adjusted pre-tax, pre-provision income. Adjusted pre-tax,
pre-provision income, as defined by management, represents net (loss) income excluding income tax
expense (benefit), the provision for loan and lease losses, gains on sale and OTTI
of investment securities, fair value adjustments on derivatives and liabilities
measured at fair value, equity in earnings or losses of unconsolidated entities as
well as certain items identified as unusual, non-recurring or non-operating.
From time to time, revenue and expenses are impacted by items judged by management
to be outside of ordinary banking activities and/or by items that, while they
may be associated with ordinary banking activities, are so unusually large that
management believes that a complete analysis of its Corporation’s performance
requires consideration also of results that exclude such amounts. These items
result from factors originating outside the Corporation such as regulatory
actions/assessments, and may result from unusual management decisions, such as the
early extinguishment of debt. Pre-Tax, Pre-Provision Income
(Dollars in thousands)
June 30,
March 31,
December 31,
September 30,
June 30,
2012
2012
2011
2011
2011
Income (loss) before income taxes
$
(11,049)
$
(14,600) $ (21,158)
$ (12,318)
Add: Provision for loan and lease losses
36,197
41,987
46,446
59,184
Less: Net loss (gain) on sale and OTTI of investment securities
1,207
1,014
(12,156)
(21,342)
Add: Unrealized (gain) loss on derivatives instruments and
liabilities measured at fair value
(283)
1,746
2,555
1,162
Add:
Contingency
adjustment
-
tax
credits
2,489
-
-
-
Add: Loss on early extinguishment of borrowings
-
-
9,012
1,823
Add: Equity in losses (earnings) of unconsolidated entities
6,236
(1,666)
4,357
1,536
Adjusted Pre-tax, pre-provision income (1)
$
34,797
$
28,482
$ 29,056
$ 30,045
Change
from
most
recent
prior
quarter
-
amount
3,116
$
6,315
$
(574)
$
(989)
$
(11,920)
$
Change
from
most
recent
prior
quarter
-
percent
9.0%
22.2%
-2.0%
-3.3%
-28.4%
Quarter Ended
$
10,901 24,884
143
(506)
2,491
$
37,913 |