Attached files
| file | filename |
|---|---|
| 8-K - 8-K - CARDINAL FINANCIAL CORP | a12-17257_18k.htm |
Exhibit 99.1
|
|
KBW Investor Conference August 1, 2012 |

|
|
Statements contained in this presentation which are not historical facts are forward-looking statements as that item is defined in the Private Securities Litigation Reform Act of 1995. Such forward-looking statements are subject to risks and uncertainties, which could cause actual results to differ materially from estimated results. For an explanation of the risks and uncertainties associated with forward-looking statements, please refer to the Company’s Annual Report on Form 10-K for the year ended December 31, 2011 and other reports filed and furnished to the Securities and Exchange Commission. Forward Looking Statements | 2 |
|
|
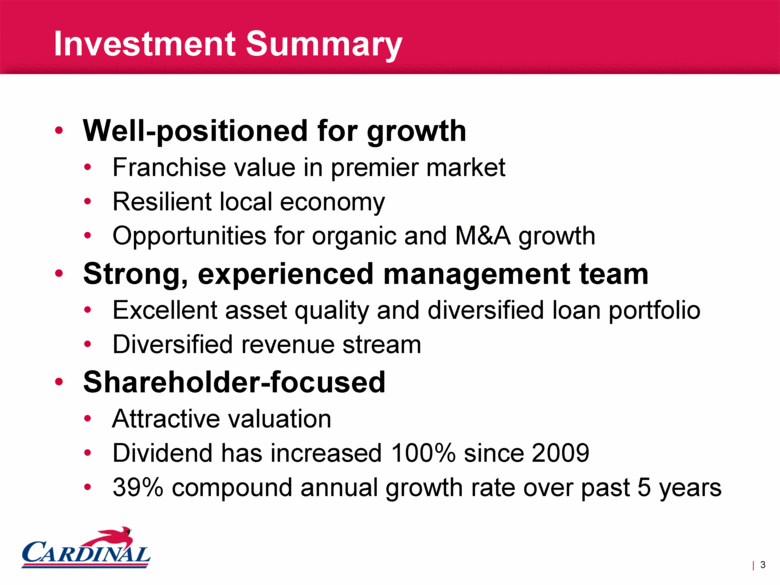
Investment Summary Well-positioned for growth Franchise value in premier market Resilient local economy Opportunities for organic and M&A growth Strong, experienced management team Excellent asset quality and diversified loan portfolio Diversified revenue stream Shareholder-focused Attractive valuation Dividend has increased 100% since 2009 39% compound annual growth rate over past 5 years | 3 |
|
|
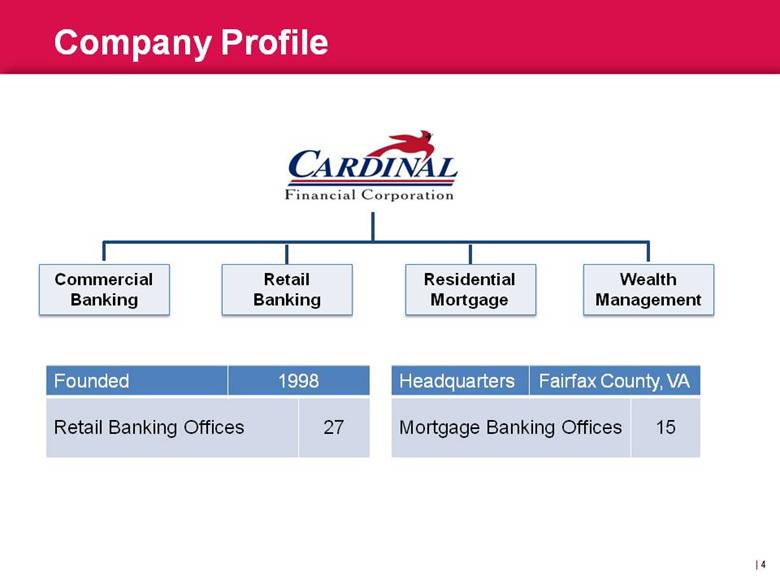
Company Profile | 4 Founded 1998 Headquarters Fairfax County, VA Retail Banking Offices 27 Mortgage Banking Offices 15 Commercial Banking Retail Banking Residential Mortgage Wealth Management |
|
|
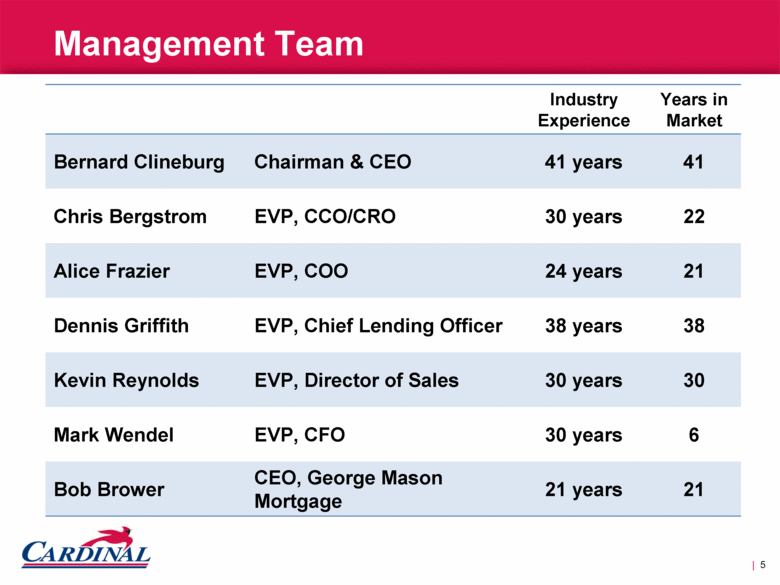
Management Team Industry Experience Years in Market Bernard Clineburg Chairman & CEO 41 years 41 Chris Bergstrom EVP, CCO/CRO 30 years 22 Alice Frazier EVP, COO 24 years 21 Dennis Griffith EVP, Chief Lending Officer 38 years 38 Kevin Reynolds EVP, Director of Sales 30 years 30 Mark Wendel EVP, CFO 30 years 6 Bob Brower CEO, George Mason Mortgage 21 years 21 | 5 |
|
|
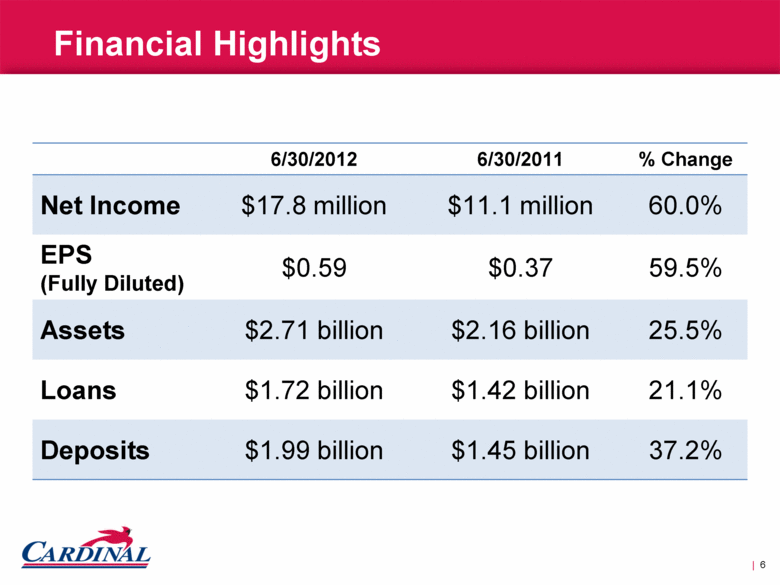
Financial Highlights 6/30/2012 6/30/2011 % Change Net Income $17.8 million $11.1 million 60.0% EPS (Fully Diluted) $0.59 $0.37 59.5% Assets $2.71 billion $2.16 billion 25.5% Loans $1.72 billion $1.42 billion 21.1% Deposits $1.99 billion $1.45 billion 37.2% | 6 |
|
|
Aggressive on Sales, CONSERVATIVE ON RISK | 7 Our Operating Philosophy |
|
|
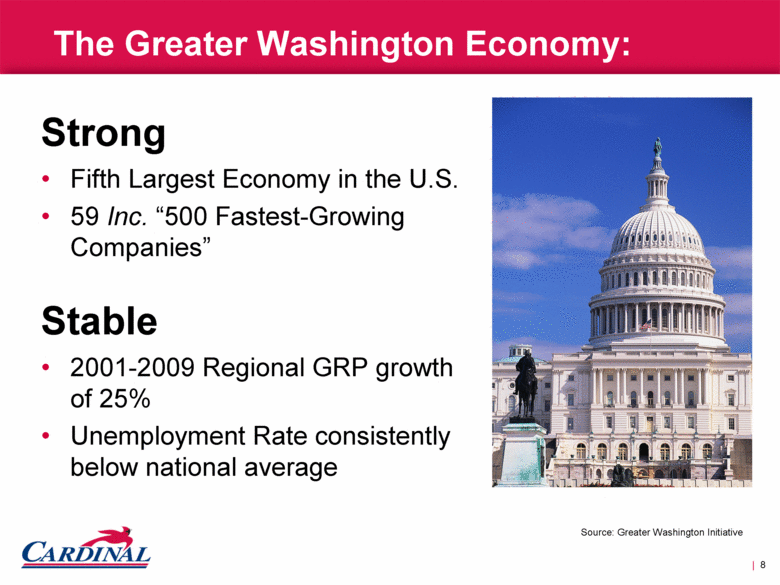
Strong Fifth Largest Economy in the U.S. 59 Inc. “500 Fastest-Growing Companies” Stable 2001-2009 Regional GRP growth of 25% Unemployment Rate consistently below national average The Greater Washington Economy: | 8 Source: Greater Washington Initiative |
|
|
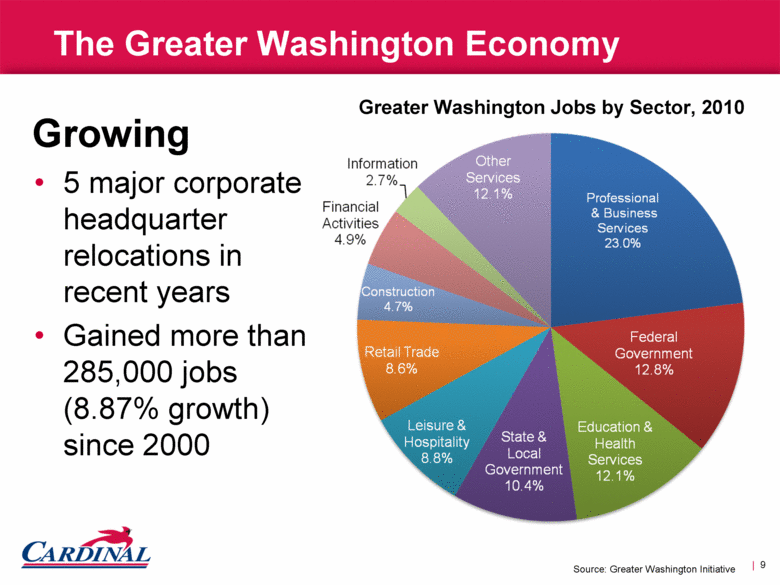
The Greater Washington Economy | 9 Growing 5 major corporate headquarter relocations in recent years Gained more than 285,000 jobs (8.87% growth) since 2000 Greater Washington Jobs by Sector, 2010 Source: Greater Washington Initiative |
|
|
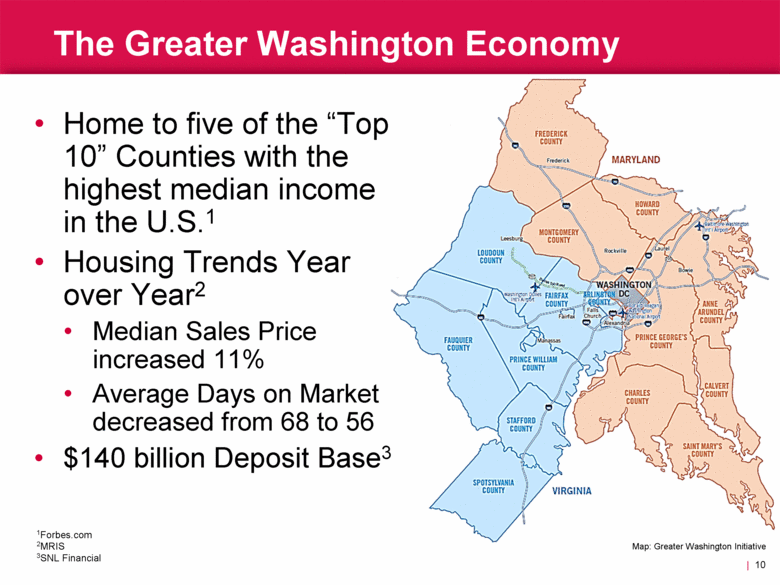
The Greater Washington Economy | 10 1Forbes.com 2MRIS 3SNL Financial Map: Greater Washington Initiative Home to five of the “Top 10” Counties with the highest median income in the U.S.1 Housing Trends Year over Year2 Median Sales Price increased 11% Average Days on Market decreased from 68 to 56 $140 billion Deposit Base3 |
|
|
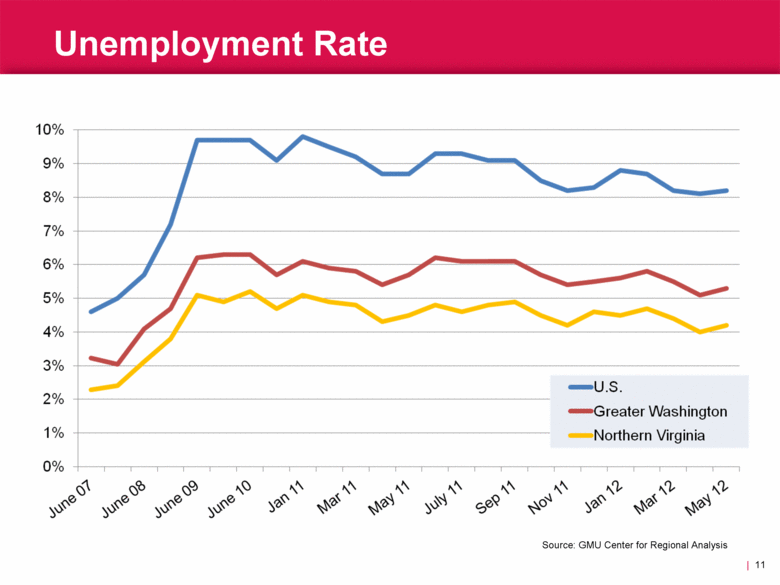
Unemployment Rate Source: GMU Center for Regional Analysis | 11 |
|
|
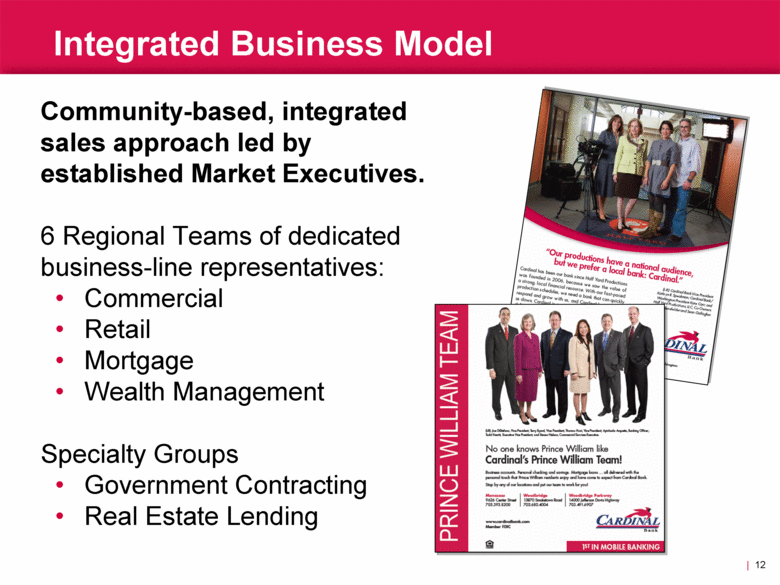
Integrated Business Model | 12 Community-based, integrated sales approach led by established Market Executives. 6 Regional Teams of dedicated business-line representatives: Commercial Retail Mortgage Wealth Management Specialty Groups Government Contracting Real Estate Lending |
|
|
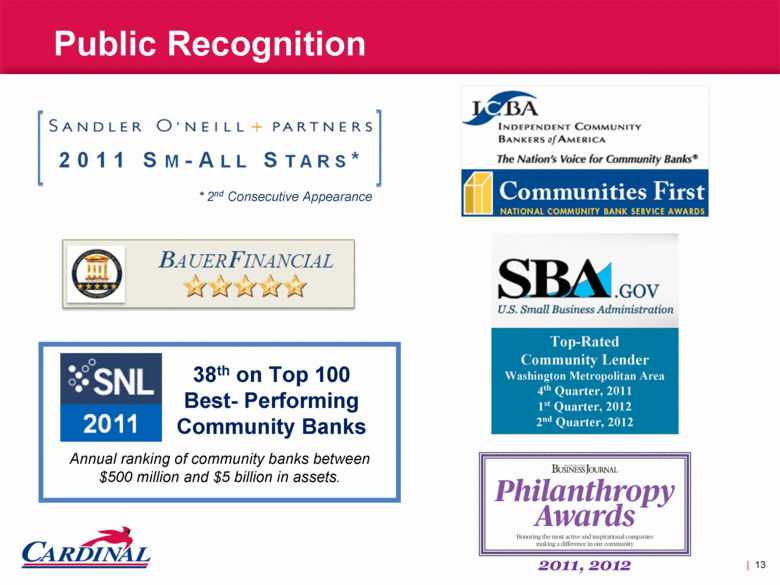
Public Recognition | 13 * 2nd Consecutive Appearance 2011, 2012 Top-Rated Community Lender Washington Metropolitan Area 4th Quarter, 2011 1st Quarter, 2012 2nd Quarter, 2012 |
|
|
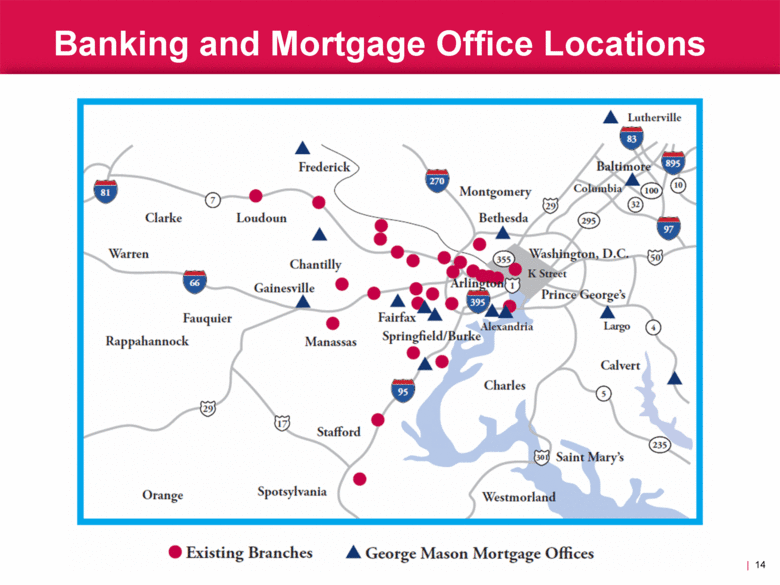
Banking and Mortgage Office Locations | 14 |
|
|
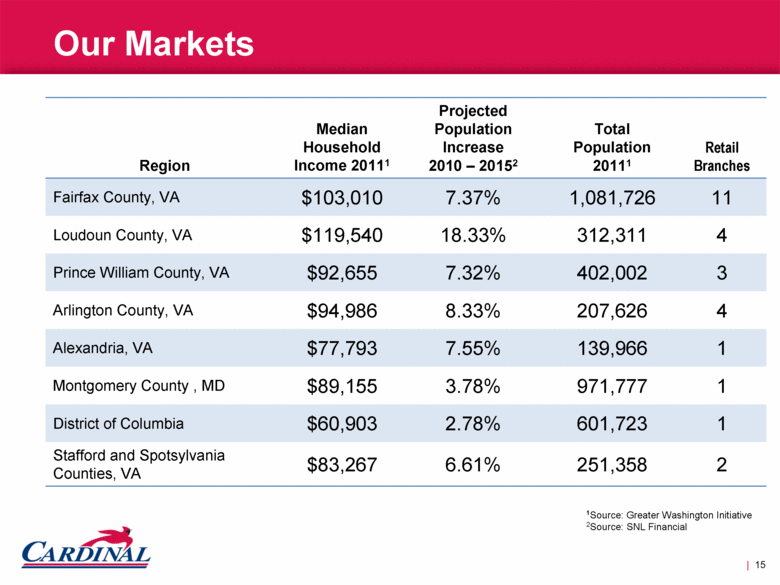
Our Markets Region Median Household Income 20111 Projected Population Increase 2010 – 20152 Total Population 20111 Retail Branches Fairfax County, VA $103,010 7.37% 1,081,726 11 Loudoun County, VA $119,540 18.33% 312,311 4 Prince William County, VA $92,655 7.32% 402,002 3 Arlington County, VA $94,986 8.33% 207,626 4 Alexandria, VA $77,793 7.55% 139,966 1 Montgomery County , MD $89,155 3.78% 971,777 1 District of Columbia $60,903 2.78% 601,723 1 Stafford and Spotsylvania Counties, VA $83,267 6.61% 251,358 2 1Source: Greater Washington Initiative 2Source: SNL Financial | 15 |
|
|
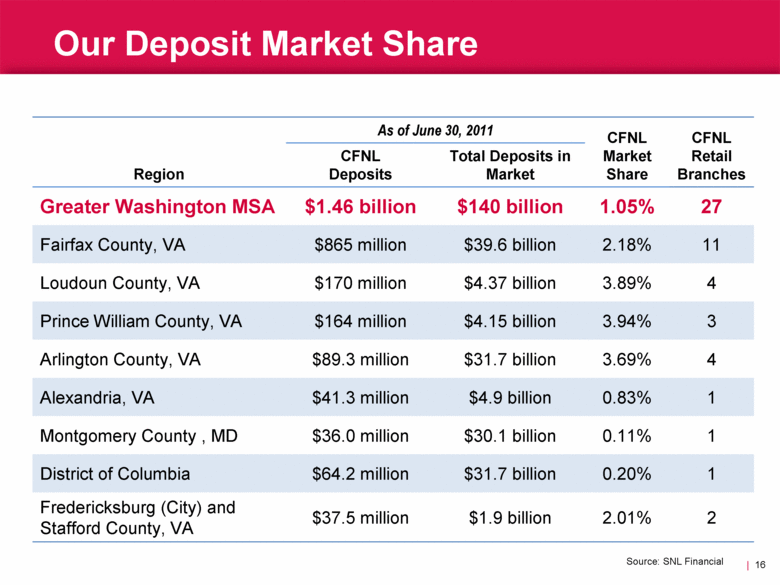
Our Deposit Market Share | 16 Region As of June 30, 2011 CFNL Market Share CFNL Retail Branches CFNL Deposits Total Deposits in Market Greater Washington MSA $1.46 billion $140 billion 1.05% 27 Fairfax County, VA $865 million $39.6 billion 2.18% 11 Loudoun County, VA $170 million $4.37 billion 3.89% 4 Prince William County, VA $164 million $4.15 billion 3.94% 3 Arlington County, VA $89.3 million $31.7 billion 3.69% 4 Alexandria, VA $41.3 million $4.9 billion 0.83% 1 Montgomery County , MD $36.0 million $30.1 billion 0.11% 1 District of Columbia $64.2 million $31.7 billion 0.20% 1 Fredericksburg (City) and Stafford County, VA $37.5 million $1.9 billion 2.01% 2 Source: SNL Financial |
|
|
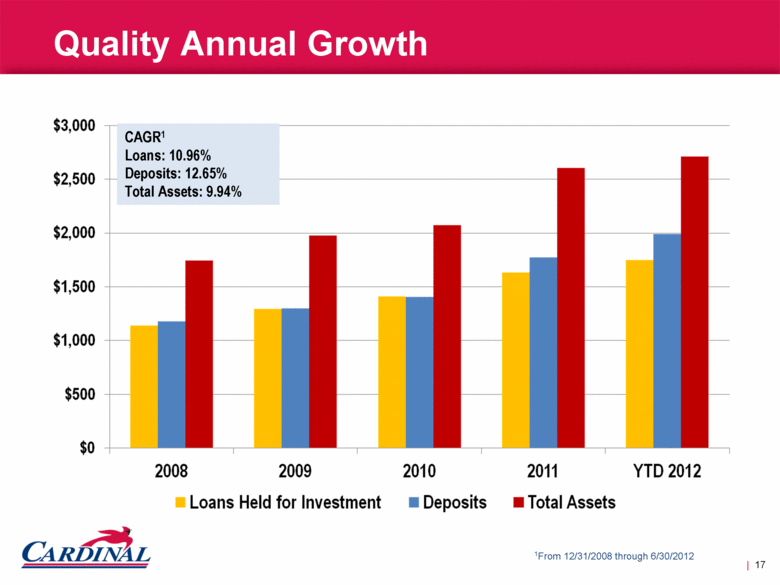
Quality Annual Growth 1From 12/31/2008 through 6/30/2012 | 17 CAGR1 Loans: 10.96% Deposits: 12.65% Total Assets: 9.94% |
|
|
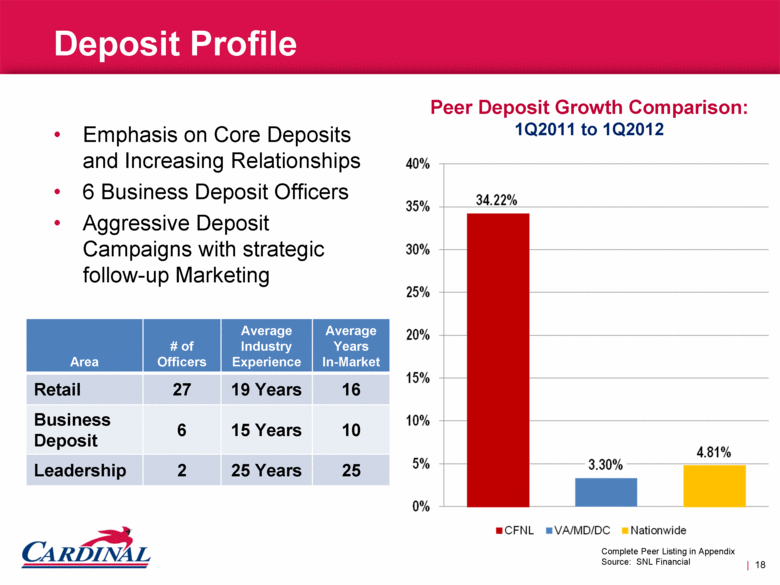
Deposit Profile Emphasis on Core Deposits and Increasing Relationships 6 Business Deposit Officers Aggressive Deposit Campaigns with strategic follow-up Marketing Peer Deposit Growth Comparison: 1Q2011 to 1Q2012 Complete Peer Listing in Appendix Source: SNL Financial | 18 Area # of Officers Average Industry Experience Average Years In-Market Retail 27 19 Years 16 Business Deposit 6 15 Years 10 Leadership 2 25 Years 25 |
|
|
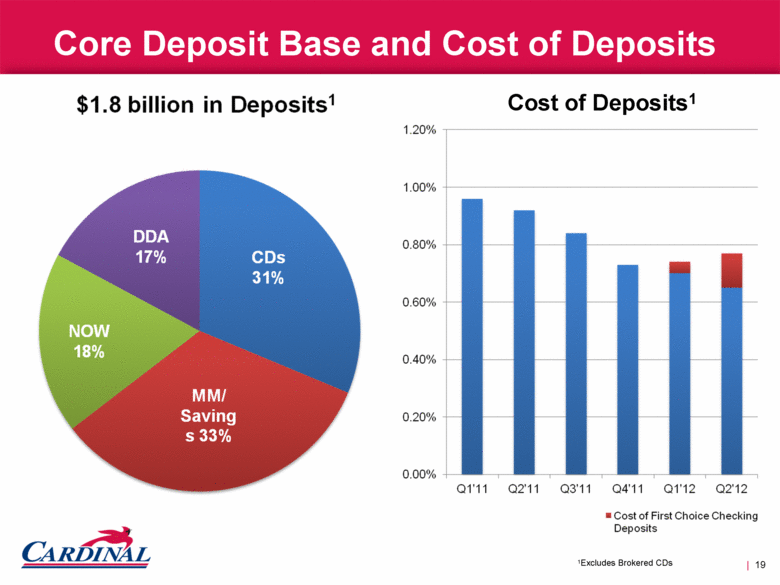
Core Deposit Base and Cost of Deposits $1.8 billion in Deposits1 Cost of Deposits1 | 19 1Excludes Brokered CDs |
|
|
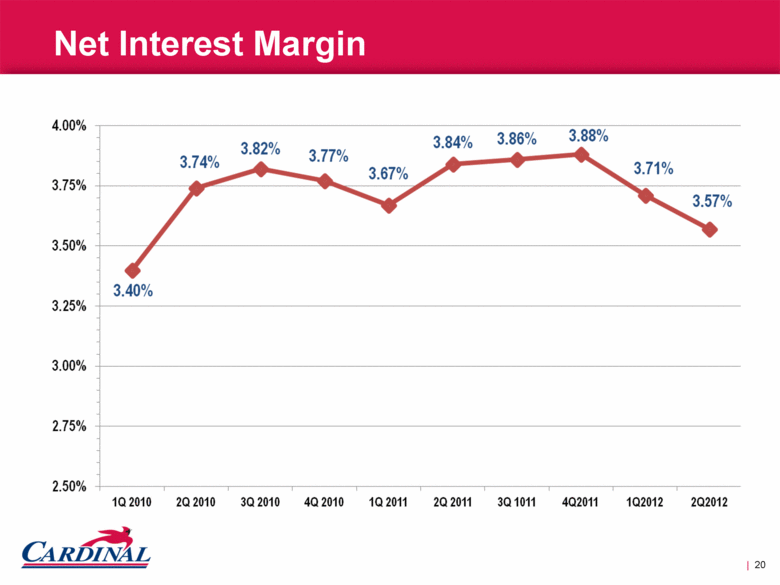
Net Interest Margin | 20 |
|
|
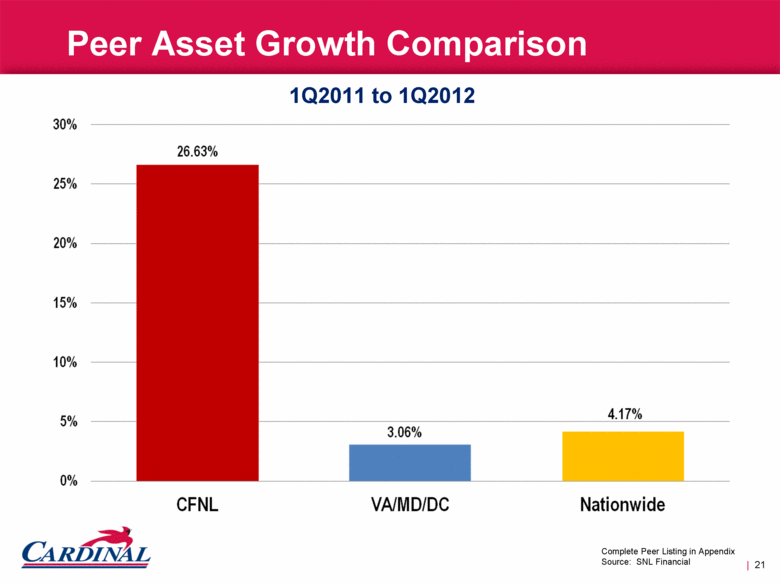
Peer Asset Growth Comparison Source: SNL Financial Complete Listing of Peer Group Used in Appendix 1Q2011 to 1Q2012 | 21 Complete Peer Listing in Appendix Source: SNL Financial |
|
|
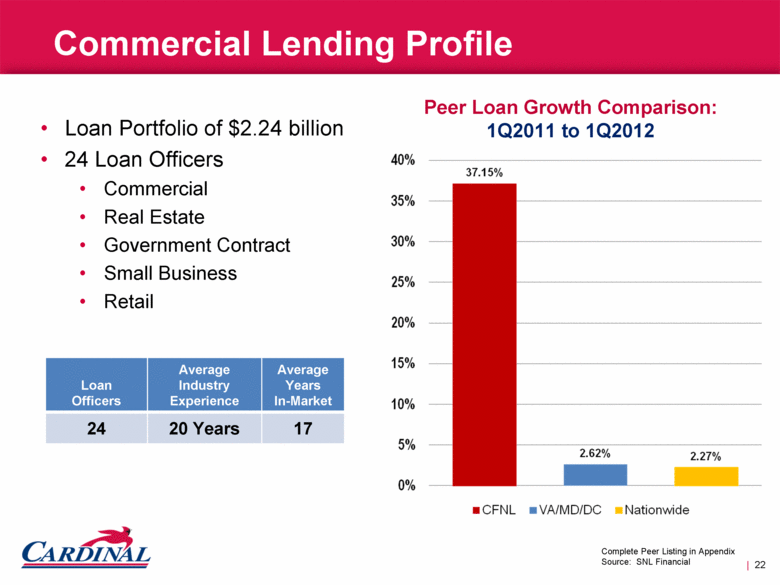
Loan Portfolio of $2.24 billion 24 Loan Officers Commercial Real Estate Government Contract Small Business Retail Commercial Lending Profile Peer Loan Growth Comparison: 1Q2011 to 1Q2012 Complete Peer Listing in Appendix Source: SNL Financial | 22 Loan Officers Average Industry Experience Average Years In-Market 24 20 Years 17 |
|
|
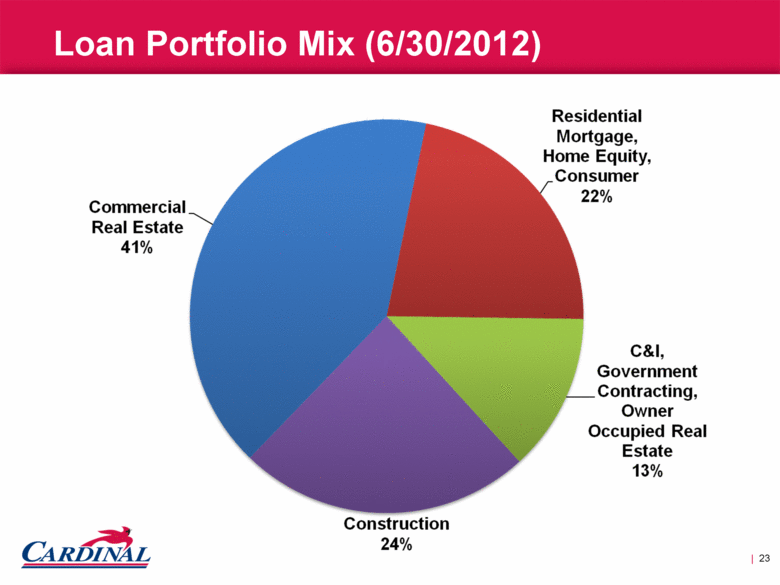
Loan Portfolio Mix (6/30/2012) | 23 |
|
|
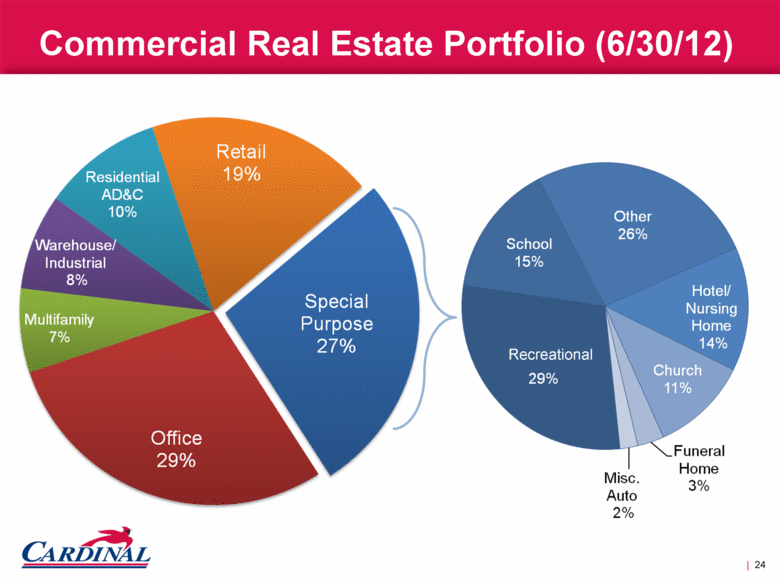
Commercial Real Estate Portfolio (6/30/12) Recreational | 24 |
|
|
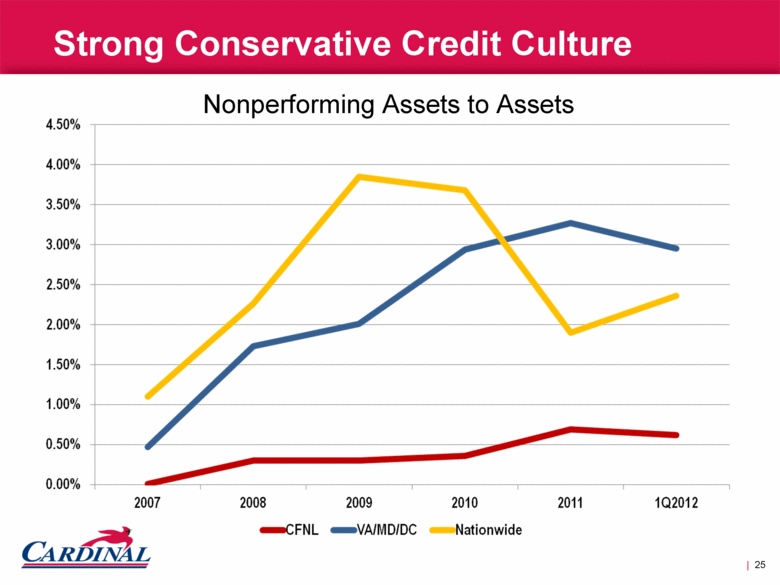
Strong Conservative Credit Culture Source: SNL Financial Complete Listing of Peer Group Used in Appendix Nonperforming Assets to Assets | 25 |
|
|
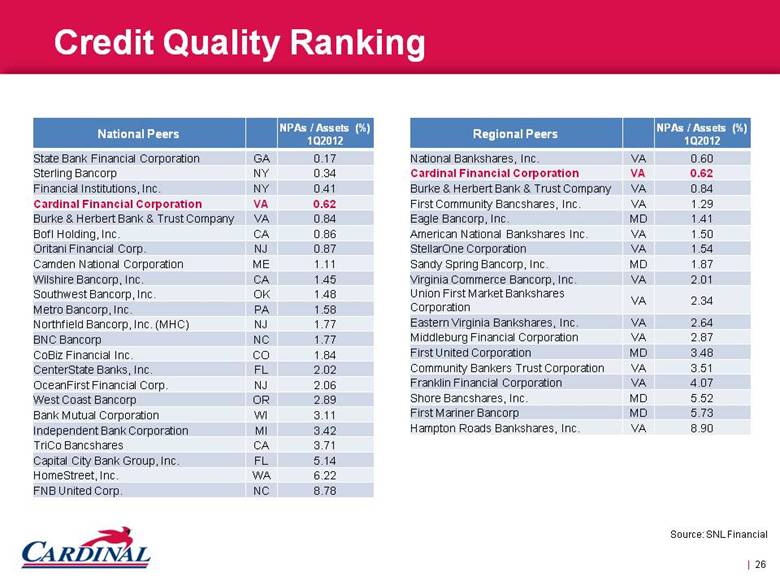
Credit Quality Ranking National Peers NPAs / Assets (%) 1Q2012 State Bank Financial Corporation GA 0.17 Sterling Bancorp NY 0.34 Financial Institutions, Inc. NY 0.41 Cardinal Financial Corporation VA 0.62 Burke & Herbert Bank & Trust Company VA 0.84 BofI Holding, Inc. CA 0.86 Oritani Financial Corp. NJ 0.87 Camden National Corporation ME 1.11 Wilshire Bancorp, Inc. CA 1.45 Southwest Bancorp, Inc. OK 1.48 Metro Bancorp, Inc. PA 1.58 Northfield Bancorp, Inc. (MHC) NJ 1.77 BNC Bancorp NC 1.77 CoBiz Financial Inc. CO 1.84 CenterState Banks, Inc. FL 2.02 OceanFirst Financial Corp. NJ 2.06 West Coast Bancorp OR 2.89 Bank Mutual Corporation WI 3.11 Independent Bank Corporation MI 3.42 TriCo Bancshares CA 3.71 Capital City Bank Group, Inc. FL 5.14 HomeStreet, Inc. WA 6.22 FNB United Corp. NC 8.78 Source: SNL Financial | 26 Regional Peers NPAs / Assets (%) 1Q2012 National Bankshares, Inc. VA 0.60 Cardinal Financial Corporation VA 0.62 Burke & Herbert Bank & Trust Company VA 0.84 First Community Bancshares, Inc. VA 1.29 Eagle Bancorp, Inc. MD 1.41 American National Bankshares Inc. VA 1.50 StellarOne Corporation VA 1.54 Sandy Spring Bancorp, Inc. MD 1.87 Virginia Commerce Bancorp, Inc. VA 2.01 Union First Market Bankshares Corporation VA 2.34 Eastern Virginia Bankshares, Inc. VA 2.64 Middleburg Financial Corporation VA 2.87 First United Corporation MD 3.48 Community Bankers Trust Corporation VA 3.51 Franklin Financial Corporation VA 4.07 Shore Bancshares, Inc. MD 5.52 First Mariner Bancorp MD 5.73 Hampton Roads Bankshares, Inc. VA 8.90 |
|
|
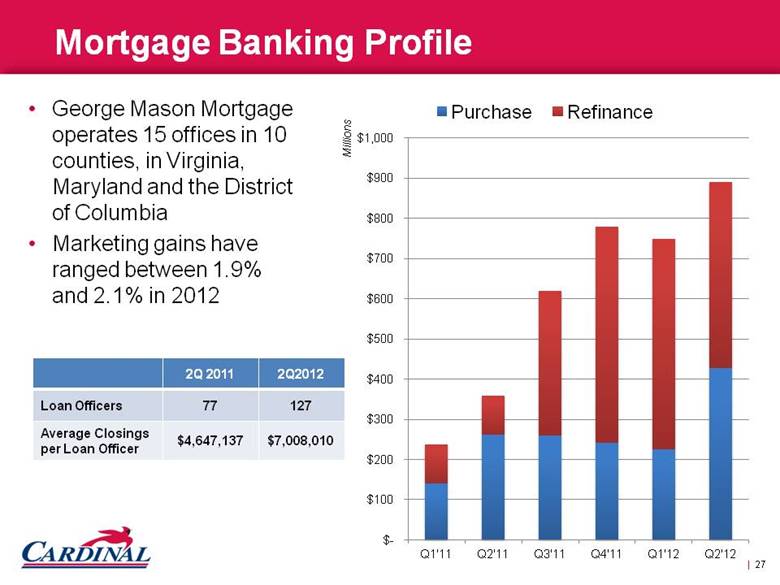
George Mason Mortgage operates 15 offices in 10 counties, in Virginia, Maryland and the District of Columbia Marketing gains have ranged between 1.9% and 2.1% in 2012 Mortgage Banking Profile | 27 2Q 2011 2Q2012 Loan Officers 77 127 Average Closings per Loan Officer $4,647,137 $7,008,010 |
|
|
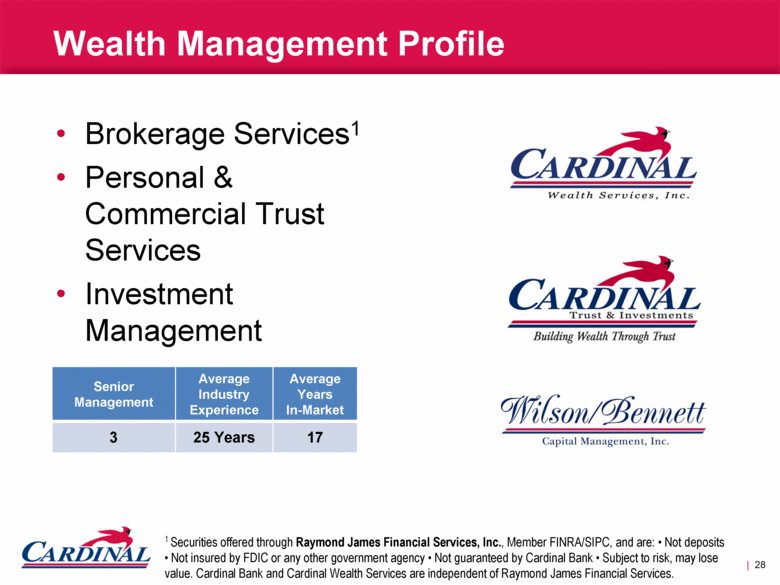
Brokerage Services1 Personal & Commercial Trust Services Investment Management Wealth Management Profile 1 Securities offered through Raymond James Financial Services, Inc., Member FINRA/SIPC, and are: • Not deposits • Not insured by FDIC or any other government agency • Not guaranteed by Cardinal Bank • Subject to risk, may lose value. Cardinal Bank and Cardinal Wealth Services are independent of Raymond James Financial Services. | 28 Senior Management Average Industry Experience Average Years In-Market 3 25 Years 17 |
|
|
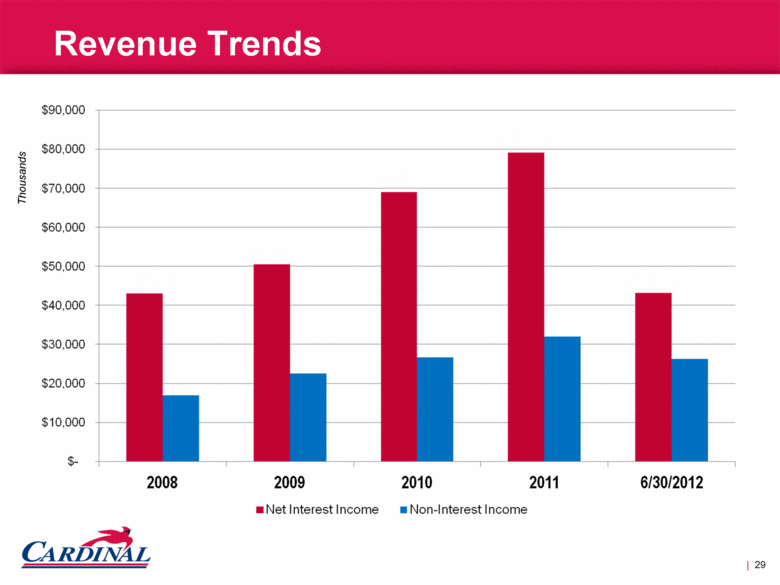
Revenue Trends | 29 Thousands |
|
|
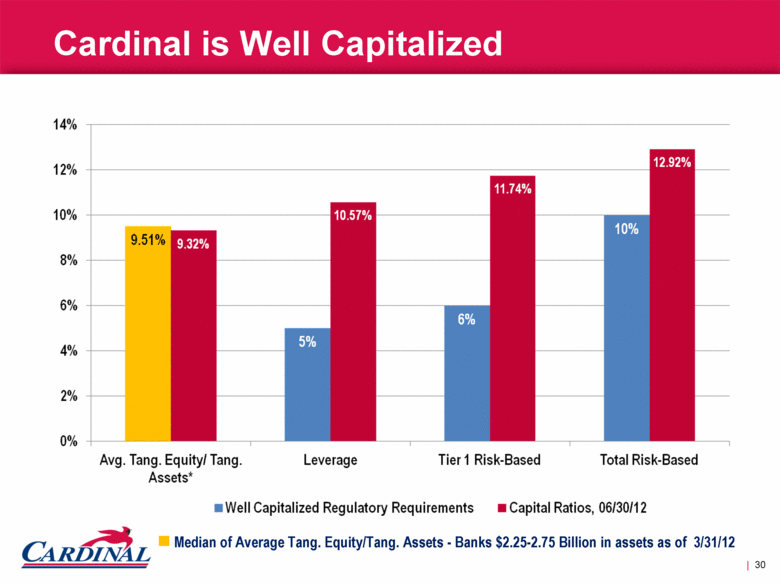
Cardinal is Well Capitalized Median of Average Tang. Equity/Tang. Assets - Banks $2.25-2.75 Billion in assets as of 3/31/12 | 30 |
|
|
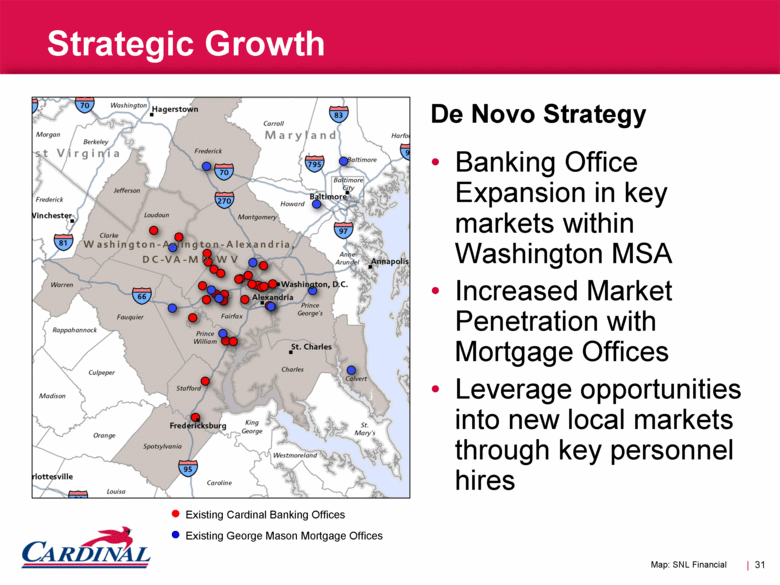
De Novo Strategy Banking Office Expansion in key markets within Washington MSA Increased Market Penetration with Mortgage Offices Leverage opportunities into new local markets through key personnel hires Strategic Growth | 31 Map: SNL Financial • Existing Cardinal Banking Offices • Existing George Mason Mortgage Offices |
|
|
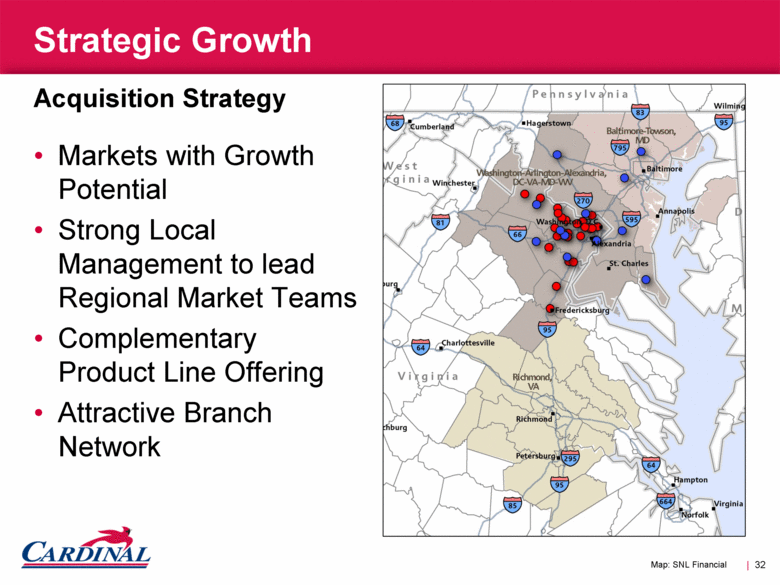
| 32 Acquisition Strategy Markets with Growth Potential Strong Local Management to lead Regional Market Teams Complementary Product Line Offering Attractive Branch Network Strategic Growth Map: SNL Financial |
|
|
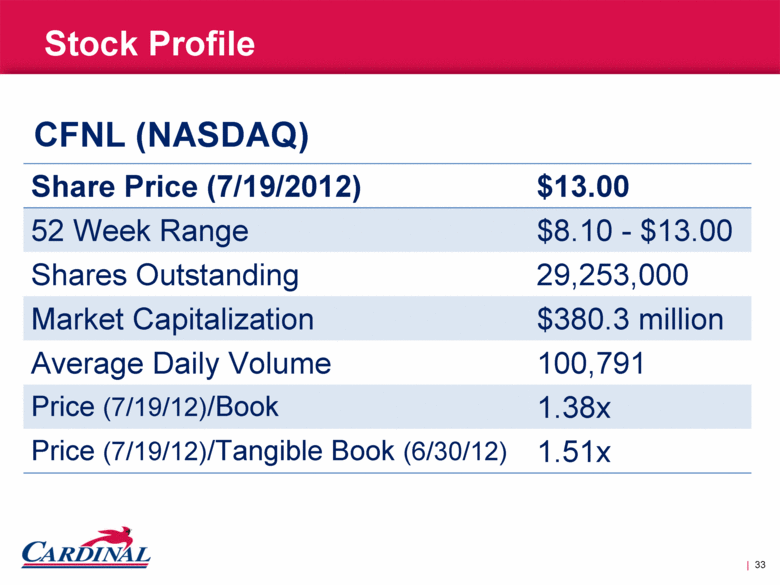
Stock Profile Share Price (7/19/2012) $13.00 52 Week Range $8.10 - $13.00 Shares Outstanding 29,253,000 Market Capitalization $380.3 million Average Daily Volume 100,791 Price (7/19/12)/Book 1.38x Price (7/19/12)/Tangible Book (6/30/12) 1.51x CFNL (NASDAQ) | 33 |
|
|
Aggressive on Sales, CONSERVATIVE ON RISK | 34 Our Operating Philosophy |

|
|
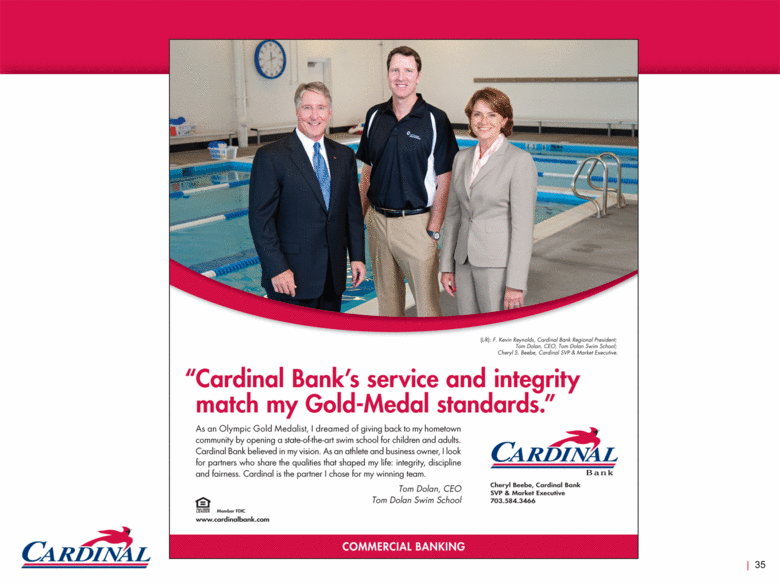
| 35 (L-R): F. Kevin Reynolds, Cardinal Bank Regional President, Tom Dolon, CEO, Tom Dolon Swim School; Cheryl S. Beebe, Cardinal SVP & Market Executive. “Cardinal Bank’s service and integrity match my Gold-Medal standards.” As an Olympic Gold Medalist, I dreamed of giving back to my hometown community by opening a state-of-the-art swim school for children and adults, Cardinal Bank believed in my vision. As an athlete and business owner, I look For partners who share the qualifies that shaped my life: integrity, discipline and fairness. Cardinal is the partner I chose for my winning team. Tom Dolan, CEO Tom Dolan Swim School Member FDIC www.cardinalbank.com CARDINAL Bank Cheryl Beebe, Cardinal Bank SVP & Market Executive 703.584.3466 COMMERCIAL BANKING |
|
|
APPENDIX |

|
|
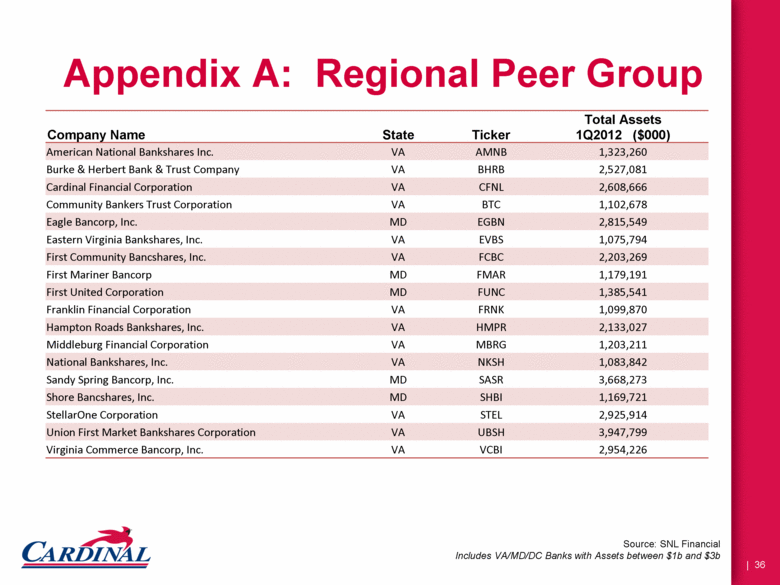
Appendix A: Regional Peer Group Company Name State Ticker Total Assets 1Q2012 ($000) American National Bankshares Inc. VA AMNB 1,323,260 Burke & Herbert Bank & Trust Company VA BHRB 2,527,081 Cardinal Financial Corporation VA CFNL 2,608,666 Community Bankers Trust Corporation VA BTC 1,102,678 Eagle Bancorp, Inc. MD EGBN 2,815,549 Eastern Virginia Bankshares, Inc. VA EVBS 1,075,794 First Community Bancshares, Inc. VA FCBC 2,203,269 First Mariner Bancorp MD FMAR 1,179,191 First United Corporation MD FUNC 1,385,541 Franklin Financial Corporation VA FRNK 1,099,870 Hampton Roads Bankshares, Inc. VA HMPR 2,133,027 Middleburg Financial Corporation VA MBRG 1,203,211 National Bankshares, Inc. VA NKSH 1,083,842 Sandy Spring Bancorp, Inc. MD SASR 3,668,273 Shore Bancshares, Inc. MD SHBI 1,169,721 StellarOne Corporation VA STEL 2,925,914 Union First Market Bankshares Corporation VA UBSH 3,947,799 Virginia Commerce Bancorp, Inc. VA VCBI 2,954,226 Source: SNL Financial Includes VA/MD/DC Banks with Assets between $1b and $3b |
|
|
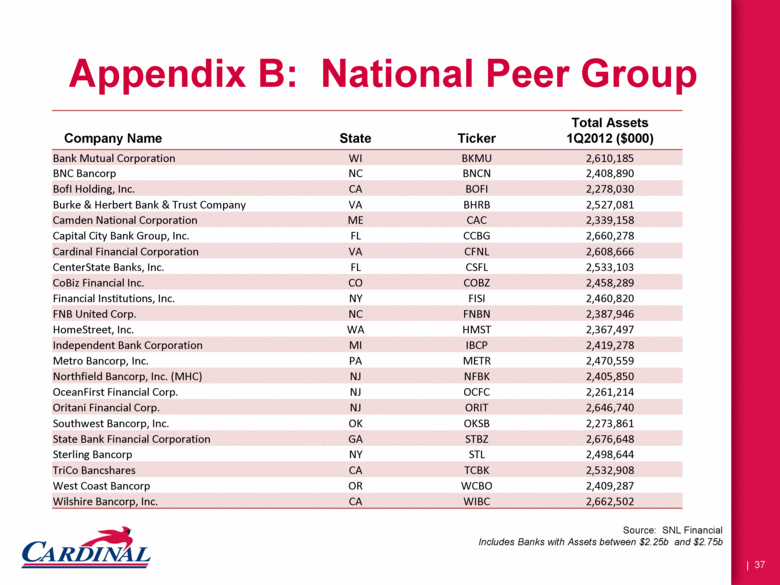
Appendix B: National Peer Group Company Name State Ticker Total Assets 1Q2012 ($000) Bank Mutual Corporation WI BKMU 2,610,185 BNC Bancorp NC BNCN 2,408,890 BofI Holding, Inc. CA BOFI 2,278,030 Burke & Herbert Bank & Trust Company VA BHRB 2,527,081 Camden National Corporation ME CAC 2,339,158 Capital City Bank Group, Inc. FL CCBG 2,660,278 Cardinal Financial Corporation VA CFNL 2,608,666 CenterState Banks, Inc. FL CSFL 2,533,103 CoBiz Financial Inc. CO COBZ 2,458,289 Financial Institutions, Inc. NY FISI 2,460,820 FNB United Corp. NC FNBN 2,387,946 HomeStreet, Inc. WA HMST 2,367,497 Independent Bank Corporation MI IBCP 2,419,278 Metro Bancorp, Inc. PA METR 2,470,559 Northfield Bancorp, Inc. (MHC) NJ NFBK 2,405,850 OceanFirst Financial Corp. NJ OCFC 2,261,214 Oritani Financial Corp. NJ ORIT 2,646,740 Southwest Bancorp, Inc. OK OKSB 2,273,861 State Bank Financial Corporation GA STBZ 2,676,648 Sterling Bancorp NY STL 2,498,644 TriCo Bancshares CA TCBK 2,532,908 West Coast Bancorp OR WCBO 2,409,287 Wilshire Bancorp, Inc. CA WIBC 2,662,502 Source: SNL Financial Includes Banks with Assets between $2.25b and $2.75b |