Attached files
| file | filename |
|---|---|
| 8-K - CURRENT REPORT - Ally Financial Inc. | v319992_8k.htm |
| EX-99.3 - EXHIBIT 99.3 - Ally Financial Inc. | v319992_ex99-3.htm |
| EX-99.1 - EXHIBIT 99.1 - Ally Financial Inc. | v319992_ex99-1.htm |

Ally Financial Inc. 2Q Earnings Review Contact Ally Investor Relations at (866) 710 - 4623 or investor.relations@ally.com August 1, 2012
2 2Q 2012 Preliminary Results Forward - Looking Statements and Additional Information The following should be read in conjunction with the financial statements, notes and other information contained in the Compa ny’ s 2011 Annual Report on Form 10 - K, Quarterly Reports on Form 10 - Q, and Current Reports on Form 8 - K. This information is preliminary and based on company data available at the time of the presentation In the presentation that follows and related comments by Ally Financial Inc. (“Ally”) management, the use of the words “expec t,” “anticipate,” “estimate,” “forecast,” “initiative,” “objective,” “plan,” “goal,” “project,” “outlook,” “priorities,” “target,” “intend,” “e val uate,” “pursue,” “seek,” “may,” “would ” “could ” “should ” “believe ” “potential ” “continue ” would, could, should, believe, potential, continue, or simila r e xpressions is intended to identify forward - looking statements. All statements herein and in related management comments, other than statements of historic al fact, including without limitation, statements about future events and financial performance, are forward - looking statements that involve certai n risks and uncertainties. While these statements represent our current judgment on what the future may hold, and we believe these judgme nts are reasonable, these statements are not guarantees of any events or financial results, and Ally’s actual results may differ mate ria lly due to numerous important factors that are described in the most recent reports on SEC Forms 10 - K and 10 - Q for Ally, each of which may be revise d or supplemented in subsequent reports filed with the SEC. Such factors include, among others, the following: maintaining the mut ual ly beneficial relationship between Ally and General Motors (“GM”), and Ally and Chrysler Group LLC (“Chrysler”); the profitability and fina nci al condition of GM and Chrysler; bankruptcy court approval of the plan and settlement related to the bankruptcy filings by Residential Capital, LLC and certain of its subsidiaries; our ability to realize the anticipated benefits associated with being a bank holding company, and the increased re gulation and restrictions that we are now subject to; the potential for deterioration in the residual value of off - lease vehicles; disruption s in the market in which we fund our operations, with resulting negative impact on our liquidity; changes in our accounting assumptions that may requi re or that result from changes in the accounting rules or their application, which could result in an impact on earnings; changes in the credit rati ngs of Ally, Chrysler, or GM; changes in economic conditions, currency exchange rates or political stability in the markets in which we operate; and ch ang es in the existing or the adoption of new laws, regulations, policies or other activities of governments, agencies and similar organizations (in clu ding as a result of the Dodd - Frank Act and Basel III). Investors are cautioned not to place undue reliance on forward - looking statements. Ally undertakes no obligation to update publi cly or otherwise revise any forward - looking statements except where expressly required by law. Reconciliation of non - GAAP financial measures incl uded within this presentation are provided in this presentation. Use of the term “loans” describes products associated with direct and indirect lending activities of Ally’s global operations . T he specific products include retail installment sales contracts, loans, lines of credit, leases or other financing products. The term “originate” ref ers to Ally’s purchase, acquisition or direct origination of various “loan” products.
3 2Q 2012 Preliminary Results Strategic Update and Outlook • ResCap bankruptcy process continues to move forward – Important initial requests have been granted by the court – ResCap continues to operate in the normal course – Ally no longer stalking horse bidder for ResCap’s HFS loan portfolio • Exploring strategic alternatives for all international businesses – Represents total assets of $31 billion and book value of $7.6 billion – Designed to further streamline operations, increase focus on U.S. auto finance and accelerate U.S. Treasury repayment – Sale process is underway • Core business fundamentals continue their positive trend – Strong auto loan originations and revenue growth – Consistent and stable deposit growth at Ally Bank • Ally maintains a strong financial profile – Tier 1 capital ratio of 13.7% – Conservative liquidity posture – Low loss, short duration balance sheet – Strategic actions designed to further improve credit profile
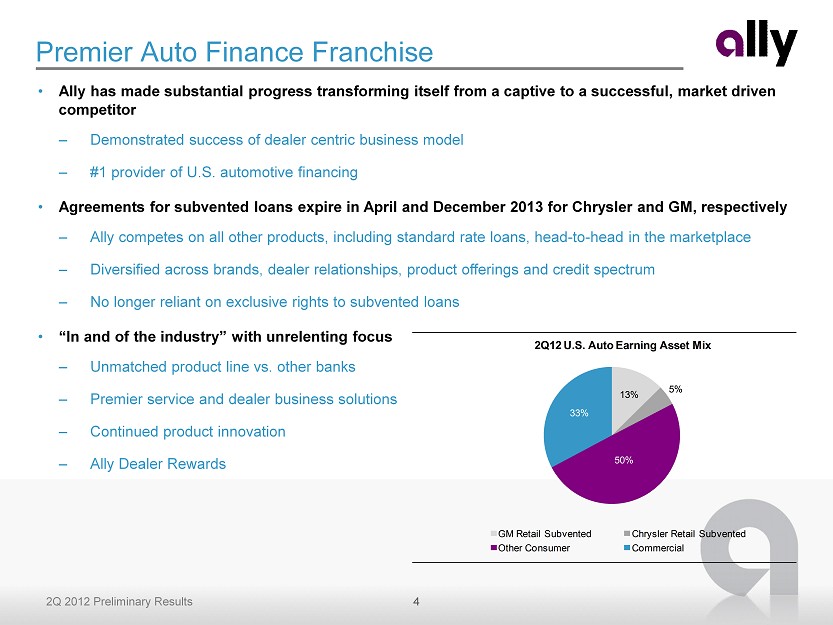
4 2Q 2012 Preliminary Results Premier Auto Finance Franchise • Ally has made substantial progress transforming itself from a captive to a successful, market driven competitor – Demonstrated success of dealer centric business model – #1 provider of U.S. automotive financing • Agreements for subvented loans expire in April and December 2013 for Chrysler and GM, respectively – Ally competes on all other products, including standard rate loans, head - to - head in the marketplace – Diversified across brands, dealer relationships, product offerings and credit spectrum – No longer reliant on exclusive rights to subvented loans • “In and of the industry” with unrelenting focus – Unmatched product line vs. other banks – Premier service and dealer business solutions – Continued product innovation – Ally Dealer Rewards 13% 5% 50% 33% 2Q12 U.S. Auto Earning Asset Mix GM Retail Subvented Chrysler Retail Subvented Other Consumer Commercial 13% 5% 50% 33% 2Q12 U.S. Auto Earning Asset Mix GM Retail Subvented Chrysler Retail Subvented Other Consumer Commercial
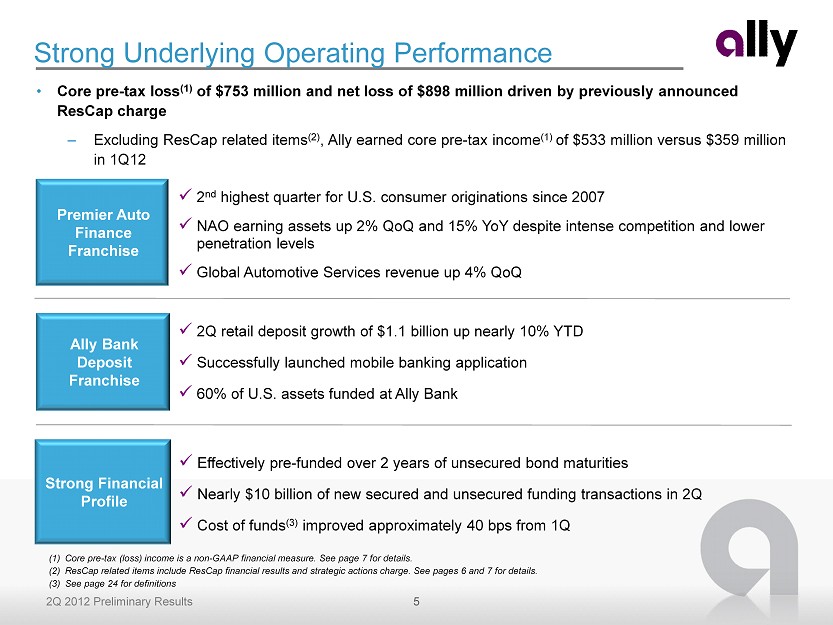
5 2Q 2012 Preliminary Results x 2Q retail deposit growth of $1.1 billion up nearly 10% YTD x Successfully launched mobile banking application x 60% of U.S. assets funded at Ally Bank Premier Auto Finance Franchise x Effectively pre - funded over 2 years of unsecured bond maturities x Nearly $10 billion of new secured and unsecured funding transactions in 2Q x Cost of funds (3) improved approximately 40 bps from 1Q Strong Financial Profile Ally Bank Deposit Franchise x 2 nd highest quarter for U.S. consumer originations since 2007 x NAO earning assets up 2% QoQ and 15% YoY despite intense competition and lower penetration levels x Global Automotive Services revenue up 4% QoQ Strong Underlying Operating Performance (1) Core pre - tax (loss) income is a non - GAAP financial measure. See page 7 for details. (2) ResCap related items include ResCap financial results and strategic actions charge. See pages 6 and 7 for details. (3) See page 24 for definitions • Core pre - tax loss (1) of $753 million and net loss of $898 million driven by previously announced ResCap charge – Excluding ResCap related items (2) , Ally earned core pre - tax income (1) of $533 million versus $359 million in 1Q12
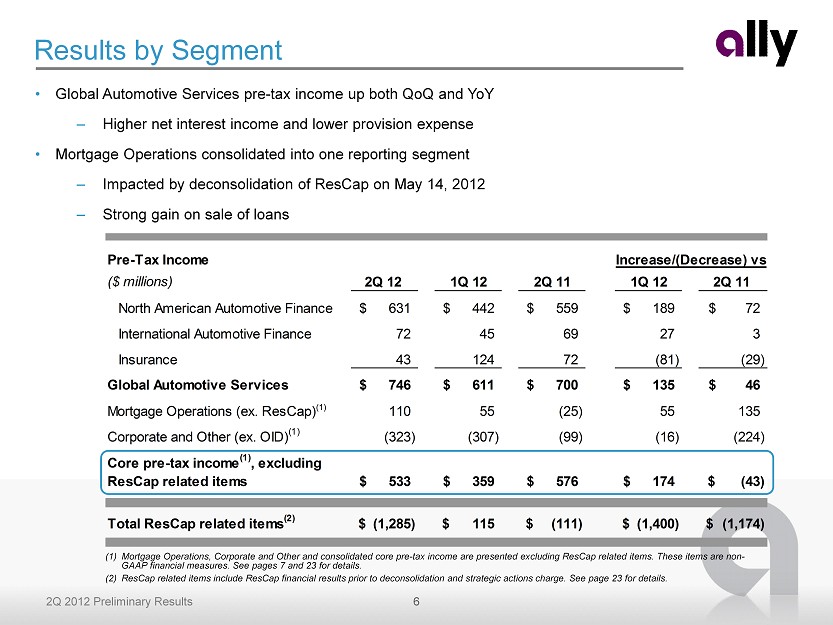
6 2Q 2012 Preliminary Results Pre-Tax Income ($ millions) 2Q 12 1Q 12 2Q 11 1Q 12 2Q 11 North American Automotive Finance 631$ 442$ 559$ 189$ 72$ International Automotive Finance 72 45 69 27 3 Insurance 43 124 72 (81) (29) Global Automotive Services 746$ 611$ 700$ 135$ 46$ Mortgage Operations (ex. ResCap) (1) 110 55 (25) 55 135 Corporate and Other (ex. OID) (1) (323) (307) (99) (16) (224) Core pre-tax income (1) , excluding ResCap related items 533$ 359$ 576$ 174$ (43)$ Total ResCap related items (2) (1,285)$ 115$ (111)$ (1,400)$ (1,174)$ Increase/(Decrease) vs. Results by Segment (1) Mortgage Operations, Corporate and Other and consolidated core pre - tax income are presented excluding ResCap related items. Thes e items are non - GAAP financial measures. See pages 7 and 23 for details. (2) ResCap related items include ResCap financial results prior to deconsolidation and strategic actions charge. See page 23 for det ails. • Global Automotive Services pre - tax income up both QoQ and YoY – Higher net interest income and lower provision expense • Mortgage Operations consolidated into one reporting segment – Impacted by deconsolidation of ResCap on May 14, 2012 – Strong gain on sale of loans

7 2Q 2012 Preliminary Results ($ millions) 2Q 12 1Q 12 2Q 11 1Q 12 2Q 11 Net financing revenue (ex. OID) 892$ 786$ 972$ 107$ (80)$ Total other revenue (ex. OID) 753 780 813 (27) (60) Provision for loan losses 28 140 48 (112) (20) Controllable expenses (1) 672 719 696 (47) (25) Other noninterest expenses 413 348 465 64 (52) - - Core pre-tax income (2) , excluding ResCap related items 533$ 359$ 576$ 174$ (43)$ Total ResCap related items (1,285) 115 (111) (1,400) (1,174) Core pre-tax (loss) income(1) (753)$ 474$ 465$ (1,226)$ (1,217)$ OID amortization expense (1) 96 108 274 (11) (177) Income tax expense 15 64 83 (49) (68) Income (loss) from discontinued operations (34) 8 5 (42) (39) Net (loss) income (898)$ 310$ 113$ 310$ (1,208)$ (1,011)$ Increase/(Decrease) vs. Second Quarter Results (1) See page 24 for definitions (2) Core pre - tax income and each of its components indicated above are presented excluding ResCap related items for all periods. See page 23 for details.

8 2Q 2012 Preliminary Results Ally Financial - Net Interest Margin $142 $155 $160 $163 2.9% 2.5% 1.9% 2.2% 1.5% 2.1% 1.6% 1.9% 2Q 10 3Q 10 4Q 10 1Q 11 2Q 11 3Q 11 4Q 11 1Q 12 2Q 12 Average Earning Assets ($B) NIM (ex. OID) Risk - adjusted NIM (ex. OID) Net Interest Margin • Net Interest Margin (“NIM”) (1) increased over 20 bps this quarter driven by lower cost of funds – Continued benefit of more assets funded cost efficiently at Ally Bank – Improved funding spreads • More profitable auto origination mix improving risk adjusted spreads – Impact from lease remarketing gains drove higher margins in 2010 and early 2011 (1) See page 24 for definitions (1)
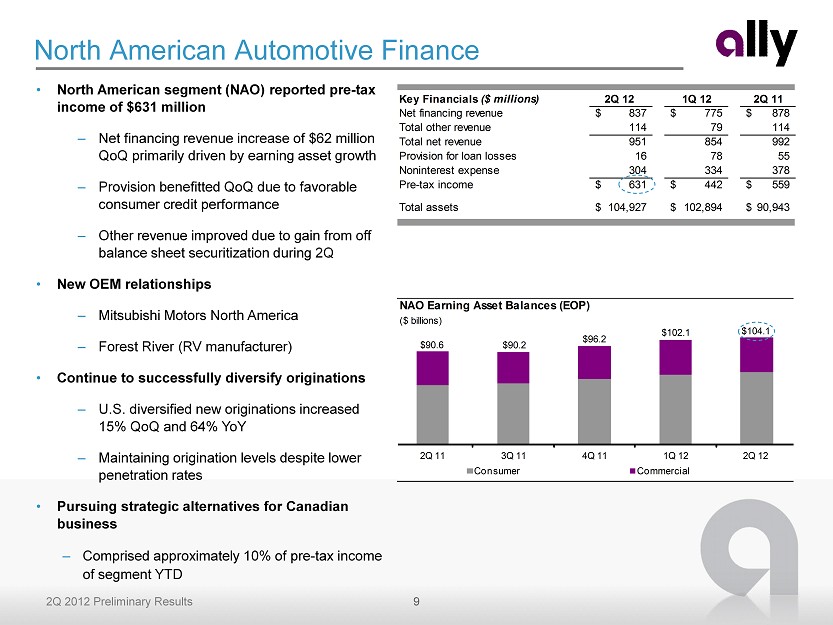
9 2Q 2012 Preliminary Results NAO Earning Asset Balances (EOP) ($ billions) $90.6 $90.2 $96.2 $102.1 $104.1 2Q 11 3Q 11 4Q 11 1Q 12 2Q 12 Consumer Commercial Key Financials ($ millions) 2Q 12 1Q 12 2Q 11 Net financing revenue 837$ 775$ 878$ Total other revenue 114 79 114 Total net revenue 951 854 992 Provision for loan losses 16 78 55 Noninterest expense 304 334 378 Pre-tax income 631$ 442$ 559$ Total assets 104,927$ 102,894$ 90,943$ • North American segment (NAO) reported pre - tax income of $631 million – Net financing revenue increase of $62 million QoQ primarily driven by earning asset growth – Provision benefitted QoQ due to favorable consumer credit performance – Other revenue improved due to gain from off balance sheet securitization during 2Q • New OEM relationships – Mitsubishi Motors North America – Forest River (RV manufacturer) • Continue to successfully diversify originations – U.S. diversified new originations increased 15% QoQ and 64% YoY – Maintaining origination levels despite lower penetration rates • Pursuing strategic alternatives for Canadian business – Comprised approximately 10% of pre - tax income of segment YTD North American Automotive Finance
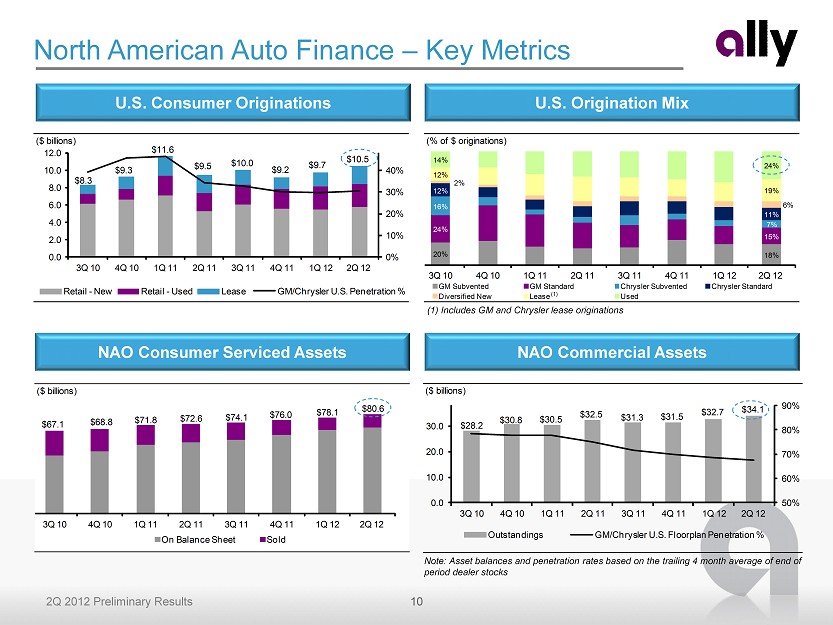
10 2Q 2012 Preliminary Results ($ billions) 50% 60% 70% 80% 90% 0.0 10.0 20.0 30.0 3Q 10 4Q 10 1Q 11 2Q 11 3Q 11 4Q 11 1Q 12 2Q 12 Outstandings GM/Chrysler U.S. Floorplan Penetration % $34.1 $32.7 $31.5 $31.3 $32.5 $30.5 $30.8 $28.2 ($ billions) 0% 10% 20% 30% 40% 0.0 2.0 4.0 6.0 8.0 10.0 12.0 3Q 10 4Q 10 1Q 11 2Q 11 3Q 11 4Q 11 1Q 12 2Q 12 Retail - New Retail - Used Lease GM/Chrysler U.S. Penetration % $10.5 $9.7 $9.2 $10.0 $9.5 $11.6 $9.3 $8.3 (% of $ originations) 20% 18% 24% 15% 16% 7% 12% 11% 2% 6% 12% 19% 14% 24% 3Q 10 4Q 10 1Q 11 2Q 11 3Q 11 4Q 11 1Q 12 2Q 12 GM Subvented GM Standard Chrysler Subvented Chrysler Standard Diversified New Lease Used ($ billions) $67.1 $68.8 $71.8 $72.6 $74.1 $76.0 $78.1 $80.6 3Q 10 4Q 10 1Q 11 2Q 11 3Q 11 4Q 11 1Q 12 2Q 12 On Balance Sheet Sold North American Auto Finance – Key Metrics (1) Includes GM and Chrysler lease originations (1) NAO Consumer Serviced Assets NAO Commercial Assets U.S. Consumer Originations U.S. Origination Mix Note: Asset balances and penetration rates based on the trailing 4 month average of end of period dealer stocks
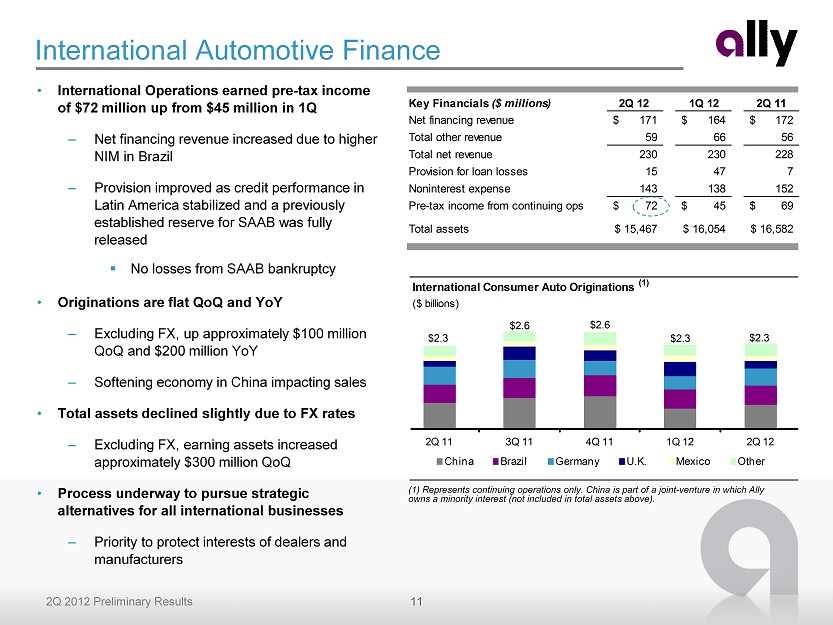
11 2Q 2012 Preliminary Results International Consumer Auto Originations (1) ($ billions) $2.3 $2.6 $2.6 $2.3 $2.3 2Q 11 3Q 11 4Q 11 1Q 12 2Q 12 China Brazil Germany U.K. Mexico Other Key Financials ($ millions) 2Q 12 1Q 12 2Q 11 Net financing revenue 171$ 164$ 172$ Total other revenue 59 66 56 Total net revenue 230 230 228 Provision for loan losses 15 47 7 Noninterest expense 143 138 152 Pre-tax income from continuing ops 72$ 45$ 69$ Total assets 15,467$ 16,054$ 16,582$ • International Operations earned pre - tax income of $72 million up from $45 million in 1Q – Net financing revenue increased due to higher NIM in Brazil – Provision improved as credit performance in Latin America stabilized and a previously established reserve for SAAB was fully released ▪ No losses from SAAB bankruptcy • Originations are flat QoQ and YoY – Excluding FX, up approximately $100 million QoQ and $200 million YoY – Softening economy in China impacting sales • Total assets declined slightly due to FX rates – Excluding FX, earning assets increased approximately $300 million QoQ • Process underway to pursue strategic alternatives for all international businesses – Priority to protect interests of dealers and manufacturers International Automotive Finance (1) Represents continuing operations only. China is part of a joint - venture in which Ally owns a minority interest (not included in total assets above).
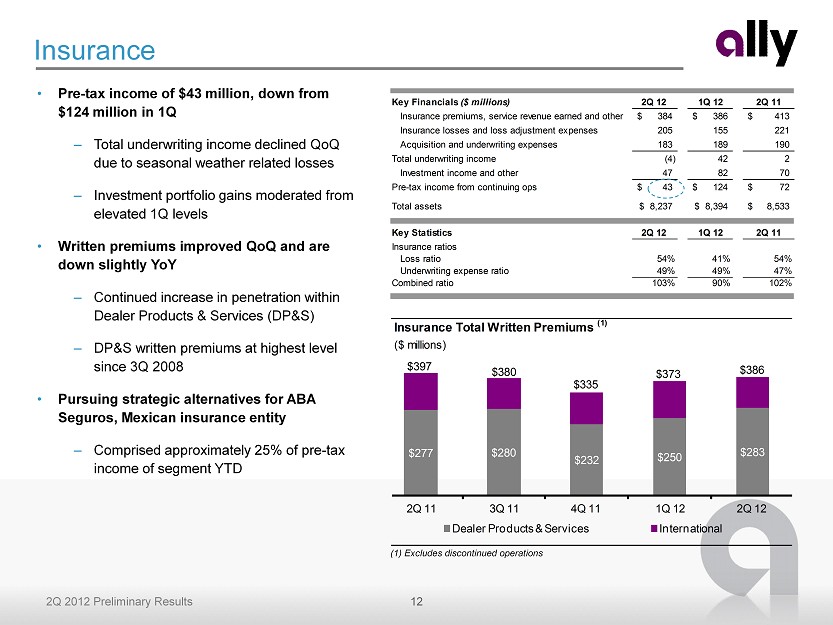
12 2Q 2012 Preliminary Results Key Financials ($ millions) 2Q 12 1Q 12 2Q 11 Insurance premiums, service revenue earned and other 384$ 386$ 413$ Insurance losses and loss adjustment expenses 205 155 221 Acquisition and underwriting expenses 183 189 190 Total underwriting income (4) 42 2 Investment income and other 47 82 70 Pre-tax income from continuing ops 43$ 124$ 72$ Total assets 8,237$ 8,394$ 8,533$ Key Statistics 2Q 12 1Q 12 2Q 11 Insurance ratios Loss ratio 54% 41% 54% Underwriting expense ratio 49% 49% 47% Combined ratio 103% 90% 102% Insurance • Pre - tax income of $43 million, down from $124 million in 1Q – Total underwriting income declined QoQ due to seasonal weather related losses – Investment portfolio gains moderated from elevated 1Q levels • Written premiums improved QoQ and are down slightly YoY – Continued increase in penetration within Dealer Products & Services (DP&S) – DP&S written premiums at highest level since 3Q 2008 • Pursuing strategic alternatives for ABA Seguros, Mexican insurance entity – Comprised approximately 25% of pre - tax income of segment YTD (1) Excludes discontinued operations Insurance Total Written Premiums (1) ($ millions) $397 $380 $335 $373 $386 $277 $280 $232 $250 $283 2Q 11 3Q 11 4Q 11 1Q 12 2Q 12 Dealer Products & Services International
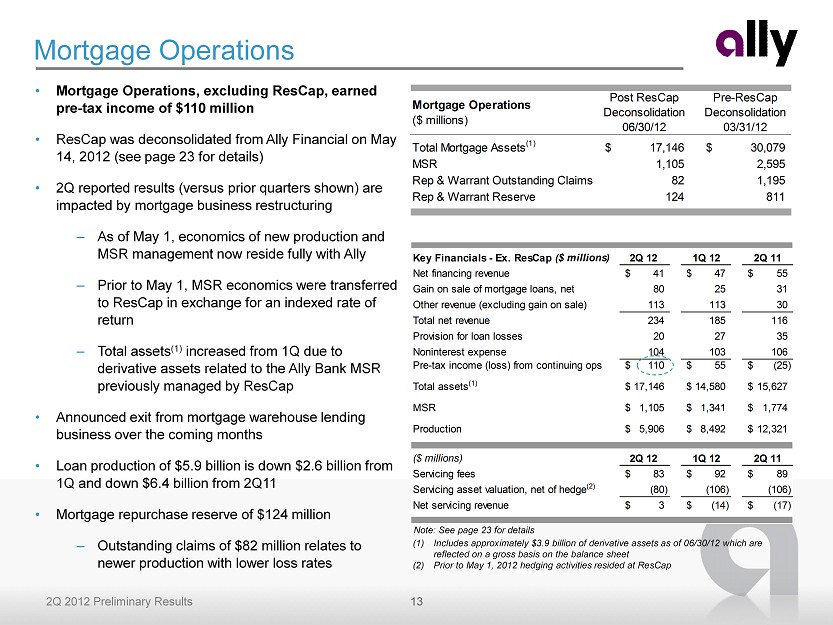
13 2Q 2012 Preliminary Results Key Financials - Ex. ResCap ($ millions) 2Q 12 1Q 12 2Q 11 Net financing revenue 41$ 47$ 55$ Gain on sale of mortgage loans, net 80 25 31 Other revenue (excluding gain on sale) 113 113 30 Total net revenue 234 185 116 Provision for loan losses 20 27 35 Noninterest expense 104 103 106 Pre-tax income (loss) from continuing ops 110$ 55$ (25)$ Total assets (1) 17,146$ 14,580$ 15,627$ MSR 1,105$ 1,341$ 1,774$ Production 5,906$ 8,492$ 12,321$ TRUE ($ millions) 2Q 12 1Q 12 2Q 11 Servicing fees 83$ 92$ 89$ Servicing asset valuation, net of hedge (2) (80) (106) (106) Net servicing revenue 3$ (14)$ (17)$ Mortgage Operations ($ millions) Post ResCap Deconsolidation 06/30/12 Pre-ResCap Deconsolidation 03/31/12 Total Mortgage Assets (1) 17,146$ 30,079$ MSR 1,105 2,595 Rep & Warrant Outstanding Claims 82 1,195 Rep & Warrant Reserve 124 811 Mortgage Operations • Mortgage Operations, excluding ResCap, earned pre - tax income of $110 million • ResCap was deconsolidated from Ally Financial on May 14, 2012 (see page 23 for details) • 2Q reported results (versus prior quarters shown) are impacted by mortgage business restructuring – As of May 1, economics of new production and MSR management now reside fully with Ally – Prior to May 1, MSR economics were transferred to ResCap in exchange for an indexed rate of return – Total assets (1) increased from 1Q due to derivative assets related to the Ally Bank MSR previously managed by ResCap • Announced exit from mortgage warehouse lending business over the coming months • Loan production of $5.9 billion is down $2.6 billion from 1Q and down $6.4 billion from 2Q11 • Mortgage repurchase reserve of $124 million – Outstanding claims of $82 million relates to newer production with lower loss rates Note: See page 23 for details (1) Includes approximately $3.9 billion of derivative assets as of 06/30/12 which are reflected on a gross basis on the balance sheet (2) Prior to May 1, 2012 hedging activities resided at ResCap
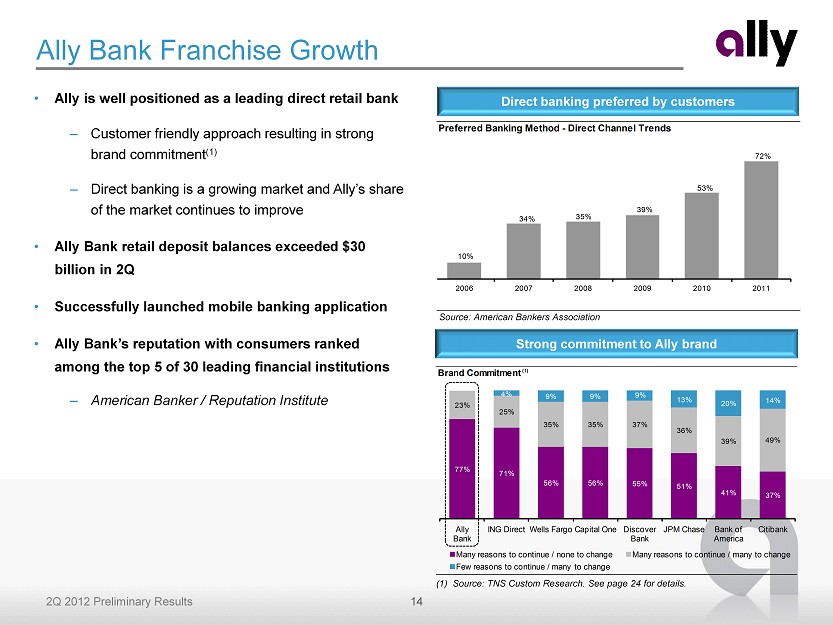
14 2Q 2012 Preliminary Results Brand Commitment (1) 77% 71% 56% 56% 55% 51% 41% 37% 23% 25% 35% 35% 37% 36% 39% 49% 4% 9% 9% 9% 13% 20% 14% 0% 20% 40% 60% 80% 100% Ally Bank ING Direct Wells Fargo Capital One Discover Bank JPM Chase Bank of America Citibank Many reasons to continue / none to change Many reasons to continue / many to change Few reasons to continue / many to change • Ally is well positioned as a leading direct retail bank – Customer friendly approach resulting in strong brand commitment (1) – Direct banking is a growing market and Ally’s share of the market continues to improve • Ally Bank retail deposit balances exceeded $30 billion in 2Q • Successfully launched mobile banking application • Ally Bank’s reputation with consumers ranked among the top 5 of 30 leading financial institutions – American Banker / Reputation Institute Ally Bank Franchise Growth Direct banking preferred by customers Strong commitment to Ally brand Source: American Bankers Association (1) Source: TNS Custom Research. See page 24 for details. Preferred Banking Method - Direct Channel Trends 10% 34% 35% 39% 53% 72% 2006 2007 2008 2009 2010 2011
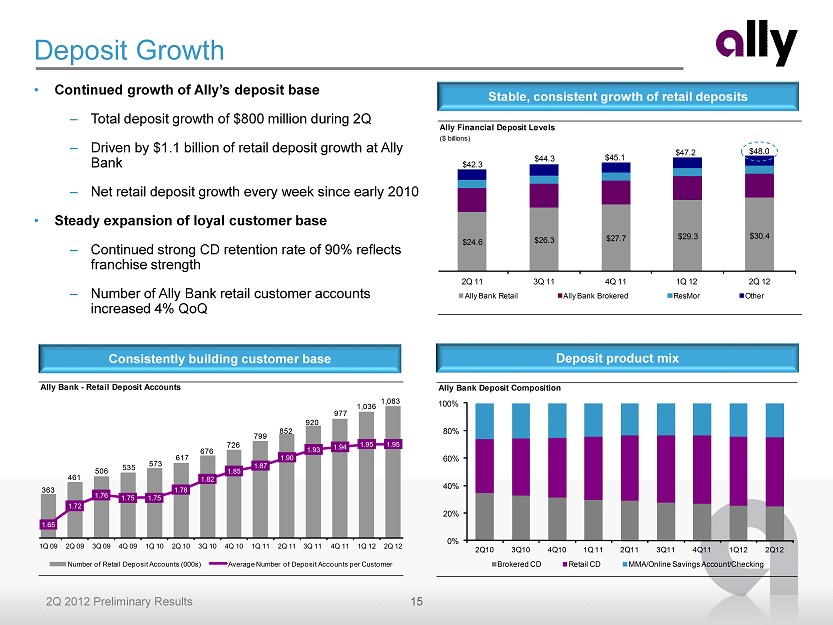
15 2Q 2012 Preliminary Results Ally Financial Deposit Levels ($ billions) $24.6 $26.3 $27.7 $29.3 $30.4 $42.3 $44.3 $45.1 $47.2 $48.0 2Q 11 3Q 11 4Q 11 1Q 12 2Q 12 Ally Bank Retail Ally Bank Brokered ResMor Other Deposit Growth • Continued growth of Ally’s deposit base – Total deposit growth of $800 million during 2Q – Driven by $1.1 billion of retail deposit growth at Ally Bank – Net retail deposit growth every week since early 2010 • Steady expansion of loyal customer base – Continued strong CD retention rate of 90% reflects franchise strength – Number of Ally Bank retail customer accounts increased 4% QoQ Stable, consistent growth of retail deposits Deposit product mix Consistently building customer base Ally Bank Deposit Composition 0% 20% 40% 60% 80% 100% 2Q10 3Q10 4Q10 1Q 11 2Q11 3Q11 4Q11 1Q12 2Q12 Brokered CD Retail CD MMA/Online Savings Account/Checking Ally Bank - Retail Deposit Accounts 363 461 506 535 573 617 676 726 799 852 920 977 1,036 1,083 1.65 1.72 1.76 1.75 1.75 1.78 1.82 1.85 1.87 1.90 1.93 1.94 1.95 1.95 1Q 09 2Q 09 3Q 09 4Q 09 1Q 10 2Q 10 3Q 10 4Q 10 1Q 11 2Q 11 3Q 11 4Q 11 1Q 12 2Q 12 Number of Retail Deposit Accounts (000s) Average Number of Deposit Accounts per Customer
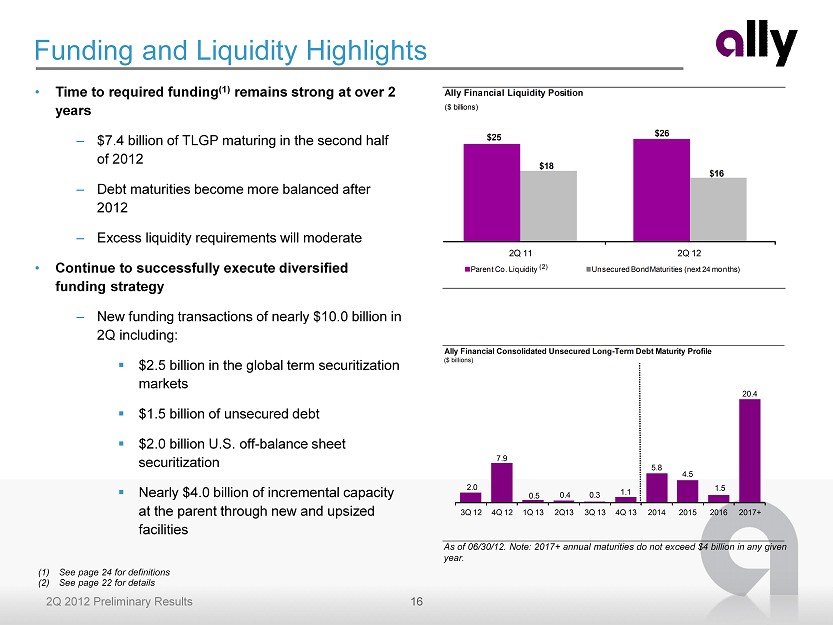
16 2Q 2012 Preliminary Results Ally Financial Consolidated Unsecured Long-Term Debt Maturity Profile ($ billions) 2.0 7.9 0.5 0.4 0.3 1.1 5.8 4.5 1.5 20.4 3Q 12 4Q 12 1Q 13 2Q13 3Q 13 4Q 13 2014 2015 2016 2017+ Ally Financial Liquidity Position ($ billions) $25 $26 2Q 11 2Q 12 Parent Co. Liquidity Unsecured Bond Maturities (next 24 months) $18 $16 • Time to required funding (1) remains strong at over 2 years – $7.4 billion of TLGP maturing in the second half of 2012 – Debt maturities become more balanced after 2012 – Excess liquidity requirements will moderate • Continue to successfully execute diversified funding strategy – New funding transactions of nearly $10.0 billion in 2Q including: ▪ $2.5 billion in the global term securitization markets ▪ $1.5 billion of unsecured debt ▪ $2.0 billion U.S. off - balance sheet securitization ▪ Nearly $4.0 billion of incremental capacity at the parent through new and upsized facilities Funding and Liquidity Highlights (1) See page 24 for definitions (2) See page 22 for details (2) As of 06/30/12. Note: 2017+ annual maturities do not exceed $4 billion in any given year.
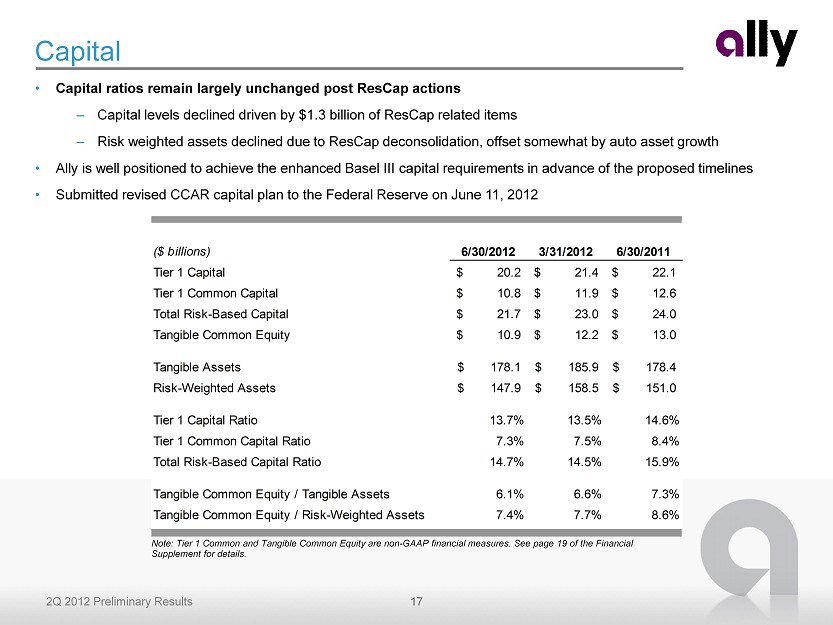
17 2Q 2012 Preliminary Results Capital • Capital ratios remain largely unchanged post ResCap actions – Capital levels declined driven by $1.3 billion of ResCap related items – Risk weighted assets declined due to ResCap deconsolidation, offset somewhat by auto asset growth • Ally is well positioned to achieve the enhanced Basel III capital requirements in advance of the proposed timelines • Submitted revised CCAR capital plan to the Federal Reserve on June 11, 2012 Note: Tier 1 Common and Tangible Common Equity are non - GAAP financial measures. See page 19 of the Financial Supplement for details. ($ billions) 6/30/2012 3/31/2012 6/30/2011 Tier 1 Capital 20.2$ 21.4$ 22.1$ Tier 1 Common Capital 10.8$ 11.9$ 12.6$ Total Risk-Based Capital 21.7$ 23.0$ 24.0$ Tangible Common Equity 10.9$ 12.2$ 13.0$ Tangible Assets 178.1$ 185.9$ 178.4$ Risk-Weighted Assets 147.9$ 158.5$ 151.0$ Tier 1 Capital Ratio 13.7% 13.5% 14.6% Tier 1 Common Capital Ratio 7.3% 7.5% 8.4% Total Risk-Based Capital Ratio 14.7% 14.5% 15.9% Tangible Common Equity / Tangible Assets 6.1% 6.6% 7.3% Tangible Common Equity / Risk-Weighted Assets 7.4% 7.7% 8.6%
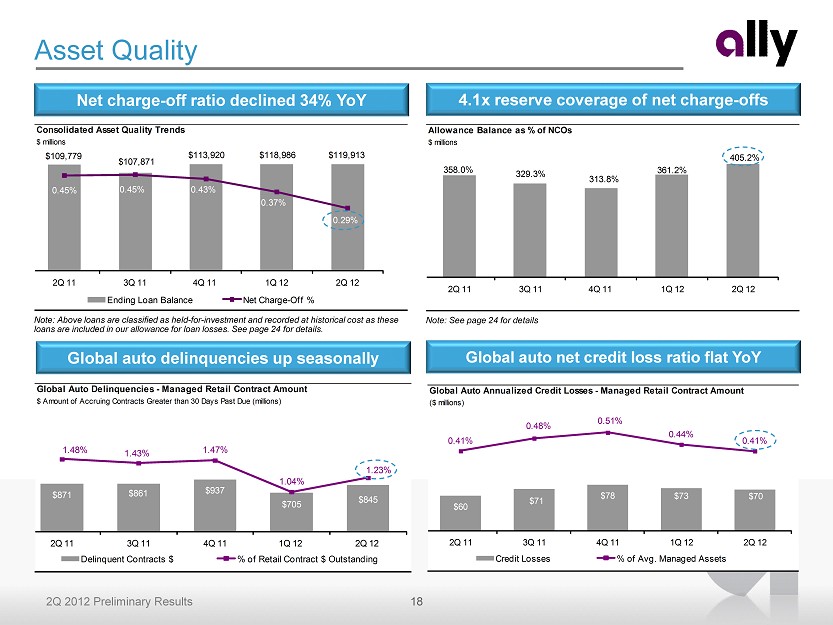
18 2Q 2012 Preliminary Results Global Auto Delinquencies - Managed Retail Contract Amount $ Amount of Accruing Contracts Greater than 30 Days Past Due (millions) $871 $861 $937 $705 $845 1.48% 1.43% 1.47% 1.04% 1.23% 2Q 11 3Q 11 4Q 11 1Q 12 2Q 12 Delinquent Contracts $ % of Retail Contract $ Outstanding Global Auto Annualized Credit Losses - Managed Retail Contract Amount ($ millions) $60 $71 $78 $73 $70 0.41% 0.48% 0.51% 0.44% 0.41% 2Q 11 3Q 11 4Q 11 1Q 12 2Q 12 Credit Losses % of Avg. Managed Assets Allowance Balance as % of NCOs $ millions 358.0% 329.3% 313.8% 361.2% 405.2% 2Q 11 3Q 11 4Q 11 1Q 12 2Q 12 Consolidated Asset Quality Trends $ millions $109,779 $107,871 $113,920 $118,986 $119,913 0.45% 0.45% 0.43% 0.37% 0.29% 0.00% 0.10% 0.20% 0.30% 0.40% 0.50% 2Q 11 3Q 11 4Q 11 1Q 12 2Q 12 Ending Loan Balance Net Charge - Off % Net charge - off ratio declined 34% YoY 4.1x reserve coverage of net charge - offs Asset Quality Global auto net credit loss ratio flat YoY Global auto delinquencies up seasonally Note: Above loans are classified as held - for - investment and recorded at historical cost as these loans are included in our allowance for loan losses. See page 24 for details . Note: See page 24 for details

19 2Q 2012 Preliminary Results Conclusion • Competitively advantaged auto finance franchise – 2 nd highest quarter of originations since 2007 despite intense competition – U.S. diversified new originations increased 15% QoQ and 64% YoY • Strong asset generation capabilities – NAO earning asset growth of 2% QoQ and 15% YoY • High quality assets – low loss, short dated, secured auto loans – Net charge - off ratio declined 8 bps QoQ • Leading direct bank franchise with growing customer base – $1.1 billion of retail deposit growth in 2Q coupled with positive brand momentum • Conservative capital and liquidity posture – Well positioned for upcoming debt maturities with TRF of over 2 years Core business fundamentals continue positive trend Strategic actions underway are designed to further improve Ally’s credit profile
Supplemental Charts
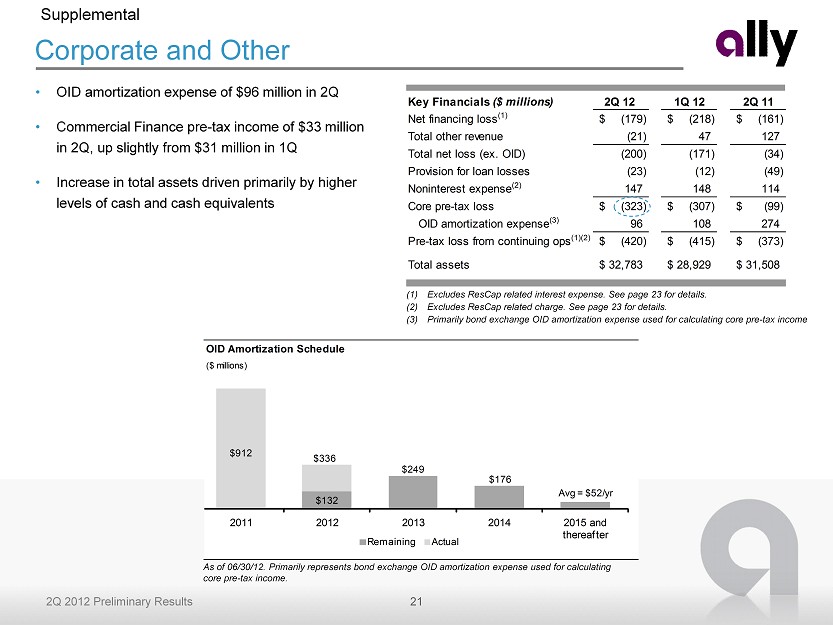
21 2Q 2012 Preliminary Results Key Financials ($ millions) 2Q 12 1Q 12 2Q 11 Net financing loss (1) (179)$ (218)$ (161)$ Total other revenue (21) 47 127 Total net loss (ex. OID) (200) (171) (34) Provision for loan losses (23) (12) (49) Noninterest expense (2) 147 148 114 Core pre-tax loss (323)$ (307)$ (99)$ OID amortization expense (3) 96 108 274 Pre-tax loss from continuing ops (1)(2) (420)$ (415)$ (373)$ Total assets 32,783$ 28,929$ 31,508$ Corporate and Other • OID amortization expense of $96 million in 2Q • Commercial Finance pre - tax income of $33 million in 2Q , up slightly from $31 million in 1Q • Increase in total assets driven primarily by higher levels of cash and cash equivalents Supplemental (1) Excludes ResCap related interest expense. See page 23 for details. (2) Excludes ResCap related charge. See page 23 for details. (3) Primarily bond exchange OID amortization expense used for calculating core pre - tax income As of 06/30/12. Primarily represents bond exchange OID amortization expense used for calculating core pre - tax income. OID Amortization Schedule ($ millions) $912 $132 $249 $176 Avg = $52/yr 2011 2012 2013 2014 2015 and thereafter Remaining Actual $336
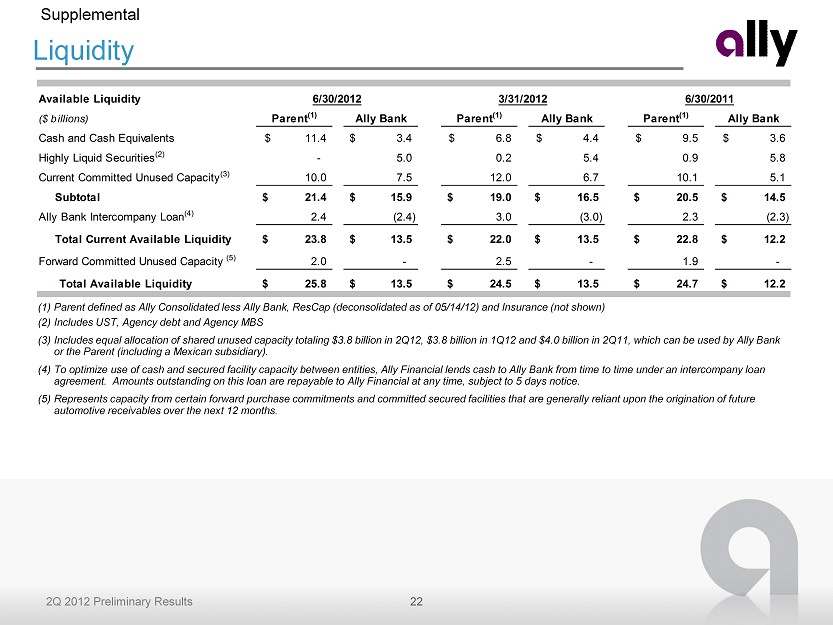
22 2Q 2012 Preliminary Results Liquidity Supplemental (1) Parent defined as Ally Consolidated less Ally Bank, ResCap (deconsolidated as of 05/14/12) and Insurance (not shown) (2) Includes UST, Agency debt and Agency MBS (3) Includes equal allocation of shared unused capacity totaling $3.8 billion in 2Q12, $3.8 billion in 1Q12 and $4.0 billion in 2 Q11 , which can be used by Ally Bank or the Parent (including a Mexican subsidiary). (4) To optimize use of cash and secured facility capacity between entities, Ally Financial lends cash to Ally Bank from time to time un der an intercompany loan agreement. Amounts outstanding on this loan are repayable to Ally Financial at any time, subject to 5 days notice. (5) Represents capacity from certain forward purchase commitments and committed secured facilities that are generally reliant upo n t he origination of future automotive receivables over the next 12 months . Available Liquidity 6/30/2012 3/31/2012 6/30/2011 ($ billions) Parent (1) Ally Bank Parent (1) Ally Bank Parent (1) Ally Bank Cash and Cash Equivalents 11.4$ 3.4$ 6.8$ 4.4$ 9.5$ 3.6$ Highly Liquid Securities (2) - 5.0 0.2 5.4 0.9 5.8 Current Committed Unused Capacity (3) 10.0 7.5 12.0 6.7 10.1 5.1 Subtotal 21.4$ 15.9$ 19.0$ 16.5$ 20.5$ 14.5$ Ally Bank Intercompany Loan (4) 2.4 (2.4) 3.0 (3.0) 2.3 (2.3) SubtotalTotal Current Available Liquidity 23.8$ 13.5$ 22.0$ 13.5$ 22.8$ 12.2$ Forward Committed Unused Capacity (5) 2.0 - 2.5 - 1.9 - Total Available Liquidity 25.8$ 13.5$ 24.5$ 13.5$ 24.7$ 12.2$
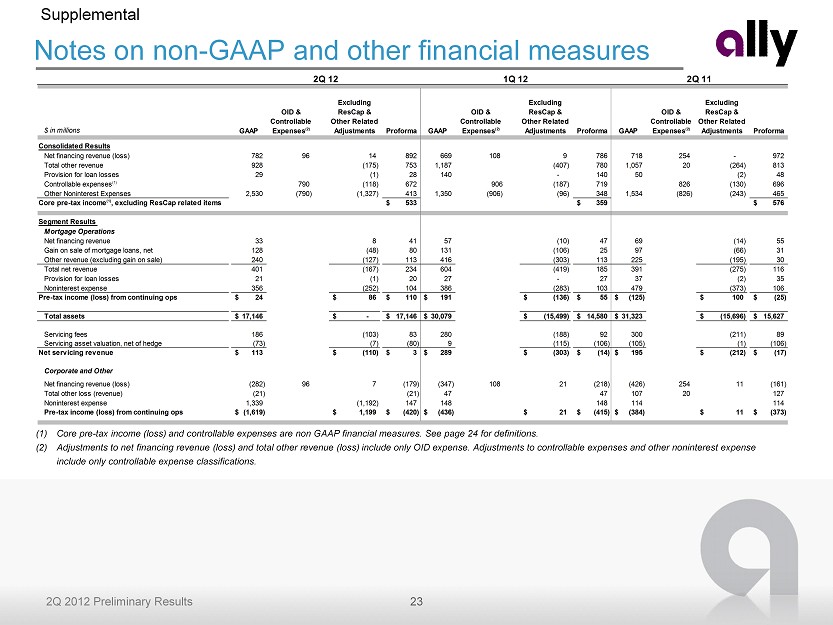
23 2Q 2012 Preliminary Results Notes on non - GAAP and other financial measures Supplemental (1) Core pre - tax income (loss) and controllable expenses are non GAAP financial measures. See page 24 for definitions. (2) Adjustments to net financing revenue (loss) and total other revenue (loss) include only OID expense. Adjustments to controlla ble expenses and other noninterest expense include only controllable expense classifications. $ in millions GAAP OID & Controllable Expenses(2) Excluding ResCap & Other Related Adjustments Proforma GAAP OID & Controllable Expenses(2) Excluding ResCap & Other Related Adjustments Proforma GAAP OID & Controllable Expenses(2) Excluding ResCap & Other Related Adjustments Proforma Consolidated Results Net financing revenue (loss) 782 96 14 892 669 108 9 786 718 254 - 972 Total other revenue 928 (175) 753 1,187 (407) 780 1,057 20 (264) 813 Provision for loan losses 29 (1) 28 140 - 140 50 (2) 48 Controllable expenses(1) 790 (118) 672 906 (187) 719 826 (130) 696 Other Noninterest Expenses 2,530 (790) (1,327) 413 1,350 (906) (96) 348 1,534 (826) (243) 465 Core pre-tax income(1), excluding ResCap related items 533$ 359$ 576$ Segment Results Mortgage Operations Net financing revenue 33 8 41 57 (10) 47 69 (14) 55 Gain on sale of mortgage loans, net 128 (48) 80 131 (106) 25 97 (66) 31 Other revenue (excluding gain on sale) 240 (127) 113 416 (303) 113 225 (195) 30 Total net revenue 401 (167) 234 604 (419) 185 391 (275) 116 Provision for loan losses 21 (1) 20 27 - 27 37 (2) 35 Noninterest expense 356 (252) 104 386 (283) 103 479 (373) 106 Pre-tax income (loss) from continuing ops 24$ 86$ 110$ 191$ (136)$ 55$ (125)$ 100$ (25)$ Total assets 17,146$ -$ 17,146$ 30,079$ (15,499)$ 14,580$ 31,323$ (15,696)$ 15,627$ Servicing fees 186 (103) 83 280 (188) 92 300 (211) 89 Servicing asset valuation, net of hedge (73) (7) (80) 9 (115) (106) (105) (1) (106) Net servicing revenue 113$ (110)$ 3$ 289$ (303)$ (14)$ 195$ (212)$ (17)$ Corporate and Other Net financing revenue (loss) (282) 96 7 (179) (347) 108 21 (218) (426) 254 11 (161) Total other loss (revenue) (21) (21) 47 47 107 20 127 Noninterest expense 1,339 (1,192) 147 148 148 114 114 Pre-tax income (loss) from continuing ops (1,619)$ 1,199$ (420)$ (436)$ 21$ (415)$ (384)$ 11$ (373)$ 2Q 12 2Q 111Q 12
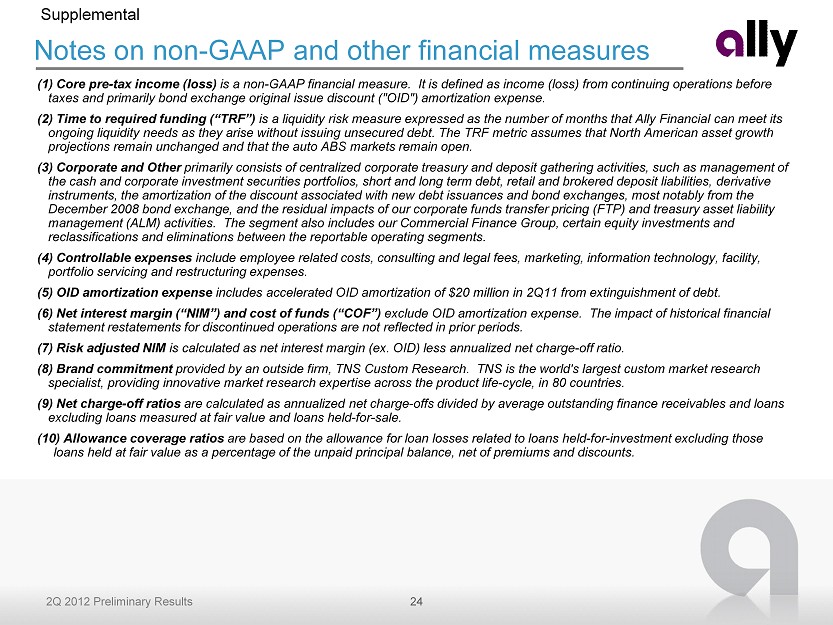
24 2Q 2012 Preliminary Results Notes on non - GAAP and other financial measures Supplemental (1) Core pre - tax income (loss) is a non - GAAP financial measure. It is defined as income (loss) from continuing operations before taxes and primarily bond exchange original issue discount ("OID") amortization expense. (2) Time to required funding (“TRF”) is a liquidity risk measure expressed as the number of months that Ally Financial can meet its ongoing liquidity needs as they arise without issuing unsecured debt. The TRF metric assumes that North American asset growth projections remain unchanged and that the auto ABS markets remain open. (3) Corporate and Other primarily consists of centralized corporate treasury and deposit gathering activities, such as management of the cash and corporate investment securities portfolios, short and long term debt, retail and brokered deposit liabilities, d eri vative instruments, the amortization of the discount associated with new debt issuances and bond exchanges, most notably from the December 2008 bond exchange, and the residual impacts of our corporate funds transfer pricing (FTP) and treasury asset liabil ity management (ALM) activities. The segment also includes our Commercial Finance Group, certain equity investments and reclassifications and eliminations between the reportable operating segments. (4) Controllable expenses include employee related costs, consulting and legal fees, marketing, information technology, facility, portfolio servicing and restructuring expenses. (5) OID amortization expense includes accelerated OID amortization of $20 million in 2Q11 from extinguishment of debt. (6) Net interest margin (“NIM”) and cost of funds (“COF”) exclude OID amortization expense. The impact of historical financial statement restatements for discontinued operations are not reflected in prior periods . (7) Risk adjusted NIM is calculated as net interest margin (ex. OID) less annualized net charge - off ratio. (8) Brand commitment provided by an outside firm, TNS Custom Research. TNS is the world's largest custom market research specialist, providing innovative market research expertise across the product life - cycle, in 80 countries. (9) Net charge - off ratios are calculated as annualized net charge - offs divided by average outstanding finance receivables and loans excluding loans measured at fair value and loans held - for - sale. (10) Allowance coverage ratios are based on the allowance for loan losses related to loans held - for - investment excluding those loans held at fair value as a percentage of the unpaid principal balance, net of premiums and discounts.