Attached files
| file | filename |
|---|---|
| 8-K - FORM 8-K Q2 RE SUPPLEMENT - Alexander & Baldwin, Inc. | form8k.htm |
ALEXANDER & BALDWIN, INC.’S REAL ESTATE SUPPLEMENT UPDATE As of and for the Quarters Ended June 30, 2012 and 2011 (Unaudited)
This periodic Supplement Update is designed to provide current and potential shareholders of Alexander & Baldwin, Inc. with additional information regarding the Company’s Real Estate operating segments. This information is supplemental to and does not replace the information provided to shareholders in the Company’s periodic filings with the Securities and Exchange Commission. This second quarter Supplement updates the following tables in the Company’s Real Estate Supplement as of and for the quarters and years ended December 31, 2011 and 2010: Table 5: Property Detail – Hawaii Improved Properties – Most Recent Quarter Table 7: Property Detail – Mainland Improved Properties – Most Recent Quarter Table 9: Comparable Percent Occupancy Data by Geographic Region and Asset Class – Most Recent Quarter Table 11: Weighted Average Gross Leasable Area by Geographic Region and Asset Class – Most Recent Quarter Table 13: Occupancy Analysis Trend – Last Five Quarters Table 14: Real Estate Leasing Cash Net Operating Income (NOI) – Most Recent Quarter Table 16: Real Estate Leasing Same Store Cash NOI – Most Recent Quarter Table 19: 2011 and 2010 Improved Property Portfolio Acquisitions/Dispositions Table numbers used in this Update correspond with table numbers used in the full-year Supplement. The information contained in this Supplement Update is unaudited and should be read in conjunction with the Company’s Real Estate Supplement as of and for the quarters and years ended December 31, 2011 and 2010, and quarterly and annual reports and other filings with the Securities and Exchange Commission. Feedback and suggestions regarding the contents of this Supplement Update from the investing audience are welcomed, and should be directed to Suzy P. Hollinger, Director, Investor Relations, via telephone at (808) 525-8422 or via email to shollinger@abinc.com. About This Supplement Update
Alexander & Baldwin, Inc. │Real Estate Supplement Update INDEX TO REAL ESTATE SUPPLEMENT UPDATE (Unaudited) As of and for the Quarters Ended June 30, 2012 and 2011 1 Forward-Looking Statements 2 Basis of Presentation 2 Real Estate Leasing Segment – Asset Descriptions and Statistics 3 Property Detail – Hawaii Improved Properties – Most Recent Quarter (Table 5) 3 Property Detail – Mainland Improved Properties – Most Recent Quarter (Table 7) 4 Comparable Percent Occupancy Data by Geographic Region and Asset Class (Table 9) 5 Weighted Average Gross Leasable Area by Geographic Region and Asset Class (Table 11) 5 Occupancy Analysis Trend – Last Five Quarters (Table 13) 5 Real Estate Leasing Cash Net Operating Income (NOI) (Table 14) 6 Real Estate Leasing Same Store Cash NOI (Table 16) 6 Statement on Management’s Use of Non-GAAP Financial Measures 7 Reconciliation of Real Estate Leasing Operating Profit to Cash NOI and Same Store Cash NOI 7 Portfolio Acquisitions and Dispositions 8 2012 and 2011 Improved Property Portfolio Acquisitions/Dispositions (Table 19) 8
This Supplement Update contains certain forward-looking statements, such as forecasts and projections of the Company’s future performance or statements of management’s plans and objectives. These statements are “forward-looking” statements as that term is defined in the Private Securities Litigation Reform Act of 1995. Except for historical information contained in this Supplement Update, such communications contain forward-looking statements. These include, for example, all references to current or future years. New risk factors emerge from time to time and it is not possible for the Company to predict all such risk factors, nor can it assess the impact of all such risk factors on the Company’s business or the extent to which any factor, or combination of factors, may cause actual results to differ materially from those contained in any forward-looking statements. Accordingly, forward-looking statements cannot be relied upon as a guarantee of future results and involve a number of risks and uncertainties that could cause actual results to differ materially from those projected in the statements, including, but not limited to the factors that are described on pages 20-39 of the Company’s Form 10 and in the Company’s other filings, including subsequent filings, with the Securities and Exchange Commission (“SEC”). The Company is not required, and undertakes no obligation, to revise or update forward-looking statements or any factors that may affect actual results, whether as a result of new information, future events, or circumstances occurring after the date of this report. Forward-Looking Statements The information contained in this Supplement Update does not purport to disclose all items required by accounting principles generally accepted in the United States of America (GAAP). The information contained in this Supplement Update is unaudited and should be read in conjunction with the Company’s Real Estate Supplement as of and for the quarters and years ended December 31, 2011 and 2010, and its Form 10, most recent 10-Q and other filings with the SEC. Basis of Presentation 2
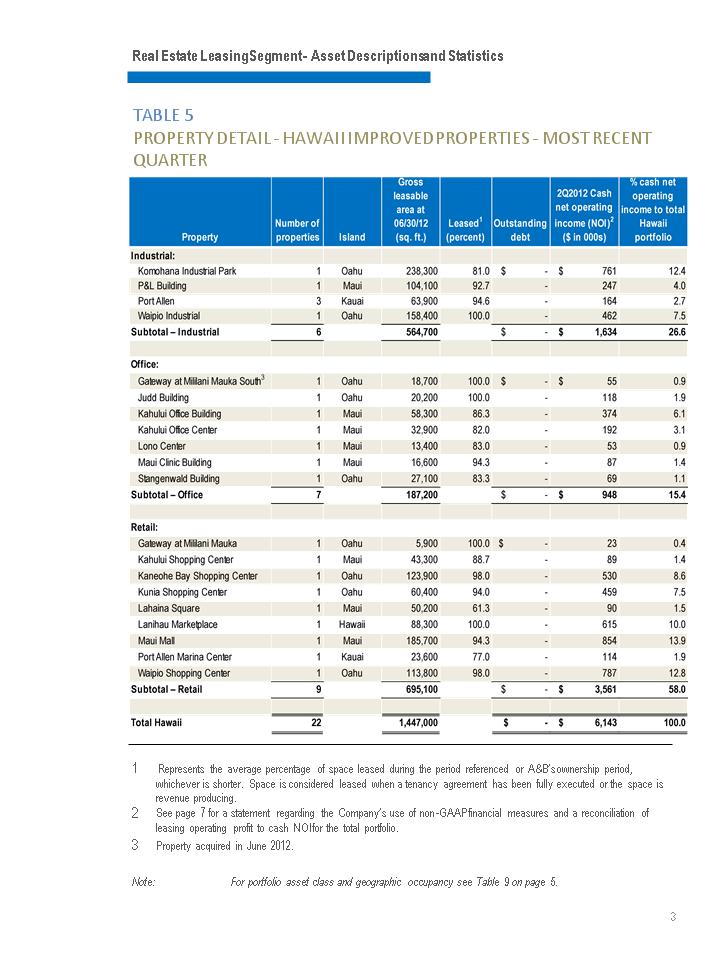
Real Estate Leasing Segment – Asset Descriptions and Statistics TABLE 5 PROPERTY DETAIL - HAWAII IMPROVED PROPERTIES – MOST RECENT QUARTER 1 Represents the average percentage of space leased during the period referenced or A&B’s ownership period, whichever is shorter. Space is considered leased when a tenancy agreement has been fully executed or the space is revenue producing. 3 2 See page 7 for a statement regarding the Company’s use of non-GAAP financial measures and a reconciliation of leasing operating profit to cash NOI for the total portfolio. Note: For portfolio asset class and geographic occupancy see Table 9 on page 5. 3 Property acquired in June 2012.
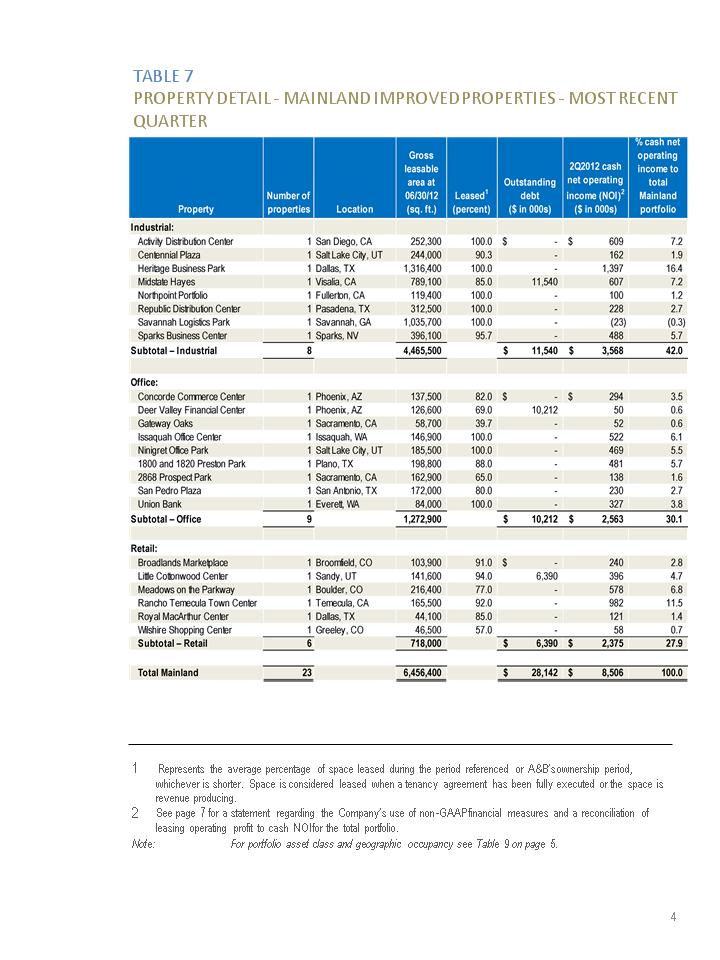
TABLE 7 PROPERTY DETAIL – MAINLAND IMPROVED PROPERTIES – MOST RECENT QUARTER 4 1 Represents the average percentage of space leased during the period referenced or A&B’s ownership period, whichever is shorter. Space is considered leased when a tenancy agreement has been fully executed or the space is revenue producing. 2 See page 7 for a statement regarding the Company’s use of non-GAAP financial measures and a reconciliation of leasing operating profit to cash NOI for the total portfolio. Note: For portfolio asset class and geographic occupancy see Table 9 on page 5.
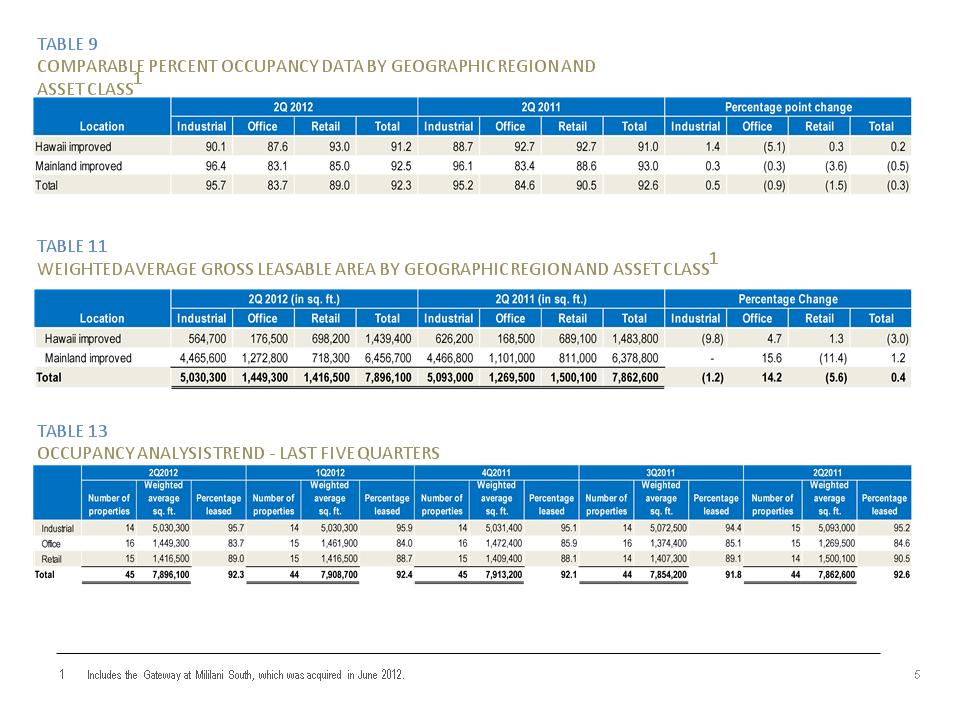
TABLE 9 COMPARABLE PERCENT OCCUPANCY DATA BY GEOGRAPHIC REGION AND ASSET CLASS1 TABLE 11 WEIGHTED AVERAGE GROSS LEASABLE AREA BY GEOGRAPHIC REGION AND ASSET CLASS1 TABLE 13 OCCUPANCY ANALYSIS TREND – LAST FIVE QUARTERS 5 1 Includes the Gateway at Mililani South, which was acquired in June 2012.
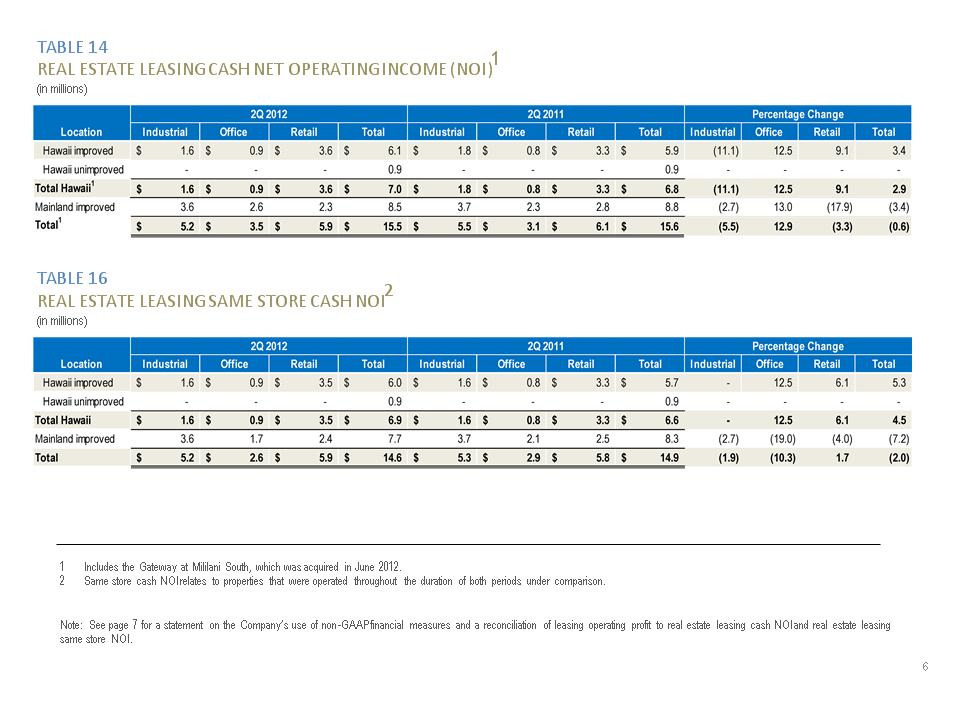
TABLE 14 REAL ESTATE LEASING CASH NET OPERATING INCOME (NOI)1 (in millions) TABLE 16 REAL ESTATE LEASING SAME STORE CASH NOI2 (in millions) 6 1 Includes the Gateway at Mililani South, which was acquired in June 2012. 2 Same store cash NOI relates to properties that were operated throughout the duration of both periods under comparison. Note: See page 7 for a statement on the Company’s use of non-GAAP financial measures and a reconciliation of leasing operating profit to real estate leasing cash NOI and real estate leasing same store NOI.
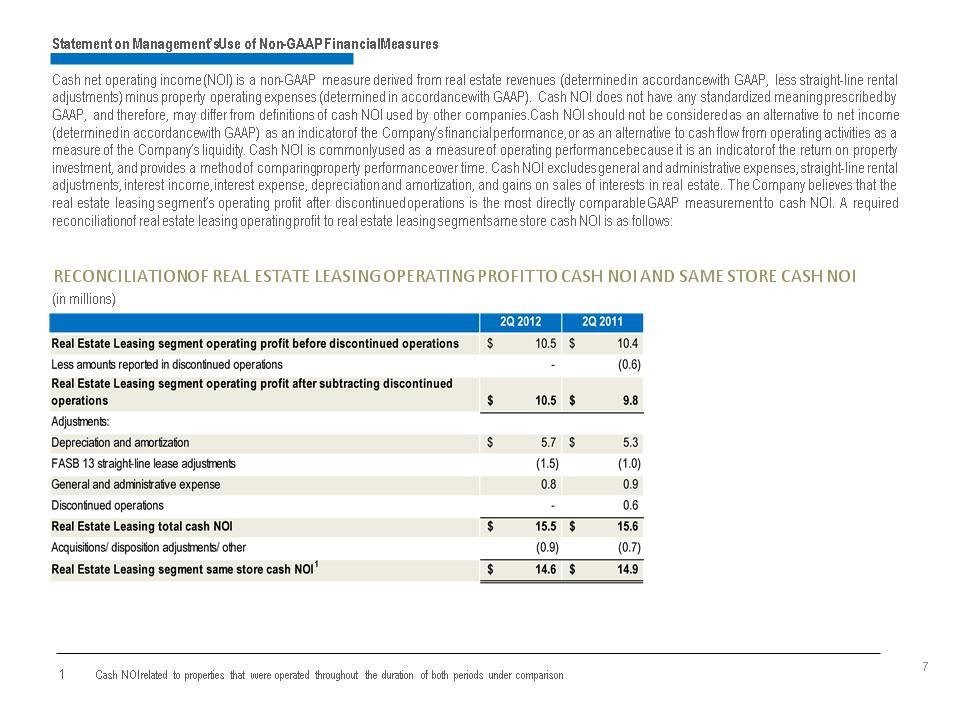
RECONCILIATION OF REAL ESTATE LEASING OPERATING PROFIT TO CASH NOI AND SAME STORE CASH NOI (in millions) Statement on Management’s Use of Non-GAAP Financial Measures Cash net operating income (NOI) is a non-GAAP measure derived from real estate revenues (determined in accordance with GAAP, less straight-line rental adjustments) minus property operating expenses (determined in accordance with GAAP). Cash NOI does not have any standardized meaning prescribed by GAAP, and therefore, may differ from definitions of cash NOI used by other companies. Cash NOI should not be considered as an alternative to net income (determined in accordance with GAAP) as an indicator of the Company’s financial performance, or as an alternative to cash flow from operating activities as a measure of the Company’s liquidity. Cash NOI is commonly used as a measure of operating performance because it is an indicator of the return on property investment, and provides a method of comparing property performance over time. Cash NOI excludes general and administrative expenses, straight-line rental adjustments, interest income, interest expense, depreciation and amortization, and gains on sales of interests in real estate. The Company believes that the real estate leasing segment’s operating profit after discontinued operations is the most directly comparable GAAP measurement to cash NOI. A required reconciliation of real estate leasing operating profit to real estate leasing segment same store cash NOI is as follows: 1 Cash NOI related to properties that were operated throughout the duration of both periods under comparison 7
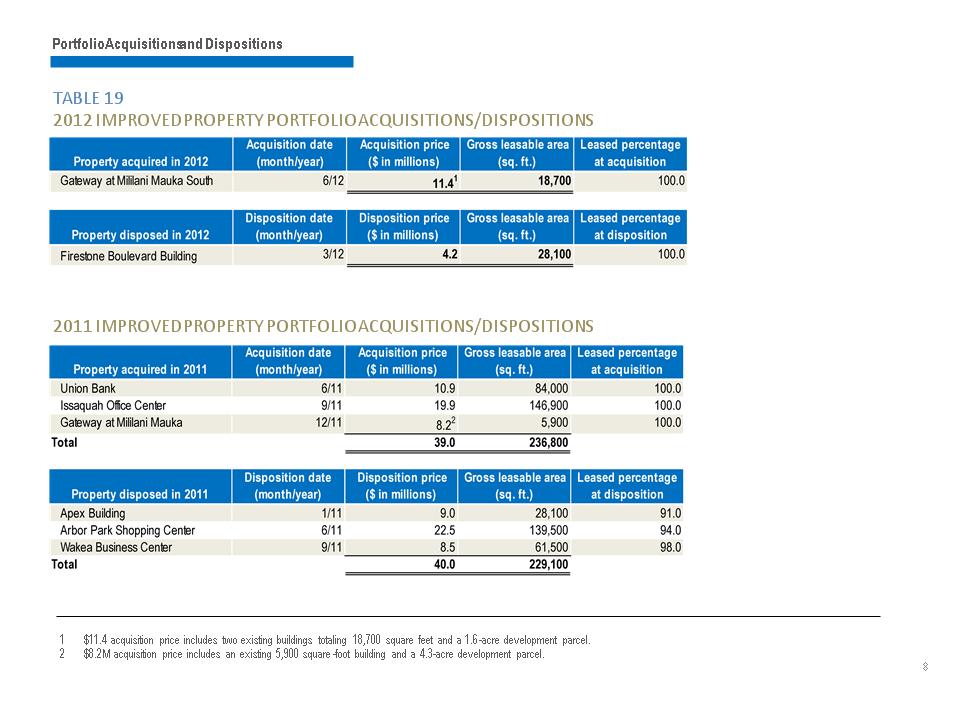
TABLE 19 2012 IMPROVED PROPERTY PORTFOLIO ACQUISITIONS/DISPOSITIONS Portfolio Acquisitions and Dispositions 2011 IMPROVED PROPERTY PORTFOLIO ACQUISITIONS/DISPOSITIONS 1 $11.4 acquisition price includes two existing buildings totaling 18,700 square feet and a 1.6-acre development parcel. 2 $8.2M acquisition price includes an existing 5,900 square-foot building and a 4.3-acre development parcel. 8