Attached files
| file | filename |
|---|---|
| 8-K - FORM 8-K - People's United Financial, Inc. | d387744d8k.htm |
 Investor Presentation
July/August 2012
Investor Contact:
Peter Goulding, CFA
203-338-6799
peter.goulding@peoples.com
Exhibit 99.1 |
 1
Certain statements contained in this release are forward-looking in nature. These include all
statements about People's United Financial's plans, objectives, expectations and other
statements that are not historical facts, and usually use words such as "expect,"
"anticipate," "believe" and similar expressions. Such statements represent
management's current beliefs, based upon information available at the time the statements are
made, with regard to the matters addressed. All forward-looking statements are subject to
risks and uncertainties that could cause People's United Financial's actual results or financial condition
to differ materially from those expressed in or implied by such statements. Factors of particular
importance to People’s United Financial include, but are not limited to: (1) changes in
general, national or regional economic conditions; (2) changes in interest rates; (3) changes
in loan default and charge-off rates; (4) changes in deposit levels; (5) changes in levels
of income and expense in non-interest income and expense related activities; (6)
residential mortgage and secondary market activity; (7) changes in accounting and regulatory
guidance applicable to banks; (8) price levels and conditions in the public securities markets
generally; (9) competition and its effect on pricing, spending, third-party relationships
and revenues; (10) the successful integration of acquired companies; and (11) changes in regulation
resulting from or relating to financial reform legislation. People's United Financial does not
undertake any obligation to update or revise any forward-looking statements, whether as a
result of new information, future events or otherwise.
Forward Looking Statement |
 2
Corporate Overview
Snapshot, as of June 30, 2012
People’s United Financial, Inc.
NASDAQ (PBCT)
Headquarters:
Bridgeport, CT
Chief Executive Officer:
Jack Barnes
Chief Financial Officer:
Kirk Walters
Market Capitalization (7/26/12):
$4.0 billion
Assets:
$28.2 billion
Loans:
$20.6 billion
Deposits:
$21.5 billion
Branches:
416
ATMs:
634
Standalone ATMs:*
83
Founded:
1842
* Includes 25 ATMs in Stop & Shop locations where a branch is not
present. |
 3
Compelling Investment Opportunity
High quality Northeast footprint characterized by wealth and population density
Leading
market
position
in
the
best
commercial
banking
market
in
the
US
Significant
growth
runway
within
existing
markets
–
expanding
in
two
of
the
largest MSAs in the US (New York City, #1, Boston, #10)
Initial presence established via de novo expansion and acquisitions
Dividend yield of 5+%
Ability
to
maintain
pristine
credit
quality
–
no
credit
“events”
Improving profitability
High levels of liquidity
Capital deployment (organic growth, dividends, share repurchases, M&A)
– TCE/TA 11.5% vs. ~8.0% for peers |
 4
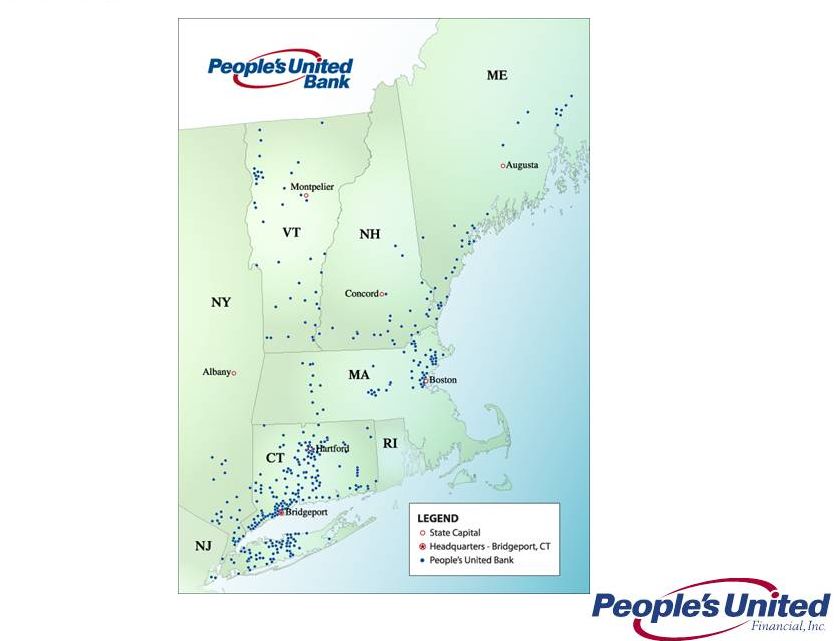
Branch Map |
 5
Strong Deposit Market Positions
Connecticut
Massachusetts
Vermont
New York
New Hampshire
Maine
#1 in Fairfield County, CT, 65 branches, $5.7BN, 17.8% market share
#2 in Essex County, MA, 21 branches, $1.9BN, 11.2% market share
#5 deposit market share in New England
Leading
market
position
in
the
best
commercial
banking
market
in
the
US
Source: SNL Financial
Branches
$BN
%
1
B of A
158
24.1
24.3
2
Webster
124
11.4
11.5
3
People's United
166
10.1
10.2
4
Wells Fargo
75
8.0
8.1
5
TD Bank
81
5.5
5.5
6
First Niagara
82
4.9
5.0
7
JPM Chase
55
4.0
4.1
8
Citi
20
2.8
2.9
9
Liberty
45
2.7
2.7
10
RBS
50
2.4
2.5
Branches
$BN
%
1
B of A
269
52.5
22.8
2
RBS
254
28.4
12.3
3
Santander
228
15.4
6.7
4
TD Bank
158
9.7
4.2
5
Eastern Bank
94
6.2
2.7
6
Independent Bank
78
4.1
1.8
7
People's United
58
3.5
1.5
8
Middlesex
31
3.4
1.5
9
Boston Private
12
2.7
1.2
10
Salem Five
30
2.2
1.0
Branches
$BN
%
1
People's United
45
2.4
22.4
2
TD Bank
37
2.3
21.5
3
Merchants
33
1.1
10.1
4
RBS
21
0.7
6.9
5
KeyCorp
13
0.7
6.5
6
Northfield
13
0.5
4.7
7
Community
14
0.4
3.9
8
Union
13
0.4
3.4
9
Passumpsic
7
0.3
3.0
10
Berkshire Hills
7
0.3
3.0
Branches
$BN
%
1
JPM Chase
850
351.2
35.7
2
B of A
369
65.7
6.7
3
Citi
261
64.6
6.6
4
HSBC
174
53.0
5.4
5
Capital One
287
35.9
3.7
6
M&T
269
24.1
2.4
7
TD Bank
213
20.4
2.1
8
Wells Fargo
86
19.2
2.0
9
KeyCorp.
270
18.3
1.9
10
First Niagara
229
17.1
1.7
37
People's United
96
2.6
0.3
Branches
$BN
%
1
RBS
81
6.8
27.8
2
TD Bank
73
5.2
21.1
3
B of A
31
2.2
9.0
4
People's United
32
1.3
5.3
5
Merrimack
18
1.0
3.9
6
LSB Financial
23
0.9
3.6
7
Santander
20
0.8
3.4
8
NH Thrift
19
0.6
2.6
9
Northway
17
0.6
2.4
10
Centrix
6
0.6
2.4
Branches
$BN
%
1
TD Bank
56
12.5
40.6
2
KeyCorp
61
2.5
8.0
3
Camden National
51
1.9
6.2
4
Bangor Bancorp
58
1.8
6.0
5
B of A
20
1.3
4.2
6
First Bancorp
15
1.0
3.4
7
Machias
14
0.8
2.6
8
Bar Harbor
16
0.8
2.5
9
People's United
30
0.8
2.5
10
Norway
20
0.7
2.3 |
 6
Large and Attractive Markets
NYC-Northern NJ-LI
Population: 19.0MM
Median HH Income: $60,595
Businesses: 749,000
Population Density (#/sq miles): 2,058
Unemployment Rate (%): 9.3
$100K+ Households (%): 30.2
Boston, MA
Population: 4.6MM
Median HH Income: $67,887
Businesses: 186,000
Population Density (#/sq miles): 1,013
Unemployment Rate (%): 6.6
$100K+ Households (%): 33.2
Hartford, CT
Population: 1.2MM
Median HH Income: $64,098
Businesses: 50,000
Population Density (#/sq miles): 755
Unemployment Rate (%): 8.1
$100K+ Households (%): 30.0
Bridgeport-Stamford, CT
Population: 919,000
Median HH Income: $80,531
Businesses: 45,000
Population Density (#/sq miles): 1,097
Unemployment Rate (%): 7.7
$100K+ Households (%): 41.5
New Haven, CT
Population: 862,000
Median HH Income: $58,775
Businesses: 34,000
Population Density (#/sq miles): 1,000
Unemployment Rate (%): 8.4
$100K+ Households (%): 27.0
Burlington, VT
Population: 212,000
Median HH Income: $56,090
Businesses: 10,000
Population Density (#/sq miles): 141
Unemployment Rate (%): 4.3
$100K+ Households (%): 21.3
Notes: The current national unemployment rate is 8.3%
The current national population density is 88 (#/sq miles)
The population densities of NYC, Boston, Bridgeport and New Haven MSAs
are over ten times the national average |
 7
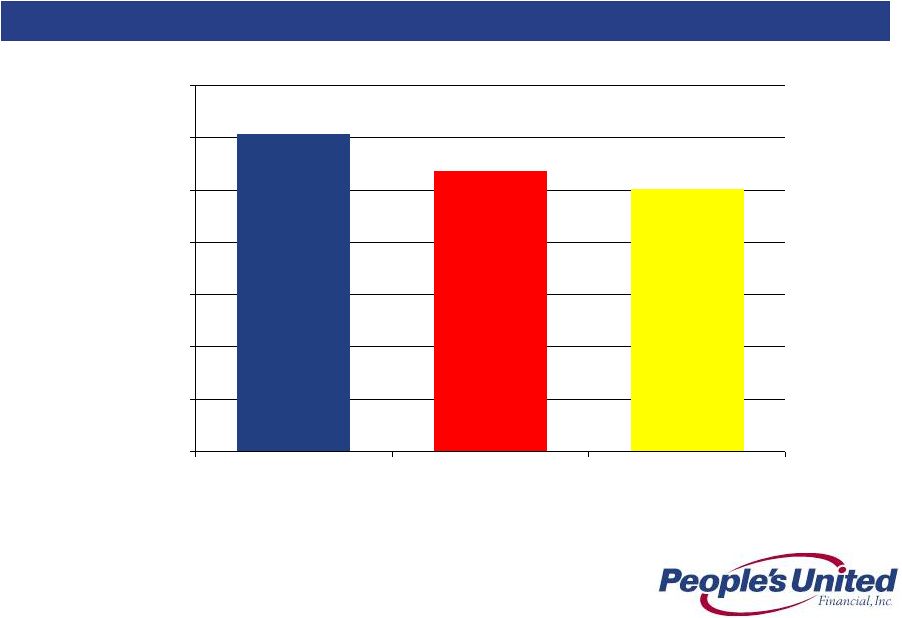
Strong Market Demographic Profile
Source: SNL Financial
2011 Weighted Average Median Household Income
$60,603
$53,648
$50,227
$0
$10,000
$20,000
$30,000
$40,000
$50,000
$60,000
$70,000
PBCT
Peer Median
US |
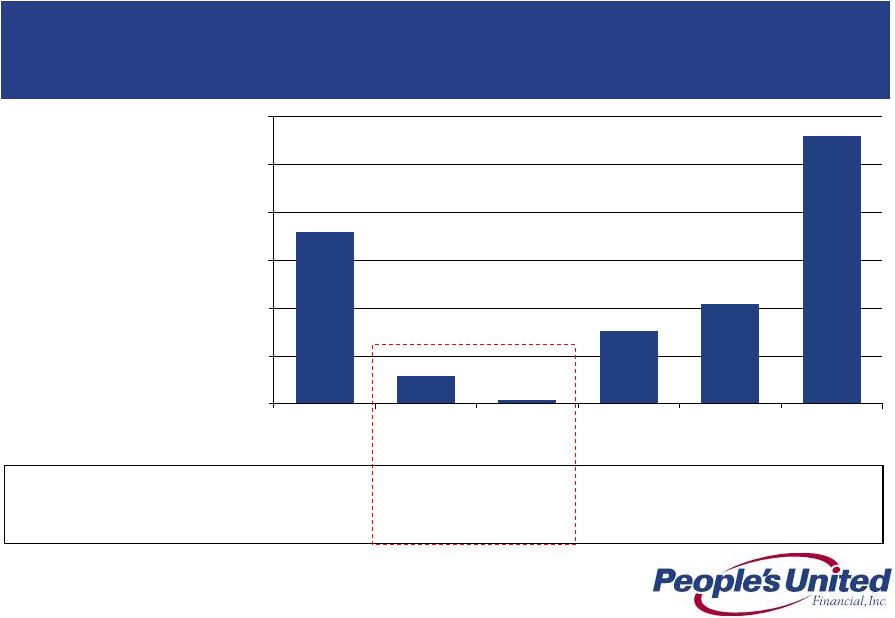 8
Total Deposits ($MM)
5,652
3,233
2,500
1,881
1,750
1,102
Market Total Deposits ($MM)
31,462
111,867
540,666
24,700
16,841
3,934
Branch Count
65
57
91
45
34
15
18.0
2.9
7.6
10.4
28.0
0.5
0.0
5.0
10.0
15.0
20.0
25.0
30.0
Bridgeport-
Stamford, CT
Boston, MA
NYC-Northern
NJ-LI
Hartford, CT
New Haven, CT
Burlington, VT
Deposit Market Share by MSA (%) *
We hold significant market share in several key northeast MSAs and are
building our presence in areas with substantial growth potential, such as
the Boston and New York City MSAs
Source: SNL Financial
* Excludes deposits from trust institutions and branches with over $750MM deposits
** Excludes five of the acquired Citizens branches located outside the NYC MSA
**
**
Large New Markets |
 9
Unique opportunity based on People’s United’s excellent in-store
branch banking track record, longstanding relationship with Stop & Shop
and strong traditional branch network in the market
–
In
each
of
the
past
14
years,
People’s
United
has
ranked
as
the
#1
in-store
branch
operator
in
the
US
*
–
Exclusive provider of banking services to Stop & Shop on Long Island, Southern
New York and Connecticut; 140 in-store branches
Strong traditional branch network is crucial for successful in-store branch
banking –
37 traditional branches on Long Island and Westchester County
–
Our traditional branches offer the full suite of services
–
Provides a lift to traffic in both in-store and traditional branches
–
Opportunity to bring average acquired in-store deposit balances up from $4MM to
our average in-store deposit balances of $29MM
Adds additional source of core deposit funding
–
Expected core deposit growth within acquired in-store branches and surrounding
traditional branches will help fund continued New York metro loan
growth Acquisition of Select Citizens Bank Branches
Transaction Rationale
* Source: SNL Financial. As measured by average deposits per in-store branch
among active banks with at least $500MM of in-store deposits Transaction deepens People’s
United’s presence on Long Island and in Westchester County |
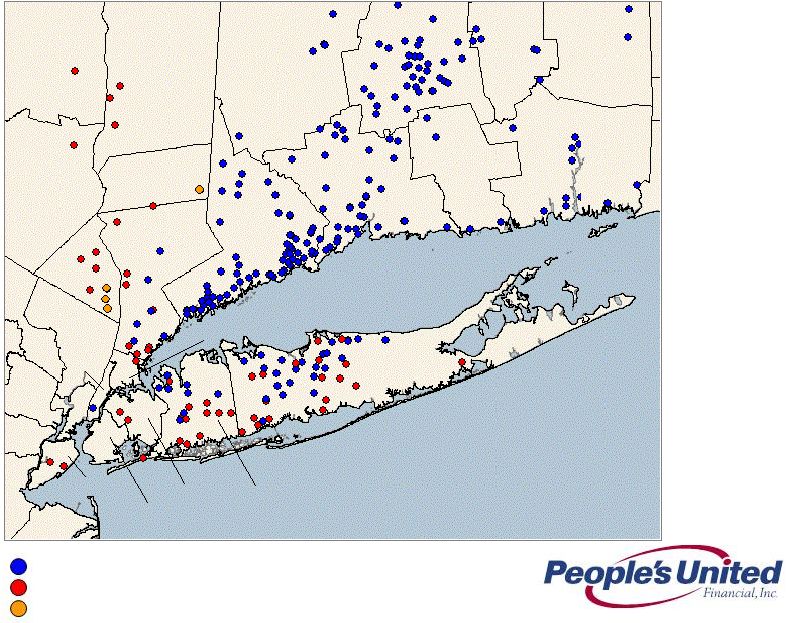 10
People’s United Bank branches (includes 39 traditional branches in NY)
Recently acquired, in-store branches (53)
Source: SNL Financial
Suffolk
Putnam
Dutchess
Ulster
Orange
Rockland
Westchester
Kings
Queens
Richmond
Nassau
Bronx
New York
Recently acquired, traditional branches (4)
Expanding Long Island, NY and Hudson Valley Footprint
Branch Map |
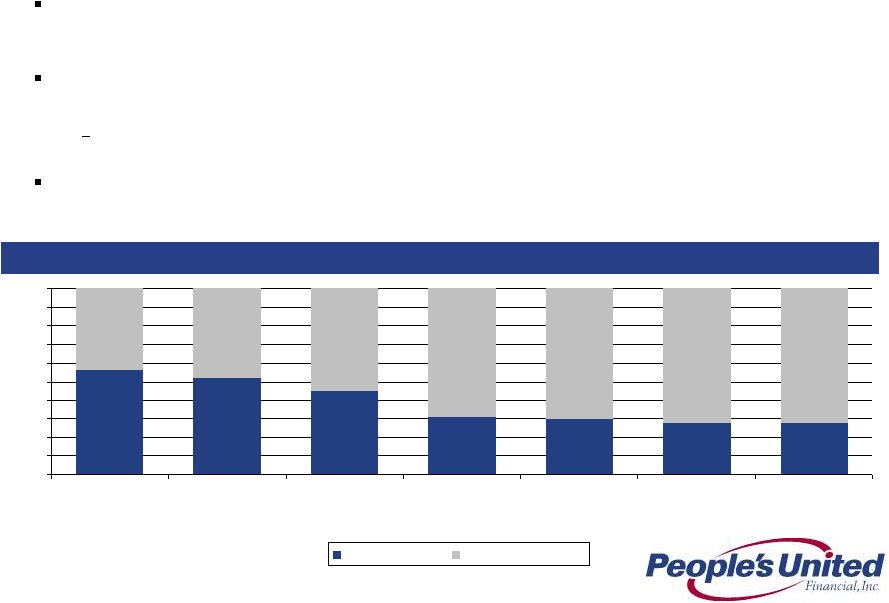 11
On average, in-store locations are open 37% more hours per week than traditional
branches (56 hours vs. 41 hours) but are 30% less expensive to operate
Employees at in-store locations are extensively trained and certified to sell
and support all the Bank’s products and services
Mortgages, Home Equity Loans, Business Loans and Investments
In 2011, CT in-store branches accounted for a significant portion of the new
branch business booked in the market
In-store Versus Traditional Branch Business
56%
52%
45%
31%
30%
28%
28%
44%
48%
55%
69%
70%
72%
72%
0%
10%
20%
30%
40%
50%
60%
70%
80%
90%
100%
Consumer
Checking Accounts
Opened
Savings Accounts
Opened
Business Checking
Accounts Opened
Home Equity
Loans
Mortgage Loans
Business Banking
Loans
Investment Sales
In-store Branches
Traditional Branches
In-store Versus Traditional Branches
Connecticut |
 12
Deposits Acquired
Source: Company financials; financial data as of 12/31/2011
Cost of Deposits: 0.59%
Total Deposits: $324MM
Acquisition of Select Citizens Bank Branches
Attractive Deposit Base
Demand
$52
16%
NOW
$71
22%
Savings
$78
25%
Money
Market
$70
21%
CD
$53
16% |
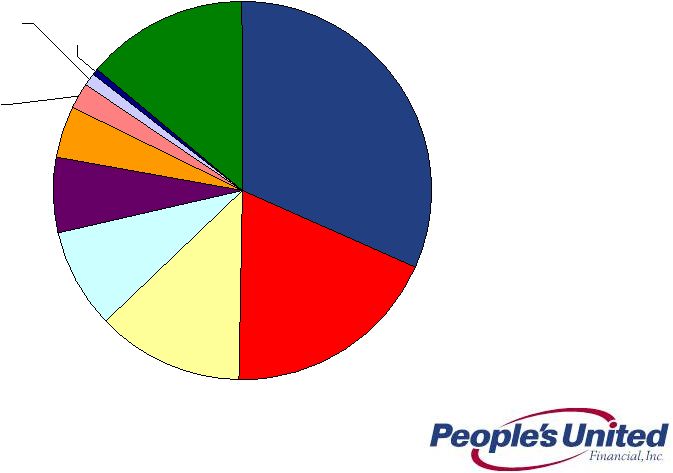
 13
2Q12 Total Loan Portfolio
$20.6 BN
Loans by Business Line
CRE
$6.6
31%
C&I
$4.8
22%
Residential
Mortgage
$3.8
19%
Home Equity &
Other
$2.2
11%
PCLC
$1.4
7%
PUEFC
$0.7
4%
Business Banking
$1.1
6% |
 14
Loans by Geography
Notes: Reporting is based on the collateral property address for the
following: SNE Residential Mortgage, Consumer
Home
equity,
Consumer
Other
and
CRE.
Reporting
is
based
on
borrower
address
for
the
following: C&I, Residential construction and NNE loans.
2Q12 Total Loan Portfolio
$20.6 BN
Excluding
equipment
finance loans,
~95% of our
2Q12 loan
portfolio is within
the Northeast
Connecticut
$6.5
32%
Massachusetts
$3.8
18%
New York
$2.6
12%
Vermont
$1.8
9%
Maryland
$0.1
1%
Maine
$0.9
4%
Pennsylvania
$0.2
1%
Other
$2.9
14%
New Jersey
$0.5
2%
New Hampshire
$1.3
7% |
 15
Continue to expand presence in the New York metro area
Completed the acquisition of 57 Citizens branches
Converted systems and rebranded all acquired Citizens branches over the
weekend
of
June
22
nd
New York metro footprint now includes approximately 100 branches
Added seasoned in-market lending professionals over the last year and a
half •
Five C&I lenders and two ABL professionals
Hired
three
senior
lenders
to
lead
our
New
York
metro
commercial
real
estate
lending efforts
Increased fee income generation particularly in cash management and
brokerage services
Repurchased 4.5 million shares, or $53.7 million, at a weighted average
price of $11.93 per share
Recent Initiatives
Second Quarter 2012 |
 16
Revenue Opportunities
Large new markets –
NYC and Boston MSAs
Under-represented asset classes ramping up
Asset-based lending: focused on in-footprint companies with sales of
$15MM-$250MM; credit needs range from $5MM-$25MM; $600BN market, 70%
of which is located in the Northeast Mortgage Warehouse lending: ~$700MM in
commitments, and $447MM in outstandings Multifamily: hiring talent in the New
York metro area, which is a $30BN annual market with a population of 18.9MM,
6.9MM housing units, and 3.4MM rental units Private Banking: hired senior
executive from mega-cap bank with ~20 years managing private banking in
the Northeast with initial focus on CT, metro New York and metro Boston
Enhancing wealth management offering
Proprietary asset allocation and risk management strategies are implemented with a
suite of external managers who represent our "best in class"
recommendations •
Proprietary asset allocation allows us to “rent”
intellectual capital –
no customer funds leave the bank
Hired executive from PNC as Senior Vice President and Chief Investment Officer
Increasing momentum in fee income penetration
Commercial
insurance:
revamped
systems
and
combined
all
agencies
into
a
single
entity; focused on our deep commercial customer base as well as the education
sector Hired executive from TD to lead cash management business unit
Growing merchant and payroll services |
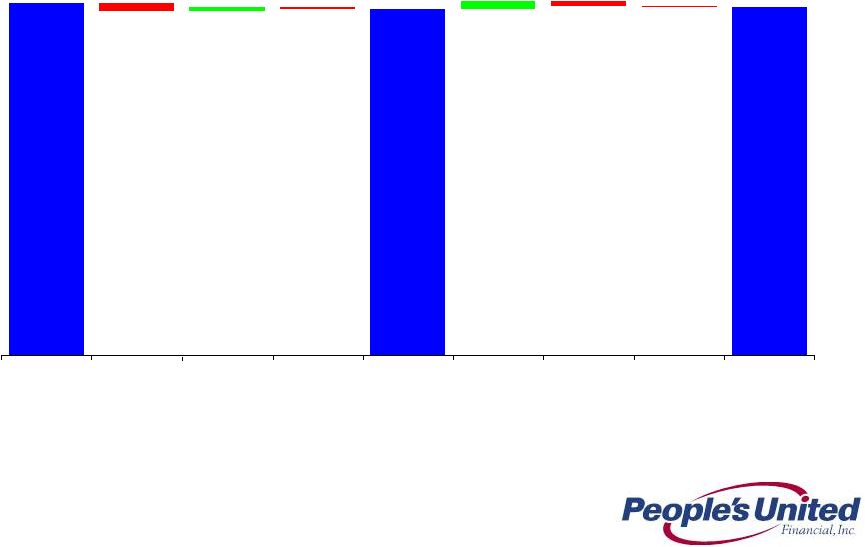
 17
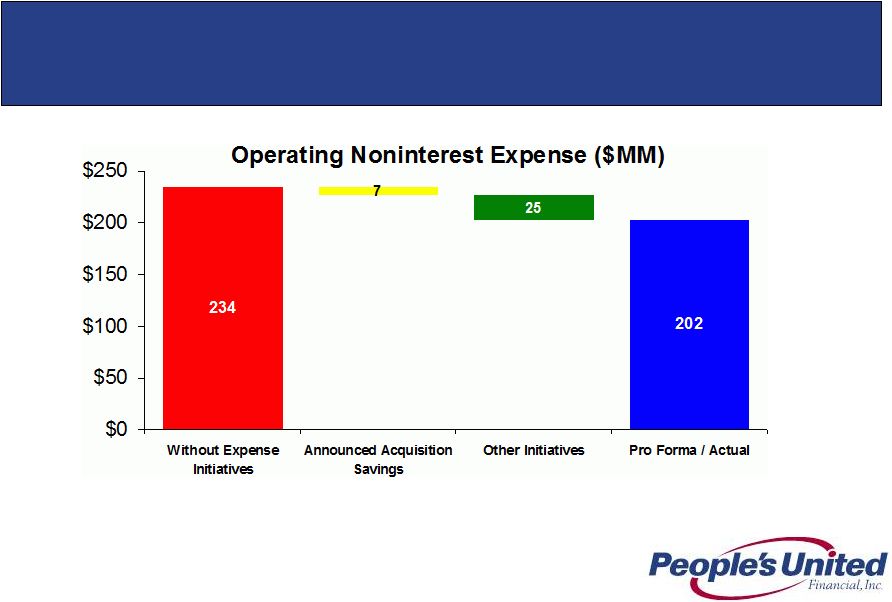
Expense Opportunities
Estimated Cost Savings Analysis
Our Q2 2012 operating expense base of $202mm reflects $32MM ($128MM
annualized) savings from successfully-executed expense initiatives
Source: SNL Financial
Note: “Pro Forma / Actual”
represents PBCT operating noninterest expense and the actual expenses at the acquired
institutions. Target acquisition costs fall away as the acquisitions are completed.
“Without Expense Initiatives”
represents PBCT operating noninterest expense and the actual expenses at the acquired
institutions in 4Q09, and then applies the peer median expense growth rate in each subsequent
quarter. 200
210
220
230
240
4Q09
1Q10
2Q10
3Q10
4Q10
1Q11
2Q11
3Q11
4Q11
1Q12
2Q12
Pro Forma / Actual
Without Expense Initiatives
$32MM
Cost
Savings
Operating Noninterest Expense ($MM) |
 18
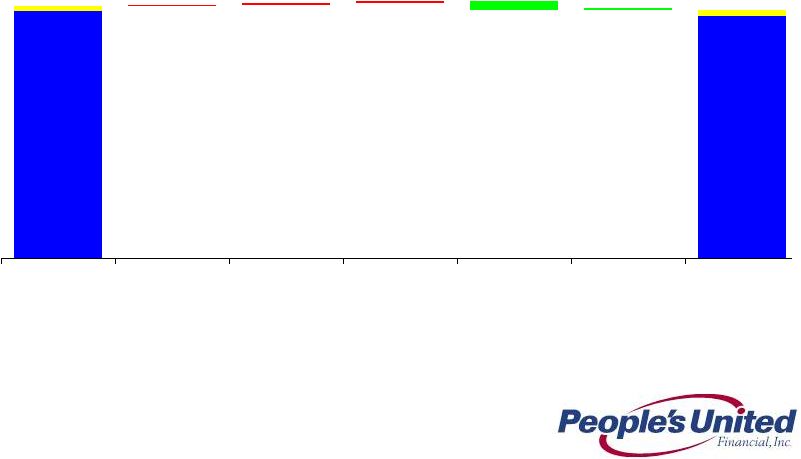
Expense Opportunities
Estimated Cost Savings Analysis
Source: SNL Financial
Note: “Pro Forma / Actual”
represents PBCT operating noninterest expense and the actual expenses at the acquired
institutions. Target acquisition costs fall away as the acquisitions are completed.
“Without Expense Initiatives”
represents PBCT operating noninterest expense and the actual expenses at the acquired
institutions in 4Q09, and then applies the peer median expense growth rate in each subsequent
quarter. The $32MM in quarterly cost reductions is attributable to efforts related to
acquisition
cost
savings
and
other
initiatives,
such
as
freezing
the
defined
benefit pension plan |
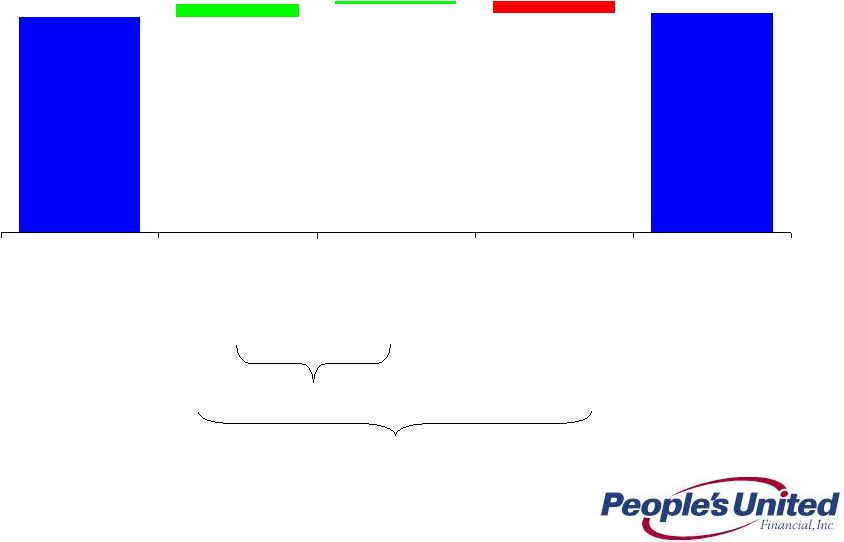
 19
Non-Operating
Operating
Total
208.6
205.7
0.6
205.6
0.7
1.5
(5.0)
(0.7)
202.1
3.0
3.6
1Q 2012
Non-Operating
Citizens
Operating
Professional &
Outside Svc
Comp &
Benefits
Other
2Q 2012
Non-Interest Expense
Linked Quarter Change
(in $ millions) |
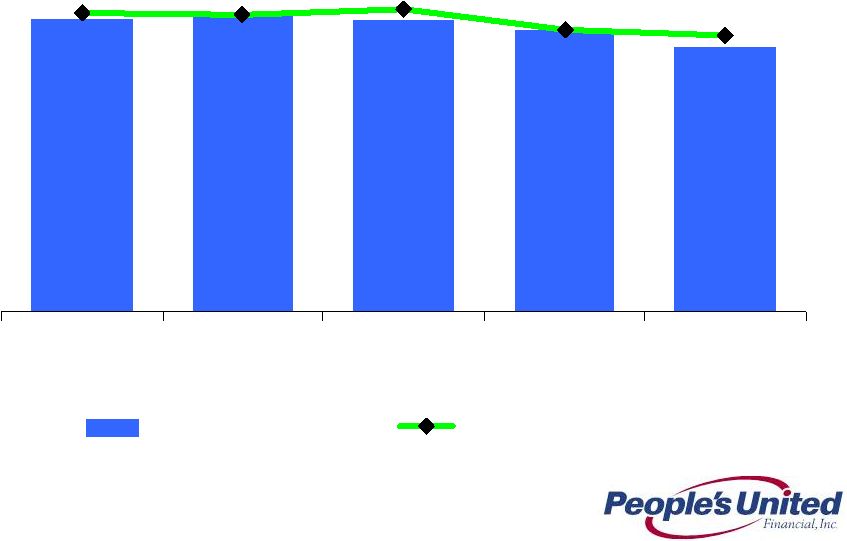
 20
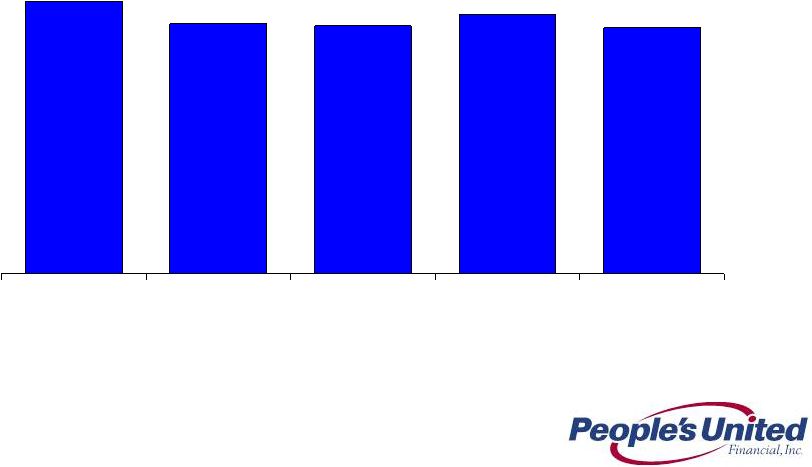
Efficiency Ratio
Last Five Quarters
64.9%
62.0%
61.8%
63.2%
61.5%
2Q 2011
3Q 2011
4Q 2011
1Q 2012
2Q 2012 |
 21
EMOC has been fully operational since November 2011
Three person committee comprised of the CFO, Chief Administrative Officer and
Chief HR Officer EMOC oversees PBCT’s noninterest expense management,
implements strategies to ensure attainment of expense management targets and
oversees revenue initiatives that require expenditures
Provides a horizontal view of the organization
Expense Management Units (EMUs) established to facilitate EMOC functions
Defined EMUs include:
•
Technology
•
Operations
•
Real Estate Services
Spending requests above $25,000 are submitted by EMU owners for approval
Staffing models, staffing replacements and additions for mid-level positions and
above require approval by the Committee
Introduction to EMOC
Expense Management Oversight Committee (EMOC)
•
Employment/Benefits
•
Marketing
•
Regulatory/Institutional
•
Depreciation/Equipment
•
Decentralized
•
Intangible Amortization |
 22
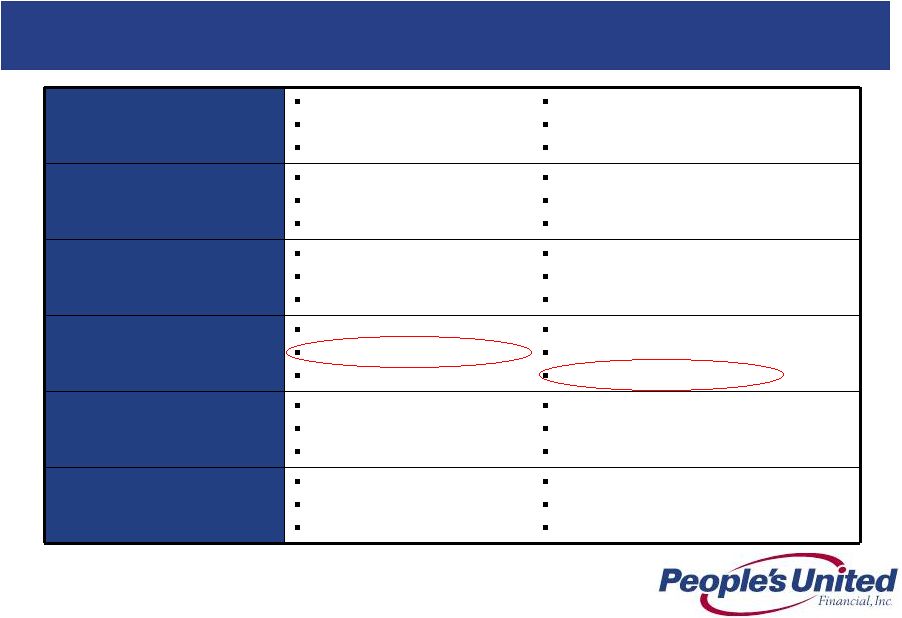
Acquired Citizens branches will add approximately $7.8MM of non-interest expenses
on a quarterly basis
In addition to the initiatives below, we are taking a longer-term view of cost
planning, which will help us reduce the pro forma cost base
Recent Initiatives
Cost Reduction
Initiatives
Status
Benchmarking business unit performance
Benchmarking initiatives complete
Right-sized our employee base following acquisitions
FTE reduced by 276, even after staffing for revenue
initiatives
Consolidating 15 branches
Consolidated 14 branches, completed sale of 1 branch
Actively marketing unused facilities
20 properties identified (14 owned, 6 leased); 50% of cost
savings anticipated from 3 locations
Identify IT related savings
$2 million of annual
IT contractor and other consultant
savings will be realized in 2012
Lower than anticipated rent and depreciation expense
Estimated $900,000 positive impact in 2012
Savings in check processing charges and courier fees
Estimated $900,000 positive impact in 2012
Savings in core processing costs
Estimated $2.3 million positive impact in 2012
Purchasing initiatives and legal fee savings
Estimated $500,000 positive impact in 2012
Other initiatives
Identified approximately $9 million of other annual savings
throughout the franchise |
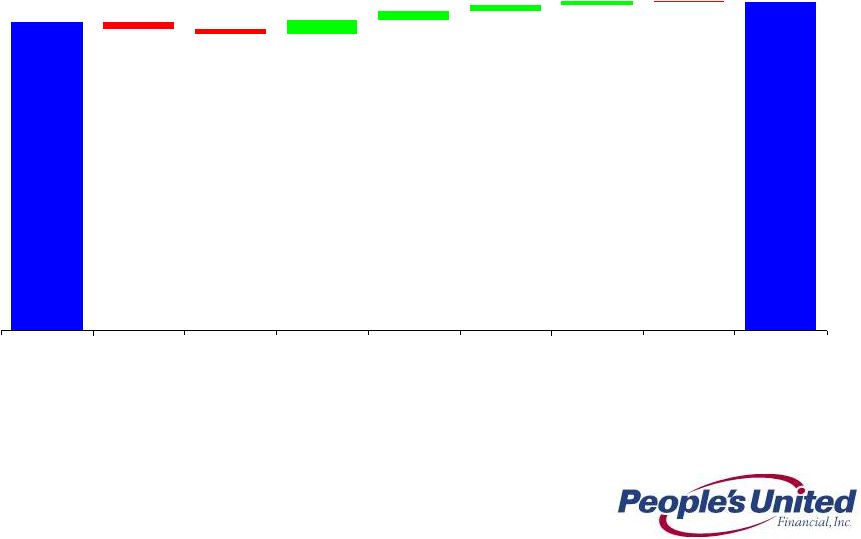
 23
Net Interest Margin -
Decrease from 1Q 2012
4.01%
3.95%
3.97%
(0.02%)
(0.04%)
(0.08%)
0.08%
(0.03%)
0.05%
1Q 2012
Margin
Lower Loan
Yields
Lower
Funding
Rates / Mix
Higher
Securities
Balances
2Q 2012
Margin Before
Transactional
Items
Cost Recovery
Income
FV Amort-
Acquired CDs
Securities
Purchases
(Citizens)
2Q 2012
Margin |
 24
Net Interest Margin
4.09
4.11
4.07
4.01
3.89
4.13
4.11
4.16
4.01
3.97
2Q 2011
3Q 2011
4Q 2011
1Q 2012
2Q 2012
Margin- Operating
Margin- Reported |
 25
Acquired Loan Portfolio
Actual Credit Experience vs. Expectations
Acquired loans initially recorded at fair value (inclusive of related credit mark)
without carryover of historical ALLL Accounting model is cash-flow
based: Contractual
cash
flows
(principal
&
interest)
less
Expected
cash
flows
(principal
&
interest)
=
non-accretable
difference (effectively utilized to absorb actual portfolio losses)
Expected cash flows (principal & interest) less fair value = accretable
yield Expected cash flows are regularly reassessed and compared to actual cash
collections The following reclassifications from non-accretable difference
to accretable yield during the period reflect better than anticipated credit
performance: Butler: $6.5MM, Smithtown: $2.4MM
As of 6/30/2012
(in $ millions)
Carrying
Amount
a, b
Carrying Amount Component
b
NPLs
Non-Accretable
Difference/NPLs
Charge-offs
Incurred Since
Acquisition
Accretable
Yield
Non-Accretable
Difference
FinFed (2/18/10)
$210.2
$12.8
$7.9
$36.5
22%
$11.4
Butler (4/16/10)
68.2
27.1
16.4
11.4
144%
5.2
RiverBank (11/30/10)
319.7
105.9
11.1
25.3
44%
3.9
Smithtown (11/30/10)
954.2
461.5
127.6
111.5
114%
115.8
Danvers (7/1/11)
1, 464.3
542.4
28.0
51.9
54%
8.1
Total
$3,016.6
$1,149.7
$191.0
$236.6
(a)
Initial carrying amounts of acquired portfolios are as follows: FinFed, $1.2BN;
Butler, $141MM; RiverBank, $518MM; Smithtown, $1.6BN; and Danvers,
$1.9BN. (b)
Carrying amount and related components reflect loan sale, settlement and payoff
activity which have occurred since acquisition. (c)
Represent contractual amounts; loans meet People’s United Financial’s
definition of a non-performing loan but are not subject to
classification as non-accrual in the same manner as originated loans. Rather,
these loans are considered to be accruing loans because their interest
income relates to the accretable yield recognized at the pool level and not to contractual interest payments
at the loan level.
c
c |
 26
Acquired Loan Portfolio
Amortization of Original Discount on Acquired Loan Portfolio
Note:
$ in millions, except per share data
Impact on Net Interest Margin
Impact on Earnings Per Share
2Q12 Total Accretion (All interest income on acquired loans)
56
Interest Income from Amortization of Original Discount on Acq. Loan Portfolio
11.7
1Q12 Acquired Loan Portfolio Carrying Amount
3,377
2Q12 Effective Tax Rate
32%
2Q12 Acquired Loan Portfolio Carrying Amount
3,017
2Q12 Average Acquired Loan Portfolio
3,197
2Q12 Earnings from Amortiz. of Original Discount on Acq. Loan Portfolio
7.9
Effective Yield on Acquired Loan Portfolio
6.97%
2Q12 Weighted Average Shares Outstanding
340.7
Weighted Average Coupon on Acquired Loan Portfolio
1
5.51%
2Q12 EPS Impact from Amortiz. of Discount on Acq. Loan Portfolio
$0.02
Incremental Yield Attributable to Amortiz. of Discount on Acq. Loan Portfolio
1.46%
Incremental Interest Income from Amortiz. of Discount on Acq. Loan Portfolio
11.7
2Q12 Average Earning Assets
24,040
Add: Average unamortized loan discount
2
106
Adjusted 2Q12 Average Earning Assets
24,146
Impact on Overall Net Interest Margin (bps)
19
Operating Net Interest Margin
3.89%
Adjusted Net Interest Margin
3.70%
Amortization of Original Discount on Acquired Loan Portfolio
Amortization of Original Discount on Acquired Loan Portfolio
1.
Excluding FinFed, the weighted average coupon on the acquired loan portfolio is 5.20%. 2.
Represents the difference between the outstanding balance of the acquired loan portfolio and the
carrying amount of the acquired loan portfolio. |
 27
Loans
Linked Quarter Change
(in $ millions)
Annualized linked QTD change
12.7%
7.7%
-42.7%
Annualized linked QTD change- Originated
11.2%
Annualized Linked QTD change- Total
2.3%
20,606
20,489
103
(360)
374
Mar 31, 2012
Commercial
Banking
Retail
Acquired
Jun 30, 2012 |
 28
Deposits by Business Line
Linked Quarter Change
(in $ millions)
*
Total
21,268
21,458
Retail *
Commercial
15,959
16,105
5,353
5,309
146
44
Mar 31, 2012
Retail
Commercial
Jun 30, 2012
Annualized linked QTD change
3.7%
3.3%
Annualized
Linked
QTD
change-
Total
3.6%
Retail includes Wealth Management deposits of $72MM at 3/2012 and $69MM at 6/2012 |
 29
72.4
75.7
(0.2)
(1.2)
(0.8)
1.0
1.6
2.2
0.7
Non-Interest Income
Linked Quarter Change
(in $ millions)
1Q 2012
Insurance
Gain on
Loan Sales
-
Residential
Bank
Service
Charges
Loan
Prepayment
Fees
Operating
Lease
Income
Gain on
Loan Sales
-
Acquired
Other
2Q 2012 |
 30
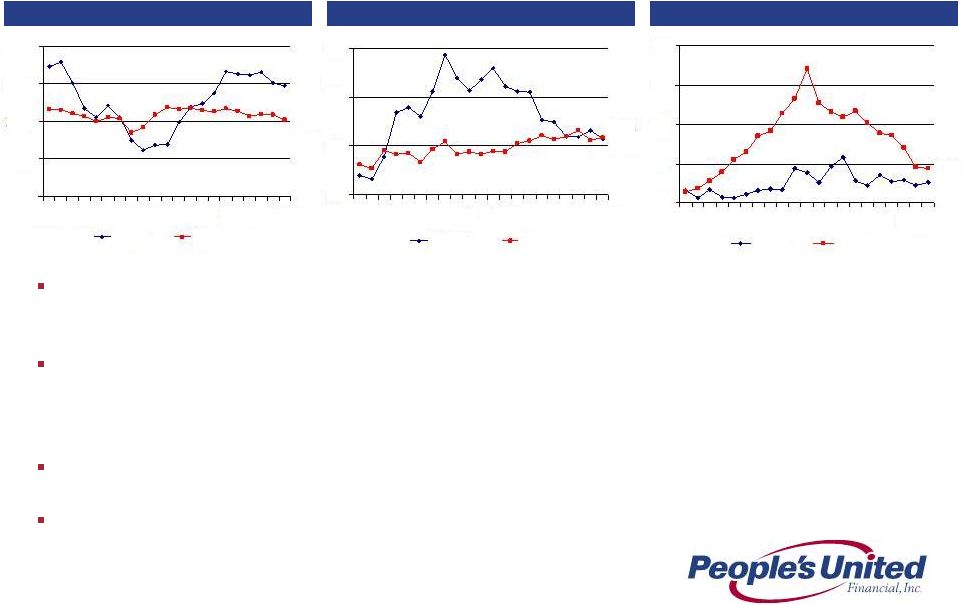
Asset Quality
NPAs / Loans & REO* (%)
Notes:
* Non-performing
assets
(excluding
acquired
non-performing
loans)
as
a
percentage
of
originated
loans
plus
all
REO
and
repossessed
assets;
acquired
non-performing
loans
excluded
as
risk
of
loss
has
been
considered
by
virtue
of
our
estimate of acquisition-date fair value and/or the existence of an FDIC loss
sharing agreement. 2Q 2012 not displayed because only 10 of 20 peers
reporting for this metric as of 7/27/12. Source:
SNL Financial and Company filings
Non-performers remain below peers
1.67
2.09
0.00
0.50
1.00
1.50
2.00
2.50
3.00
3.50
2Q10
3Q10
4Q10
1Q11
2Q11
3Q11
4Q11
1Q12
2Q12
PBCT
Peers |
 31
Asset Quality
Net Charge-Offs / Avg. Loans (%)
Source: SNL Financial and Company filings
Charge-offs have been consistently low
0.26
0.44
0.00
0.25
0.50
0.75
1.00
1.25
1.50
2Q10
3Q10
4Q10
1Q11
2Q11
3Q11
4Q11
1Q12
2Q12
PBCT
Peers |
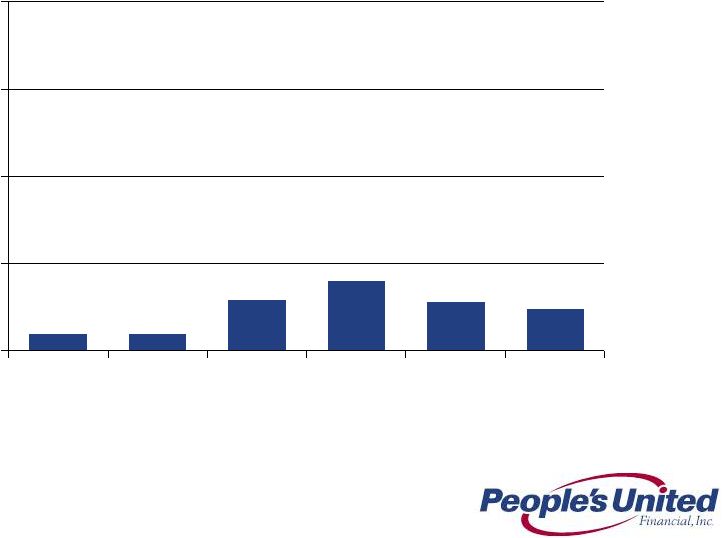 32
0.10%
0.10%
0.29%
0.40%
0.28%
0.24%
0.0%
0.5%
1.0%
1.5%
2.0%
2007
2008
2009
2010
2011
1H12
Historical Charge-off Experience
2007 –
2012 |
 33
Return on Assets
Operating ROAA (%)
Return on assets has continued to improve relative to peers,
supported by organic loan and deposit growth and the integration
of recent acquisitions
0.97
0.88
0.00
0.20
0.40
0.60
0.80
1.00
1.20
2Q10
3Q10
4Q10
1Q11
2Q11
3Q11
4Q11
1Q12
2Q12
PBCT
Peers |
 34
8.9
12.3
12.4
0
3
6
9
12
15
2Q10
3Q10
4Q10
1Q11
2Q11
3Q11
4Q11
1Q12
2Q12
PBCT
Peers
PBCT - Normalized Equity
High levels of equity produce below industry ROATE. Normalizing
our
equity base shows that the core bank is performing in-line with peers. As
we continue to efficiently deploy capital actual ROATE will improve
further Return on Tangible Equity
1
Operating ROATE (%)
Notes:
1.
PBCT –
Normalized Equity shows Operating ROATE pro forma for normalized Tangible
Common Equity of 8.0%, in line with peers (see Appendix) and excludes the income
related to cash & securities above the normalized 8.0% TCE/TA
level 2.
2Q 2012 peer median based on data from 15 of 20 peers
|
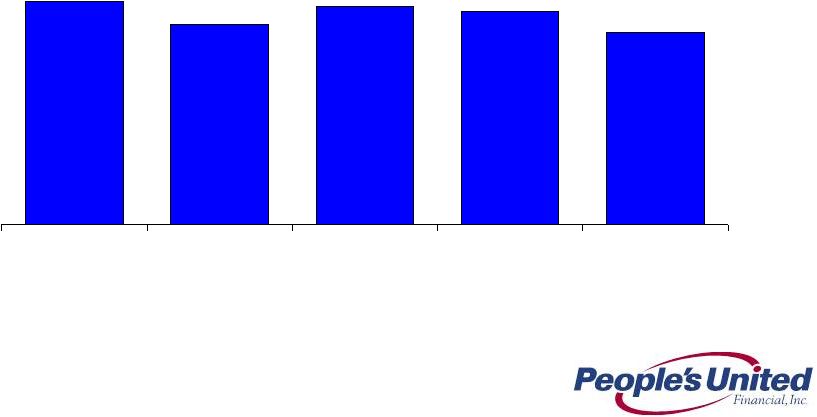 35
Operating Dividend Payout Ratio
Last Five Quarters
95%
85%
93%
91%
82%
2Q 2011
3Q 2011
4Q 2011
1Q 2012
2Q 2012 |
 36
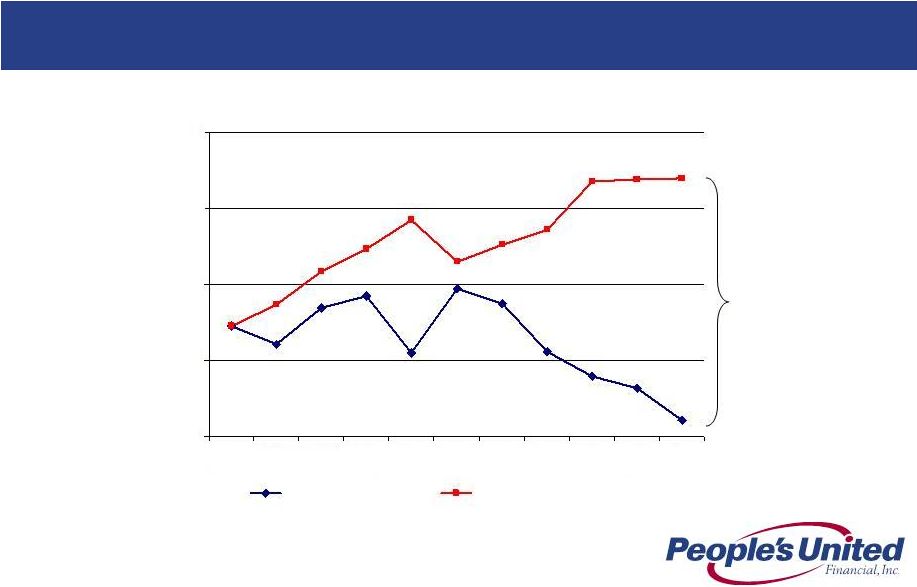
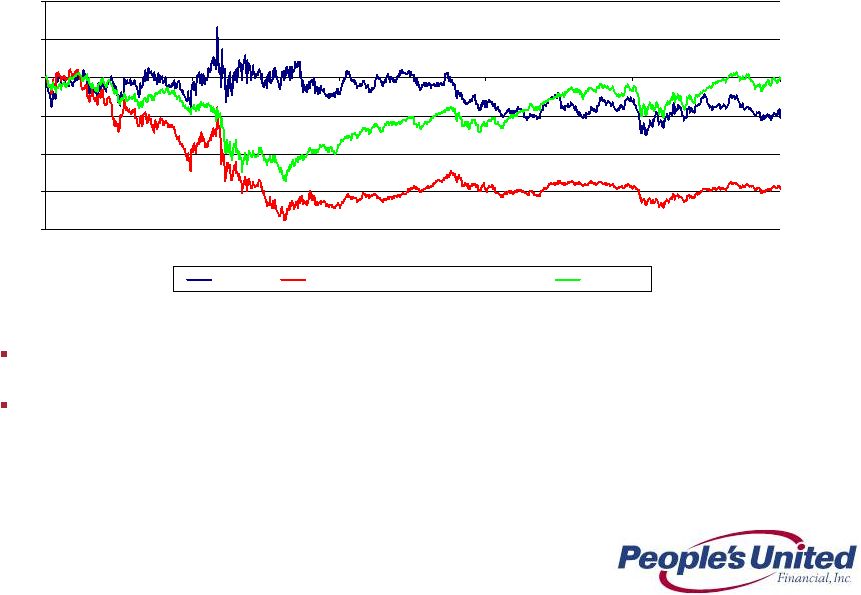
Substantial Progress in the Midst of a Financial Crisis
Total
Shareholder
Return
-
Past
5
Years
Source: SNL Financial
PBCT
SNL Mid Cap U.S. Bank & Thrift
S&P 500
Jul-07
Jul-08
Jul-09
Jul-10
Jul-11
Jul-12
April 2007 we raised $3.4BN in our second step conversion
Our conservative credit culture and funding structure coupled with industry
leading capital levels provided significant strength throughout the crisis
(21.3)
(58.4)
(0.9)
(80.0)
(60.0)
(40.0)
(20.0)
0.0
20.0
40.0 |
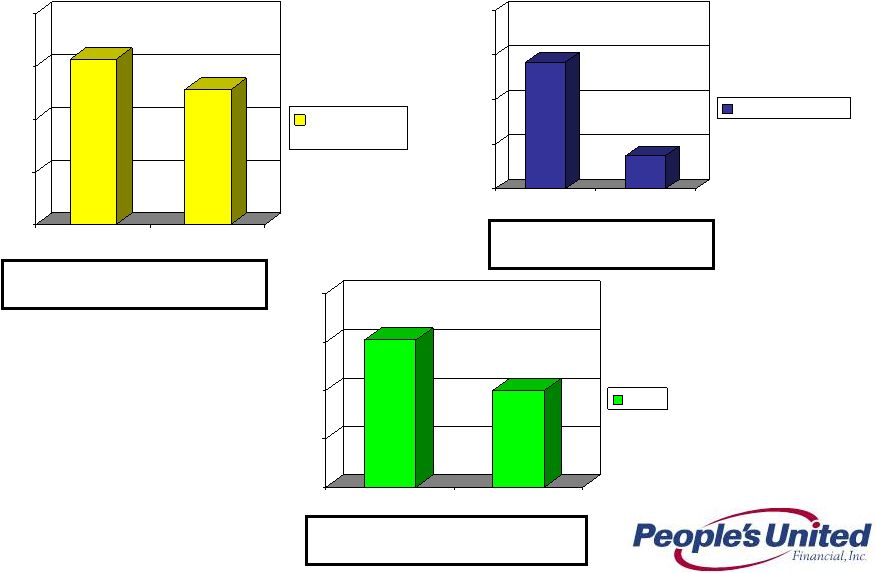
 37
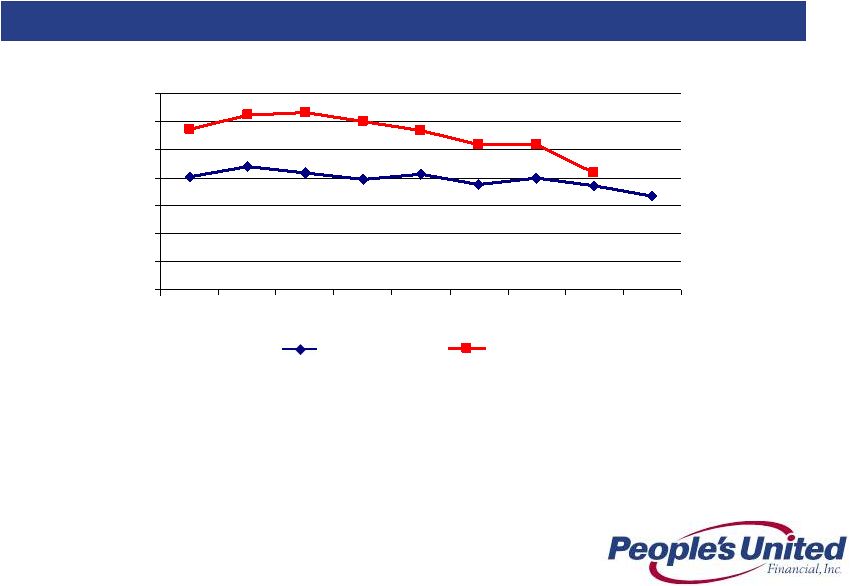
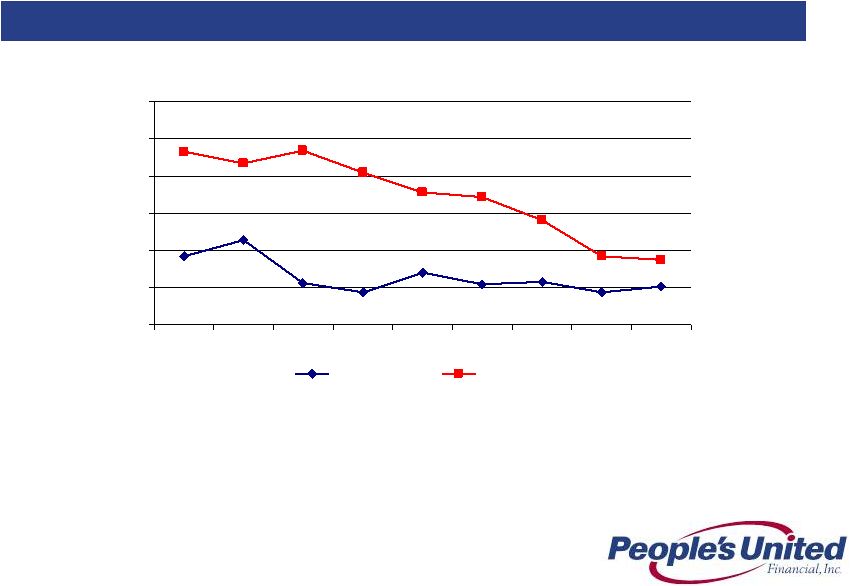
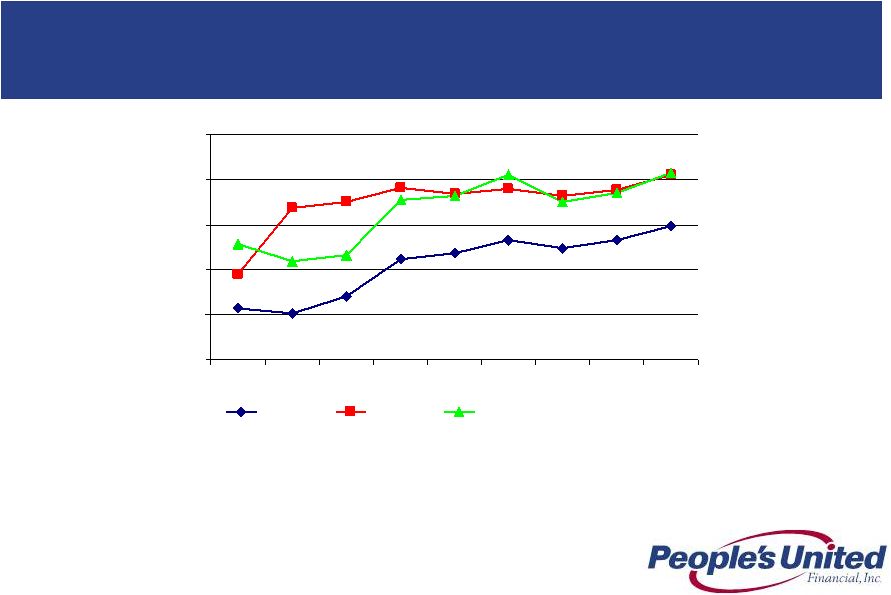
Substantial Progress in the Midst of a Financial Crisis
Key
Operating
Performance
Metrics
-
Past
5
Years
We maintained a conservative stance throughout the financial crisis as we focused
on protecting our capital while building long-term franchise value
More recently, our margin remains well above peers as we thoughtfully deployed
capital in acquisitions and deepened our presence in the Boston and New York
metro areas
Under new management we have made considerable progress on our efficiency ratio
Our exceptional credit quality throughout the financial crisis has allowed us to
manage our business with a long-term view
Efficiency Ratio (%)
NIM (%)
Net Charge-offs/Avg. Loans (%)
0.26
0.44
0.0
0.5
1.0
1.5
2.0
2Q07
2Q08
2Q09
2Q10
2Q11
2Q12
PBCT
Peers
61.5
61.6
50
60
70
80
2Q07
2Q08
2Q09
2Q10
2Q11
2Q12
PBCT
Peers
3.97
3.52
2.50
3.00
3.50
4.00
4.50
2Q07
2Q08
2Q09
2Q10
2Q11
2Q12
PBCT
Peers |
 38
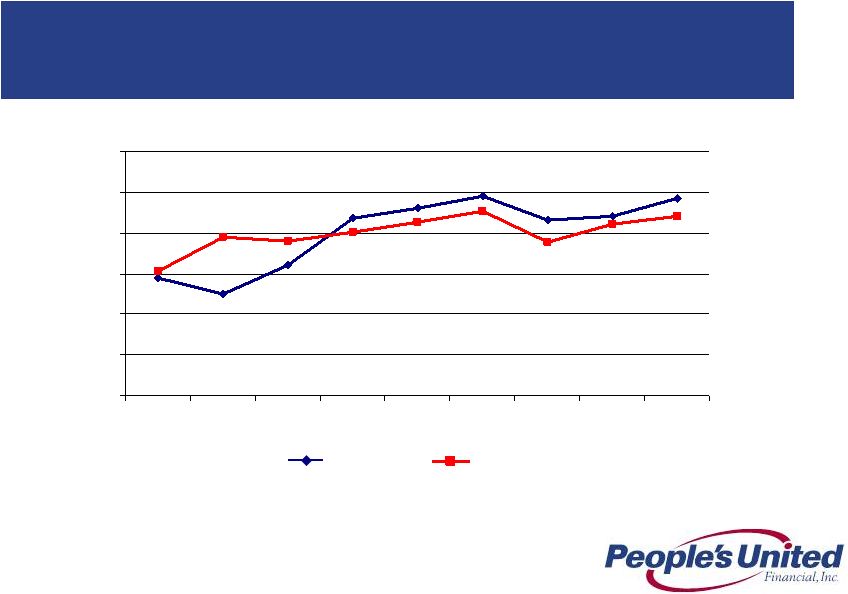
Substantial Progress in the Midst of a Financial Crisis
Growing Loans, Deposits and Returning Capital to Shareholders
Growth has far outstripped peers on the key metrics of loans per
share
and deposits per share
This has occurred while we have returned $2.0BN to shareholders
during this period. Returns of capital were in the form of both
dividends ($1.1BN) and share repurchases ($0.9BN) which represents
nearly 50% of our current market capitalization
Line Item
PBCT
Peer
Median
PBCT Vs.
Peers
5-Year Loans Per Share CAGR
14.6%
-1.0%
+15.6%
5-Year Deposits Per Share CAGR
15.9%
0.6%
+15.3%
Notes: 5-Year CAGR figures based on 2Q 2007 and 2Q 2012 data
|
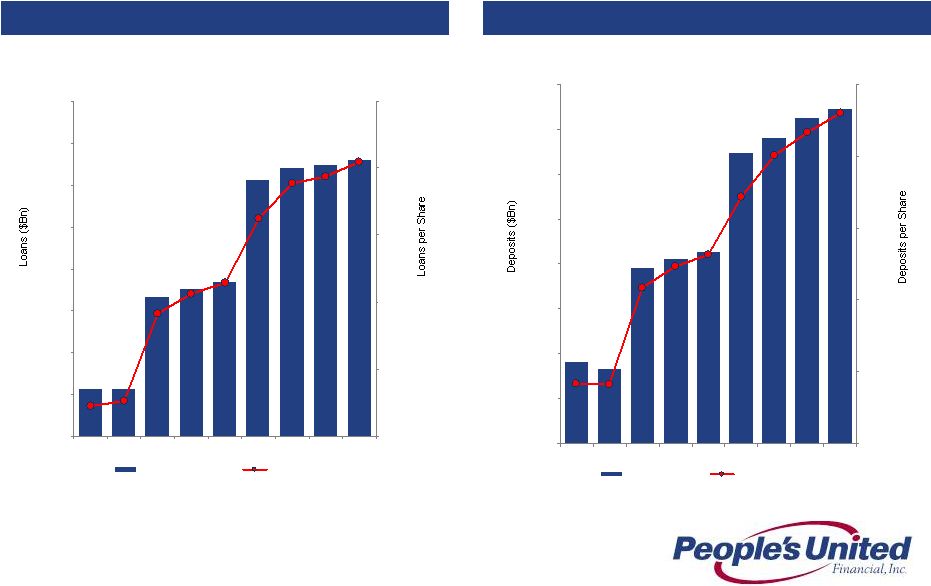 39
Loans
Deposits
Growing Future Earnings Per Share
Loans and Deposits per Share
$60.49
$14
$15
$16
$17
$18
$19
$20
$21
$22
2010Q2
2010Q4
2011Q2
2011 Q4
2012 Q2
$40
$45
$50
$55
$60
$65
Gross Loans ($BN)
Loans per Share
$62.99
$14
$15
$16
$17
$18
$19
$20
$21
$22
2010Q2
2010Q4
2011Q2
2011Q4
2012 Q2
$40
$45
$50
$55
$60
$65
Deposits ($BN)
Deposits per share |
 40
Strong Sources of Liquidity
PBCT maintains high levels of liquidity and is 96% funded by deposits,
retail repurchase agreements and common equity
Strong
branch
franchise
and
commercial
customer
base
fully
funds
loan
base
without use of wholesale or brokered borrowings
Citizens transaction adds $324MM in deposits and provides a significant
long-term opportunity to grow customer relationships in southern New
York, specifically on Long Island and in Westchester County
Additional liquidity of $2.2BN exists in the form of unpledged securities
Federal Home Loan Bank (FHLB) relationship enables up to $3.3BN of
additional borrowings
Because of strong capital and funding base we have not accessed debt
markets –
strong credit ratings imply we have ready access to funding at
the holding company and the bank if desired |
 41
2Q 2011
3Q 2011
4Q 2011
1Q 2012
2Q 2012
People’s United Financial
Tang. Com. Equity/Tang. Assets
13.9%
12.5%
12.0%
11.7%
11.5%
Leverage Ratio
1, 5
14.3%
12.7%
12.5%
12.2%
11.9%
Tier 1 Common
17.0%
15.0%
14.3%
13.9%
13.6%
Tier 1 Risk-Based Capital
3, 5
17.6%
15.2%
14.8%
14.5%
14.1%
Total Risk-Based Capital
4, 5
19.1%
16.7%
16.2%
16.0%
15.6%
People’s United Bank
Leverage Ratio
1, 5
11.6%
11.8%
11.1%
11.0%
11.0%
Tier 1 Risk-Based Capital
3, 5
14.2%
14.1%
13.1%
13.1%
13.1%
Total Risk-Based Capital
4,5
15.0%
14.9%
14.0%
14.1%
14.0%
Capital Ratios
Notes:
1.
Leverage (core) Capital represents Tier 1 Capital (total stockholder’s equity, excluding: (i)
after-tax net unrealized gains (losses) on certain securities classified as available for
sale; (ii) goodwill and other acquisition-related intangibles; and (iii) the amount recorded in accumulated other comprehensive income (loss) relating to pension and other
postretirement benefits), divided by Adjusted Total Assets (period end total assets less goodwill and
other acquisition-related intangibles)
2.
Tier 1 Common represents total stockholder’s equity, excluding goodwill and other
acquisition-related intangibles, divided by Total Risk-Weighted Assets
3.
Tier 1 Risk-Based Capital represents Tier 1 Capital divided by Total Risk-Weighted Assets 4.
Total Risk-Based Capital represents Tier 1 Capital plus subordinated notes and debentures, up to
certain limits, and the allowance for loan losses, up to 1.25% of total risk weighted assets,
divided by Total Risk-Weighted Assets
5.
Well capitalized limits for the Bank are: Leverage Ratio, 5%; Tier 1 Risk-Based Capital, 6%; and
Total Risk-Based Capital, 10%
2 |
 42
Summary
Premium brand built over 170 years
High quality Northeast footprint characterized by wealth, density and
commercial activity
Strong leadership team
Solid net interest margin
Superior asset quality
Focus on relationship-based banking
Improving profitability
Returning capital to shareholders
Strong capital base as evidenced by robust Tangible Common Equity and
Tier 1 Common ratios
Sustainable Competitive Advantage
Growing loans and deposits within footprint - in two of the largest MSAs in
the country (New York City, #1 and Boston, #10) |
 Appendix |
 44
Allowance for Loan Losses
Originated Portfolio Coverage Detail
(in $ millions)
1.57%
1.28%
0.00%
0.50%
1.00%
1.50%
2.00%
NPLs:Loans
ALLL:Loans
Commercial
Banking
1.42%
0.37%
0.00%
0.50%
1.00%
1.50%
2.00%
NPLs:Loans
ALLL:Loans
Retail Banking
Commercial ALLL -
$155.5 million
82% of Commercial NPLs
Retail ALLL -
$20.0 million
26% of Retail NPLs
Total ALLL -
$175.5 million
66% of Total NPLs
1.52%
1.00%
0.00%
0.50%
1.00%
1.50%
2.00%
NPLs:Loans
ALLL:Loans
Total |
 45
We do not expect short-term interest rates to rise any time soon
Given short-term interest rates are very low and are expected to remain low for the near term,
we have added additional securities
For 1Q 2012 we were more than twice as asset sensitive as the estimated median of our peer
group, depending on the scenario
For an immediate parallel increase of 100bps, our net interest income is projected to increase
by ~$59MM on an annualized basis
Yield curve twist scenarios confirm that we are reasonably well protected from bull flattener
(short rates are unchanged, long rates fall) and benefit considerably from bear flattener
environments (short rates rise, long rates are unchanged)
Notes:
1.
Analysis is as of 3/31/12 filings
2.
Data as of 3/31/12 SEC filings, where exact +100bps shock up scenario data was not provided PBCT
interpolated based on data disclosed 3.
Data as of 3/31/12 filings, where exact +200bps shock up scenario data was not provided PBCT
interpolated based on data disclosed Current Asset Sensitivity
Net Interest Income at Risk
1
Analysis involves PBCT estimates, see notes below
Change in Net Interest Income
Scenario
Lowest
Amongst Peers
Highest
Amongst Peers
Peer Median
PBCT Multiple to
Peer Median
Shock Up
100bps ²
-4.3%
5.8%
2.4%
2.6x
Shock Up
200bps ³
-7.4%
11.7%
4.2%
3.3x |
 46
Name
Position
Years in
Banking
Professional
Experience
Jack Barnes
President & CEO, Director
30+
People’s United Bank (SEVP, CAO),
Chittenden, FDIC
Kirk Walters
SEVP & CFO, Director
25+
People’s United Bank, Santander, Sovereign,
Chittenden, Northeast Financial
Jeff Tengel
SEVP Commercial Banking
30+
People’s United Bank, PNC, National City
Bob D’Amore
SEVP Retail & Business Banking
30+
People’s United Bank
Louise Sandberg
SEVP Wealth Management
30+
People’s United Bank, Chittenden
Lee Powlus
SEVP & Chief Administrative Officer
25+
People’s United Bank, Chittenden, Alltel
Chantal Simon
SEVP & Chief Risk Officer
20+
People’s United Bank, Merrill Lynch US Bank,
Lazard Freres & Co.
Dave Norton
SEVP & Chief HR Officer
2+
People’s United Bank, New York Times,
Starwood, PepsiCo
Bob Trautmann
SEVP & General Counsel
20+
People’s United Bank, Tyler Cooper & Alcorn
Management Committee |
 47
Peer Group
Firm
Ticker
City
State
1
Associated
ASBC
Green Bay
WI
2
BancorpSouth
BXS
Tupelo
MS
3
City National
CYN
Los Angeles
CA
4
Comerica
CMA
Dallas
TX
5
Commerce
CBSH
Kansas City
MO
6
Cullen/Frost
CFR
San Antonio
TX
7
East West
EWBC
Pasadena
CA
8
First Niagara
FNFG
Buffalo
NY
9
FirstMerit
FMER
Akron
OH
10
Fulton
FULT
Lancaster
PA
11
Huntington
HBAN
Columbus
OH
12
M&T
MTB
Buffalo
NY
13
New York Community
NYB
Westbury
NY
14
Signature
SBNY
New York
NY
15
Susquehanna
SUSQ
Lititz
PA
16
Synovus
SNV
Columbus
GA
17
Valley National
VLY
Wayne
NJ
18
Webster
WBS
Waterbury
CT
19
Wintrust
WTFC
Lake Forest
IL
20
Zions
ZION
Salt Lake City
UT |
 48
In addition to evaluating People’s United Financial’s results of
operations in accordance with U.S. generally accepted accounting principles
(“GAAP”), management routinely supplements this evaluation with an analysis
of certain non-GAAP financial measures, such as the efficiency and tangible
equity ratios, tangible book value per share and operating earnings metrics.
Management believes these non-GAAP financial measures provide
information useful to investors in understanding People’s United
Financial’s underlying operating performance and trends, and
facilitates comparisons with the performance of other banks and thrifts. Further, the efficiency
ratio and operating earnings metrics are used by management in its assessment of
financial performance, including non-interest expense control, while the
tangible equity ratio and tangible book value per share are used to analyze
the relative strength of People’s United Financial’s capital position.
The
efficiency
ratio,
which
represents
an
approximate
measure
of
the
cost
required
by
People’s
United
Financial
to
generate
a
dollar
of
revenue,
is
the
ratio
of
(i)
total
non-interest
expense
(excluding
goodwill
impairment charges, amortization of other acquisition-related intangibles,
losses on real estate assets and non-recurring
expenses)
(the
numerator)
to
(ii)
net
interest
income
on
a
fully
taxable
equivalent
("FTE")
basis
plus total non-interest income (including the FTE adjustment on bank-owned
life insurance ("BOLI") income, and excluding gains and losses on
sales of assets other than residential mortgage loans, and non-recurring
income) (the denominator). People’s United Financial generally considers an
item of income or expense to be non-recurring if it is not similar to an
item of income or expense of a type incurred within the last two years and
is not similar to an item of income or expense of a type reasonably expected to be
incurred within the following two years.
Non-GAAP Financial Measures and Reconciliation to GAAP
|
 49
Operating earnings exclude from net income those items that management considers to
be of such a non- recurring or infrequent nature that, by excluding such
items (net of income taxes), People’s United Financial’s results
can be measured and assessed on a more consistent basis from period to period. Items excluded from
operating earnings, which include, but are not limited to, merger-related
expenses, charges related to executive-level management separation
costs, severance-related costs and writedowns of banking house assets,
are generally also excluded when calculating the efficiency ratio. Operating earnings per share is
calculated by dividing operating earnings by the weighted average number of
dilutive common shares outstanding for the respective period. Operating
return on average assets is calculated by dividing operating earnings
(annualized) by average assets. Operating return on average tangible stockholders' equity is
calculated by dividing operating earnings (annualized) by average tangible
stockholders' equity. The operating dividend payout ratio is calculated by
dividing dividends paid by operating earnings for the respective period.
Operating net interest margin excludes from the net interest margin those items
that management considers to be of such a discrete nature that, by excluding
such items, People’s United Financial’s net interest margin can be
measured and assessed on a more consistent basis from period to period. Items excluded from operating
net interest margin include cost recovery income on acquired loans and changes in
the accretable yield on acquired loans stemming from periodic cash flow
reassessments. Operating net interest margin is calculated by dividing
operating net interest income (annualized) by average earning assets.
Non-GAAP Financial Measures and Reconciliation to GAAP
|
 50
Non-GAAP Financial Measures and Reconciliation to GAAP
The
tangible
equity
ratio
is
the
ratio
of
(i)
tangible
stockholders’
equity
(total
stockholders’
equity
less
goodwill
and
other
acquisition-related
intangibles)
(the
numerator)
to
(ii)
tangible
assets
(total
assets
less
goodwill
and
other acquisition-related intangibles) (the denominator). Tangible book value per share is
calculated by dividing tangible stockholders’
equity by common shares (total common shares issued, less common shares
classified as treasury shares and unallocated Employee Stock Ownership Plan ("ESOP")
common shares). In light of diversity in presentation among financial institutions, the
methodologies used by People’s United Financial for determining the non-GAAP financial
measures discussed above may differ from those used by other financial institutions.
|
 For
more information, investors may contact: Peter Goulding, CFA
203-338-6799
peter.goulding@peoples.com |