Attached files
| file | filename |
|---|---|
| 8-K - FORM 8-K - PARK NATIONAL CORP /OH/ | v319703_8k.htm |
1 July 31, 2012 KBW Community Banking Investor Conference
Forward - looking Statements This presentation presents management's discussion and analysis of the financial condition and results of operations for Park Na tional Corporation and its subsidiaries ("Park" or the "Corporation"). This discussion should be read in conjunction with the consol ida ted financial statements and related notes and the five - year summary of selected financial data presented in Park’s 2011 Annual Report. Manag ement’s discussion and analysis contains forward - looking statements that are provided to assist in the understanding of anticipated futu re financial performance. Forward - looking statements provide current expectations or forecasts of future events and are not guarantees of fut ure performance. The forward - looking statements are based on management’s expectations and are subject to a number of risks and unce rtainties. Although management believes that the expectations reflected in such forward - looking statements are reasonable, actual results m ay differ materially from those expressed or implied in such statements. Risks and uncertainties that could cause actual results to dif fer materially include, without limitation: Park’s ability to execute its business plan successfully and within the expected timeframe; dete rio ration in the asset value of our loan portfolio may be worse than expected due to a number of factors, such as adverse changes in economic condit ion s that impair the ability of borrowers to repay their loans, the underlying collateral could prove less valuable than assumed and cash flow s m ay be worse than expected; Park’s ability to sell OREO properties at anticipated prices; general economic and financial market conditions, and we akening in the economy, specifically the real estate market and credit markets, either nationally or in the states in which Park and its sub sid iaries do business, may be worse than expected which could decrease the demand for loan, deposit and other financial services and increase loan d eli nquencies and defaults; changes in interest rates and prices may adversely impact the value of securities, loans, deposits and other fi nan cial instruments and the interest rate sensitivity of our consolidated balance sheet; changes in consumer spending, borrowing and saving habit s; our liquidity requirements could be adversely affected by changes in our assets and liabilities; competitive factors among financial instit uti ons may increase significantly, including product and pricing pressures and Park’s ability to attract, develop and retain qualified bank profe ssi onals; the nature, timing and effect of changes in banking regulations or other regulatory or legislative requirements affecting the respective bus inesses of Park and its subsidiaries, including changes in laws and regulations concerning taxes, accounting, banking, securities and other a spe cts of the financial services industry, specifically the Dodd - Frank Wall Street Reform and Consumer Protection Act of 2010; the effect of c hanges in accounting policies and practices, as may be adopted by the Financial Accounting Standards Board (the “FASB”), the Securities an d Exchange Commission (the “SEC”), the Public Company Accounting Oversight Board and other regulatory agencies, and the accuracy of our ass umptions and estimates used to prepare our financial statements; the effect of fiscal and governmental policies of the United States f ede ral government; the adequacy of our risk management program; a failure in or breach of our operational or security systems or infrastructure, or those of our third - party vendors and other service providers, including as a result of cyber attacks; demand for loans in the respective mark et areas served by Park and its subsidiaries; and other risk factors relating to our industry as detailed from time to time in Park’s reports fi led with the SEC including those described in “Item 1A. Risk Factors” of Part I of Park’s Annual Report on Form 10 - K for the fiscal year ended De cember 31, 2011. Undue reliance should not be placed on the forward - looking statements, which speak only as of the date hereof. Park does n ot undertake, and specifically disclaims any obligation, to publicly release the result of any revisions that may be made to update any for war d - looking statement to reflect the events or circumstances after the date on which the forward - looking statement was made, or reflect the occurrence of unanticipated events, except to the extent required by law. 2
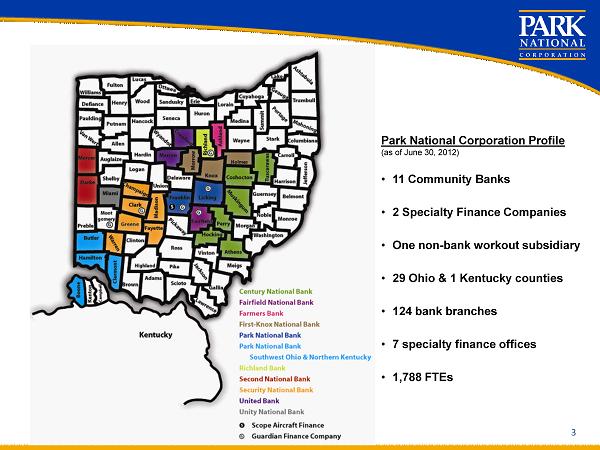
3 3 Park National Corporation Profile (as of June 30, 2012) • 11 Community Banks • 2 Specialty Finance Companies • One non - bank workout subsidiary • 29 Ohio & 1 Kentucky counties • 124 bank branches • 7 specialty finance offices • 1,788 FTEs
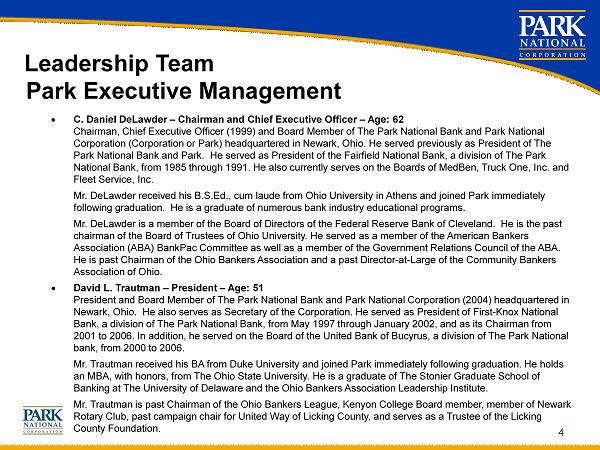
Park Executive Management • C. Daniel DeLawder – Chairman and Chief Executive Officer – Age: 62 Chairman, Chief Executive Officer (1999) and Board Member of The Park National Bank and Park National Corporation (Corporation or Park) headquartered in Newark, Ohio. He served previously as President of The Park National Bank and Park. He served as President of the Fairfield National Bank, a division of The Park National Bank, from 1985 through 1991. He also currently serves on the Boards of MedBen , Truck One, Inc. and Fleet Service, Inc. Mr. DeLawder received his B.S.Ed., cum laude from Ohio University in Athens and joined Park immediately following graduation. He is a graduate of numerous bank industry educational programs. Mr. DeLawder is a member of the Board of Directors of the Federal Reserve Bank of Cleveland. He is the past chairman of the Board of Trustees of Ohio University. He served as a member of the American Bankers Association (ABA) BankPac Committee as well as a member of the Government Relations Council of the ABA. He is past Chairman of the Ohio Bankers Association and a past Director - at - Large of the Community Bankers Association of Ohio. • David L. Trautman – President – Age: 51 President and Board Member of The Park National Bank and Park National Corporation (2004) headquartered in Newark, Ohio. He also serves as Secretary of the Corporation. He served as President of First - Knox National Bank, a division of The Park National Bank, from May 1997 through January 2002, and as its Chairman from 2001 to 2006. In addition, he served on the Board of the United Bank of Bucyrus, a division of The Park National bank, from 2000 to 2006. Mr. Trautman received his BA from Duke University and joined Park immediately following graduation. He holds an MBA, with honors, from The Ohio State University. He is a graduate of The Stonier Graduate School of Banking at The University of Delaware and the Ohio Bankers Association Leadership Institute. Mr. Trautman is past Chairman of the Ohio Bankers League, Kenyon College Board member, member of Newark Rotary Club, past campaign chair for United Way of Licking County, and serves as a Trustee of the Licking County Foundation. 4 Leadership Team
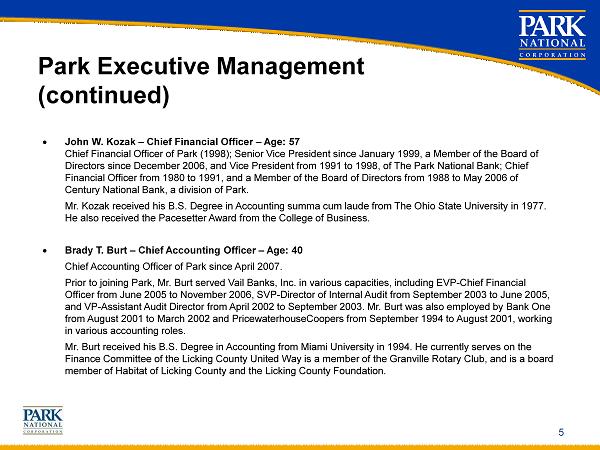
Park Executive Management (continued) • John W. Kozak – Chief Financial Officer – Age: 57 Chief Financial Officer of Park (1998); Senior Vice President since January 1999, a Member of the Board of Directors since December 2006, and Vice President from 1991 to 1998, of The Park National Bank; Chief Financial Officer from 1980 to 1991, and a Member of the Board of Directors from 1988 to May 2006 of Century National Bank, a division of Park. Mr. Kozak received his B.S. Degree in Accounting summa cum laude from The Ohio State University in 1977. He also received the Pacesetter Award from the College of Business. • Brady T. Burt – Chief Accounting Officer – Age: 40 Chief Accounting Officer of Park since April 2007. Prior to joining Park, Mr. Burt served Vail Banks, Inc. in various capacities, including EVP - Chief Financial Officer from June 2005 to November 2006, SVP - Director of Internal Audit from September 2003 to June 2005, and VP - Assistant Audit Director from April 2002 to September 2003. Mr. Burt was also employed by Bank One from August 2001 to March 2002 and PricewaterhouseCoopers from September 1994 to August 2001, working in various accounting roles. Mr. Burt received his B.S. Degree in Accounting from Miami University in 1994. He currently serves on the Finance Committee of the Licking County United Way is a member of the Granville Rotary Club, and is a board member of Habitat of Licking County and the Licking County Foundation. 5
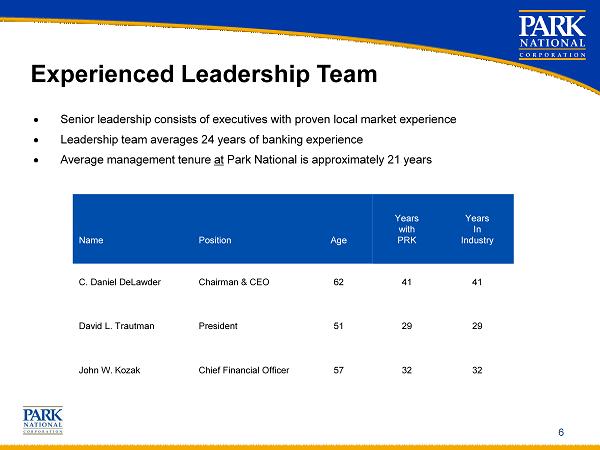
6 Experienced Leadership Team Name Position Age Years with PRK Years In Industry C. Daniel DeLawder Chairman & CEO 62 41 41 David L. Trautman President 51 29 29 John W. Kozak Chief Financial Officer 57 32 32 • Senior leadership consists of executives with proven local market experience • Leadership team averages 24 years of banking experience • Average management tenure at Park National is approximately 21 years
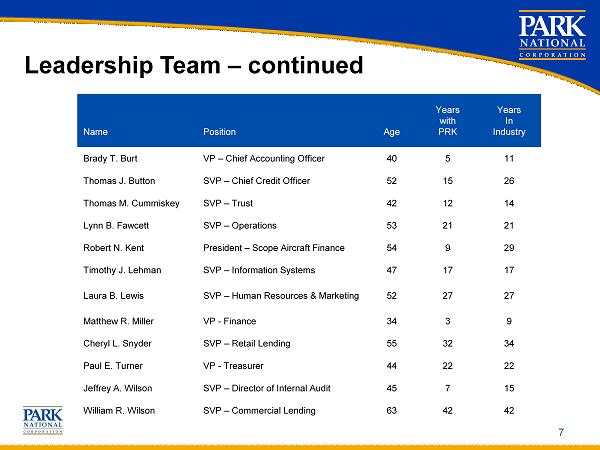
7 Leadership Team – continued Name Position Age Years with PRK Years In Industry Brady T. Burt VP – Chief Accounting Officer 40 5 11 Thomas J. Button SVP – Chief Credit Officer 52 15 26 Thomas M. Cummiskey SVP – Trust 42 12 14 Lynn B. Fawcett SVP – Operations 53 21 21 Robert N. Kent President – Scope Aircraft Finance 54 9 29 Timothy J. Lehman SVP – Information Systems 47 17 17 Laura B. Lewis SVP – Human Resources & Marketing 52 27 27 Matthew R. Miller VP - Finance 34 3 9 Cheryl L. Snyder SVP – Retail Lending 55 32 34 Paul E. Turner VP - Treasurer 44 22 22 Jeffrey A. Wilson SVP – Director of Internal Audit 45 7 15 William R. Wilson SVP – Commercial Lending 63 42 42
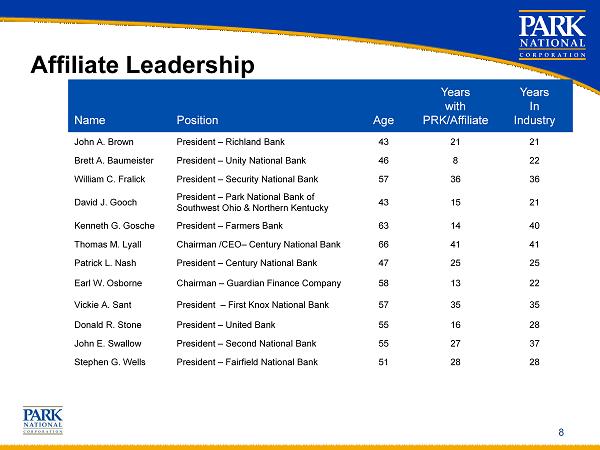
8 Affiliate Leadership Name Position Age Years with PRK/Affiliate Years In Industry John A. Brown President – Richland Bank 43 21 21 Brett A. Baumeister President – Unity National Bank 46 8 22 William C. Fralick President – Security National Bank 57 36 36 David J. Gooch President – Park National Bank of Southwest Ohio & Northern Kentucky 43 15 21 Kenneth G. Gosche President – Farmers Bank 63 14 40 Thomas M. Lyall Chairman /CEO – Century National Bank 66 41 41 Patrick L. Nash President – Century National Bank 47 25 25 Earl W. Osborne Chairman – Guardian Finance Company 58 13 22 Vickie A. Sant President – First Knox National Bank 57 35 35 Donald R. Stone President – United Bank 55 16 28 John E. Swallow President – Second National Bank 55 27 37 Stephen G. Wells President – Fairfield National Bank 51 28 28
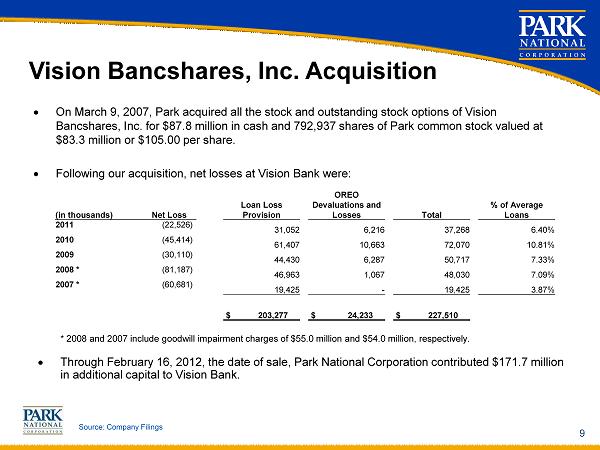
Vision Bancshares, Inc. Acquisition • On March 9, 2007, Park acquired all the stock and outstanding stock options of Vision Bancshares, Inc. for $87.8 million in cash and 792,937 shares of Park common stock valued at $83.3 million or $105.00 per share. • Following our acquisition, net losses at Vision Bank were: 9 Source: Company Filings • Through February 16, 2012, the date of sale, Park National Corporation contributed $171.7 million in additional capital to Vision Bank. * 2008 and 2007 include goodwill impairment charges of $55.0 million and $54.0 million, respectively. (in thousands) Net Loss Loan Loss Provision OREO Devaluations and Losses Total % of Average Loans 2011 (22,526) 31,052 6,216 37,268 6.40% 2010 (45,414) 61,407 10,663 72,070 10.81% 2009 (30,110) 44,430 6,287 50,717 7.33% 2008 * (81,187) 46,963 1,067 48,030 7.09% 2007 * (60,681) 19,425 - 19,425 3.87% $ 203,277 $ 24,233 $ 227,510
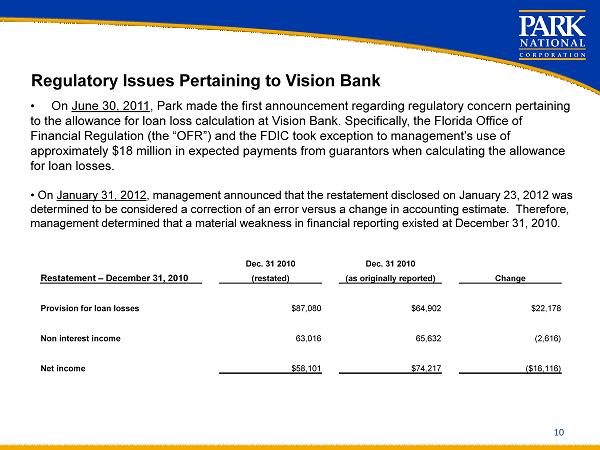
Regulatory Issues Pertaining to Vision Bank 10 • On June 30, 2011 , Park made the first announcement regarding regulatory concern pertaining to the allowance for loan loss calculation at Vision Bank. Specifically, the Florida Office of Financial Regulation (the “OFR”) and the FDIC took exception to management’s use of approximately $18 million in expected payments from guarantors when calculating the allowance for loan losses. • On January 31, 2012 , management announced that the restatement disclosed on January 23, 2012 was determined to be considered a correction of an error versus a change in accounting estimate. Therefore, management determined that a material weakness in financial reporting existed at December 31, 2010. Restatement – December 31, 2010 Dec. 31 2010 Dec. 31 2010 Change (restated) (as originally reported) Provision for loan losses $87,080 $64,902 $22,178 Non interest income 63,016 65,632 ( 2,616) Net income $58,101 $74,217 ($16,116)
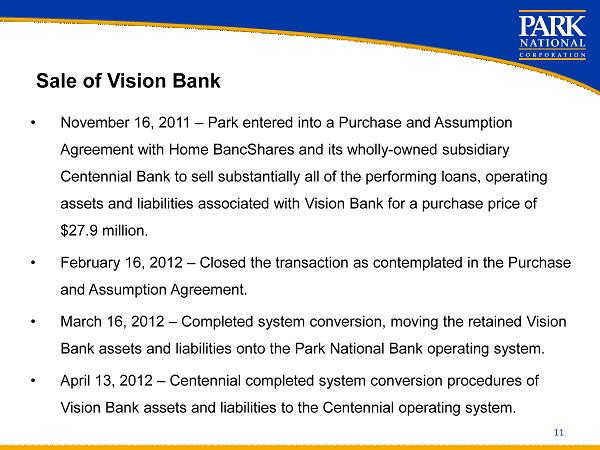
Sale of Vision Bank 11 • November 16, 2011 – Park entered into a Purchase and Assumption Agreement with Home BancShares and its wholly - owned subsidiary Centennial Bank to sell substantially all of the performing loans, operating assets and liabilities associated with Vision Bank for a purchase price of $27.9 million. • February 16, 2012 – Closed the transaction as contemplated in the Purchase and Assumption Agreement. • March 16, 2012 – Completed system conversion, moving the retained Vision Bank assets and liabilities onto the Park National Bank operating system. • April 13, 2012 – Centennial completed system conversion procedures of Vision Bank assets and liabilities to the Centennial operating system.
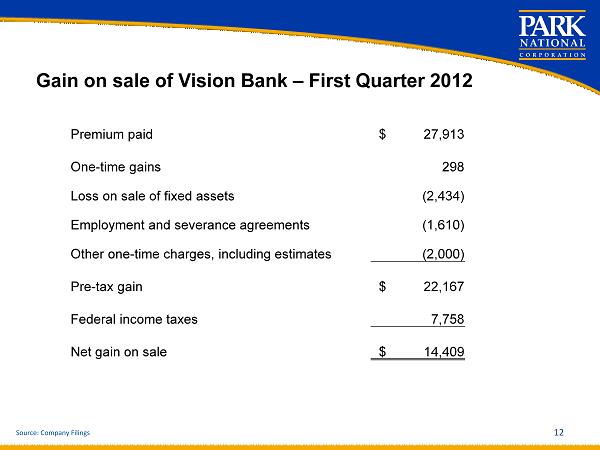
Gain on sale of Vision Bank – First Quarter 2012 12 Premium paid $ 27,913 One - time gains 2 98 Loss on sale of fixed assets (2,434) Employment and severance agreements (1,610) Other one - time charges, including estimates (2,000 ) Pre - tax gain $ 22,167 Federal income taxes 7,758 Net gain on sale $ 14,409 Source: Company Filings
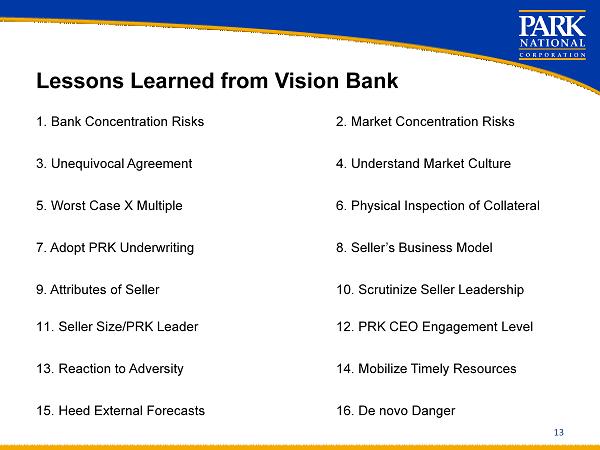
Lessons Learned from Vision Bank 1. Bank Concentration Risks 2. Market Concentration Risks 3. Unequivocal Agreement 4. Understand Market Culture 5. Worst Case X Multiple 6. Physical Inspection of Collateral 7. Adopt PRK Underwriting 8. Seller’s Business Model 9. Attributes of Seller 10. Scrutinize Seller Leadership 11. Seller Size/PRK Leader 12. PRK CEO Engagement Level 13. Reaction to Adversity 14. Mobilize Timely Resources 15. Heed External Forecasts 16. De novo Danger 13
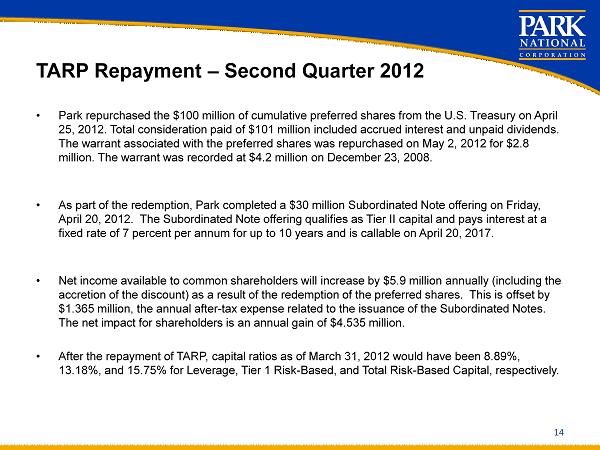
TARP Repayment – Second Quarter 2012 • Park repurchased the $100 million of cumulative preferred shares from the U.S. Treasury on April 25, 2012. Total consideration paid of $101 million included accrued interest and unpaid dividends. The warrant associated with the preferred shares was repurchased on May 2, 2012 for $2.8 million. The warrant was recorded at $4.2 million on December 23, 2008. • As part of the redemption, Park completed a $30 million Subordinated Note offering on Friday, April 20, 2012. The Subordinated Note offering qualifies as Tier II capital and pays interest at a fixed rate of 7 percent per annum for up to 10 years and is callable on April 20, 2017. • Net income available to common shareholders will increase by $5.9 million annually (including the accretion of the discount) as a result of the redemption of the preferred shares. This is offset by $1.365 million, the annual after - tax expense related to the issuance of the Subordinated Notes. The net impact for shareholders is an annual gain of $4.535 million. • After the repayment of TARP, capital ratios as of March 31, 2012 would have been 8.89%, 13.18%, and 15.75% for Leverage, Tier 1 Risk - Based, and Total Risk - Based Capital, respectively. 14
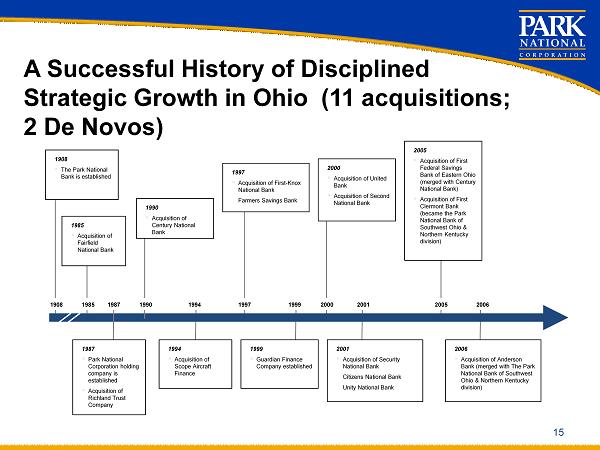
A Successful History of Disciplined Strategic Growth in Ohio (11 acquisitions; 2 De Novos ) 15 1908 1908 ▪ The Park National Bank is established 1985 1985 ▪ Acquisition of Fairfield National Bank 1987 1987 ▪ Park National Corporation holding company is established ▪ Acquisition of Richland Trust Company 1990 1990 ▪ Acquisition of Century National Bank 1994 1994 ▪ Acquisition of Scope Aircraft Finance 1997 1999 2000 2001 2005 2006 1997 ▪ Acquisition of First - Knox National Bank Farmers Savings Bank 1999 ▪ Guardian Finance Company established 2000 ▪ Acquisition of United Bank ▪ Acquisition of Second National Bank 2001 ▪ Acquisition of Security National Bank Citizens National Bank Unity National Bank 2005 ▪ Acquisition of First Federal Savings Bank of Eastern Ohio (merged with Century National Bank) ▪ Acquisition of First Clermont Bank (became the Park National Bank of Southwest Ohio & Northern Kentucky division) 2006 ▪ Acquisition of Anderson Bank (merged with The Park National Bank of Southwest Ohio & Northern Kentucky division)
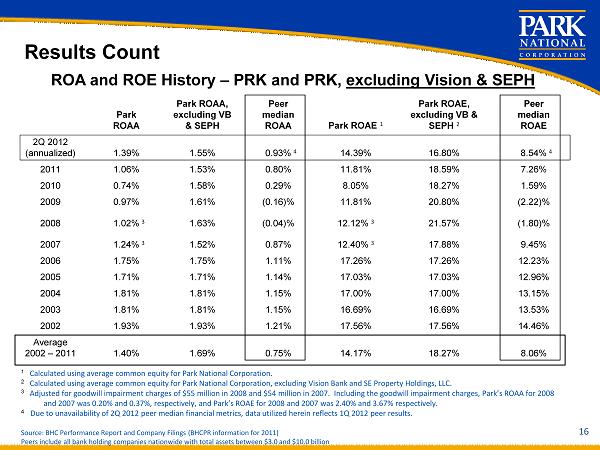
16 ROA and ROE History – PRK and PRK, excluding Vision & SEPH Results Count 1 Calculated using average common equity for Park National Corporation. 2 Calculated using average common equity for Park National Corporation, excluding Vision Bank and SE Property Holdings, LLC. 3 Adjusted for goodwill impairment charges of $55 million in 2008 and $54 million in 2007. Including the goodwill impairment charges, P ark ’s ROAA for 2008 and 2007 was 0.20% and 0.37%, respectively, and Park’s ROAE for 2008 and 2007 was 2.40% and 3.67% respectively . 4 Due to unavailability of 2Q 2012 peer median financial metrics, data utilized herein reflects 1Q 2012 peer results. Source : BHC Performance Report and Company Filings (BHCPR information for 2011) Peers include all bank holding companies nationwide with total assets between $3.0 and $10.0 billion Park ROAA Park ROAA, excluding VB & SEPH Peer median ROAA Park ROAE 1 Park ROAE, excluding VB & SEPH 2 Peer median ROAE 2Q 2012 (annualized) 1.39% 1.55% 0.93% 4 14.39% 16.80% 8.54% 4 2011 1.06% 1.53% 0.80% 11.81% 18.59% 7.26% 2010 0.74% 1.58% 0.29% 8.05% 18.27% 1.59% 2009 0.97% 1.61% (0.16)% 11.81% 20.80% (2.22)% 2008 1.02% 3 1.63% (0.04)% 12.12% 3 21.57% (1.80)% 2007 1.24% 3 1.52% 0.87% 12.40% 3 17.88% 9.45% 2006 1.75% 1.75% 1.11% 17.26% 17.26% 12.23% 2005 1.71% 1.71% 1.14% 17.03% 17.03% 12.96% 2004 1.81% 1.81% 1.15% 17.00% 17.00% 13.15% 2003 1.81% 1.81% 1.15% 16.69% 16.69% 13.53% 2002 1.93% 1.93% 1.21% 17.56% 17.56% 14.46% Average 2002 – 2011 1.40% 1.69% 0.75% 14.17% 18.27% 8.06%
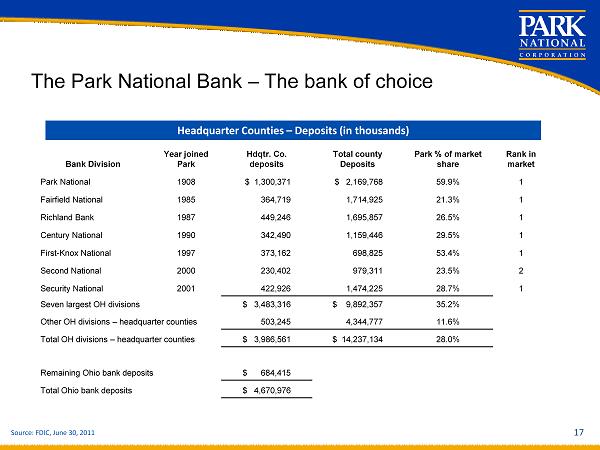
17 Bank Division Year joined Park Hdqtr. Co. deposits Total county Deposits Park % of market share Rank in market Park National 1908 $ 1,300,371 $ 2,169,768 59.9% 1 Fairfield National 1985 364,719 1,714,925 21.3% 1 Richland Bank 1987 449,246 1,695,857 26.5% 1 Century National 1990 342,490 1,159,446 29.5% 1 First - Knox National 1997 373,162 698,825 53.4% 1 Second National 2000 230,402 979,311 23.5% 2 Security National 2001 422,926 1,474,225 28.7% 1 Seven largest OH divisions $ 3,483,316 $ 9,892,357 35.2% Other OH divisions – headquarter counties 503,245 4,344,777 11.6% Total OH divisions – headquarter counties $ 3,986,561 $ 14,237,134 28.0% Remaining Ohio bank deposits $ 684,415 Total Ohio bank deposits $ 4,670,976 The Park National Bank – The bank of choice Headquarter Counties – Deposits (in thousands) Source: FDIC, June 30, 2011
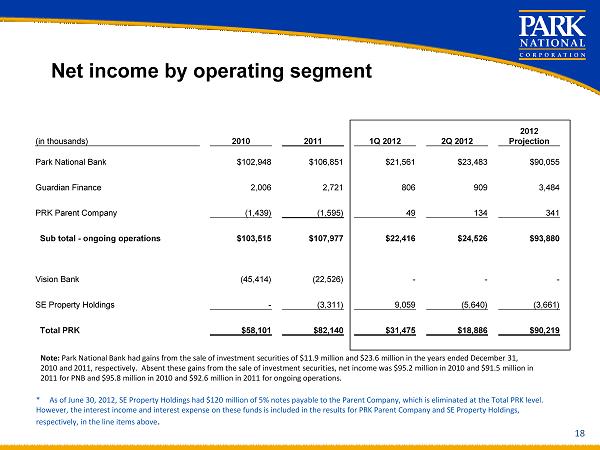
18 Net income by operating segment * As of June 30, 2012, SE Property Holdings had $120 million of 5% notes payable to the Parent Company, which is eliminat ed at the Total PRK level. However, the interest income and interest expense on these funds is included in the results for PRK Parent Company and SE Pro per ty Holdings, respectively, in the line items above . (in thousands) 2010 2011 1Q 2012 2Q 2012 2012 Projection Park National Bank $102,948 $106,851 $21,561 $23,483 $ 90,055 Guardian Finance 2,006 2,721 806 909 3,484 PRK Parent Company (1,439) (1,595) 49 134 341 Sub total - ongoing operations $103,515 $107,977 $22,416 $24,526 $93,880 Vision Bank (45,414) (22,526) - - - SE Property Holdings - (3,311) 9,059 (5,640) (3,661) Total PRK $58,101 $82,140 $31,475 $18,886 $ 90,219 Note : Park National Bank had gains from the sale of investment securities of $11.9 million and $23.6 million in the years ended Dec emb er 31, 2010 and 2011, respectively. Absent these gains from the sale of investment securities, net income was $95.2 million in 2010 an d $91.5 million in 2011 for PNB and $95.8 million in 2010 and $92.6 million in 2011 for ongoing operations.
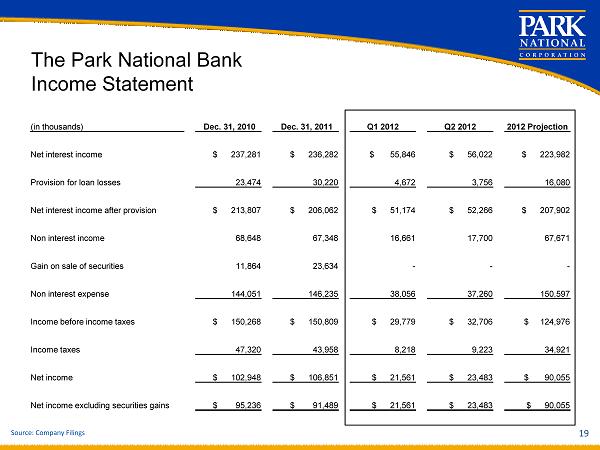
19 Source: Company Filings The Park National Bank Income Statement (in thousands) Dec. 31, 2010 Dec. 31, 2011 Q1 2012 Q2 2012 2012 Projection Net interest income $ 237,281 $ 236,282 $ 55,846 $ 56,022 $ 223,982 Provision for loan losses 23,474 30,220 4,672 3,756 16,080 Net interest income after provision $ 213,807 $ 206,062 $ 51,174 $ 52,266 $ 207,902 Non interest income 68,648 67,348 16,661 17,700 67,671 Gain on sale of securities 11,864 23,634 - - - Non interest expense 144,051 146,235 38,056 37,260 150,597 Income before income taxes $ 150,268 $ 150,809 $ 29,779 $ 32,706 $ 124,976 Income taxes 47,320 43,958 8,218 9,223 34,921 Net income $ 102,948 $ 106,851 $ 21,561 $ 23,483 $ 90,055 Net income excluding securities gains $ 95,236 $ 91,489 $ 21,561 $ 23,483 $ 90,055

Park National Bank Statement of Condition 20 Source: Company Filings (in millions) Dec. 31, 2010 Dec. 31, 2011 June 30, 2012 Annualized % Change From 2011 Investment securities $1,927 $1,604 $1,686 10.28% Loans 4,075 4,172 4,281 5.25% Allowance for loan losses ( 73) ( 55) ( 56) 3.66% Assets held for sale - - - - Other assets 567 561 625 22.94% Total assets $6,496 $6,282 $6,536 8.13% Non - interest bearing deposits $1,026 $1,150 $1,137 ( 2.27)% Interest bearing deposits 3,597 3,462 3,780 18.47% Total deposits 4,623 4,612 4,917 13.30% Total borrowings 1,390 1,194 1,138 ( 9.43)% Liabilities held for sale - - - - Other liabilities 63 58 53 ( 17.34)% Stockholders’ equity 420 418 428 4.81% Total liabilities & stockholders’ equity $6,496 $6,282 $6,536 8.13%
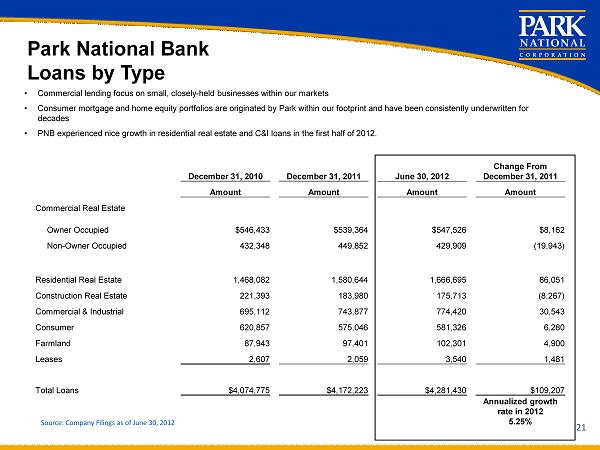
21 Park National Bank Loans by Type Source: Company Filings as of June 30, 2012 • Commercial lending focus on small, closely - held businesses within our markets • Consumer mortgage and home equity portfolios are originated by Park within our footprint and have been consistently underwrit ten for decades • PNB experienced nice growth in residential real estate and C&I loans in the first half of 2012. December 31, 2010 December 31, 2011 June 30, 2012 Change From December 31, 2011 Amount Amount Amount Amount Commercial Real Estate Owner Occupied $546,433 $539,364 $547,526 $8,162 Non - Owner Occupied 432,348 449,852 429,909 (19,943) Residential Real Estate 1,468,082 1,580,644 1,666,695 86,051 Construction Real Estate 221,393 183,980 175,713 (8,267) Commercial & Industrial 695,112 743,877 774,420 30,543 Consumer 620,857 575,046 581,326 6,280 Farmland 87,943 97,401 102,301 4,900 Leases 2,607 2,059 3,540 1,481 Total Loans $4,074,775 $4,172,223 $4,281,430 $109,207 Annualized growth rate in 2012 5.25%

22 Source: Company Filings SEPH / Vision Bank Income Statement (in thousands) Dec. 31, 2010 Dec. 31, 2011 Q1 2012 Q2 2012 2012 Projection Net interest income $ 27,867 $ 26,104 $ 2,610 $ (1,125) $ (1,195) Provision for loan losses 61,407 31,052 3,416 1,282 7,297 Net interest income after provision $ (33,540) $ (4,948) $ (806) $ (2,407) $ (8,492) Fee Income (6,024) (1,617) 724 (275) (553) Security gains - 5,195 - - - Gain on sale of Vision business - - 22,167 - 22,167 Total other expense 31,623 32,461 8,165 5,999 18,831 Income before income taxes $ (71,187) $ (33,831) $ 13,920 $ (8,681) $ (5,709) Income taxes (25,773) (7,994) 4,861 (3,041) (2,048) Net income $ (45,414) $ (25,837) $ 9,059 $ (5,640) $ (3,661) Net income excluding securities gains $ (45,414) $ (29,214) $ 9,059 $ (5,640) $ (3,661)
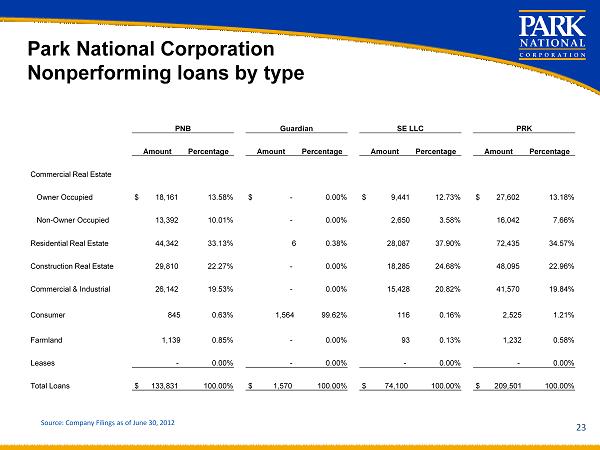
23 Park National Corporation Nonperforming loans by type Source: Company Filings as of June 30, 2012 PNB Guardian SE LLC PRK Amount Percentage Amount Percentage Amount Percentage Amount Percentage Commercial Real Estate Owner Occupied $ 18,161 13.58% $ - 0.00% $ 9,441 12.73% $ 27,602 13.18% Non - Owner Occupied 13,392 10.01% - 0.00% 2,650 3.58% 16,042 7.66% Residential Real Estate 44,342 33.13% 6 0.38% 28,087 37.90% 72,435 34.57% Construction Real Estate 29,810 22.27% - 0.00% 18,285 24.68% 48,095 22.96% Commercial & Industrial 26,142 19.53% - 0.00% 15,428 20.82% 41,570 19.84% Consumer 845 0.63% 1,564 99.62% 116 0.16% 2,525 1.21% Farmland 1,139 0.85% - 0.00% 93 0.13% 1,232 0.58% Leases - 0.00% - 0.00% - 0.00% - 0.00% Total Loans $ 133,831 100.00% $ 1,570 100.00% $ 74,100 100.00% $ 209,501 100.00%
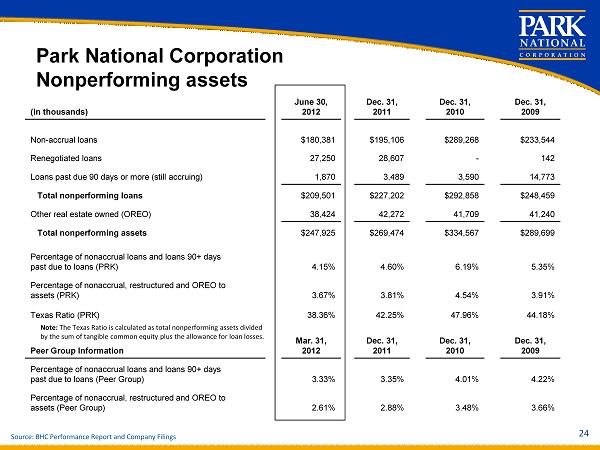
24 Park National Corporation Nonperforming assets Source : BHC Performance Report and Company Filings (in thousands) June 30, 2012 Dec. 31, 2011 Dec. 31, 2010 Dec. 31, 2009 Non - accrual loans $180,381 $195,106 $289,268 $233,544 Renegotiated loans 27,250 28,607 - 142 Loans past due 90 days or more (still accruing) 1,870 3,489 3,590 14,773 Total nonperforming loans $209,501 $227,202 $292,858 $248,459 Other real estate owned (OREO) 38,424 42,272 41,709 41,240 Total nonperforming assets $247,925 $269,474 $334,567 $289,699 Percentage of nonaccrual loans and loans 90+ days past due to loans (PRK) 4.15% 4.60% 6.19% 5.35% Percentage of nonaccrual, restructured and OREO to assets (PRK) 3.67% 3.81% 4.54% 3.91% Texas Ratio (PRK) 38.36% 42.25% 47.96% 44.18% Peer Group Information Mar . 31, 2012 Dec. 31, 2011 Dec. 31, 2010 Dec. 31, 2009 Percentage of nonaccrual loans and loans 90+ days past due to loans (Peer Group) 3.33% 3.35% 4.01% 4.22% Percentage of nonaccrual, restructured and OREO to assets (Peer Group) 2.61% 2.88% 3.48% 3.66% Note: The Texas Ratio is calculated as total nonperforming assets divided by the sum of tangible common equity plus the allowance for loan losses.
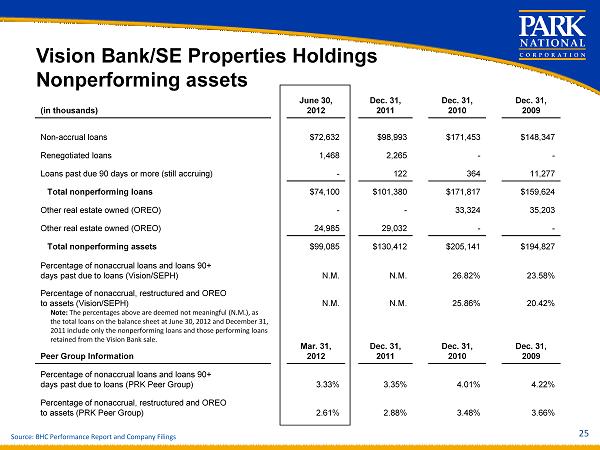
25 Vision Bank/SE Properties Holdings Nonperforming assets Source : BHC Performance Report and Company Filings (in thousands) June 30, 2012 Dec. 31, 2011 Dec. 31, 2010 Dec. 31, 2009 Non - accrual loans $72,632 $98,993 $171,453 $148,347 Renegotiated loans 1,468 2,265 - - Loans past due 90 days or more (still accruing) - 122 364 11,277 Total nonperforming loans $74,100 $101,380 $171,817 $159,624 Other real estate owned (OREO) - - 33,324 35,203 Other real estate owned (OREO) 24,985 29,032 - - Total nonperforming assets $99,085 $130,412 $205,141 $194,827 Percentage of nonaccrual loans and loans 90+ days past due to loans (Vision/SEPH) N.M. N.M. 26.82% 23.58% Percentage of nonaccrual, restructured and OREO to assets (Vision/SEPH) N.M. N.M. 25.86% 20.42% Peer Group Information Mar . 31, 2012 Dec. 31, 2011 Dec. 31, 2010 Dec. 31, 2009 Percentage of nonaccrual loans and loans 90+ days past due to loans (PRK Peer Group) 3.33% 3.35% 4.01% 4.22% Percentage of nonaccrual, restructured and OREO to assets (PRK Peer Group) 2.61% 2.88% 3.48% 3.66% Note: The percentages above are deemed not meaningful (N.M.), as the total loans on the balance sheet at June 30, 2012 and December 31, 2011 include only the nonperforming loans and those performing loans retained from the Vision Bank sale.
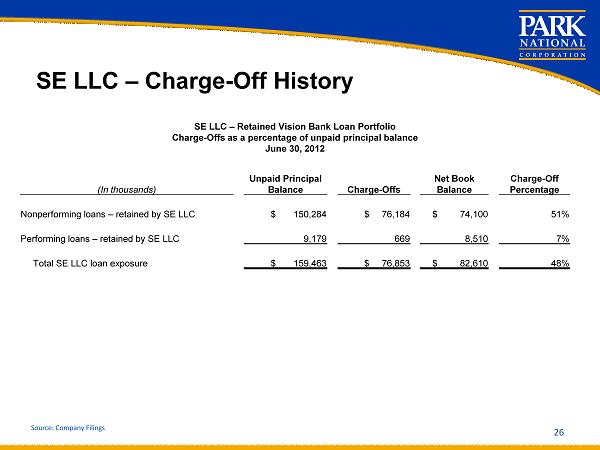
SE LLC – Charge - Off History 26 SE LLC – Retained Vision Bank Loan Portfolio Charge - Offs as a percentage of unpaid principal balance June 30 , 2012 (In thousands) Unpaid Principal Balance Charge - Offs Net Book Balance Charge - Off Percentage Nonperforming loans – retained by SE LLC $ 150,284 $ 76,184 $ 74,100 51% Performing loans – retained by SE LLC 9,179 669 8,510 7% Total SE LLC loan exposure $ 159,463 $ 76,853 $ 82,610 48% Source: Company Filings
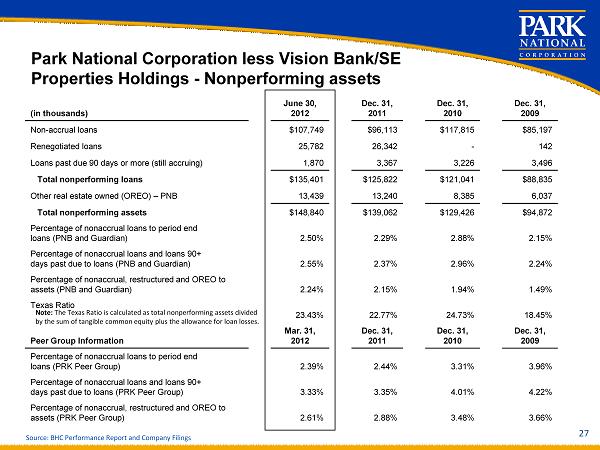
27 Source : BHC Performance Report and Company Filings (in thousands) June 30, 2012 Dec. 31, 2011 Dec. 31, 2010 Dec. 31, 2009 Non - accrual loans $107,749 $96,113 $117,815 $85,197 Renegotiated loans 25,782 26,342 - 142 Loans past due 90 days or more (still accruing) 1,870 3,367 3,226 3,496 Total nonperforming loans $135,401 $125,822 $121,041 $88,835 Other real estate owned (OREO) – PNB 13,439 13,240 8,385 6,037 Total nonperforming assets $148,840 $139,062 $129,426 $94,872 Percentage of nonaccrual loans to period end loans (PNB and Guardian) 2.50% 2.29% 2.88% 2.15% Percentage of nonaccrual loans and loans 90+ days past due to loans (PNB and Guardian) 2.55% 2.37% 2.96% 2.24% Percentage of nonaccrual, restructured and OREO to assets (PNB and Guardian) 2.24% 2.15% 1.94% 1.49% Texas Ratio 23.43% 22.77% 24.73% 18.45% Peer Group Information Mar . 31, 2012 Dec. 31, 2011 Dec. 31, 2010 Dec. 31, 2009 Percentage of nonaccrual loans to period end loans (PRK Peer Group) 2.39% 2.44% 3.31% 3.96% Percentage of nonaccrual loans and loans 90+ days past due to loans (PRK Peer Group) 3.33% 3.35% 4.01% 4.22% Percentage of nonaccrual, restructured and OREO to assets (PRK Peer Group) 2.61% 2.88% 3.48% 3.66% Park National Corporation less Vision Bank/SE Properties Holdings - Nonperforming assets Note: The Texas Ratio is calculated as total nonperforming assets divided by the sum of tangible common equity plus the allowance for loan losses.
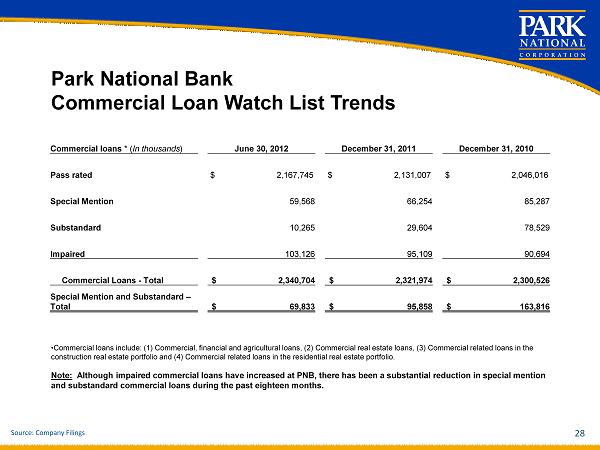
Park National Bank Commercial Loan Watch List Trends 28 Commercial loans * ( In thousands ) June 30, 2012 December 31, 2011 December 31, 2010 Pass rated $ 2,167,745 $ 2,131,007 $ 2,046,016 Special Mention 59,568 66,254 85,287 Substandard 10,265 29,604 78,529 Impaired 103,126 95,109 90,694 Commercial Loans - Total $ 2,340,704 $ 2,321,974 $ 2,300,526 Special Mention and Substandard – Total $ 69,833 $ 95,858 $ 163,816 • Commercial loans include: (1) Commercial, financial and agricultural loans, (2) Commercial real estate loans, (3) Commercial rel ated loans in the construction real estate portfolio and (4) Commercial related loans in the residential real estate portfolio. Note: Although impaired commercial loans have increased at PNB, there has been a substantial reduction in special mention and substandard commercial loans during the past eighteen months. Source: Company Filings
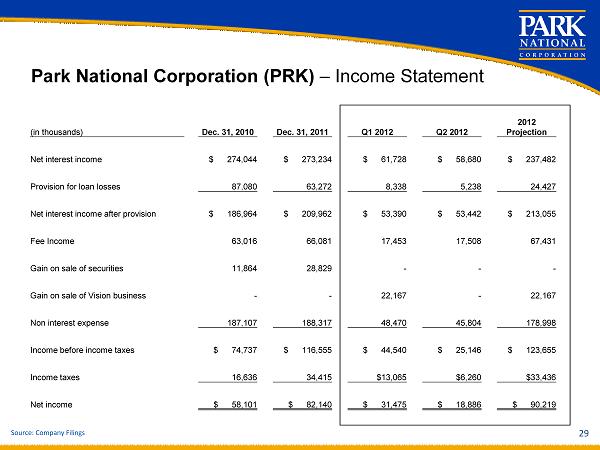
29 Park National Corporation (PRK) – Income Statement Source: Company Filings (in thousands) Dec. 31, 2010 Dec. 31, 2011 Q1 2012 Q2 2012 2012 Projection Net interest income $ 274,044 $ 273,234 $ 61,728 $ 58,680 $ 237,482 Provision for loan losses 87,080 63,272 8,338 5,238 24,427 Net interest income after provision $ 186,964 $ 209,962 $ 53,390 $ 53,442 $ 213,055 Fee Income 63,016 66,081 17,453 17,508 67,431 Gain on sale of securities 11,864 28,829 - - - Gain on sale of Vision business - - 22,167 - 22,167 Non interest expense 187,107 188,317 48,470 45,804 178,998 Income before income taxes $ 74,737 $ 116,555 $ 44,540 $ 25,146 $ 123,655 Income taxes 16,636 34,415 $13,065 $6,260 $33,436 Net income $ 58,101 $ 82,140 $ 31,475 $ 18,886 $ 90,219
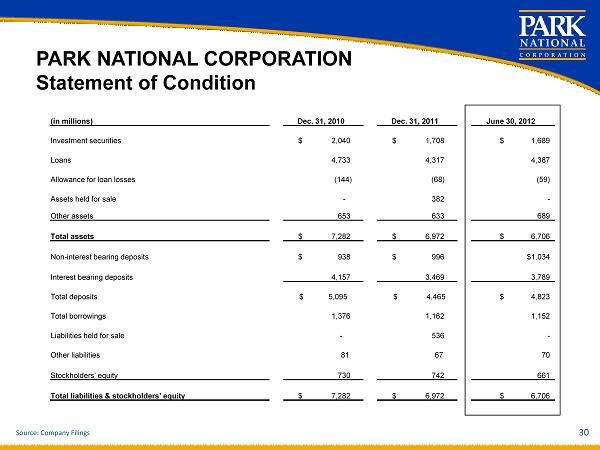
PARK NATIONAL CORPORATION Statement of Condition 30 Source: Company Filings (in millions) Dec. 31, 2010 Dec. 31, 2011 June 30, 2012 Investment securities $ 2,040 $ 1,708 $ 1,689 Loans 4,733 4,317 4,387 Allowance for loan losses (144) (68) (59) Assets held for sale - 382 - Other assets 653 633 689 Total assets $ 7,282 $ 6,972 $ 6,706 Non - interest bearing deposits $ 938 $ 996 $1,034 Interest bearing deposits 4,157 3,469 3,789 Total deposits $ 5,095 $ 4,465 $ 4,823 Total borrowings 1,376 1,162 1,152 Liabilities held for sale - 536 - Other liabilities 81 67 70 Stockholders’ equity 730 742 661 Total liabilities & stockholders’ equity $ 7,282 $ 6,972 $ 6,706
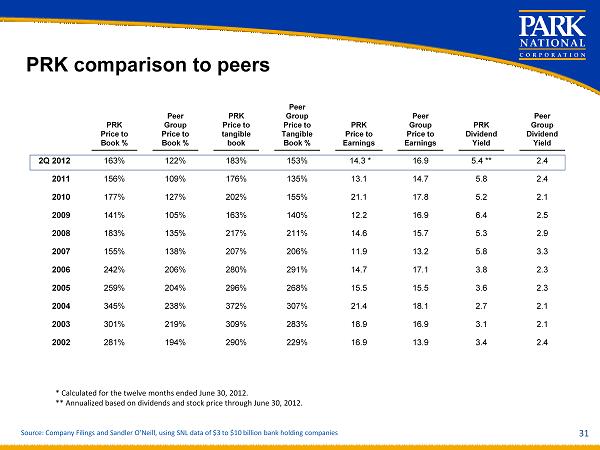
31 PRK comparison to peers * Calculated for the twelve months ended June 30, 2012. ** Annualized based on dividends and stock price through June 30, 2012. Source: Company Filings and Sandler O’Neill, using SNL data of $3 to $10 billion bank holding companies PRK Price to Book % Peer Group Price to Book % PRK Price to tangible book Peer Group Price to Tangible Book % PRK Price to Earnings Peer Group Price to Earnings PRK Dividend Yield Peer Group Dividend Yield 2Q 2012 163% 122% 183% 153% 14.3 * 16.9 5.4 ** 2.4 2011 156% 109% 176% 135% 13.1 14.7 5.8 2.4 2010 177% 127% 202% 155% 21.1 17.8 5.2 2.1 2009 141% 105% 163% 140% 12.2 16.9 6.4 2.5 2008 183% 135% 217% 211% 14.6 15.7 5.3 2.9 2007 155% 138% 207% 206% 11.9 13.2 5.8 3.3 2006 242% 206% 280% 291% 14.7 17.1 3.8 2.3 2005 259% 204% 296% 268% 15.5 15.5 3.6 2.3 2004 345% 238% 372% 307% 21.4 18.1 2.7 2.1 2003 301% 219% 309% 283% 18.9 16.9 3.1 2.1 2002 281% 194% 290% 229% 16.9 13.9 3.4 2.4
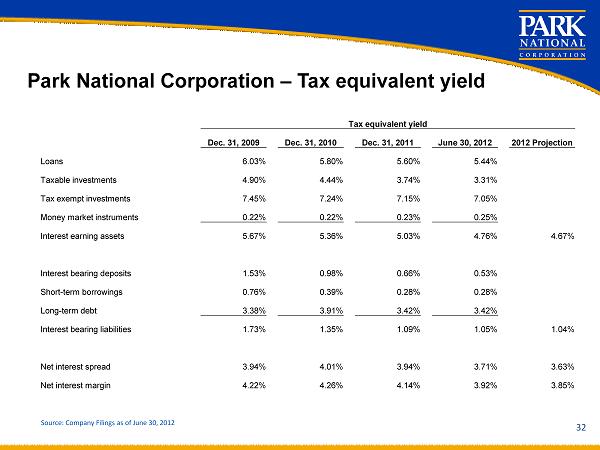
32 Park National Corporation – Tax equivalent yield Source: Company Filings as of June 30, 2012 Tax equivalent yield Dec. 31, 2009 Dec. 31, 2010 Dec. 31, 2011 June 30, 2012 2012 Projection Loans 6.03% 5.80% 5.60% 5.44% Taxable investments 4.90% 4.44% 3.74% 3.31% Tax exempt investments 7.45% 7.24% 7.15% 7.05% Money market instruments 0.22% 0.22% 0.23% 0.25% Interest earning assets 5.67% 5.36% 5.03% 4.76% 4.67% Interest bearing deposits 1.53% 0.98% 0.66% 0.53% Short - term borrowings 0.76% 0.39% 0.28% 0.28% Long - term debt 3.38% 3.91% 3.42% 3.42% Interest bearing liabilities 1.73% 1.35% 1.09% 1.05% 1.04% Net interest spread 3.94% 4.01% 3.94% 3.71% 3.63% Net interest margin 4.22% 4.26% 4.14% 3.92% 3.85%
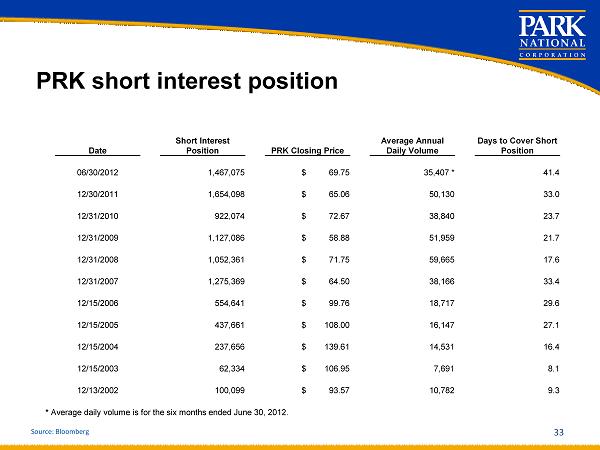
PRK short interest position 33 Date Short Interest Position PRK Closing Price Average Annual Daily V olume Days to Cover Short Position 06/30/2012 1,467,075 $ 69.75 35,407 * 41.4 12/30/2011 1,654,098 $ 65.06 50,130 33.0 12/31/2010 922,074 $ 72.67 38,840 23.7 12/31/2009 1,127,086 $ 58.88 51,959 21.7 12/31/2008 1,052,361 $ 71.75 59,665 17.6 12/31/2007 1,275,369 $ 64.50 38,166 33.4 12/15/2006 554,641 $ 99.76 18,717 29.6 12/15/2005 437,661 $ 108.00 16,147 27.1 12/15/2004 237,656 $ 139.61 14,531 16.4 12/15/2003 62,334 $ 106.95 7,691 8.1 12/13/2002 100,099 $ 93.57 10,782 9.3 Source: Bloomberg * Average daily volume is for the six months ended June 30, 2012.
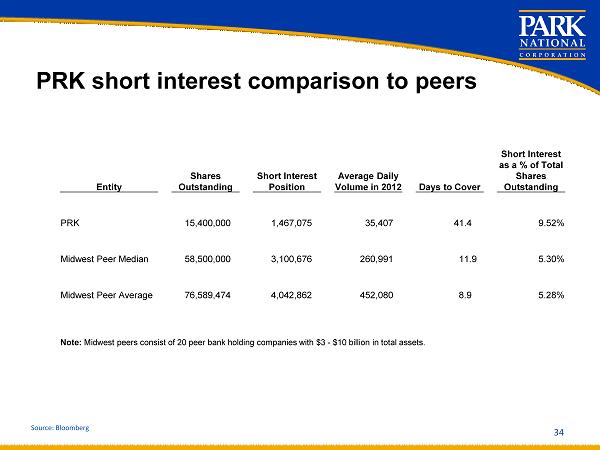
PRK short interest comparison to peers 34 Entity Shares Outstanding Short Interest Position Average Daily Volume in 2012 Days to Cover Short Interest as a % of Total Shares Outstanding PRK 15,400,000 1,467,075 35,407 41.4 9.52% Midwest Peer Median 58,500,000 3,100,676 260,991 11.9 5.30% Midwest Peer Average 76,589,474 4,042,862 452,080 8.9 5.28% Note: Midwest peers consist of 20 peer bank holding companies with $3 - $10 billion in total assets. Source: Bloomberg
Why invest in Park National Corporation? • Unique, localized business model makes us the bank of choice for customers. • History of dividend payments to shareholders and a strong dividend yield. • Favorably positioned to take advantage of growth opportunities in our markets, largely caused by industry dislocation, increased regulations and fatigue. • Park’s short interest position is high compared to both historic levels and peer group. As short interest position returns to historic levels, our stock price should react favorably. • Experienced leadership team with proven knowledge of local markets • Management expects the Ohio franchise will earn $90 - $94 million in 2012. Using a P/E ratio of 13, implies a stock price of $75 to $80. • Nice reduction of $31.3 million or 24.0% in the legacy Vision Bank problem assets through June 30, 2012. 35

36 July 31, 2012 KBW Community Banking Investor Conference