Attached files
| file | filename |
|---|---|
| 8-K - FORM 8-K - NATIONAL FINANCIAL PARTNERS CORP | d387503d8k.htm |
 SECOND QUARTER 2012 EARNINGS CALL PRESENTATION
July 31, 2012
Exhibit 99.1 |
 2
Related to Forward-Looking Statements
Certain
items
in
this
presentation
and
in
today’s
discussion,
including
matters
relating
to
revenue,
net
income,
Adjusted
EBITDA,
cash earnings, cash earnings per diluted share and percentages or calculations
using these measures, acquisitions, capital structure or growth rates and
other financial measurements and non-financial statements in future periods, constitute forward-
looking statements as that term is defined in the Private Securities Litigation
Reform Act of 1995. These forward-looking statements are based on
management's current views with respect to future results and are subject to risks and uncertainties.
These statements are not guarantees of future performance. Actual results may
differ materially from those contemplated by forward-looking
statements.
National
Financial
Partners
Corp.
(“NFP”
or
the
“Company”)
refers
you
to
its
filings
with
the
SEC,
including its Annual Report on Form 10-K for the year ended December 31, 2011,
filed on February 13, 2012, for additional discussion of these risks and
uncertainties as well as a cautionary statement regarding forward-looking statements. Forward-
looking statements made during this presentation speak only as of today's
date. NFP expressly disclaims any obligation to update or revise any
forward-looking statements, whether as a result of new information, future events or otherwise. |
 3
Related to Non-GAAP Financial Information
The Company analyzes its performance using historical and forward-looking
non-GAAP financial measures called cash earnings, cash earnings per
diluted share, Adjusted EBITDA, and percentages or calculations using these measures.
The
Company
believes
these
non-GAAP
financial
measures
provide
additional
meaningful
methods
of
evaluating
certain aspects of the Company’s operating performance from period to period
on a basis that may not be otherwise apparent under GAAP. Cash earnings is
defined as net income excluding amortization of intangibles; depreciation; the
after-tax impact of the impairment of goodwill and intangible assets; the
after-tax impact of non-cash interest; the after- tax impact of
change in estimated acquisition earn-out payables recorded in accordance with purchase accounting that
have
been
subsequently
adjusted
and
recorded
in
the
consolidated
statements
of
operations;
the
after-tax
impact
of
management contract buyouts and the after-tax impact of certain
non-recurring items. Cash earnings per diluted share is calculated by
dividing cash earnings by the number of weighted average diluted shares outstanding for the period
indicated.
Cash
earnings
and
cash
earnings
per
diluted
share
should
not
be
viewed
as
substitutes
for
net
income
and
net income per diluted share, respectively. Adjusted EBITDA is defined as net
income excluding income tax expense; interest income; interest expense; gain
on early extinguishment of debt; other, net; amortization of intangibles;
depreciation; impairment of goodwill and intangible assets; (gain) loss on sale of
businesses, net; the accelerated vesting of certain RSUs; any change in
estimated acquisition earn-out payables recorded in accordance with purchase
accounting that have been subsequently adjusted and recorded in the consolidated
statements of operations and the expense related to management contract
buyouts. Adjusted EBITDA should not be viewed as a substitute for net
income. A reconciliation of these non-GAAP financial measures to their GAAP
counterparts for the periods presented herein is provided in the
Company’s quarterly financial supplement for the period ended June 30, 2012, which is
available on the Investor Relations section of the Company’s Web site at
www.nfp.com. |
 4
Reconciliation: Net Income to Cash Earnings
(1) Cash earnings is a non-GAAP financial measure, which the Company defines as
net income excluding amortization of intangibles; depreciation; the after-tax impact of the impairment of goodwill and intangible
assets; the after-tax impact of non-cash interest; the after-tax impact
of change in estimated acquisition earn-out payables recorded in accordance with purchase accounting that have been subsequently adjusted
and recorded in the consolidated statements of operations; the after-tax impact
of management contract buyouts and the after-tax impact of certain non-recurring items.
(2)
The
sum
of
the
per-share
components
of
cash
earnings
per
share
-
diluted
may
not
agree
to
cash
earnings
per
share
-
diluted
due
to
rounding.
RECONCILIATION OF NET INCOME TO CASH EARNINGS
(Unaudited-in thousands, except per share amounts)
Three Months Ended
June 30,
2012
2011
GAAP net income
4,866
$
9,490
$
Amortization of intangibles
8,214
7,897
Depreciation
3,113
3,037
Impairment of goodwill and intangible assets
9,559
920
Tax benefit of impairment of goodwill and
intangible assets
(3,632)
(364)
Non-cash interest, net of tax
724
637
Change in estimated acquisition earn-out payables, net of tax
1,692
-
Management contract buyout, net of tax
2,593
-
Cash earnings (1)
27,129
$
21,617
$
GAAP net income per share - diluted
0.12
$
0.21
$
Amortization of intangibles
0.20
0.17
Depreciation
0.08
0.07
Impairment of goodwill and intangible assets
0.23
0.02
Tax benefit of impairment of goodwill and
intangible assets
(0.09)
(0.01)
Non-cash interest, net of tax
0.02
0.01
Change in estimated acquisition earn-out payables, net of tax
0.04
-
Management contract buyout, net of tax
0.06
-
Cash earnings per share - diluted (2)
0.66
$
0.48
$
|
 5
Reconciliation: Net Income to
Adjusted EBITDA
(1) Adjusted EBITDA is a non-GAAP financial measure, which the Company defines as net
income excluding income tax expense; interest income; interest expense; gain on early
extinguishment of debt; other, net; amortization of intangibles; depreciation; impairment of goodwill
and intangible assets; (gain) loss on sale of businesses, net; the accelerated vesting of
certain RSUs; any change in estimated acquisition earn-out payables recorded in accordance with purchase accounting that have been subsequently adjusted and recorded
in the consolidated statements of operations and the expense related to management contract buyouts.
The reconciliation of Adjusted EBITDA per reportable segment does not include the
following items, which are not allocated to any of the Company’s reportable segments: income tax
expense; interest income; interest expense; gain on early extinguishment of debt and other, net. These
items are included in the reconciliation of Adjusted EBITDA to net income on a consolidated
basis.
Corporate
Individual
Advisor
(in thousands)
Client Group
Client Group
Services Group
Consolidated
For the three months ended June 30, 2012
GAAP net income
4,866
$
Income tax expense
2,213
Interest income
(640)
Interest expense
4,146
Other, net
(1,072)
Income from operations
4,892
$
2,337
$
2,284
$
9,513
$
Amortization of intangibles
5,878
2,336
-
8,214
Depreciation
1,408
1,007
698
3,113
Impairment of goodwill and intangible assets
3,254
6,305
-
9,559
(Gain) loss on sale of businesses, net
-
(4,047)
-
(4,047)
Change in estimated acquisition earn-out payables
2,437
-
-
2,437
Management contract buyout
4,182
-
-
4,182
Adjusted EBITDA
(1)
22,051
$
7,938
$
2,982
$
32,971
$
For the three months ended June 30, 2011
GAAP net income
9,490
$
Income tax expense
6,997
Interest income
(926)
Interest expense
3,974
Other, net
(1,328)
Income from operations
10,017
$
5,442
$
2,748
$
18,207
$
Amortization of intangibles
5,129
2,768
-
7,897
Depreciation
1,615
1,126
296
3,037
Impairment of goodwill and intangible assets
-
920
-
920
(Gain) loss on sale of businesses, net
(47)
60
-
13
Change in estimated acquisition earn-out payables
-
-
-
-
Management contract buyout
-
-
-
-
Adjusted EBITDA
(1)
16,714
$
10,316
$
3,044
$
30,074
$ |
 JESSICA BIBLIOWICZ |
 2Q12
Highlights Revenue $255.4 million
Revenue growth +6.7%
Organic revenue growth +4.1%
–
Corporate Client Group +7.2%
–
Individual Client Group +1.5%
–
Advisor Services Group (1.9)%
Growth from Corporate Client Group
Organic revenue
Acquisitions
Adjusted EBITDA grew 9.6%
Adjusted EBITDA margin expansion
7 |
 8
Recurring Revenue
Quarter-over-Quarter
Recurring Revenue
1
Year-over-Year
Recurring Revenue
1
Recurring revenue includes revenue from corporate and executive benefits, property
& casualty, wealth management and asset-based fees and trails. 2
Previously reported as 57.0% for FY10; updated due to re-categorization
of certain asset-based fees and trails. 2
61.8%
65.6%
2Q11
2Q12
58.0%
62.4%
FY 10
FY 11 |
 Mid-Year Capital
Allocation Update Stock buyback
2Q12: Started in May 2012, repurchased 463,210 shares at average
price of $13.13 for $6.1 million; $43.9 million remaining on
authorization as of June 30, 2012
YTD through June 30, 2012: repurchased approximately $14 million
(includes shares repurchased under 2011 authorization)
Strategic acquisitions
2Q12: $10.1 million
YTD through July 31, 2012: $65.5 million, including management
contract buyouts
Reinvestment in existing businesses
9 |
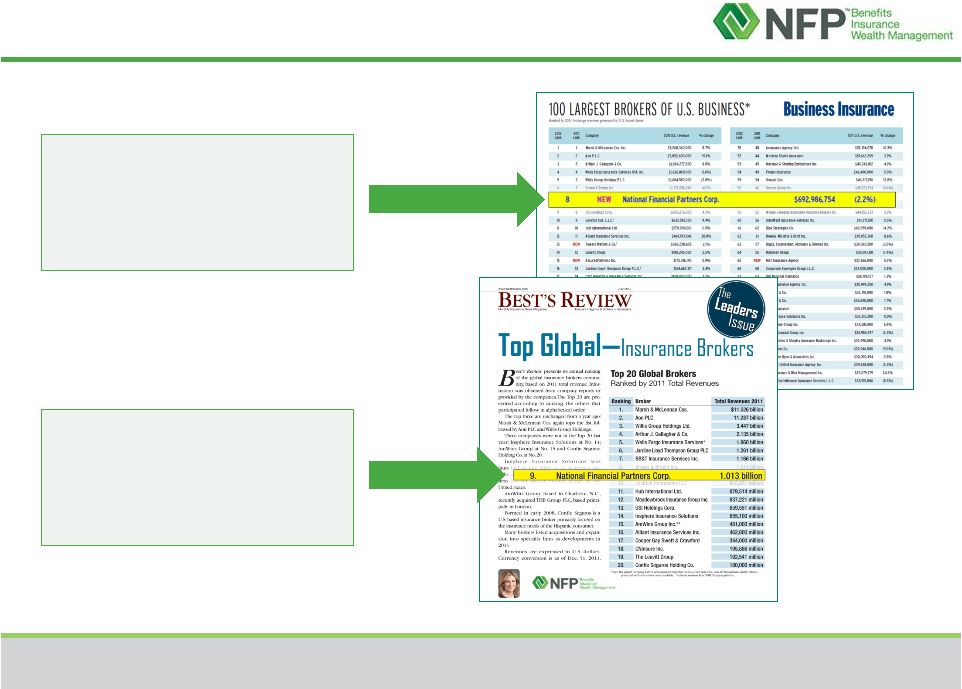 NFP
Industry Recognition # 8
100 Largest Brokers of U.S.
Business
Business Insurance
# 9
Top Global Insurance
Brokers
Best’s Review
The NFP logo is a trademark of National Financial Partners Corp.
All other trademarks or service marks used herein are
the property of their respective owners.
10 |
 DOUG HAMMOND |
 Business Segments
Advisor Services Group
Individual Client Group
Corporate Client Group
($ in millions)
2Q12 organic revenue growth +4.1%
Corporate Client Group +7.2%
Individual Client Group +1.5%
Advisor Services Group (1.9)%
1
The sum of the components may not agree to total due to rounding.
2Q12 Revenue $255.4 million
$112.6
44.1%
$80.9
31.6%
$62.0
24.3%
12
1 |
 13
Business Segment
2Q12 Overview & Components of Revenue
Corporate Client Group
27.3%
52.1%
Steady and recurring business
Diversification of products and services
Health & Welfare
Retirement
Ancillary & Voluntary Benefits
NFP Executive Benefits
NFP P&C
Strategic acquisitions
Management contract buyouts
P&C focus
2Q12 organic revenue growth +7.2%
FY 2012 expectations for CCG
Approximately 4% organic revenue growth
Adjusted EBITDA margins
% of CCG
Revenue
82.0%
9.0%
9.0%
44.1%
Corporate Benefits
Executive Benefits
Property & Casualty
•
Expect relatively flat organic revenue growth in 3Q12
•
Approximately 19%-20% in 2H12 |
 14
Business Segment
2Q12 Overview & Components of Revenue
27.3%
52.1%
Individual Client Group
% of ICG
Revenue
19.6%
29.9%
50.5%
Life insurance
Challenges and uncertainty remain in
the market
Wealth management
Solid performance continues
31.6%
Marketing Organization & Wholesale Life
Brokerage
Retail Life
Wealth Management |
 Business Segment
2Q12 Overview & Components of Revenue
27.3%
52.1%
% of ASG
Revenue
63.1%
36.9%
24.3%
Business drivers
New assets
Advisor recruitment
Asset-based fees
AUM $10.2 billion, up 1.7% YOY
Fusion acquisition in July 2012
Expect 2013 Adjusted EBITDA margin to expand
75-100 basis points from transaction
2Q12 organic revenue declined (1.9)%
Positive impact from asset based business
More than offset by market volatility impact on
transaction business
FY 2012 expectations for ASG (depending on
performance of financial markets)
Flat organic revenue growth
Adjusted EBITDA margins approximately 5%
Asset Based Fees & Trails
Commissions & Non-Recurring Fees
Advisor Services Group
15 |
 DONNA BLANK |
 2Q12
Consolidated Financial Highlights 1
$239.4
$255.4
($ in millions)
Adjusted EBITDA Margin
2Q11
2Q12
Corporate Client Group
17.7%
19.6%
Individual Client Group
12.6%
9.8%
Advisor Services Group
4.8%
4.8%
Consolidated
12.6%
12.9%
62%
66%
Recurring
Revenue
1
The sum of the components may not agree to total due to rounding.
$30.1
$33.0
32%
-23%
-2%
Change %
10%
19%
-1%
-2%
Change %
7%
$94.3
$112.6
$81.9
$80.9
$63.2
$62.0
$16.7
$22.1
$10.3
$7.9
$3.0
$3.0
2Q11
2Q12
2Q11
2Q12
YOY
revenue
growth
of
6.7%,
Adjusted
EBITDA
growth
of
9.6%
and
margin
expansion
primarily
driven
by
CCG
Revenue
Adjusted
EBITDA & Margin
17 |
 (Compensation
Expense,
Employees
)+(Fees
to
Principals)
Revenue
Total Compensation
Ratio
=
Total Compensation Ratio by Segment
49.7%
47.8%
48.6%
52.5%
50.2%
50.0%
49.2%
49.0%
51.2%
51.9%
46.0%
48.0%
50.0%
52.0%
54.0%
Q1'11
Q2'11
Q3'11
Q4'11
Q1'12
Q2'12
54.0%
52.3%
51.7%
48.9%
50.7%
50.7%
52.4%
52.3%
52.2%
49.8%
46.0%
48.0%
50.0%
52.0%
54.0%
Q1'11
Q2'11
Q3'11
Q4'11
Q1'12
Q2'12
Qtrly
YTD
Corporate Client Group
Individual Client Group
18 |
 Operating Cash Flow
Quarterly Operating Cash Flow
($ in millions)
5
37
34
43
(6)
40
46
36
(15)
19
Increases in operating cash flow from both organic growth and acquisitions offset
by: •
1Q12: Management Contract Buyout of $3.4 million; payment
of $7.3 million for Principal Incentive Plan
(plan period 10/10-12/11)
•
2Q12: payments of $13.0 million for legal settlement and other payments, expect to
be reimbursed for a significant portion in 2H12; and unfavorable
timing differences in working capital 19 |