Attached files
| file | filename |
|---|---|
| 8-K - 8-K - Bridge Capital Holdings | v319983_8k.htm |
Daniel P. Myers President Chief Executive Officer Director Thomas A. Sa Executive Vice President Chief Financial Officer Chief Strategy Officer KEEFE BRUYETTE & WOODS Community Bank Investor Conference August 1, 2012 B R I D G E C A P I T A L H O L D I N G S NASDAQ: BBNK WWW.BRIDGECAPITALHOLDINGS.COM
Forward Looking Statements Certain matters discussed herein constitute forward - looking statements within the meaning of the Private Securities Litigation Reform Act of 1995, and are subject to the safe harbors created by that Act. Forward - looking statements describe future plans, strategies, and expectations, and are based on currently available information, expectations, assumptions, projections, and management's judgment about the Bank, the banking industry and general economic conditions. These forward looking statements are subject to certain risks and uncertainties that could cause the actual results, performance or achievements to differ materially from those expressed, suggested or implied by the forward looking statements. These risks and uncertainties include, but are not limited to: (1) competitive pressures in the banking industry; (2) changes in interest rate environment; (3) general economic conditions, nationally, regionally, and in operating markets; (4) changes in the regulatory environment; (5) changes in business conditions and inflation; (6) changes in securities markets; (7) future credit loss experience; (8) the ability to satisfy requirements related to the Sarbanes - Oxley Act and other regulation on internal control; (9) civil disturbances or terrorist threats or acts, or apprehension about the possible future occurrences of acts of this type; and (10) the involvement of the United States in war or other hostilities. The reader should refer to the more complete discussion of such risks in Bridge Capital Holdings reports on Forms 10 - K and 10 - Q on file with the SEC. 2
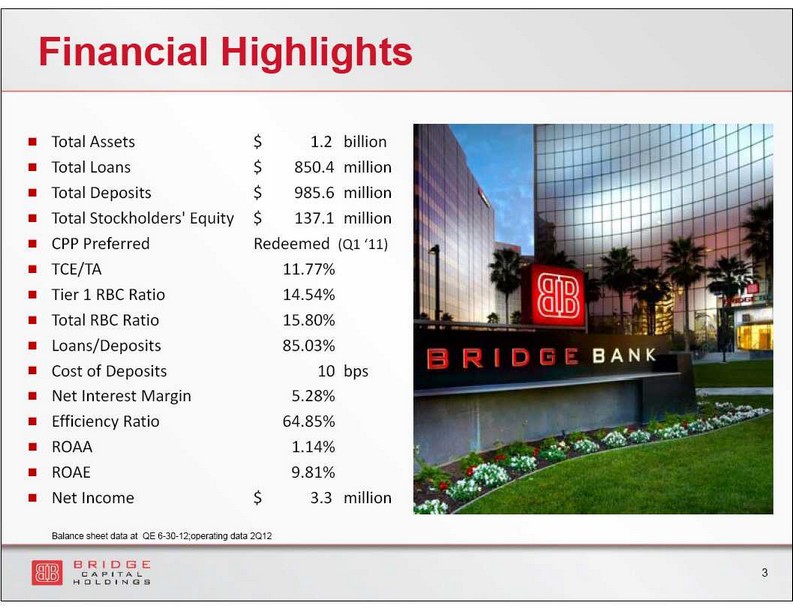
■ Total Assets $ 1.2 billion ■ Total Loans $ 850.4 million ■ Total Deposits $ 985.6 million ■ Total Stockholders' Equity $ 137.1 million ■ CPP Preferred Redeemed (Q1 ‘11) ■ TCE/TA 11.77% ■ Tier 1 RBC Ratio 14.54% ■ Total RBC Ratio 15.80% ■ Loans/Deposits 85.03% ■ Cost of Deposits 10 bps ■ Net Interest Margin 5.28% ■ Efficiency Ratio 64.85% ■ ROAA 1.14% ■ ROAE 9.81% ■ Net Income $ 3.3 million Financial Highlights 3 Balance sheet data at QE 6 - 30 - 12;operating data 2Q12
Bridge Bank Franchise ▪ True Business Bank ▪ Operating in attractive Silicon Valley and tech centric markets ▪ Full range of corporate banking products delivered through experienced advisors ▪ Core funding - driven approach to building the business ▪ 2 regional business centers + 6 business offices ▪ Unique & effective use of banking technology ▪ Experienced board and management ▪ Disciplined execution of our business plan 4
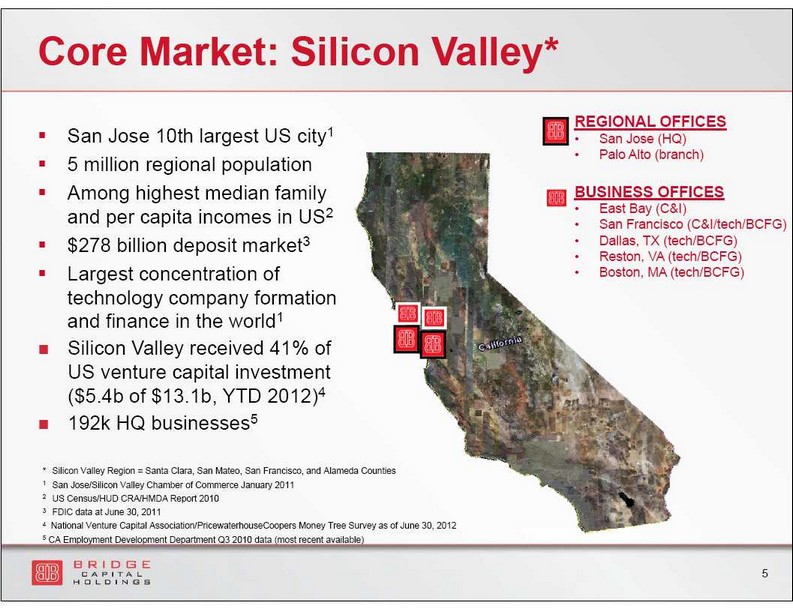
Core Market: Silicon Valley* ▪ San Jose 10th largest US city 1 ▪ 5 million regional population ▪ Among highest median family and per capita incomes in US 2 ▪ $278 billion deposit market 3 ▪ Largest concentration of technology company formation and finance in the world 1 Silicon Valley received 41% of US venture capital investment ($5.4b of $13.1b, YTD 2012) 4 192k HQ businesses 5 REGIONAL OFFICES • San Jose (HQ) • Palo Alto (branch) BUSINESS OFFICES • East Bay (C&I) • San Francisco (C&I/tech/BCFG) • Dallas, TX (tech/BCFG) • Reston, VA (tech/BCFG) • Boston, MA (tech/BCFG) * Silicon Valley Region = Santa Clara, San Mateo, San Francisco, and Alameda Counties 1 San Jose/Silicon Valley Chamber of Commerce January 2011 2 US Census/HUD CRA/HMDA Report 2010 3 FDIC data at June 30, 2011 4 National Venture Capital Association/PricewaterhouseCoopers Money Tree Survey as of June 30, 2012 5 CA Employment Development Department Q3 2010 data (most recent available) 5
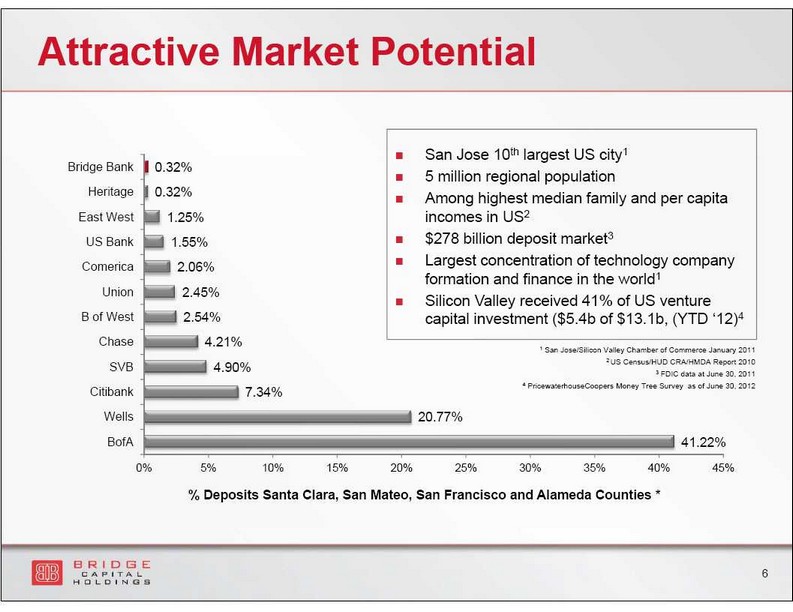
Attractive Market Potential 41.22% 20.77% 7.34% 4.90% 4.21% 2.54% 2.45% 2.06% 1.55% 1.25% 0.32% 0.32% 0% 5% 10% 15% 20% 25% 30% 35% 40% 45% BofA Wells Citibank SVB Chase B of West Union Comerica US Bank East West Heritage Bridge Bank % Deposits Santa Clara , San Mateo , San Francisco and Alameda Counties * San Jose 10 th largest US city 1 5 million regional population Among highest median family and per capita incomes in US 2 $278 billion deposit market 3 Largest concentration of technology company formation and finance in the world 1 Silicon Valley received 41% of US venture capital investment ($5.4b of $13.1b, (YTD ‘12) 4 6 1 San Jose/Silicon Valley Chamber of Commerce January 2011 2 US Census/HUD CRA/HMDA Report 2010 3 FDIC data at June 30, 2011 4 PricewaterhouseCoopers Money Tree Survey as of June 30, 2012
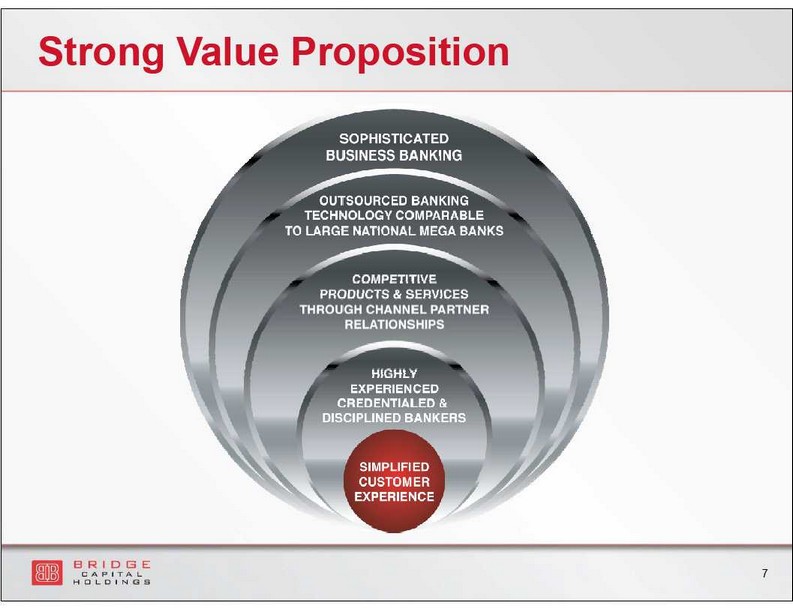
Strong Value Proposition 7
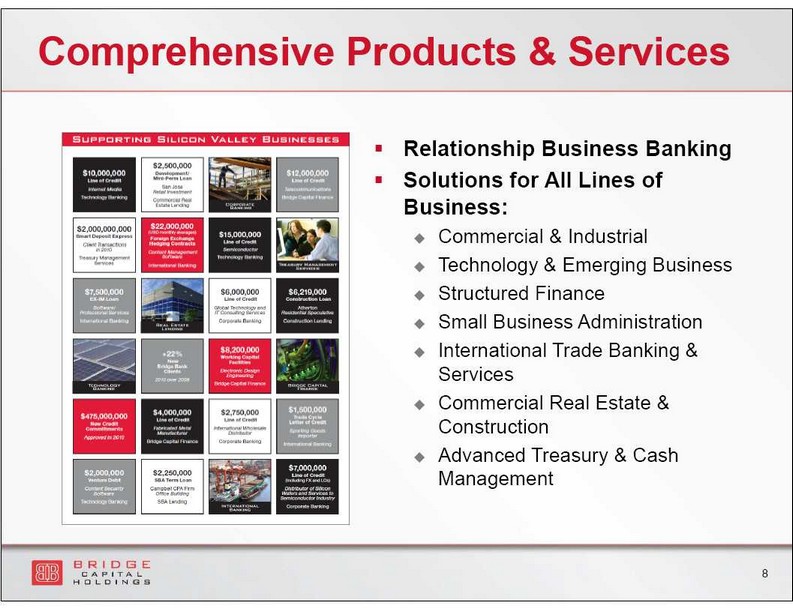
Comprehensive Products & Services ▪ Relationship Business Banking ▪ Solutions for All Lines of Business: Commercial & Industrial Technology & Emerging Business Structured Finance Small Business Administration I nternational Trade Banking & Services Commercial Real Estate & Construction Advanced Treasury & Cash Management 8
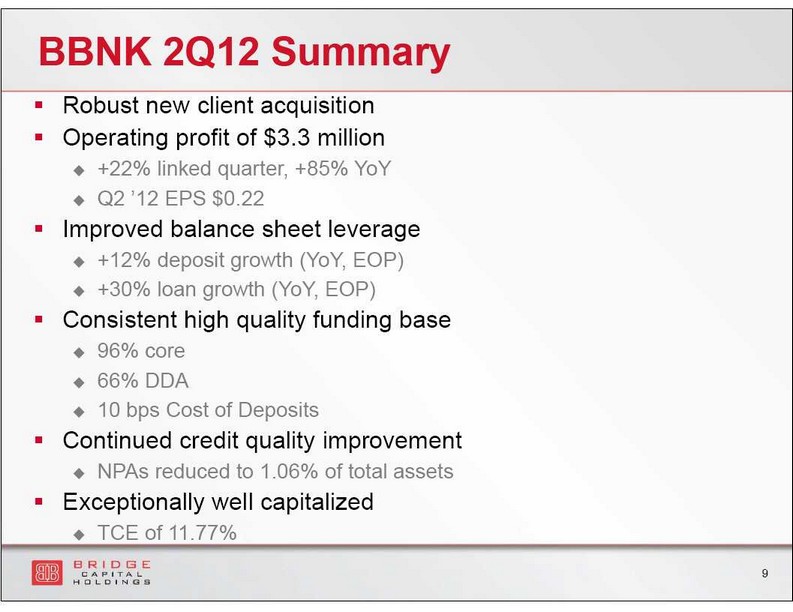
BBNK 2Q12 Summary ▪ Robust new client acquisition ▪ Operating profit of $3.3 million +22% linked quarter, +85% YoY Q2 ’12 EPS $0.22 ▪ Improved balance sheet leverage +12% deposit growth (YoY, EOP) +30% loan growth (YoY, EOP) ▪ Consistent high quality funding base 96% core 66% DDA 10 bps Cost of Deposits ▪ Continued credit quality improvement NPAs reduced to 1.06% of total assets ▪ Exceptionally well capitalized TCE of 11.77% 9
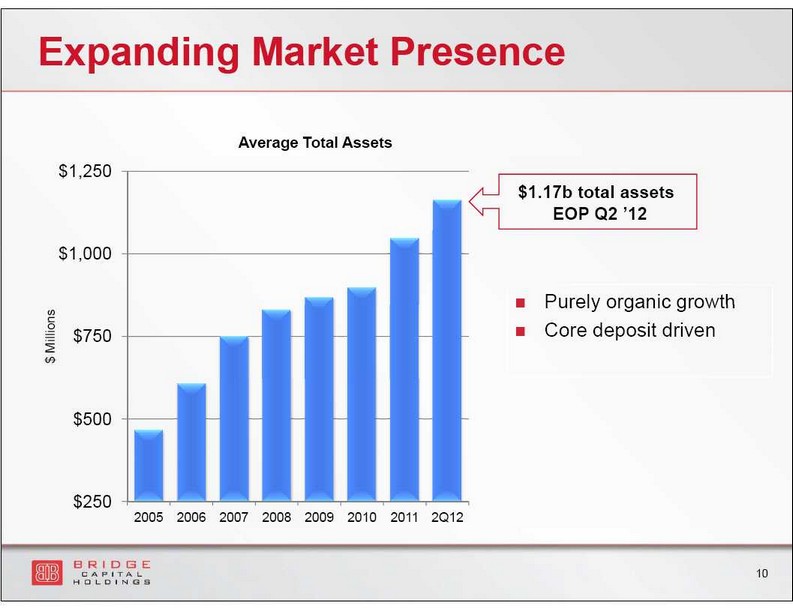
Expanding Market Presence $250 $500 $750 $1,000 $1,250 2005 2006 2007 2008 2009 2010 2011 2Q12 $ Millions Average Total Assets Purely organic growth Core deposit driven $1.17b total assets EOP Q2 ’12 10
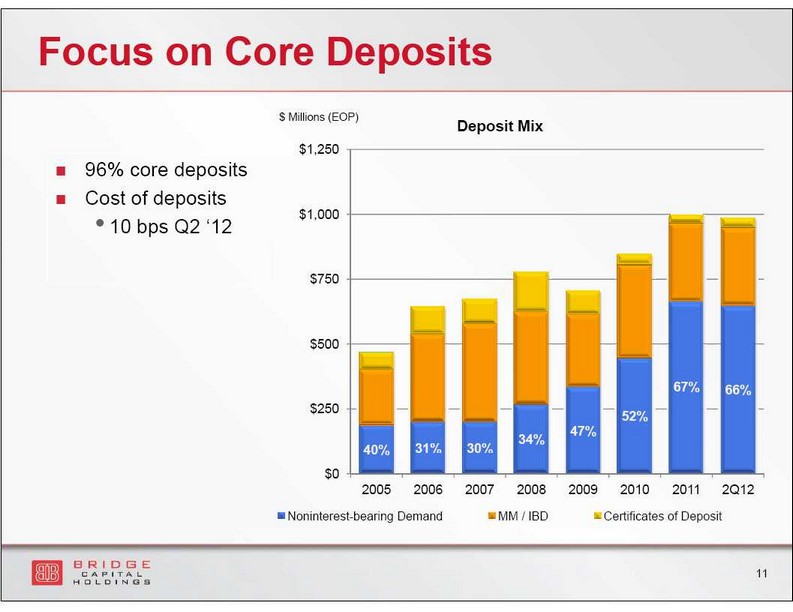
Focus on Core Deposits 40% 31% 30% 34% 47% 52% 67% 66% $0 $250 $500 $750 $1,000 $1,250 2005 2006 2007 2008 2009 2010 2011 2Q12 $ Millions (EOP) Deposit Mix Noninterest-bearing Demand MM / IBD Certificates of Deposit 96% core deposits Cost of deposits • 10 bps Q2 ‘12 11
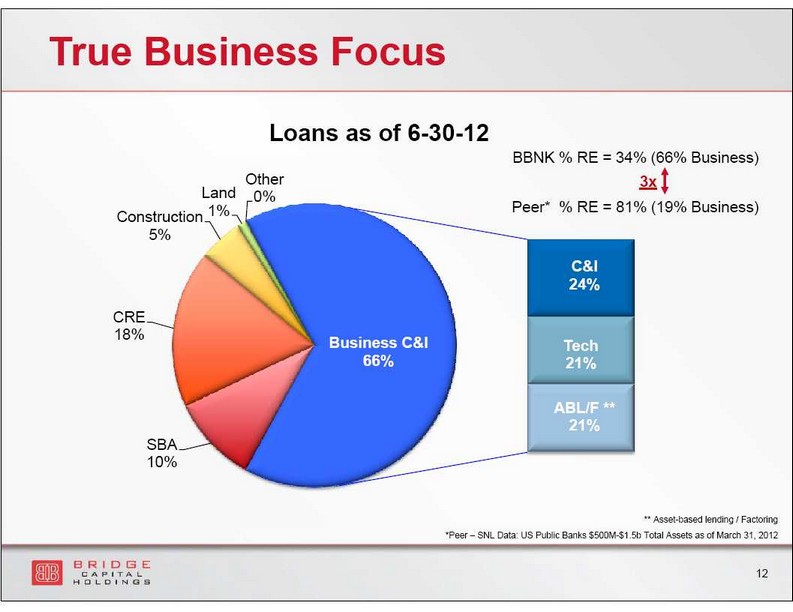
SBA 10% CRE 18% Construction 5% Land 1% Other 0% C&I 24% Tech 21% ABL/F ** 21% Business C&I 66% Loans as of 6 - 30 - 12 True Business Focus BBNK % RE = 34% ( 66% Business) Peer* % RE = 81% (19% Business) * Peer – SNL Data: US Public Banks $500M - $1.5b Total Assets as of March 31, 2012 ** Asset - based lending / Factoring 12 3x
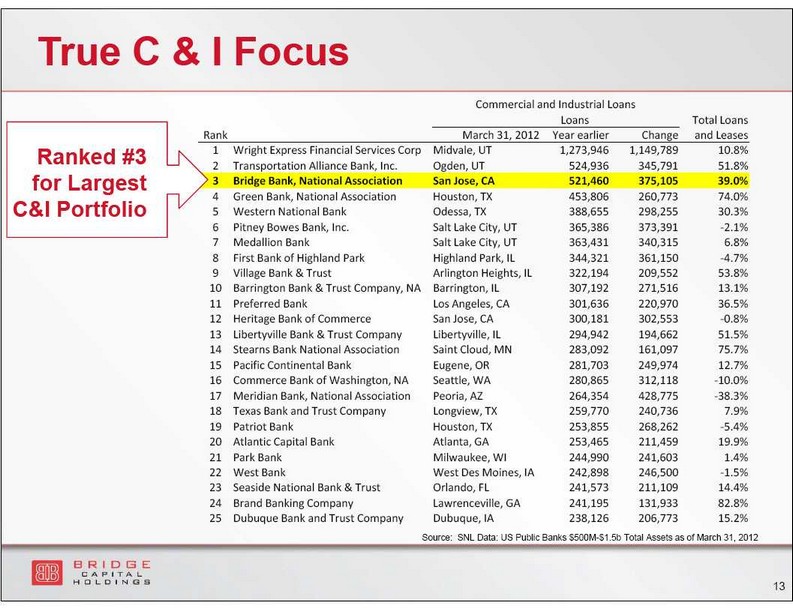
Commercial and Industrial Loans Loans Total Loans and Leases Rank March 31, 2012 Year earlier Change 1 Wright Express Financial Services Corp Midvale, UT 1,273,946 1,149,789 10.8% 2 Transportation Alliance Bank, Inc. Ogden, UT 524,936 345,791 51.8% 3 Bridge Bank, National Association San Jose, CA 521,460 375,105 39.0% 4 Green Bank, National Association Houston, TX 453,806 260,773 74.0% 5 Western National Bank Odessa, TX 388,655 298,255 30.3% 6 Pitney Bowes Bank, Inc. Salt Lake City, UT 365,386 373,391 - 2.1% 7 Medallion Bank Salt Lake City, UT 363,431 340,315 6.8% 8 First Bank of Highland Park Highland Park, IL 344,321 361,150 - 4.7% 9 Village Bank & Trust Arlington Heights, IL 322,194 209,552 53.8% 10 Barrington Bank & Trust Company, NA Barrington, IL 307,192 271,516 13.1% 11 Preferred Bank Los Angeles, CA 301,636 220,970 36.5% 12 Heritage Bank of Commerce San Jose, CA 300,181 302,553 - 0.8% 13 Libertyville Bank & Trust Company Libertyville, IL 294,942 194,662 51.5% 14 Stearns Bank National Association Saint Cloud, MN 283,092 161,097 75.7% 15 Pacific Continental Bank Eugene, OR 281,703 249,974 12.7% 16 Commerce Bank of Washington, NA Seattle, WA 280,865 312,118 - 10.0% 17 Meridian Bank, National Association Peoria, AZ 264,354 428,775 - 38.3% 18 Texas Bank and Trust Company Longview, TX 259,770 240,736 7.9% 19 Patriot Bank Houston, TX 253,855 268,262 - 5.4% 20 Atlantic Capital Bank Atlanta, GA 253,465 211,459 19.9% 21 Park Bank Milwaukee, WI 244,990 241,603 1.4% 22 West Bank West Des Moines, IA 242,898 246,500 - 1.5% 23 Seaside National Bank & Trust Orlando, FL 241,573 211,109 14.4% 24 Brand Banking Company Lawrenceville, GA 241,195 131,933 82.8% 25 Dubuque Bank and Trust Company Dubuque, IA 238,126 206,773 15.2% Ranked #3 for Largest C&I Portfolio Source: SNL Data: US Public Banks $500M - $1.5b Total Assets as of March 31, 2012 13 True C & I Focus
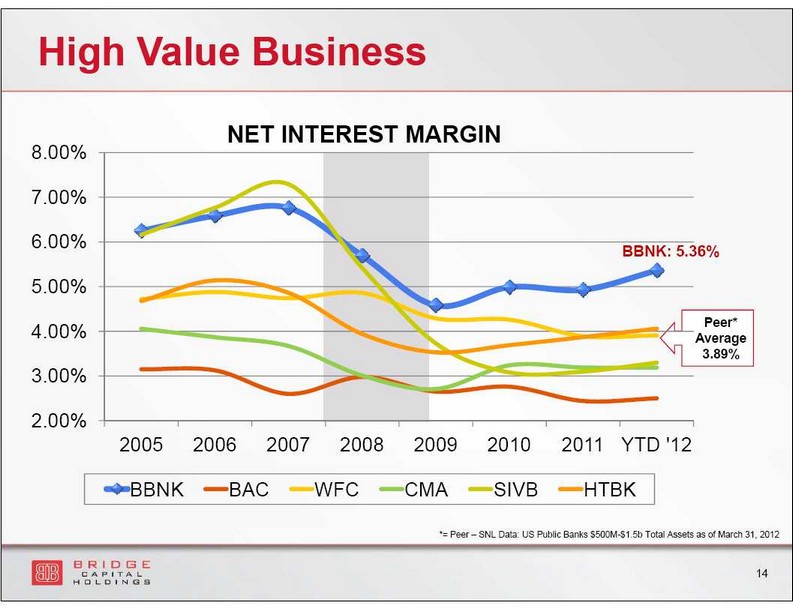
High Value Business Peer* Average 3.89% BBNK: 5.36% 14 *= Peer – SNL Data: US Public Banks $500M - $1.5b Total Assets as of March 31, 2012 2.00% 3.00% 4.00% 5.00% 6.00% 7.00% 8.00% 2005 2006 2007 2008 2009 2010 2011 YTD '12 NET INTEREST MARGIN BBNK BAC WFC CMA SIVB HTBK
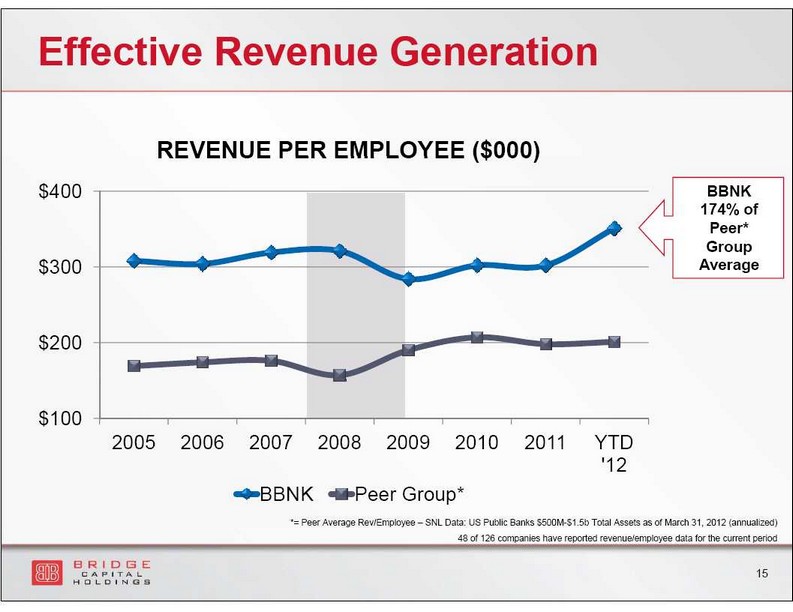
$100 $200 $300 $400 2005 2006 2007 2008 2009 2010 2011 YTD '12 REVENUE PER EMPLOYEE ($000) BBNK Peer Group* Effective Revenue Generation *= Peer Average Rev/Employee – SNL Data: US Public Banks $500M - $1.5b Total Assets as of March 31, 2012 (annualized) 48 of 126 companies have reported revenue/employee data for the current period BBNK 174% of Peer* Group Average 15
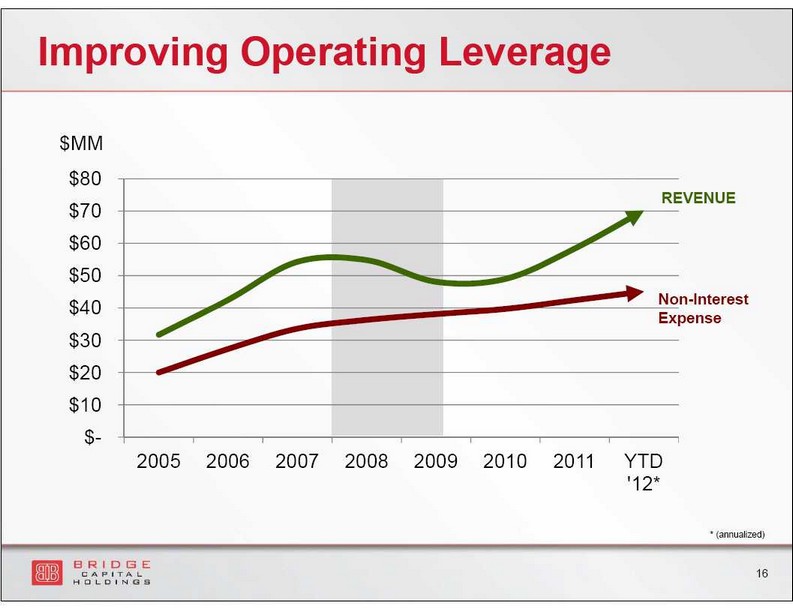
$- $10 $20 $30 $40 $50 $60 $70 $80 2005 2006 2007 2008 2009 2010 2011 YTD '12* $MM Improving Operating Leverage REVENUE Non - Interest Expense 16 * (annualized)
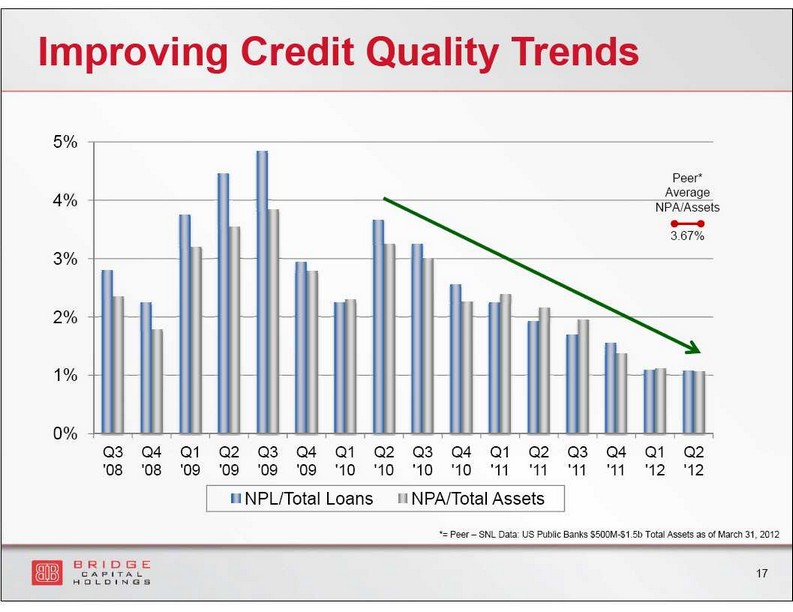
Improving Credit Quality Trends 0% 1% 2% 3% 4% 5% Q3 '08 Q4 '08 Q1 '09 Q2 '09 Q3 '09 Q4 '09 Q1 '10 Q2 '10 Q3 '10 Q4 '10 Q1 '11 Q2 '11 Q3 '11 Q4 '11 Q1 '12 Q2 '12 NPL/Total Loans NPA/Total Assets Peer* Average NPA/Assets 3.67% *= Peer – SNL Data: US Public Banks $500M - $1.5b Total Assets as of March 31, 2012 17
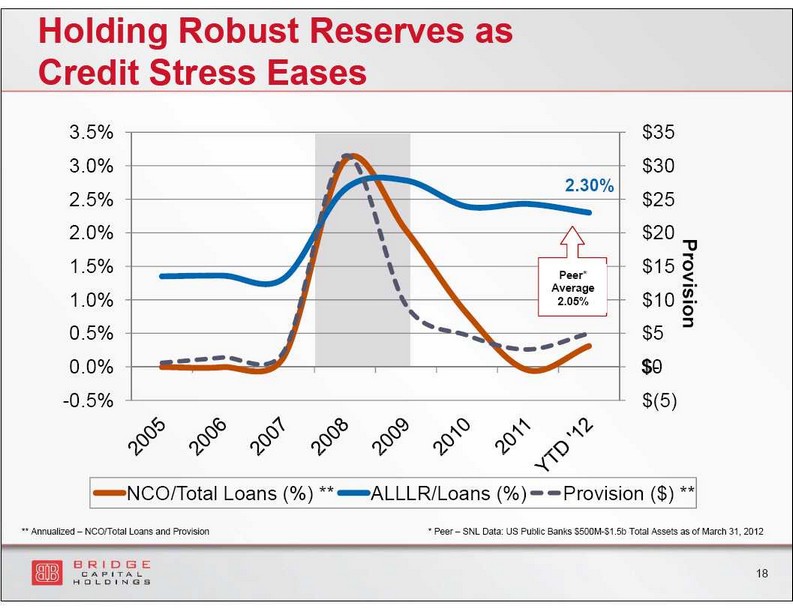
$(5) $- $5 $10 $15 $20 $25 $30 $35 -0.5% 0.0% 0.5% 1.0% 1.5% 2.0% 2.5% 3.0% 3.5% Provision NCO/Total Loans (%) ** ALLLR/Loans (%) Provision ($) ** Holding Robust Reserves as Credit Stress Eases 2.30% * Peer – SNL Data: US Public Banks $500M - $1.5b Total Assets as of March 31, 2012 18 $0 Peer* Average 2.05% ** Annualized – NCO/Total Loans and Provision
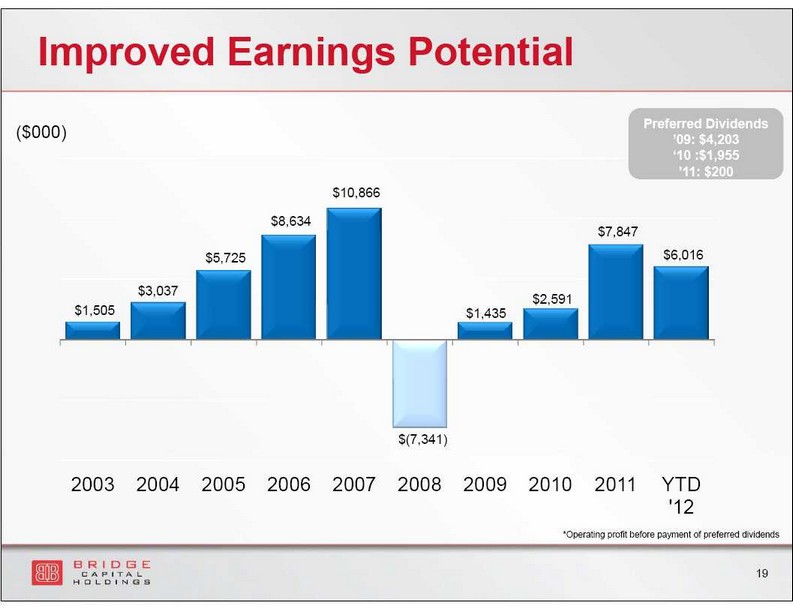
Improved Earnings Potential $(7,341) $1,505 $3,037 $5,725 $8,634 $10,866 $1,435 $2,591 $7,847 $6,016 2003 2004 2005 2006 2007 2008 2009 2010 2011 YTD '12 19 Preferred Dividends ’09: $4,203 ‘10 :$ 1,955 ’11: $200 ($000) *Operating profit before payment of preferred dividends
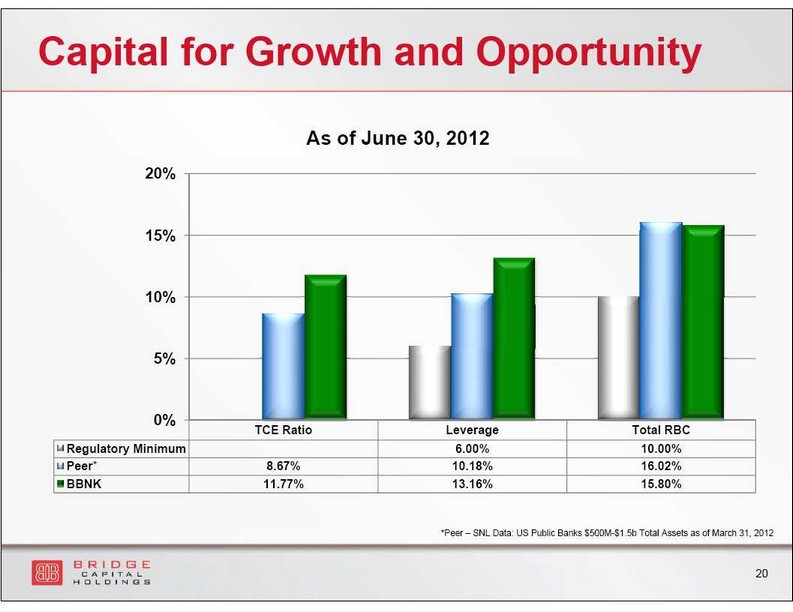
Capital for Growth and Opportunity * Peer – SNL Data: US Public Banks $500M - $1.5b Total Assets as of March 31, 2012 TCE Ratio Leverage Total RBC Regulatory Minimum 6.00% 10.00% Peer* 8.67% 10.18% 16.02% BBNK 11.77% 13.16% 15.80% 0% 5% 10% 15% 20% As of June 30, 2012 20
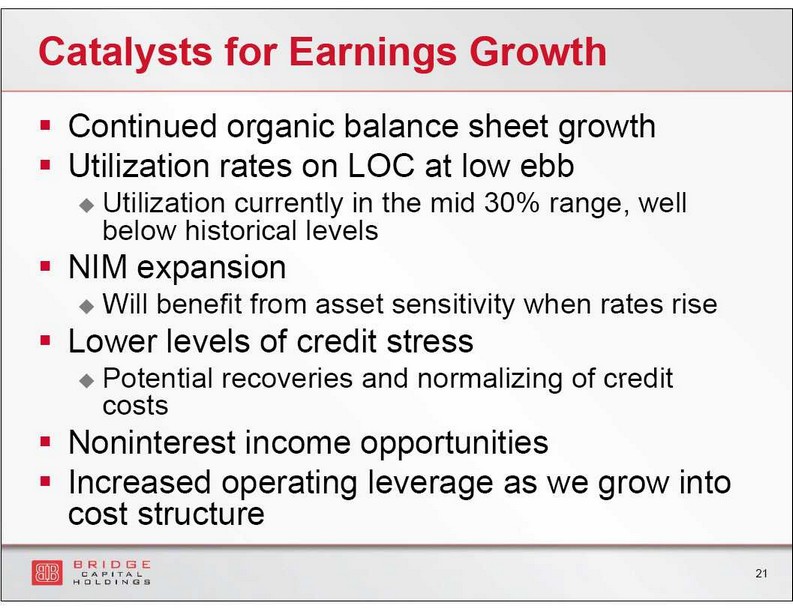
Catalysts for Earnings Growth ▪ Continued organic balance sheet growth ▪ Utilization rates on LOC at low ebb Utilization currently in the mid 30% range, well below historical levels ▪ NIM expansion Will benefit from asset sensitivity when rates rise ▪ Lower levels of credit stress Potential recoveries and normalizing of credit costs ▪ Noninterest income opportunities ▪ Increased operating leverage as we grow into cost structure 21
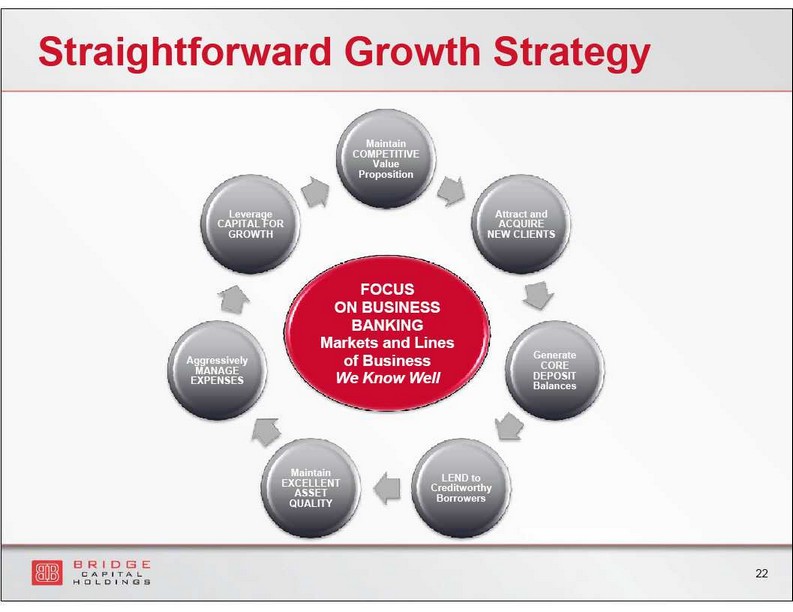
Maintain COMPETITIVE Value Proposition Attract and ACQUIRE NEW CLIENTS Generate CORE DEPOSIT Balances LEND to Creditworthy Borrowers Maintain EXCELLENT ASSET QUALITY Aggressively MANAGE EXPENSES Leverage CAPITAL FOR GROWTH FOCUS ON BU SINESS BANKING Markets and Lines of Business We Know Well Straightforward Growth Strategy 22
Contact Information Investor Relations Contact Thomas A. Sa Bridge Capital Holdings 55 Almaden Blvd., Suite 100 San Jose, CA 95113 (408) 423 - 8500 ir@bridgebank.com 23