Attached files
| file | filename |
|---|---|
| 8-K - FORM 8-K - TRINITY INDUSTRIES INC | d387420d8k.htm |
 Trinity Industries, Inc.
July 2012
Exhibit 99.1 |
 2
Forward Looking Statements
This
presentation
contains
“forward
looking
statements”
as
defined
by
the
Private Securities Litigation Reform Act of 1995 and includes
statements as to expectations, beliefs and future financial
performance, or assumptions underlying or concerning matters
herein. These statements that are not historical facts are
forward looking. Readers are directed to Trinity’s Form
10-K and other SEC filings for a description of certain of the
business issues and risks, a change in any of which could
cause actual results or outcomes to
differ
materially
from
those
expressed
in
the
forward
looking
statements.
Any forward looking statement speaks only as of the date on which
such statement is made. Trinity undertakes no obligation to
update any forward looking statement or statements to reflect
events or circumstances after the date on which such
statement is made. |
 3
Agenda
I.
Overview
II.
Key Investment Considerations
III.
Strategy and Vision
IV.
Financial Highlights
V.
Appendix |
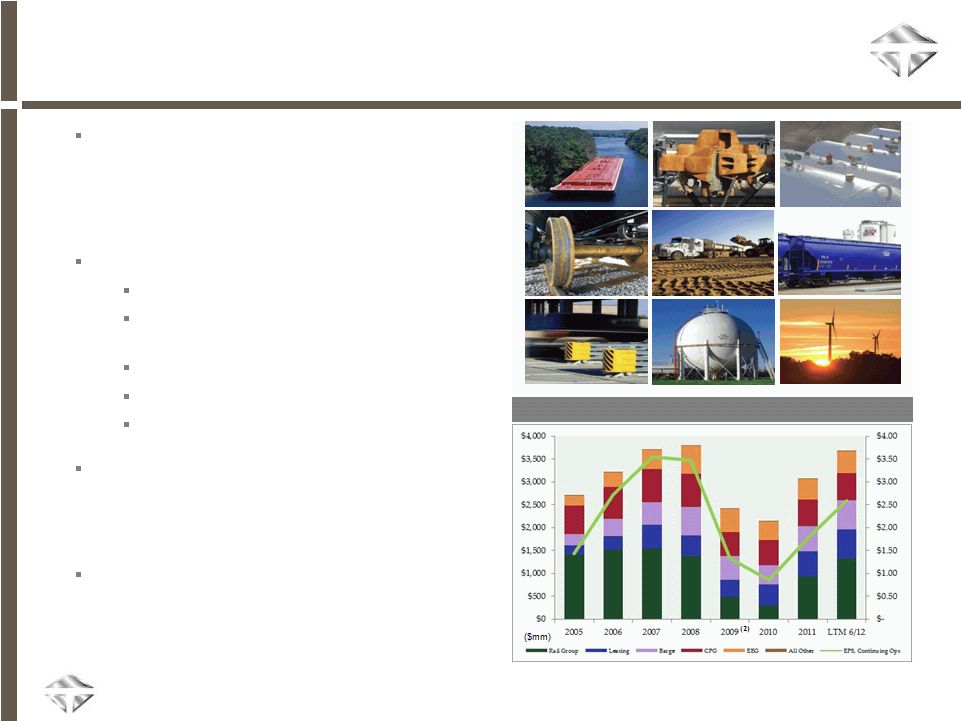 I. Trinity Industries, Inc. Overview
4
Trinity Industries, Inc. is a multi-industry
company that owns a variety of market-leading
businesses that provide products and services to
the industrial, energy, transportation, and
construction sectors
Trinity operates through five business segments:
Rail Group
Railcar Leasing and Management Services
Group (“Leasing”)
Inland Barge Group
Construction Products Group (“CPG”)
Energy Equipment Group (“EEG”)
The Company serves its customers through
manufacturing facilities located in the United
States and Mexico and had approximately 13,400
employees at the end of 2011
Total Revenue and EBITDA for the LTM 6/12 was
$3,686 million and $717 million, respectively
1
Intersegment Revenues are eliminated and Leasing Revenues
include revenues related to TRIP beginning in FY 2010
2
FY 2009 EPS excludes a $325 million pretax Goodwill impairment
External Revenue by Business Group
(1) |
 II. Key Investment Considerations
5
Seasoned
Performers
Enrichment Value
Focused
Flexible and
Cost-Effective
Manufacturing
Diversified
Portfolio
of Businesses
Leading Market
Positions |
 Leading Market Positions
6
Rail Group
Leading
manufacturer of railcars in North America
Leading
manufacturer of railcar axles in North America
Leading
manufacturer of railcar coupling devices in
North America
Railcar Leasing and
Management Services
Group
Leading
provider of railcar leasing and management
services
Inland Barge Group
Leading
manufacturer of inland barges in the United
States
Largest
manufacturer of fiberglass covers for barges in the
United States
Construction Products
Group
Leading
full-line manufacturer of highway guardrail and
crash cushions in the United States
Leading
supplier of concrete and aggregates in certain
regions of
Texas
Energy Equipment Group
Leading
manufacturer of structural wind towers in North
America
Leading
producer of propane tanks, tank containers, and
tank
heads
for
pressure
and
non-
pressure
vessels
in
North
America |
 Diversified Portfolio of Businesses
7
PAST (FY 2000)
PRESENT (FY 2011)
Total Revenues = $2.7 B
Total Revenues = $3.1 B
Revenues
Revenues
Operating
Profit
(1)
Operating
Profit
(1)
Our diversified portfolio of businesses
produced a higher level of EPS on fewer
railcar deliveries during the latest recovery
(1) Operating Profit Excludes All Other, Corporate and is reduced by
Leasing Interest Expense of $7 million in FY 2000 and $161 million in FY2011
(2) Rail percentage represents Operating Profit less all
Intersegment Company Eliminations; Leasing percentage represents Operating Profit less Leasing Interest Expense
(3) FY 2009 EPS excludes a $325 million pretax Goodwill
impairment (1) Operating Profit Excludes All Other, Corporate
and is reduced by Leasing Interest Expense of $7 million in FY 2000 and $161 million in FY2011
(2) Rail percentage represents Operating Profit less all
Intersegment Company Eliminations; Leasing percentage represents Operating Profit less Leasing Interest Expense
(3) FY 2009 EPS excludes a $325 million pretax Goodwill
impairment (2)
(2)
(2)
(2)
60%
5%
21%
6%
8%
55%
14%
19%
4%
8%
Rail
Leasing
CPG
EEG
Barge
16%
30%
17%
3%
34%
Rail
Leasing
CPG
EEG
Barge
30%
18%
19%
15%
18%
MEASUREABLE PROGRESS |
 Flexible and Cost-Effective Manufacturing
8
Trinity's manufacturing
flexibility across product and
business segments enhances
our ability to opportunistically
respond to changes in market
demand
Trinity’s manufacturing scale,
vertical integration, and
presence in the Southern U.S.
and Mexico provides cost
effective benefits across
multiple business segments
Flexibility
Cost-Effective |
 Enrichment Value Focused
9
Rail
Leasing
Construction
Energy
Inland Barge
Customer
Sharing
Internal
Component
Sourcing
Shared Best
Manufacturing
Practices
Facility
Optimization
Centralized
Cost
Savings
Trinity focuses on
collaboration across
business segments…
…generating synergies
that enrich value and
ultimately provide
competitive benefits |
 10
Seasoned Performer Across Economic Cycles
Trinity is uniquely positioned to emerge from a severe down cycle
with more opportunity
for
growth
to
generate
significant
profits
during
an
up
cycle
Seasoned
management
team
knows
how
to
assess
the
market,
proactively
plan for cycles and address changes in economic conditions
Manufacturing
flexibility
is
a
core
competency,
and
when
combined
with
our
broad
product
offering
allows
us
to
pursue
a
wide
range
of
orders
Cost-effective manufacturing footprint in the Southern United
States and Mexico
is a competitive advantage for many of our product lines
Shared
synergies
across
business
lines
provide
unique
opportunities
Trinity’s
lease
fleet
of
approximately
70,700
railcars
(including
TRIP)
provides
a strong strategic connection to our customers, as well as a
consistent long-term stream of profit and cash flow
Strong
liquidity
position
of
approximately
$832
million
and
solid
balance
sheet |
 III. Strategy and Vision: Operational
11
Strategically Grow the Lease Fleet
Maximize Manufacturing Efficiency
Selectively Build our Backlogs
Diversify Through Organic Growth
Acquire Complementary Product
Portfolios
Be a premier, multi-industry growth
company that generates superior
earnings and returns for shareholders |
     Liquidity (at 6/30/12): ~ $832 mm
Strategy and Vision: Financial
12
Working Capital
Working Capital
Capital
Expenditures
Capital
Expenditures
Acquisitions
Acquisitions
Shareholder
Distributions
Shareholder
Distributions
Corporate
Debt
(1)
-
Convertible
Subordinated
Notes
-
$450
mm
Leasing
Debt
(2)
–
Recourse Debt:
Capital
lease
obligations/Term
loan
-
$100
mm
Non-recourse Debt:
TILC
Warehouse
borrowings
-
$291
mm
TILC
Long-term
financings
-
$1,277
mm
TRIP
Long-term
financings
-
$880
mm
(1) Excludes $93.8 mm of unamortized discount
(2) Total leasing financings of $2.5 billion, including TRIP; Leasing
assets have a net book value of $4.3 billion, including TRIP,
which leaves a significant amount of unencumbered assets
available for financing Cash
and
Cash
Equivalents
-
$294
mm
Corporate
Revolver
Availability
-
$354
mm
TILC
Warehouse
Availability
-
$184
mm
Balance Sheet Debt (at 6/30/12): ~ $2,911 mm
Equity (at 6/30/12): ~ $2,028 mm |
 13
IV. Financial Highlights
LTM
as
of
June
30,
2012
(1):
Revenues increased 47% from $2.5 billion to
$3.7 billion
Operating profit increased 64% from $212
million
to
$348
million
(2)
EBITDA increased 33% from $540 million to
$717 million
Earnings per common diluted share increased
106% from $1.26 to $2.60 per diluted share
(1)
Relative to LTM 6/30/11
(2)
Operating Profit includes Leasing Interest Expense
(3)
EPS from Continuing Operations
(4)
Excludes $325mm pre-tax impact of impairment of Goodwill
(5)
Beginning in FY 2010, TRIP Revenues and OP were consolidated with the
Leasing Group (6)
See Note in Appendix pg. 21 for Reconciliation of EBITDA
Trinity’s
Earnings
Summary
FY
2005
–
LTM
6/30/12
(3)
Trinity’s
EBITDA
Summary
FY
2005
–
LTM
6/30/12
(6) |
 Guidance and Outlook (As of July 26,
2012) 14
Any
forward-looking
statements
made
by
the
Company
speak
only
as
of
the
date
on
which
they
are
made.
The
Company is under no obligation to, and expressly disclaims any
obligation to, update or alter its forward-looking
statements, whether as a result of new information, subsequent events
or otherwise. Rail Group
Revenues ~ $1 –
1.1B in 2H-2012
OP Margin ~ 9-11% in 2H-2012
Shipments ~ 8,745 –
9,745 in 2H-2012
Leasing Group
Revenue Eliminations ~ $290-310mm in 2H-2012
EPS Elimination Impact ~ $0.20-0.26 in 2H-2012
Net Lease Fleet Additions ~ $140-170mm in 2H-2012
Railcar Sales from Lease Fleet EPS Impact ~ $0.17-0.22 in
2H-2012 Barge Group
Revenues ~ $320-340mm in 2H-2012
OP Margin ~ 16-18% in 2H-2012
Total Company
EPS ~ $2.95-3.10 in FY 2012
Manufacturing Capital Expenditures ~ $130-150mm in FY 2012
EPS Impact of Manufacturing Repositioning ~ ($0.08-0.10) in
2H-2012 |
 Appendix:
Operating Business Summaries |
 16
Trinity delivered approximately 18,965 railcars
representing 30% of industry shipments during LTM
6/30/12
Trinity received orders for approximately 22,335
railcars representing 34% of the industry total during
LTM 6/30/12
Trinity’s order backlog was approximately 30,610
railcars representing 52% of industry backlog as of
6/30/12
Rail Group
Leading manufacturer of railcars, railcar axles, and
coupling devices in North America
Broadest product offering for railcar manufacturing in
North America
Networking of customers between railcar sales and
railcar leasing
Focus on new and advanced engineering designs
Centralized sourcing provides cost savings
Streamlined manufacturing efficiencies
Rail Group Highlights
(1)
Before eliminations for Intersegment Sales to Leasing and
Intercompany Profit (2)
Excludes $325mm pretax charge for impairment of Goodwill
(1) Sources: Historical data as reported per the Railway Supply
Institute. 2012-2016 projections are an average of
estimates provided by Global Insight (05/12) and Economic Planning Associates, Inc. (04/12)
and are provided as a point of reference.
Rail
30%
Total FY11 Revenue $3.1B
0
10,000
20,000
30,000
40,000
50,000
60,000
70,000
80,000
90,000
100,000
Rail Group Historical Revenues and OP Margin
Railcar Deliveries (1958 - 2016P)
(1)
Projections based on Third Party estimates(1) |
 17
Railcar Leasing & Management Services Group
Leading provider of comprehensive railcar leasing
and management services
Marketed with railcar sales activities as
TrinityRail® Single point of contact for
equipment and services Strengthens relationship with
end-user of railcar Scale of operations facilitates active
participation in secondary market activities for portfolio
railcar sales as market conditions warrant
Strategic Position
Operating Benefits
Financial Results
Complements product offering (one-stop shopping)
Provides Trinity’s rail customers option to purchase or
lease
Facilitates ideal method for introduction of new
products
Assists in balancing and extending production lines
Minimizes administrative costs
Provides an important dashboard of metrics for
assessing railcar demand
Provides attractive cash return on investment
Minimizes the cyclicality of the company
Diversifies Trinity’s revenue and cash flow
($mm)
(1) Operations Margin calculated using only revenues and
profitfrom Leasing Operations and excludes Car Sales;
PBT Margin calculated using Operating Profit from Leasing Operations less Leasing Interest Expense
(2) Beginning in FY 2010, TRIP Revenues and OP were
consolidated with the Leasing Group
(1) Operations Margin calculated using only revenues and
profitfrom Leasing Operations and excludes Car Sales;
PBT Margin calculated using Operating Profit from Leasing Operations less Leasing Interest Expense
(2) Beginning in FY 2010, TRIP Revenues and OP were
consolidated with the Leasing Group
Trinity’s Lease fleet has grown
at a 19% CAGR since 2000
Trinity’s Lease fleet has grown
at a 19% CAGR since 2000
(2)
Leasing
18%
Total FY11 Revenue $3.1B
Trinity Leasing’s capabilities provide the following
advantages: Leasing
Historical
Revenues
and
Profit
from
Operations
(1) |
 18
Revenues up 32.2% in LTM 6/30/12 vs. LTM 6/30/11
Profitability continues to be strong compared to historical
averages
for
this
business
-
Operating
Profit
margins
increased
from
6.5%
in
FY
2005
to
17.1%
during
LTM
6/30/12
(3)
Backlog remained strong at $542mm at 6/30/12
Quickly recovered from 2 significant floods in Tennessee (in
2010) and Missouri (in 2011) that halted production levels for
a period of time and impacted financial results in certain
periods
Inland Barge Group
Inland Barge Group Highlights
Inland Barge Group Historical Revenues and OP Margin
Tank Barges
Hopper Barges
Transports grain & coal
Transports liquids
($mm)
Leading manufacturer of barges that transport goods
along U.S. inland waterways
Largest U.S. manufacturer of fiberglass barge covers
Multiple barge manufacturing facilities on inland
waterways enable rapid delivery
Barge transportation has a cost advantage in high-cost
fuel environments
4,250 out of 17,996 hopper barges, or approximately 24%,
are 20+ years old
1,152 out of 3,084 tank barges, or approximately 37%, are
20+ years old
Over the past 10 years, 22% more barges were scrapped
vs.
built
(9,306
scrapped
vs.
7,630
built
from
2001
–
2011)
(1)
(1) OP Margin excludes a $5.1mm net gain as a result of flood damage
to the Tennessee barge plant (2) OP Margin excludes a $15.5 mm
net gain as a result of flood damage to the Tennessee and Missouri barge plants
(3) OP Margin excludes a $23.3 mm net gain as a result of flood
damage to the Tennessee and Missouri barge plants, and the
sale of leased barges (1) OP Margin excludes a $5.1mm net gain
as a result of flood damage to the Tennessee barge plant (2) OP
Margin excludes a $15.5 mm net gain as a result of flood damage to the Tennessee and Missouri barge plants
(3) OP Margin excludes a $23.3 mm net gain as a result of flood
damage to the Tennessee and Missouri barge plants, and the
sale of leased barges (2)
(3)
Barge
18%
Total FY11 Revenue $3.1B
Replacement demand driver (as of 12/31/11): |
 19
Revenues increased 8.1% LTM 06/30/12 vs. LTM 6/30/11
Operating Profit increased 7.0% LTM 6/30/12 vs. LTM
6/30/11
Acquired Quixote Corporation in February 2010 which
increased Highway Products Revenue by 31% during the
year it was acquired
Continued portfolio restructuring in 2011 through the
completion of several acquisitions, including the addition
of a custom galvanizing business and increased exposure
to Aggregates
Construction Products Group
Leading U.S. manufacturer of highway guardrail and
crash cushions; plus a line of proprietary products
including guardrail end treatments and cable barrier
guardrail systems
Leading Texas producer of concrete and aggregates
Diversified exposure to commercial, residential,
industrial, and highway markets
Business has grown organically and through
acquisitions
Consistent contributor to Company cash flow
Demand tied to construction projects and federal
funding
Construction Products Group Highlights
($mm)
(1) OP Margin excludes a $3.8mm net gain as a result of the
divestiture of the Asphalt business from within the Concrete
and Aggregates business (1) OP Margin excludes a $3.8mm net
gain as a result of the divestiture of the Asphalt business from within the
Concrete and Aggregates business
(1)
CPG
19%
Total FY11 Revenue $3.1B
Construction
Products
Group
Historical
Revenues
and
OP
Margin |
 20
Structural Wind Towers:
Revenues of $228 million in LTM 6/30/12
Trinity’s
backlog
as
of
6/30/12
was
$817
million
(1)
Plants are strategically located along the central corridor where
the majority of wind farms are installed
Tank Containers:
Consistent and mature business
Recently launched the frac tank product to support oil & gas
exploration industry
Trinity has taken cost out of the business
–
Improved processes
–
Elimination of non-profitable products
–
Consolidated North American operations
Energy Equipment Group
Leading North American manufacturer of
structural wind tower business
Leading producer of propane tanks, tank
containers, and tank heads for pressure and non-
pressure vessels in North America
Low-cost manufacturer with primary tank
container production in Mexico facilities
Synergies among products across multiple Trinity
business groups
Energy Equipment Group Highlights
($mm)
(1) Approximately $413 million of this backlog is involved in
litigation filed by the Company against one of our structural
wind tower customers for breach of a long-term supply contract for the manufacture of towers
EEG
15%
Total FY11 Revenue $3.1B
Energy Equipment Group Historical Revenues & OP Margin |
 2005
2006
2007
2008
2009
2010
2011(1)
LTM 6/12
Income (loss) from continuing operations
$110.5
$212.6
$289.8
$282.4
($137.7)
$75.4
$145.7
$208.3
Add:
Interest expense
42.2
68.7
84.5
109.4
123.2
182.1
185.3
192.8
Provision/(Benefit) for income taxes
65.6
131.3
165.1
171.4
(9.4)
40.9
91.8
120.0
Depreciation & amortization
expense 76.2
87.6
118.9
140.3
160.8
189.6
192.9
196.2
Goodwill impairment
-
-
-
-
325.0
-
-
-
Earnings from continuing
before interest expense, income
taxes, and depreciation and
amortization expense
$294.5
$500.2
$658.3
$703.5
$461.9
$488.0
$615.7
$717.3
Reconciliation of EBITDA
“EBITDA”
is defined as income (loss) from continuing operations plus interest
expense, income taxes, and depreciation and amortization
including goodwill impairment charges. EBITDA is not a calculation
based on generally accepted accounting principles. The amounts included
in the EBITDA calculation, however, are derived from amounts included
in the historical statements of operations data. In addition, EBITDA
should
not
be
considered
as
an
alternative
to
net
income
or
operating
income
as
an
indicator
of
our
operating
performance,
or
as
an
alternative
to operating cash flows as a measure of liquidity. We believe EBITDA
assists investors in comparing a company’s performance on a consistent
basis
without
regard
to
depreciation
and
amortization,
which
can
vary
significantly
depending
upon
many
factors.
However,
the
EBITDA
measure presented in this presentation may not always be comparable
to similarly titled measures by other companies due to differences in the
components of the calculation.
(1) Includes results of operations related to TRIP starting January
1, 2010 “EBITDA”
is defined as income (loss) from continuing operations plus interest
expense, income taxes, and depreciation and amortization
including goodwill impairment charges. EBITDA is not a calculation
based on generally accepted accounting principles. The amounts included
in the EBITDA calculation, however, are derived from amounts included
in the historical statements of operations data. In addition, EBITDA
should
not
be
considered
as
an
alternative
to
net
income
or
operating
income
as
an
indicator
of
our
operating
performance,
or
as
an
alternative
to operating cash flows as a measure of liquidity. We believe EBITDA
assists investors in comparing a company’s performance on a consistent
basis
without
regard
to
depreciation
and
amortization,
which
can
vary
significantly
depending
upon
many
factors.
However,
the
EBITDA
measure presented in this presentation may not always be comparable
to similarly titled measures by other companies due to differences in the
components of the calculation.
(1) Includes results of operations related to TRIP starting January
1, 2010 21
(1)
(1)
(1)
(1)
(1) |