Attached files
| file | filename |
|---|---|
| 8-K - PPBI 8K 2012 Q2 INVESTOR PRESENTATION - PACIFIC PREMIER BANCORP INC | ppbi_8k-invpres2012q2.htm |

Investor Presentation
Second Quarter 2012
Second Quarter 2012
Steve Gardner
President & CEO

Forward-Looking Statements and
Where to Find Additional Information
Where to Find Additional Information
This presentation contains forward-looking statements regarding events or future financial
performance of the Company, including statements with respect to our objectives and strategies,
and the results of our operations and our business. These statements are based on management's
current expectations and beliefs concerning future developments and their potential effects on the
Company. There can be no assurance that future developments affecting the Company will be the
same as those anticipated by management. Actual results may differ from those projected in the
forward-looking statements. We caution readers of this presentation not to place undue reliance on
these forward-looking statements as a number of risks could cause future results to differ
materially from these statements. These risks include, but are not limited to, the following:
changes in the performance of the financial markets; changes in the demand for and market
acceptance of the Company's products and services; changes in general economic conditions
including interest rates, presence of competitors with greater financial resources, and the impact of
competitive projects and pricing; the effect of the Company's policies; the continued availability of
adequate funding sources; and various legal, regulatory and litigation risks; as well as those
additional risks identified in risks factors discussed in the reports filed by the Company with the
SEC, which are available on its website at www.sec.gov. The Company does not undertake any
obligation to update any forward-looking statements for any reason, even if new information
becomes available or other events occur in the future.
For a more complete discussion of risks and uncertainties, investors and security holders are urged
to read the Company’s annual report on Form 10-K, quarterly reports on Form 10-Q and other
reports filed by Pacific Premier Bancorp with the SEC. The documents filed by Pacific Premier
Bancorp with the SEC may be obtained at Pacific Premier Bancorp’s website at www.ppbi.com or
at the SEC’s website at www.sec.gov. These documents may also be obtained free of charge from
Pacific Premier Bancorp by directing a request to: Pacific Premier Bancorp, 1600 Sunflower,
Costa Mesa, CA 92626. Attention: Investor Relations. Telephone 714-431-4000.
2

Corporate Profile
|
NASDAQ:
|
PPBI
|
|
Web:
|
www.ppbi.com
|
|
Focus:
|
Small & Middle
Market Businesses |
|
Total Assets:
|
$1.065 Billion
|
|
Branches:
|
10 Locations
|
|
TCE:
|
8.78%
|
|
FD Book Value:
|
$9.18
|
|
ROAA YTD:
|
1.71%
|
|
ROAE YTD:
|
18.88%
|
June 30, 2012
3

Executing on Strategic Plan
• Relationship banking model
• Growing core deposit base- enhance shareholder value
• Robust earnings stream, building book value
• Solid balance sheet, excellent asset quality
• Increasing market share
• Strong execution on acquisitions
• Disciplined, prudent analysis and pricing of targets
• Active risk management policies and procedures
• Operational efficiency
4

Financial Summary
|
|
QTD
6/30/11
|
QTD
9/30/11
|
QTD
12/31/11
|
QTD
3/31/12
|
QTD
6/30/12
|
|
Balance Sheet
|
(dollars in thousands)
|
||||
|
Total assets
|
$948,111
|
$928,502
|
$961,128
|
$985,171
|
$1,065,035
|
|
Net loans
|
699,579
|
725,952
|
730,067
|
687,141
|
790,062
|
|
Total deposits
|
815,985
|
797,378
|
828,877
|
846,717
|
913,191
|
|
Total equity
|
81,817
|
84,620
|
86,777
|
89,476
|
96,069
|
|
|
|
|
|
|
|
|
Statements of Operations
|
|
|
|
|
|
|
Net interest income
|
$10,336
|
$10,231
|
$10,960
|
$10,041
|
$11,282
|
|
Noninterest income (loss)
|
(1,093)
|
2,110
|
257
|
939
|
6,529
|
|
Noninterest expense
|
6,855
|
7,074
|
6,616
|
6,641
|
8,205
|
|
Net income
|
785
|
2,460
|
2,555
|
2,692
|
5,811
|
|
Diluted EPS
|
$0.08
|
$0.23
|
$0.24
|
$0.25
|
$0.55
|
|
|
|
|
|
|
|
|
Bank Capital Ratios
|
|
|
|
|
|
|
Tier 1 leverage
|
8.80
|
9.29
|
9.44
|
9.49
|
9.48
|
|
Tier 1 risk based
|
11.68
|
11.57
|
11.68
|
12.54
|
11.28
|
|
Total risk based
|
12.88
|
12.71
|
12.81
|
13.65
|
12.18
|
5

6

* California peer group consists of all insured California institutions in the FFIEC database
7

Overview of PPBI
• Strategic Plan - Pre 2008 Stage
• Diversify the balance sheet, reduce wholesale funding dependence
• Establish and maintain strong, conservative credit culture
• Strategic Plan - Current Stage
• Fully leverage offensive capital raise- $15M in Q3 2009
• Growth through disciplined acquisitions
• Canyon National Bank - $209 million in assets
• Palm Desert National Bank - $104 million in assets
• Maintain positive trends in profitability, NIM, efficiency ratio, & credit quality
• Strategic Plan - Next Stage
• Increase fee income - SBA lending and mortgage banking initiatives
• Increase non-interest bearing accounts to 25%+ of deposit base
• Manage capital to continue growth, both organic and through acquisitions
• Build out commercial banking franchise
8

PPBI: Today vs. 2008
|
|
12/31/08
|
6/30/12
|
Variance
|
|
Balance Sheet, Capital & Credit
|
(dollars in thousands)
|
||
|
Total assets
|
$739,956
|
$1,065,035
|
39.5%
|
|
Total loans
|
623,138
|
790,062
|
26.8%
|
|
Total deposits
|
457,128
|
913,191
|
99.8%
|
|
Leverage ratio
|
8.99%
|
9.60%
|
9.0%
|
|
Total risk-based capital ratio
|
12.07%
|
12.26%
|
1.6%
|
|
FHLB borrowings
|
$181,400
|
$0
|
(100.0%)
|
|
Loan Mix
|
|
|
|
|
Owner occupied CRE loans/Total loans
|
17.9%
|
18.8%
|
5.4%
|
|
Commercial & industrial loans/Total loans
|
6.9%
|
10.5%
|
53.4%
|
|
Warehouse loans/Total loans
|
0.0%
|
7.7%
|
n/a
|
|
Non-owner occupied CRE loans/Total loans
|
26.0%
|
30.4%
|
16.9%
|
|
Multi-family loans/Total loans
|
45.7%
|
23.0%
|
(49.7%)
|
|
Deposit Mix
|
|
|
|
|
Non-interest bearing deposits/Total deposits
|
6.4%
|
16.5%
|
153.8%
|
|
Non-CDs/Total deposits
|
19.3%
|
52.4%
|
171.1%
|
|
Yield, Cost and Returns
|
|
|
|
|
Cost of deposits
|
3.51%
|
0.66%
|
(82.1%)
|
|
Net interest margin
|
2.99%
|
4.48%
|
50.0%
|
|
Return on average assets
|
0.09%
|
1.71%
|
1,796.1%
|
|
Return on average equity
|
1.20%
|
18.88%
|
1,473.3%
|
|
Number of branch locations
|
6
|
10
|
66.7%
|
9

Deposit Base: Today vs. 2008
|
|
12/31/08
|
6/30/12
|
Variance
|
|
|
(dollars in thousands)
|
||
|
Transaction Accounts:
|
|
|
|
|
Noninterest bearing
|
$29,443
|
$150,538
|
411.3%
|
|
Interest bearing checking
|
20,989
|
92,270
|
339.6%
|
|
Money market
|
23,463
|
145,727
|
521.1%
|
|
Savings
|
14,401
|
89,559
|
521.9%
|
|
Total transaction accounts
|
88,296
|
478,094
|
441.5%
|
|
CD Accounts
|
|
|
|
|
Time deposits
|
341,741
|
435,097
|
27.3%
|
|
Broker/wholesale CDs
|
27,091
|
0
|
(100.0%)
|
|
Total CDs
|
368,832
|
435,097
|
18.0%
|
|
Total deposits
|
$457,128
|
$913,191
|
99.8%
|
10

Deposit Mix
Total deposits: $913.2 million
Cost of deposits: 0.63%
11

Deposit Mix - Increasing Shareholder Value
$457,128
$618,734
$659,240
$828,877
$913,191
12

Loan Portfolio: Today vs. 2008
|
|
12/31/08
|
06/30/12
|
Variance
|
|
|
(dollars in thousands)
|
||
|
Business Loans:
|
|
|
|
|
Commercial owner occupied
|
$112,406
|
$150,428
|
33.8%
|
|
Commercial and industrial
|
43,235
|
84,191
|
94.7%
|
|
Warehouse
|
0
|
61,111
|
N/M
|
|
SBA
|
4,942
|
3,995
|
(19.2%)
|
|
Total business loans
|
160,583
|
299,725
|
86.6%
|
|
CRE Loans:
|
|
|
|
|
Multi-family
|
287,592
|
183,742
|
(36.1%)
|
|
Commercial non-owner occupied
|
163,428
|
242,700
|
48.5%
|
|
Total CRE loans
|
451,020
|
426,442
|
(5.4%)
|
|
|
|
|
|
|
One-to-four family
|
9,925
|
56,694
|
471.2%
|
|
Other loans
|
7,239
|
15,491
|
114.0%
|
|
Gross loans
|
$628,767
|
$798,352
|
27.0%
|
13

Loan Portfolio
Total loans: $798.4 million
WAVG: 5.88%
14

Conservative Credit Structure
• Overall Underwriting Approach:
• Global cash flow lender
• Loans:
• Business - full banking relationship
• CRE - no high risk product types or loan structures
• Personal guarantees, cross collateralized, cross guarantees
• Proactive Portfolio Management
15

Loan Segment Characteristics
June 30, 2012
|
|
LTV
|
DCR
|
|||
|
Business loans:
|
|
|
|
|
|
|
Commercial owner occupied
|
$622,000
|
6.31%
|
62
|
62%
|
----
|
|
Commercial & industrial
|
$233,000
|
5.47%
|
38
|
----
|
----
|
|
Warehouse
|
$7,639,000
|
5.34%
|
17
|
----
|
----
|
|
Real estate loans:
|
|
|
|
|
|
|
Multi-family
|
$988,000
|
5.95%
|
64
|
68%
|
1.21
|
|
Commercial non-owner occupied
|
$1,178,000
|
5.99%
|
51
|
58%
|
1.61
|
|
One-to-four family
|
$166,000
|
5.11%
|
46
|
53%
|
----
|
16

Solid Loan Performance
California peer group consists of all insured California institutions in the FFIEC database
Delinquency to Total Loans
PDNB
Acquisition
4/27/12
17

Proactive Asset Management
California peer group consists of all insured California institutions in the FFIEC database
Nonperforming Assets to Total Assets
18

Potential M&A Targets
So. Cal. Institutions
Source: SNL Financial
|
Total assets …………………………………..
|
$ 16.8
|
|
Total deposits ………………….....................
|
13.5
|
|
Total core deposits ……………....................
|
11.9
|
|
Total loans …………………….....................
|
11.4
|
|
Total branches ………………........................
|
221
|
(dollars in billions)
|
Potential Targets - $100 to $500 million
100 miles of Costa Mesa, California
As of March 31, 2012
|
|
|
|
# of Institutions
|
|
$100 to $250 million
|
47
|
|
$250 to $500 million
|
25
|
19
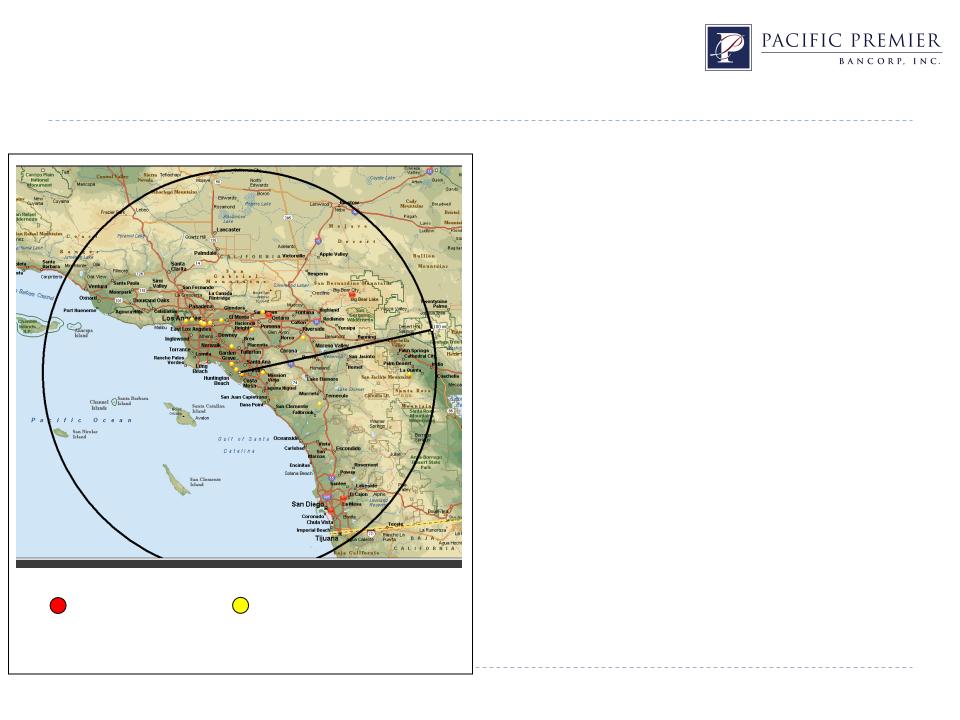
Potential FDIC Targets
Texas ratio defined as NPAs + 90 days PD / tangible common equity plus
loan loss reserves; Circle radius represents 100 miles
loan loss reserves; Circle radius represents 100 miles
So. Cal. Stressed Institutions
|
FDIC Targets - $1.0 billion and less
100 miles of Costa Mesa, California
As of March 31, 2012
|
||
|
|
Texas Ratio
|
# of Institutions
|
|
Near term
|
100% +
|
4
|
|
Longer term
|
50% to 100%
|
19
|
Texas Ratio > 100%
Texas Ratio b/t 50-100%
Source: SNL Financial
|
Total assets …………………………………..
|
$ 5.3
|
|
Total deposits ………………….....................
|
4.4
|
|
Total core deposits ……………....................
|
3.9
|
|
Total loans …………………….....................
|
3.8
|
|
Total branches ………………........................
|
74
|
(dollars in billions)
20

Outlook
• Gaining market share from competitors
• Building franchise value
• So. CA one of the best banking markets
• Target rich environment for acquisitions
• Proven management team and track record
21
Steve Gardner
sgardner@ppbi.com
714-431-4000
www.ppbi.com
22