Attached files
| file | filename |
|---|---|
| 8-K - CURRENT REPORT - First California Financial Group, Inc. | fcal8k73012.htm |
Exhibit 99.1
Investor Presentation July - August 2012
This presentation contains certain forward - looking information about First California Financial Group, Inc. (“First California” or “FCAL” that is intended to be covered by the safe harbor for "forward - looking statements" provided by the Private Securities Litigation Reform Act of 1995. All statements other than statements of historical fact are forward - looking statements. Such statements involve inherent risks and uncertainties, many of which are difficult to predict and are generally beyond the cont rol of First California. First California cautions that a number of important factors could cause actual results to differ materiall y f rom those expressed in, or implied or projected by, such forward - looking statements. Risks and uncertainties include, but are not limited to, revenues are lower than expected, credit quality deterioration which could cause an increase in the provision for credit losses, First California’s ability to complete future acquisitions, successfully integrate such acquired entities, or ach ieve expected beneficial synergies and/or operating efficiencies within expected time - frames or at all, changes in consumer spending, borrowing and savings habits, technological changes, the cost of additional capital is more than expected, a change in the in ter est rate environment reduces interest margins, asset/liability repricing risks and liquidity risks, general economic conditions, particularly those affecting real estate values, either nationally or in the market areas in which First California does or a nti cipates doing business are less favorable than expected, a slowdown in construction activity, volatility in the credit or equity markets and its effect on the general economy, legislative or regulatory requirements or changes adversely affecting First California’s business, the effects of and changes in monetary and fiscal policies and laws including the interest rate policies of the Board of Governors of the Federal Reserve , demand for the products or services of First California as well as their ability to attract and retain qualified people, competition with other banks and financial institutions, the costs and effects of legal, accounting and regulatory developments, the inability to obtain regulatory approvals for acquisitions on the terms expected or on the anticipated schedule , First California’s level of small business lending, and other factors. If any of these risks or uncertainties materialize or if any of the assumptions underlying such forward - looking statements prove to be incorrect, First California's results could differ materially from those expressed in, or implied or projected by, such forward - looking statements. First California assumes no obligation to update such forward - looking statements. For a more complete discussion of risks and uncertainties, investors and security holders are urged to read the section titled "Risk Factors" in First California's Annua l R eport on Form 10 - K, Quarterly Reports on Form 10 - Q and any other reports filed by it with the Securities and Exchange Commission ("SEC"). 2 Safe Harbor
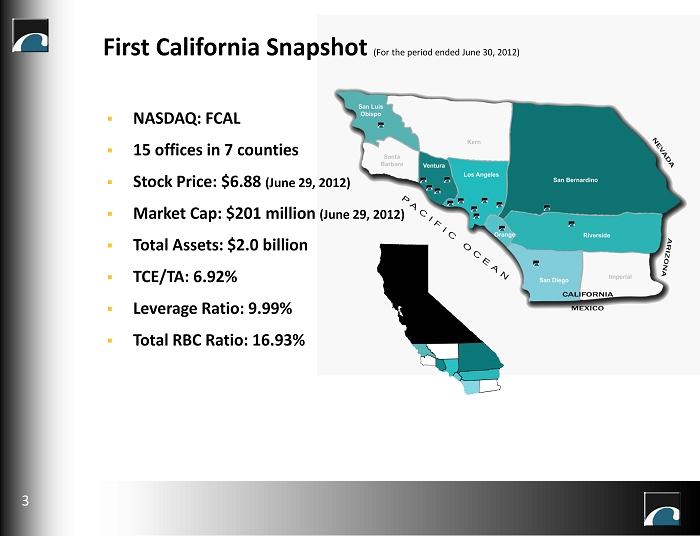
First California Snapshot (For the period ended June 30, 2012) ▪ NASDAQ: FCAL ▪ 15 offices in 7 counties ▪ Stock Price: $6.88 (June 29, 2012) ▪ Market Cap: $201 million (June 29, 2012) ▪ Total Assets: $2.0 billion ▪ TCE/TA: 6.92% ▪ Leverage Ratio: 9.99% ▪ Total RBC Ratio: 16.93% 3
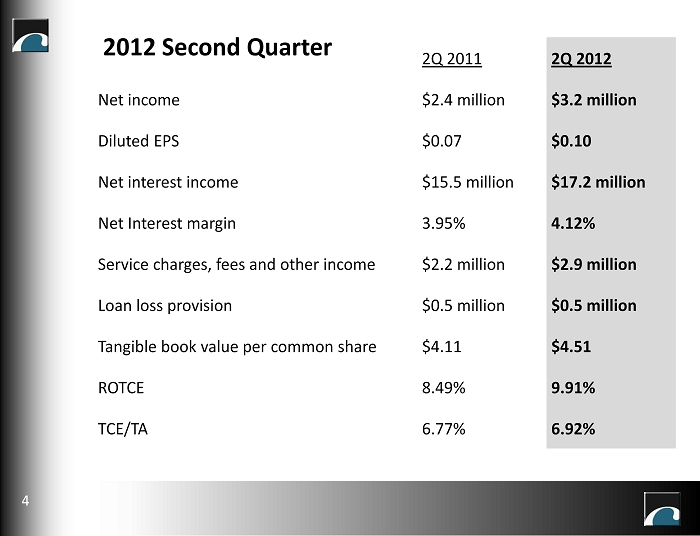
2Q 2011 2Q 2012 Net income $2.4 million $3.2 million Diluted EPS $0.07 $0.10 Net interest income $15.5 million $17.2 million Net Interest margin 3.95% 4.12% Service charges, fees and other income $2.2 million $2.9 million Loan loss provision $0.5 million $0.5 million Tangible book value per common share $4.11 $4.51 ROTCE 8.49% 9.91% TCE/TA 6.77% 6.92% 2012 Second Quarter 4
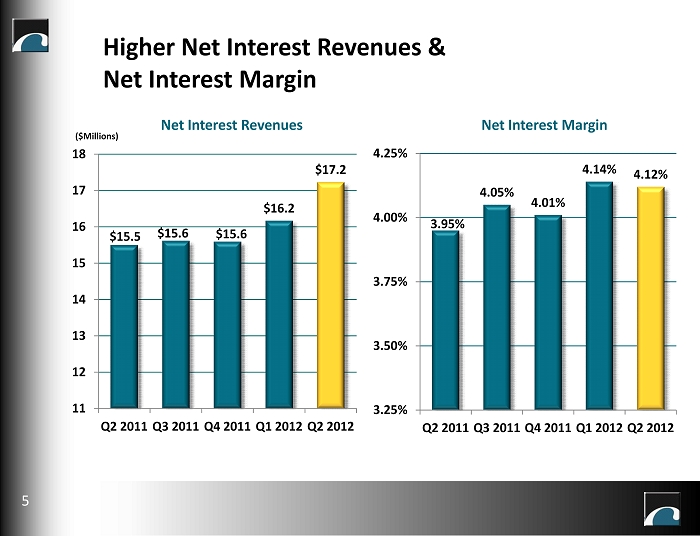
Higher Net Interest Revenues & Net Interest Margin 5 $15.5 $15.6 $15.6 $16.2 $17.2 11 12 13 14 15 16 17 18 Q2 2011 Q3 2011 Q4 2011 Q1 2012 Q2 2012 3.95% 4.05% 4.01% 4.14% 4.12% 3.25% 3.50% 3.75% 4.00% 4.25% Q2 2011 Q3 2011 Q4 2011 Q1 2012 Q2 2012 Net Interest Revenues Net Interest Margin ($Millions)
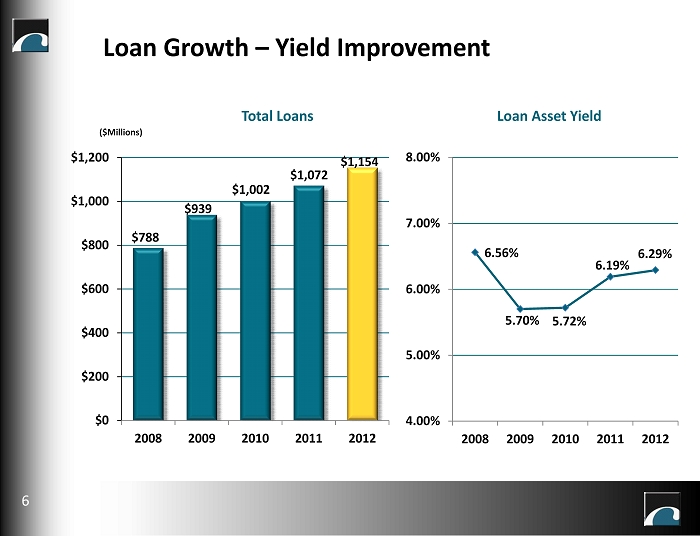
Loan Growth – Yield Improvement Total Loans Loan Asset Yield ($Millions) $0 $200 $400 $600 $800 $1,000 $1,200 2008 2009 2010 2011 2012 $1,072 $1,002 $939 $788 6.56% 5.70% 5.72% 6.19% 6.29% 4.00% 5.00% 6.00% 7.00% 8.00% 2008 2009 2010 2011 2012 6 $1,154
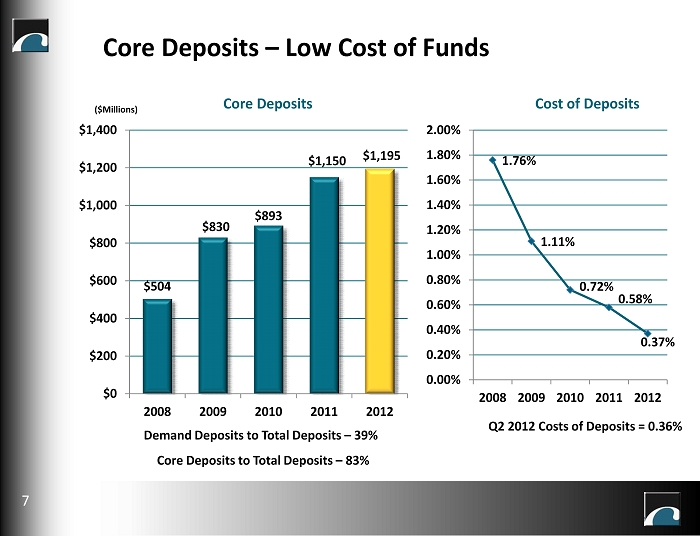
$504 $830 $893 $1,150 $1,195 $0 $200 $400 $600 $800 $1,000 $1,200 $1,400 2008 2009 2010 2011 2012 1.76% 1.11% 0.72% 0.58% 0.37% 0.00% 0.20% 0.40% 0.60% 0.80% 1.00% 1.20% 1.40% 1.60% 1.80% 2.00% 2008 2009 2010 2011 2012 ($Millions) Core Deposits – Low Cost of Funds Q2 2012 Costs of Deposits = 0.36% Core Deposits Cost of Deposits 7 Demand Deposits to Total Deposits – 39% Core Deposits to Total Deposits – 83%
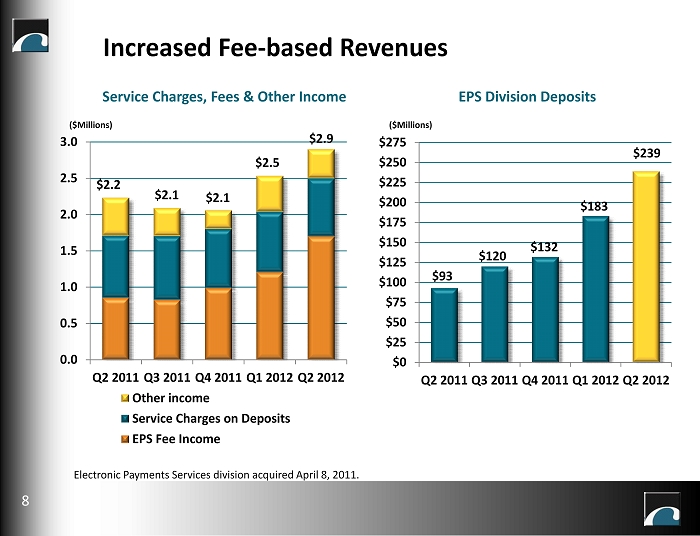
0.0 0.5 1.0 1.5 2.0 2.5 3.0 Q2 2011 Q3 2011 Q4 2011 Q1 2012 Q2 2012 Other income Service Charges on Deposits EPS Fee Income $2.2 $2.1 $2.1 $2.5 ($Millions) Increased Fee - based Revenues Service Charges, Fees & Other Income EPS Division Deposits 8 $93 $120 $132 $183 $239 $0 $25 $50 $75 $100 $125 $150 $175 $200 $225 $250 $275 Q2 2011 Q3 2011 Q4 2011 Q1 2012 Q2 2012 ($Millions) Electronic Payments Services division acquired April 8, 2011. $2.9
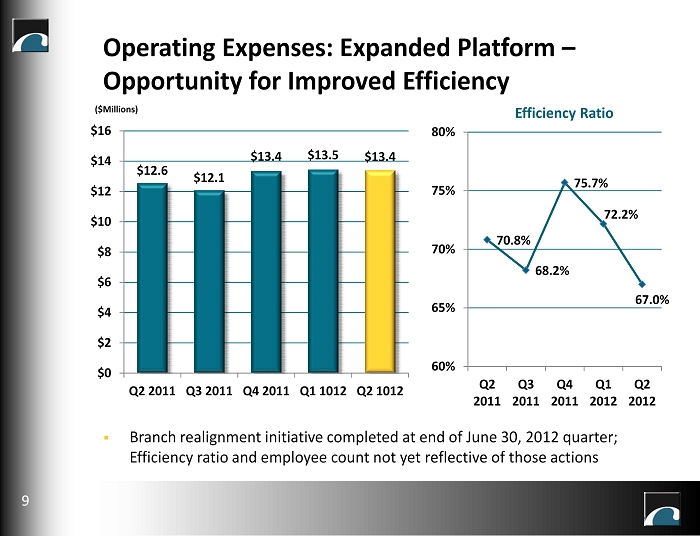
$12.6 $12.1 $13.4 $13.5 $13.4 $0 $2 $4 $6 $8 $10 $12 $14 $16 Q2 2011 Q3 2011 Q4 2011 Q1 1012 Q2 1012 Operating Expenses: Expanded Platform – Opportunity for Improved Efficiency ($Millions) Efficiency Ratio 9 70.8% 68.2% 75.7% 72.2% 67.0% 60% 65% 70% 75% 80% Q2 2011 Q3 2011 Q4 2011 Q1 2012 Q2 2012 ▪ Branch realignment initiative completed at end of June 30, 2012 quarter; Efficiency ratio and employee count not yet reflective of those actions
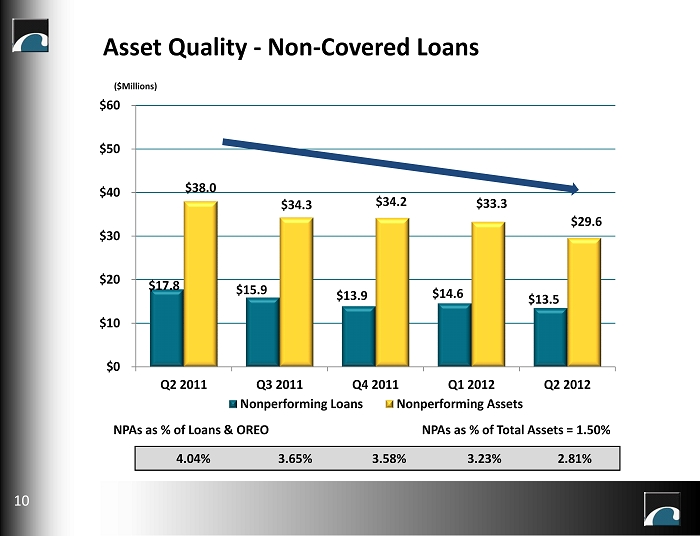
Asset Quality - Non - Covered Loans 4.04% 3.65% 3.58% 3.23% 2.81% $17.8 $15.9 $13.9 $14.6 $13.5 $38.0 $34.3 $34.2 $33.3 $29.6 $0 $10 $20 $30 $40 $50 $60 Q2 2011 Q3 2011 Q4 2011 Q1 2012 Q2 2012 Nonperforming Loans Nonperforming Assets 10 NPAs as % of Loans & OREO ($Millions) NPAs as % of T otal Assets = 1.50%

$34 $25 $19 $18 $9 $39 $37 $34 $31 $19 $0 $5 $10 $15 $20 $25 $30 $35 $40 $45 $50 Q2 2011 Q3 2011 Q4 2011 Q1 2012 Q2 2012 Covered Non-performing Loans Covered Non-performing Assets Asset Quality - Covered Loans ($Millions) 11
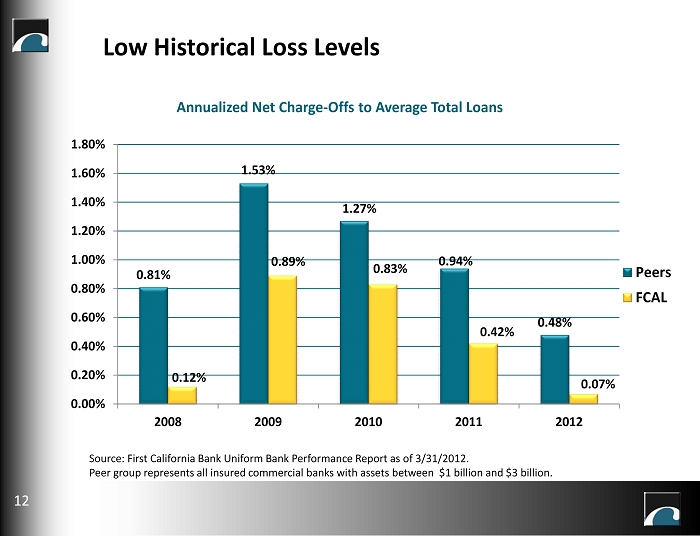
Low Historical Loss Levels Annualized Net Charge - Offs to Average Total Loans 0.81% 1.53% 1.27% 0.94% 0.48% 0.12% 0.89% 0.83% 0.42% 0.07% 0.00% 0.20% 0.40% 0.60% 0.80% 1.00% 1.20% 1.40% 1.60% 1.80% 2008 2009 2010 2011 2012 Peers FCAL 12 Source: First California Bank Uniform Bank Performance Report as of 3/31/2012. Peer group represents all insured commercial banks with assets between $1 billion and $3 billion.
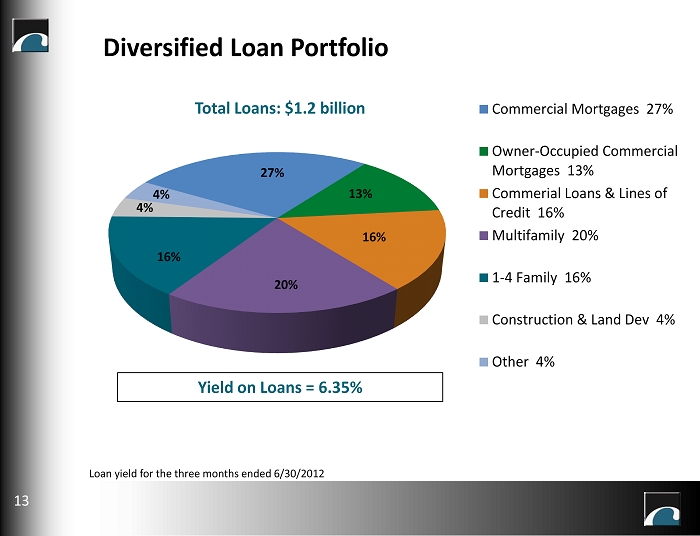
Diversified Loan Portfolio 13% 27% 16% 4% 20% 4% Commercial Mortgages 27% Owner-Occupied Commercial Mortgages 13% Commerial Loans & Lines of Credit 16% Multifamily 20% 1-4 Family 16% Construction & Land Dev 4% Other 4% Yield on Loans = 6.35% Total Loans: $1.2 b illion 13 16% Loan yield for the three months ended 6/30/2012
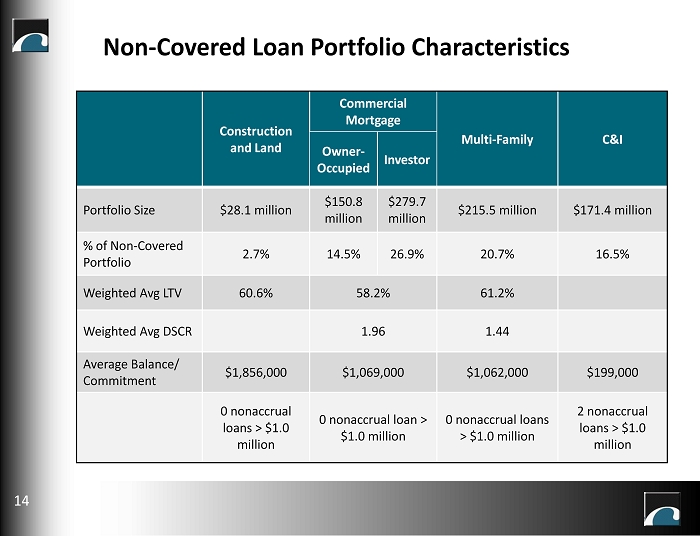
Construction and Land Commercial Mortgage Multi - Family C&I Owner - Occupied Investor Portfolio Size $28.1 million $150.8 million $279.7 million $215.5 million $171.4 million % of Non - Covered Portfolio 2.7% 14.5% 26.9% 20.7% 16.5% Weighted Avg LTV 60.6% 58.2% 61.2% Weighted Avg DSCR 1.96 1.44 Average Balance/ Commitment $1,856,000 $1,069,000 $1,062,000 $199,000 0 nonaccrual loans > $1.0 million 0 nonaccrual loan > $1.0 million 0 nonaccrual loans > $1.0 million 2 nonaccrual loans > $1.0 million Non - Covered Loan Portfolio Characteristics 14
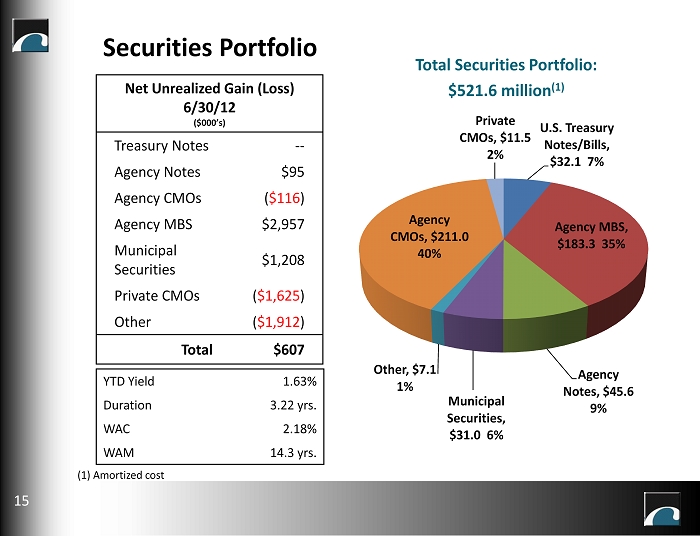
U.S. Treasury Notes/Bills, $32.1 7% Agency MBS, $ 183.3 35% Agency Notes, $45.6 9% Municipal Securities, $31.0 6% Other, $ 7.1 1% Agency CMOs, $211.0 40% Private CMOs, $11.5 2% N et U nrealized G ain ( L oss) 6/30/12 ($000’s) Treasury Notes -- Agency Notes $95 Agency CMOs ( $116 ) Agency MBS $2,957 Municipal Securities $1,208 Private CMOs ( $1,625 ) Other ( $1,912 ) Total $607 Securities Portfolio Total Securities Portfolio: $521.6 million (1 ) 15 YTD Yield 1.63% Duration 3.22 yrs. WAC 2.18% WAM 14.3 yrs. (1 ) Amortized cost
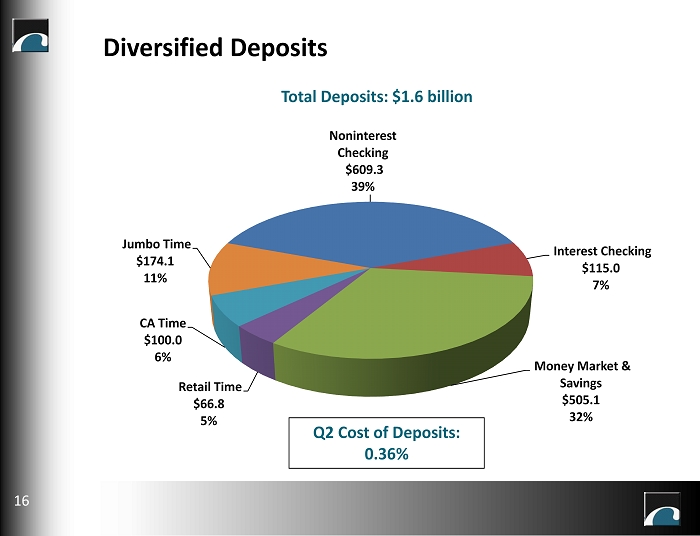
Diversified Deposits Noninterest Checking $609.3 39% Interest Checking $115.0 7% Money Market & Savings $505.1 32% Retail Time $66.8 5% CA Time $100.0 6% Jumbo Time $174.1 11% Q2 Cost of Deposits: 0.36% Total Deposits: $1.6 billion 16
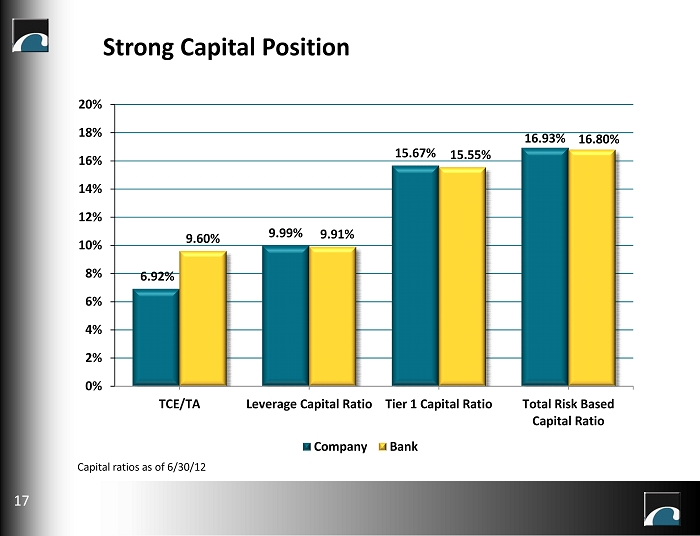
6.92% 9.99% 15.67% 16.93% 9.60% 9.91% 15.55% 16.80% 0% 2% 4% 6% 8% 10% 12% 14% 16% 18% 20% TCE/TA Leverage Capital Ratio Tier 1 Capital Ratio Total Risk Based Capital Ratio Company Bank Strong Capital Position Capital ratios as of 6/30/12 17
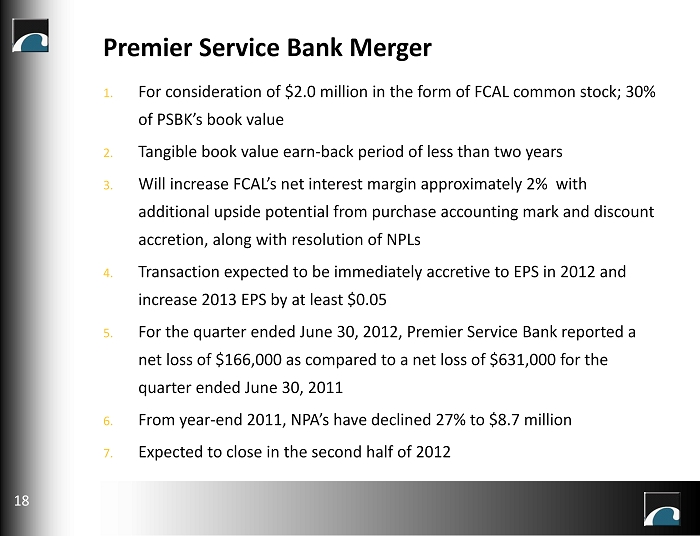
1. For consideration of $2.0 million in the form of FCAL common stock; 30% of PSBK’s book value 2. Tangible book value earn - back period of less than two years 3. Will increase FCAL’s net interest margin approximately 2% with additional upside potential from purchase accounting mark and discount accretion, along with resolution of NPLs 4. Transaction expected to be immediately accretive to EPS in 2012 and increase 2013 EPS by at least $0.05 5. For the quarter ended June 30, 2012, Premier Service Bank reported a net loss of $166,000 as compared to a net loss of $631,000 for the quarter ended June 30, 2011 6. From year - end 2011, NPA’s have declined 27% to $8.7 million 7. Expected to close in the second half of 2012 Premier Service Bank Merger 18
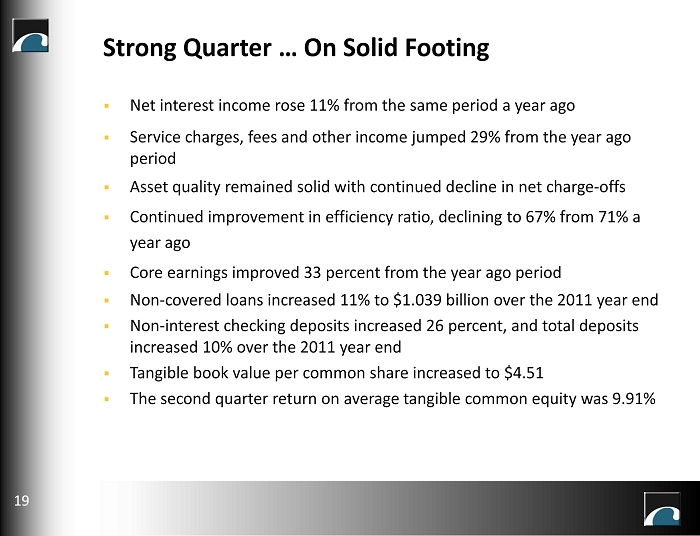
▪ Net interest income rose 11% from the same period a year ago ▪ Service charges, fees and other income jumped 29% from the year ago period ▪ Asset quality remained solid with continued decline in net charge - offs ▪ Continued improvement in efficiency ratio, declining to 67% from 71% a year ago ▪ Core earnings improved 33 percent from the year ago period ▪ Non - covered loans increased 11% to $1.039 billion over the 2011 year end ▪ Non - interest checking deposits increased 26 percent, and total deposits increased 10% over the 2011 year end ▪ Tangible book value per common share increased to $ 4.51 ▪ The second quarter return on average tangible common equity was 9.91% 19 Strong Quarter … On Solid Footing
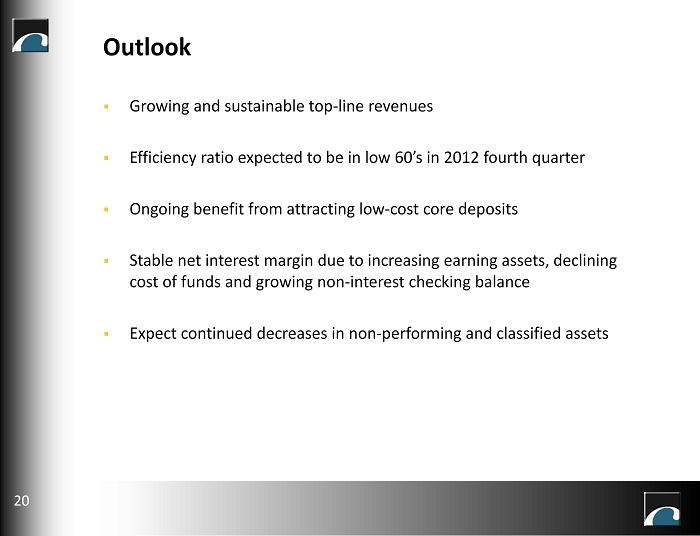
▪ Growing and sustainable top - line revenues ▪ Efficiency ratio expected to be in low 60’s in 2012 fourth quarter ▪ Ongoing benefit from attracting low - cost core deposits ▪ Stable net interest margin due to increasing earning assets, declining cost of funds and growing non - interest checking balance ▪ Expect continued decreases in non - performing and classified assets Outlook 20
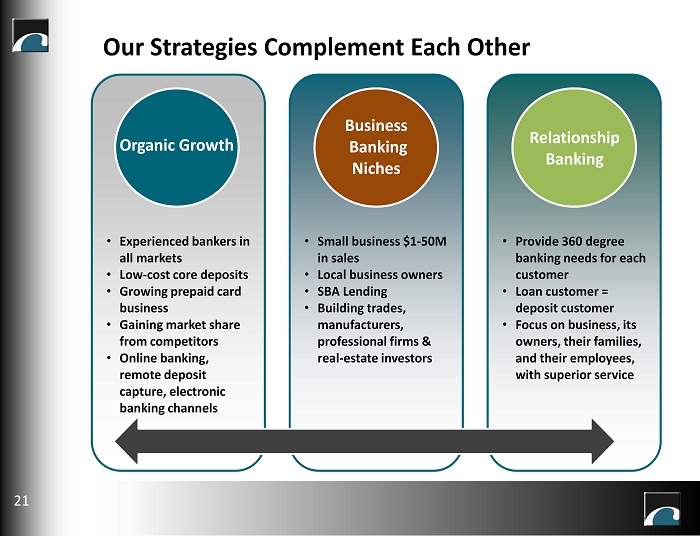
Our Strategies Complement Each Other 21 • Small business $1 - 50M in sales • Local business o wners • SBA Lending • Building trades, manufacturers, professional firms & real - estate investors • Experienced bankers in all markets • Low - cost c ore deposits • Growing prepaid card business • Gaining market share from competitors • Online banking, remote deposit capture, electronic banking channels • Provide 360 degree banking needs for each customer • Loan customer = deposit customer • Focus on business, its owners, their families, and their employees, with superior service Organic Growth Business Banking Niches Relationship Banking
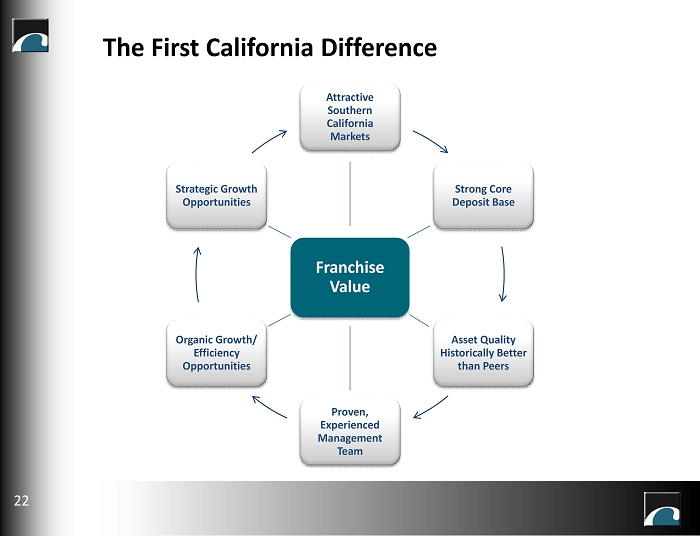
Attractive Southern California Markets Strong Core Deposit Base Asset Quality Historically Better than Peers Proven, Experienced Management Team Organic Growth/ Efficiency Opportunities Strategic Growth Opportunities 22 The First California Difference Franchise Value