Attached files
| file | filename |
|---|---|
| 8-K - POLARIS INDUSTRIES INC. 8-K - Polaris Inc. | a50351170.htm |
| EX-99.1 - EXHIBIT 99.1 - Polaris Inc. | a50351170ex99-1.htm |
Exhibit 99.2
POLARIS INDUSTRIES INC. Second Quarter 2012 Earnings Results July 24, 2012
Safe Harbor Except for historical information contained herein, the matters set forth in this document, including but not limited to management’s expectations regarding 2012 sales, shipments, net income, cash flow, and manufacturing realignment transition costs and savings, are forward-looking statements that involve certain risks and uncertainties that could cause actual results to differ materially from those forward-looking statements. Potential risks and uncertainties include such factors as product offerings, promotional activities and pricing strategies by competitors; manufacturing realignment transition costs; acquisition integration costs; warranty expenses; impact of changes in Polaris stock prices on incentive compensation; foreign currency exchange rate fluctuations; environmental and product safety regulatory activity; effects of weather; commodity costs; uninsured product liability claims; uncertainty in the retail and wholesale credit markets; changes in tax policy and overall economic conditions, including inflation, consumer confidence and spending and relationships with dealers and suppliers. Investors are also directed to consider other risks and uncertainties discussed in our 2011 annual report and Form 10-K filed by the Company with the Securities and Exchange Commission. The Company does not undertake any duty to any person to provide updates to its forward-looking statements. The data source for retail sales figures included in this presentation is registration information provided by Polaris dealers in North America and compiled by the Company or Company estimates. The Company must rely on information that its dealers supply concerning retail sales, and other retail sales data sources and this information is subject to revision. Note: Shares and per share information have been adjusted to give effect to the two-for-one stock split declared on July 20, 2011, payable on September 12, 2011 to shareholders of record on September 2, 2011. 2
Scott Wine, CEO POLARIS INDUSTRIES INC. Second Quarter 2012 Earnings Results July 24, 2012
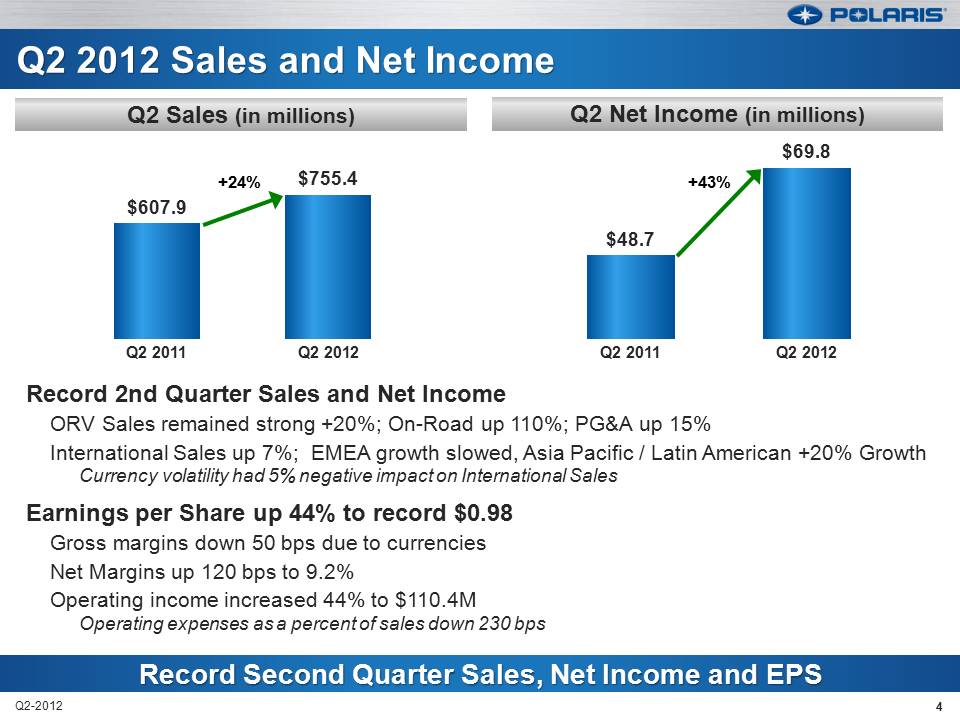
Q2 2012 Sales and Net IncomeQ2 Sales (in millions) Q2 Net Income (in millions) $69.8 +24% $755.4 +43% $607.9 $48.7 Q2 2011 Q2 2012 Q2 2011 Q2 2012 Record 2nd Quarter Sales and Net Income ORV Sales remained strong +20%; On-Road up 110%; PG&A up 15% International Sales up 7%; EMEA growth slowed, Asia Pacific / Latin American +20% Growth Currency volatility had 5% negative impact on International Sales Earnings per Share up 44% to record $0.98 Gross margins down 50 bps due to currencies Net Margins up 120 bps to 9.2% Operating income increased 44% to $110.4M Operating expenses as a percent of sales down 230 bps Record Second Quarter Sales, Net Income and EPS 4
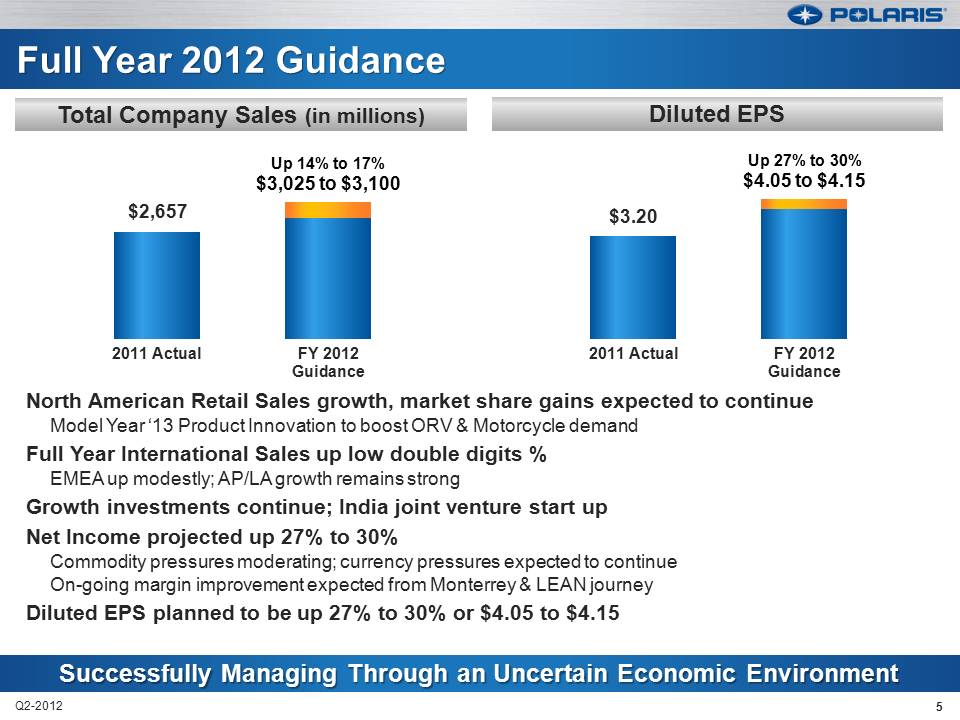
Full Year 2012 Guidance Total Company Sales (in millions) Diluted EPS Up 14% to 17% Up 27% to 30% $3,025 to $3,100 $4.05 to $4.15 $2,657 $3.20 2011 Actual FY 2012 2011 Actual FY 2012 Guidance Guidance North American Retail Sales growth, market share gains expected to continue Model Year ‘13 Product Innovation to boost ORV & Motorcycle demand Full Year International Sales up low double digits % EMEA up modestly; AP/LA growth remains strong Growth investments continue; India joint venture start up Net Income projected up 27% to 30% Commodity pressures moderating; currency pressures expected to continue On-going margin improvement expected from Monterrey & LEAN journey Diluted EPS planned to be up 27% to 30% or $4.05 to $4.15 Successfully Managing Through an Uncertain Economic Environment 5
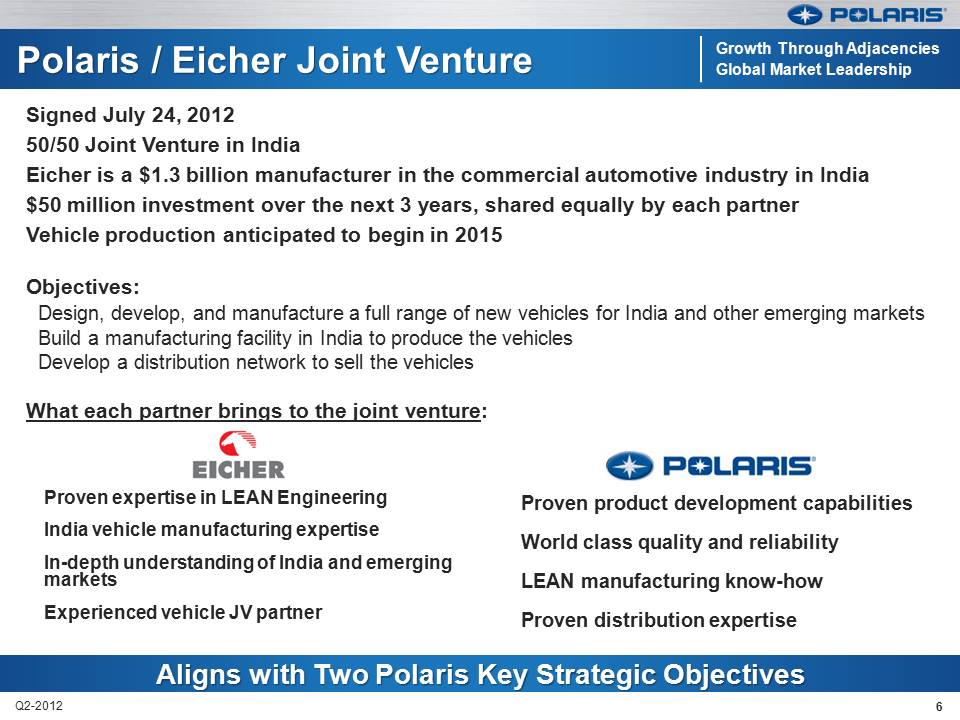
Polaris / Eicher Joint Venture Growth Through Adjacencies Global Market Leadership Signed July 24, 2012 50/50 Joint Venture in India Eicher is a $1.3 billion manufacturer in the commercial automotive industry in India $50 million investment over the next 3 years, shared equally by each partner Vehicle production anticipated to begin in 2015 Objectives: Design, develop, and manufacture a full range of new vehicles for India and other emerging markets Build a manufacturing facility in India to produce the vehicles Develop a distribution network to sell the vehicles What each partner brings to the joint venture: Proven expertise in LEAN Engineering Proven product development capabilities India vehicle manufacturing expertise World class quality and reliability In-depth understanding of India and emerging markets LEAN manufacturing know-how Experienced vehicle JV partner Proven distribution expertise Aligns with Two Polaris Key Strategic Objectives 6
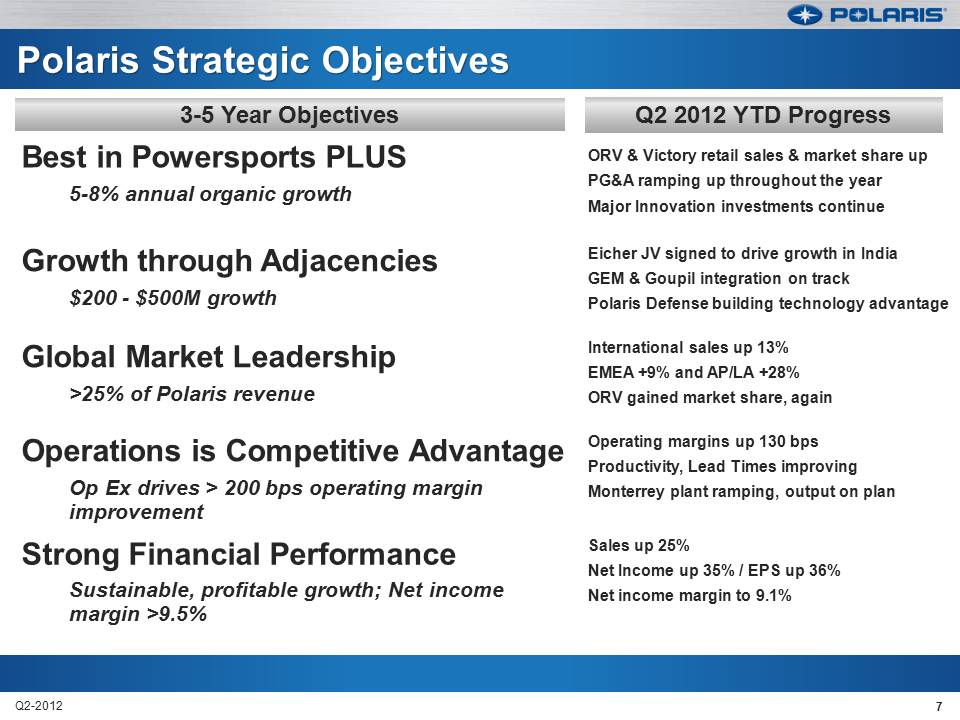
Polaris Strategic Objectives 3-5 Year Objectives Q2 2012 YTD Progress Best in Powersports PLUS 5-8% annual organic growth ORV & Victory retail sales & market share up PG&A ramping up throughout the year Major Innovation investments continue Growth through Adjacencies $200 - $500M growth Eicher JV signed to drive growth in India GEM & Goupil integration on track Polaris Defense building technology advantage Global Market Leadership >25% of Polaris revenue International sales up 13% EMEA +9% and AP/LA +28% ORV gained market share, again Operations is Competitive Advantage Op Ex drives > 200 bps operating margin improvement Operating margins up 130 bps Productivity, Lead Times improving Monterrey plant ramping, output on plan Strong Financial Performance Sustainable, profitable growth; Net income margin >9.5% Sales up 25% Net Income up 35% / EPS up 36% Net income margin to 9.1% 7
Bennett Morgan President & COO POLARIS INDUSTRIES INC. Second Quarter 2012 Earnings Results July 24, 2012
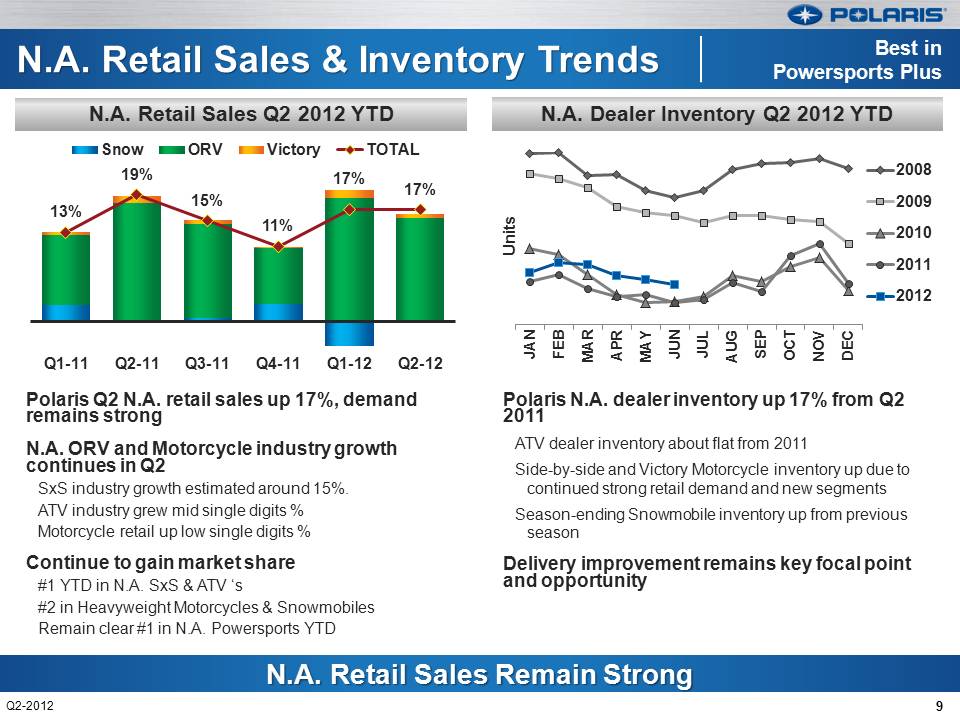
N.A. Retail Sales & Inventory Trends Best in Powersports Plus Snow ORV Victory TOTAL 2008 19% 17% 2009 2010 2011 2012 Q1-11 Q2-11 Q3-11 Q4-11 Q1-12 Q2-12 Polaris Q2 N.A. retail sales up 17%, demand remains strong N.A. ORV and Motorcycle industry growth continues in Q2 SxS industry growth estimated around 15%. ATV industry grew mid single digits % Motorcycle retail up low single digits % Continue to gain market share #1 YTD in N.A. SxS & ATV ‘s #2 in Heavyweight Motorcycles & Snowmobiles Remain clear #1 in N.A. Powersports YTD Polaris N.A. dealer inventory up 17% from Q2 2011 ATV dealer inventory about flat from 2011 Side-by-side and Victory Motorcycle inventory up due to continued strong retail demand and new segments Season-ending Snowmobile inventory up from previous season Delivery improvement remains key focal point and opportunity N.A. Retail Sales Remain Strong 9
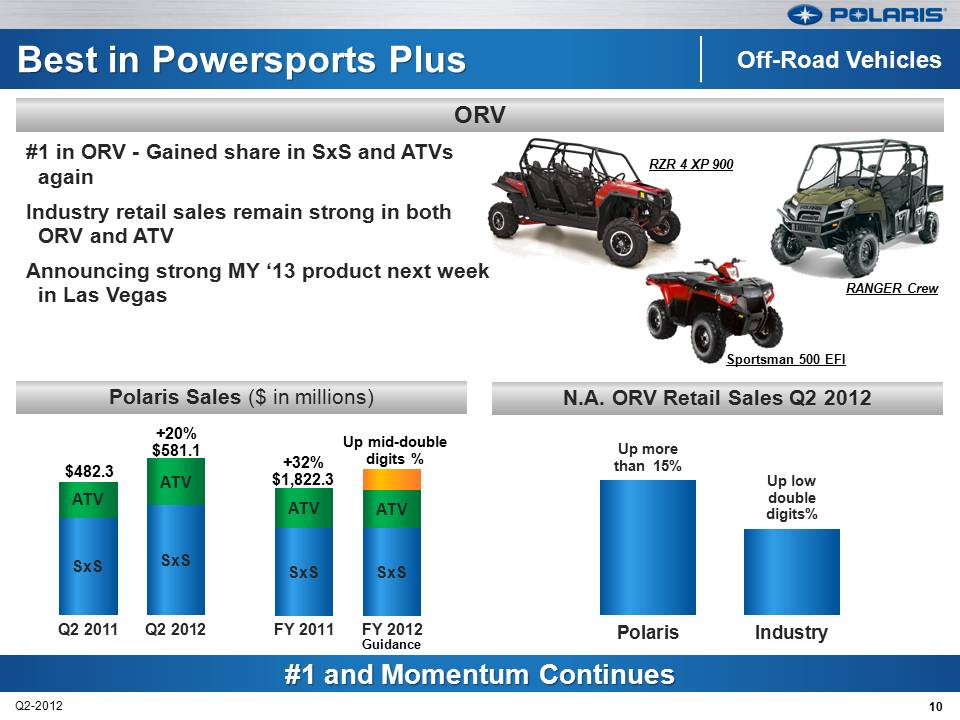
Best in Powersports Plus Off-Road Vehicles #1 in ORV -Gained share in SxS and ATVs again Industry retail sales remain strong in both ORV and ATV Announcing strong MY ‘13 product next week RANGER Crew in Las Vegas Sportsman 500 EFI Polaris Sales ($ in millions) N.A. ORV Retail Sales Q2 2012 +20% Up mid-double $581.1 Up more+32% digits % than 15% $482.3 $1,822.3 Up low double digits% Q2 2011 Q2 2012 FY 2011 FY 2012 Polaris Industry Guidance #1 and Momentum Continues 10
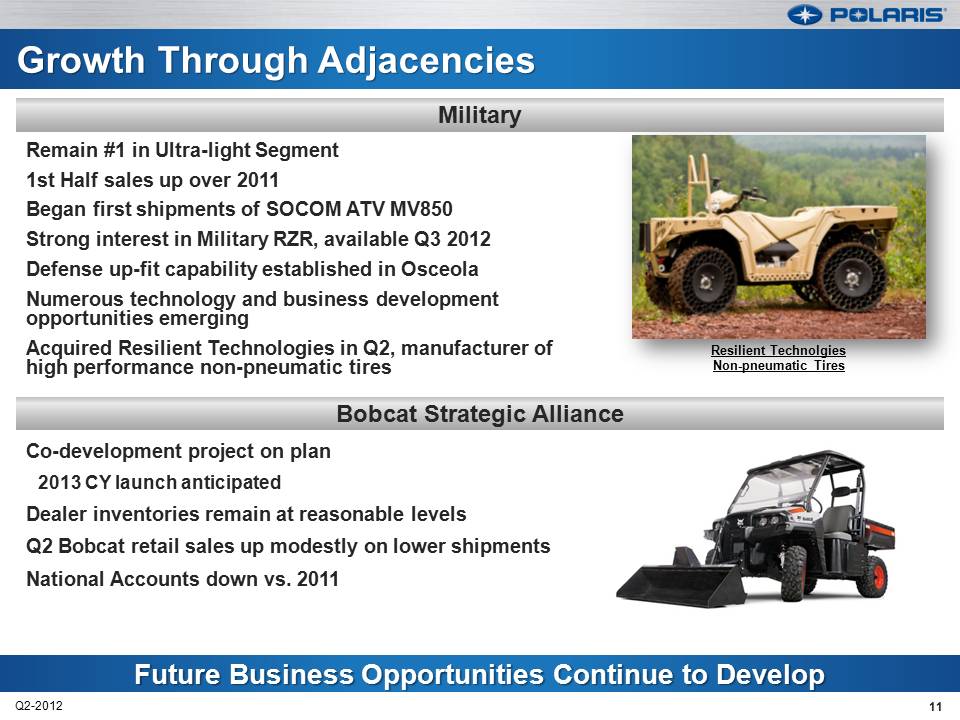
Growth Through Adjacencies Military Bobcat Strategic Alliance Remain #1 in Ultra-light Segment 1st Half sales up over 2011 Began first shipments of SOCOM ATV MV850 Strong interest in Military RZR, available Q3 2012 Defense up-fit capability established in Osceola Numerous technology and business development opportunities emerging Acquired Resilient Technologies in Q2, manufacturer of high performance non-pneumatic tires Co-development project on plan 2013 CY launch anticipated Dealer inventories remain at reasonable levels Q2 Bobcat retail sales up modestly on lower shipments National Accounts down vs. 2011 Future Business Opportunities Continue to Develop 11
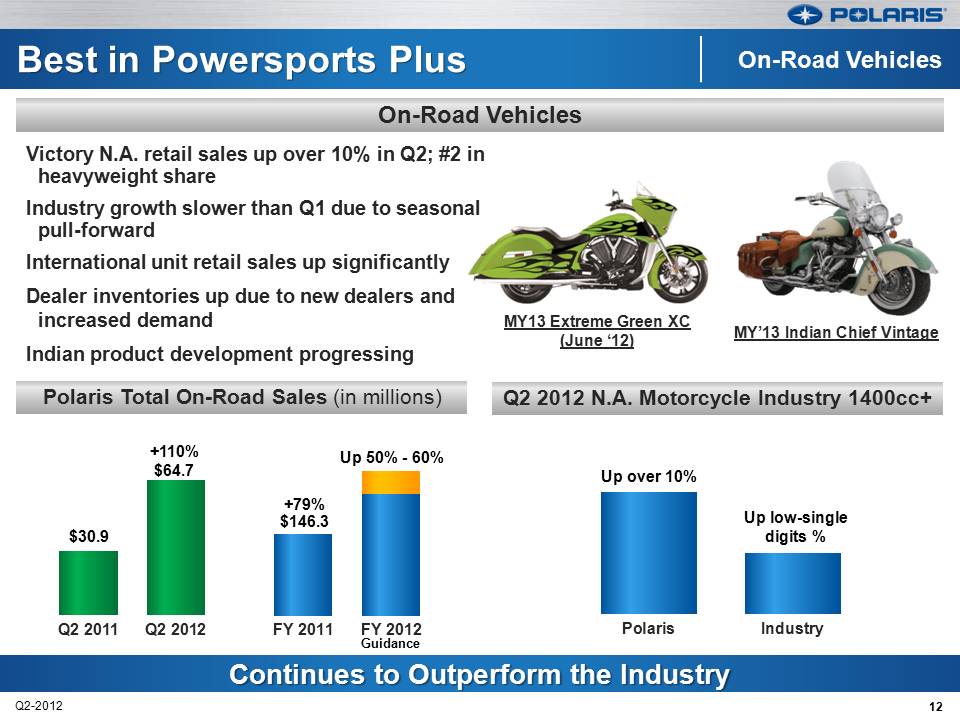
Best in Powersports Plus On-Road Vehicles Polaris Total On-Road Sales (in millions) Q2 2012 N.A. Motorcycle Industry 1400cc+ Victory N.A. retail sales up over 10% in Q2; #2 in heavyweight share Industry growth slower than Q1 due to seasonal pull-forward International unit retail sales up significantly Dealer inventories up due to new dealers and increased demand Indian product development progressing +110% Up 50% -60% $64.7 +79% $146.3 $30.9 MY13 Extreme Green XC (June ‘12) Up over 10% Up low-single digits % Q2 2011 Q2 2012 FY 2011 FY 2012 Polaris Industry Guidance Continues to Outperform the Industry 12
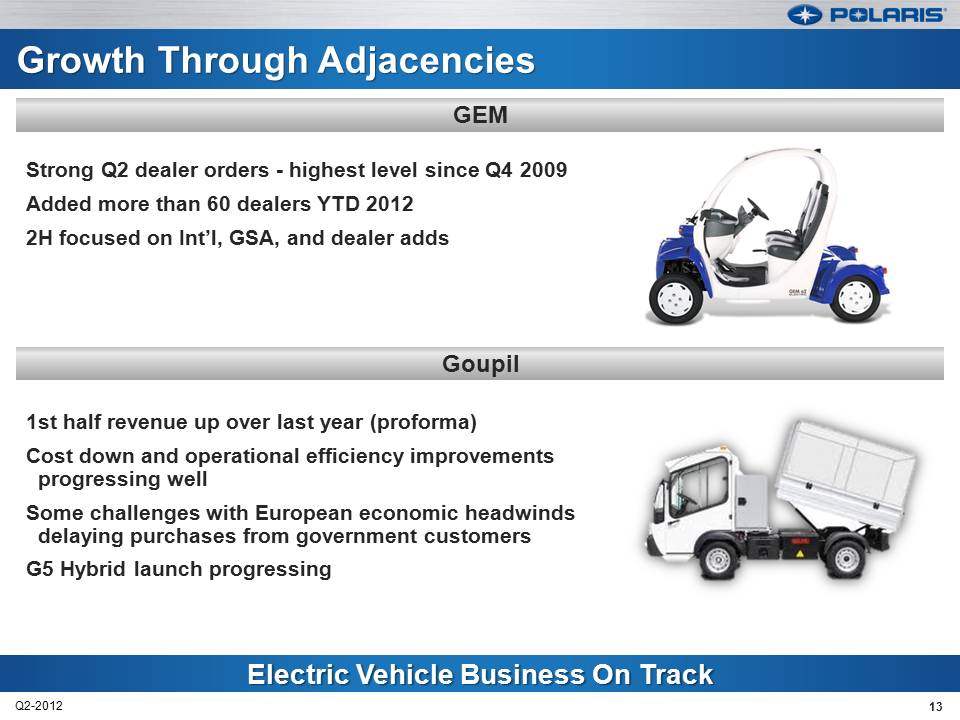
Growth Through Adjacencies GEM Goupil Strong Q2 dealer orders -highest level since Q4 2009 Added more than 60 dealers YTD 2012 2H focused on Int’l, GSA, and dealer adds 1st half revenue up over last year (proforma) Cost down and operational efficiency improvements progressing well Some challenges with European economic headwinds delaying purchases from government customers G5 Hybrid launch progressing Electric Vehicle Business On Track 13
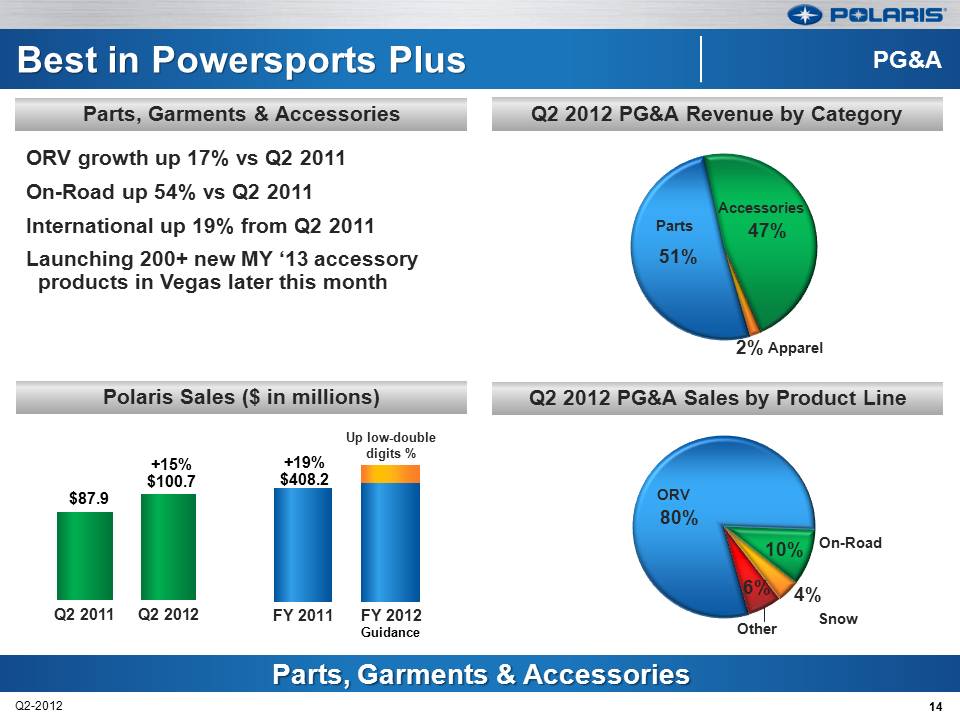
Best in Powersports Plus PG&A Q2 2012 PG&A Revenue by Category Parts, Garments & Accessories ORV growth up 17% vs Q2 2011 On-Road up 54% vs Q2 2011 International up 19% from Q2 2011 Launching 200+ new MY ‘13 accessory products in Vegas later this month 51% 47% 2% Parts Accessories Apparel Q2 2012 PG&A Sales by Product Line Polaris Sales ($ in millions) Up low-double digits % +15% +19% $100.7 $408.2 $87.9 On-Road 80% 10% 4% ORV 6% Q2 2011 Q2 2012 FY 2011 FY 2012 Snow Other Guidance Parts, Garments & Accessories 14
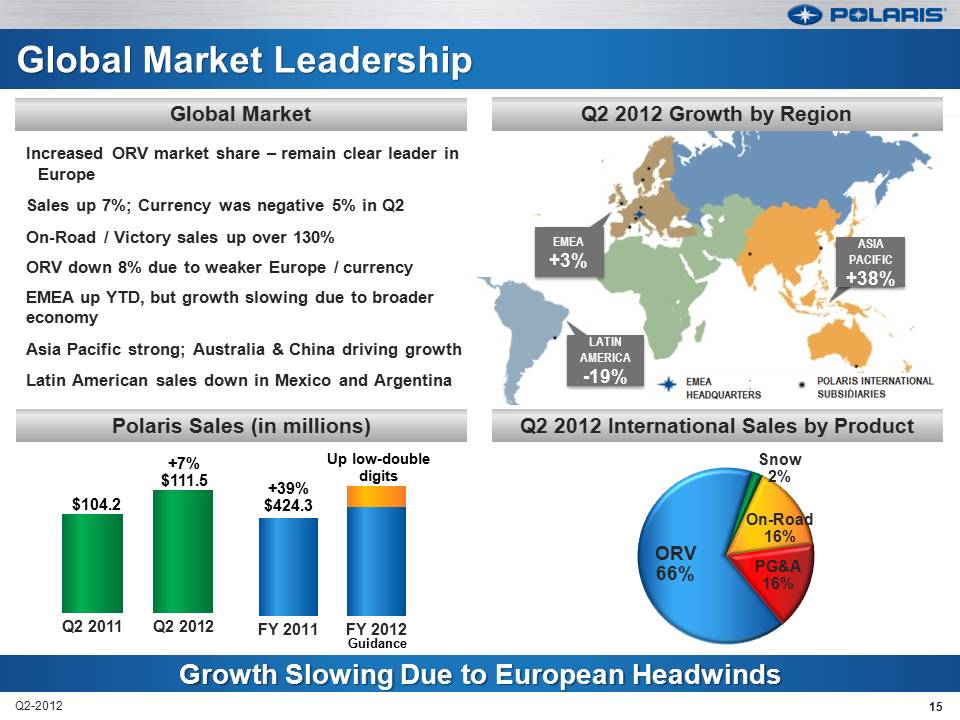
Global Market Leadership Polaris Sales (in millions) Q2 2012 Growth by Region Global Market Snow 2%Up low-double digits +7% $111.5 +39% Increased ORV market share – remain clear leader in Europe Sales up 7%; Currency was negative 5% in Q2 On-Road / Victory sales up over 130% ORV down 8% due to weaker Europe / currency EMEA up YTD, but growth slowing due to broader economy Asia Pacific strong; Australia & China driving growth Latin American sales down in Mexico and Argentina Q2 2012 International Sales by Product $104.2 $424.3 Q2 2011 Q2 2012 FY 2011 FY 2012 Guidance ORV 66% On-Road 16% PG&A 16% Growth Slowing Due to European Headwinds 15
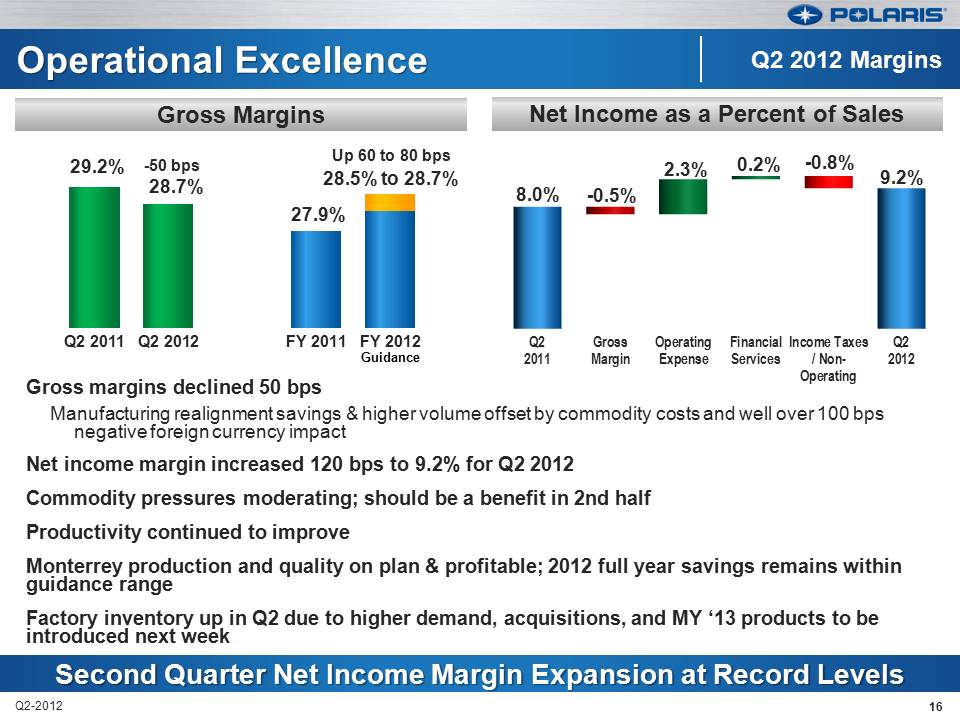
Operational Excellence Gross Margins Net Income as a Percent of Sales Q2 2012 Margins Up 60 to 80 bps 29.2% -50 bps 2.3% 0.2% -0.8% 28.5% to 28.7% 28.7% 27.9% Q2 2011 Q2 2012 FY 2011 FY 2012 Q2 Gross Operating Financial Income Taxes Q2 Guidance 2011 Margin Expense Services / Non-2012 Operating Gross margins declined 50 bps Manufacturing realignment savings & higher volume offset by commodity costs and well over 100 bps negative foreign currency impact Net income margin increased 120 bps to 9.2% for Q2 2012 Commodity pressures moderating; should be a benefit in 2nd half Productivity continued to improve Monterrey production and quality on plan & profitable; 2012 full year savings remains within guidance range Factory inventory up in Q2 due to higher demand, acquisitions, and MY ‘13 products to be introduced next week Second Quarter Net Income Margin Expansion at Record Levels 16
Mike Malone V.P. Finance & CFO Second Quarter 2012 Earnings Results July 24, 2012 POLARIS INDUSTRIES INC.
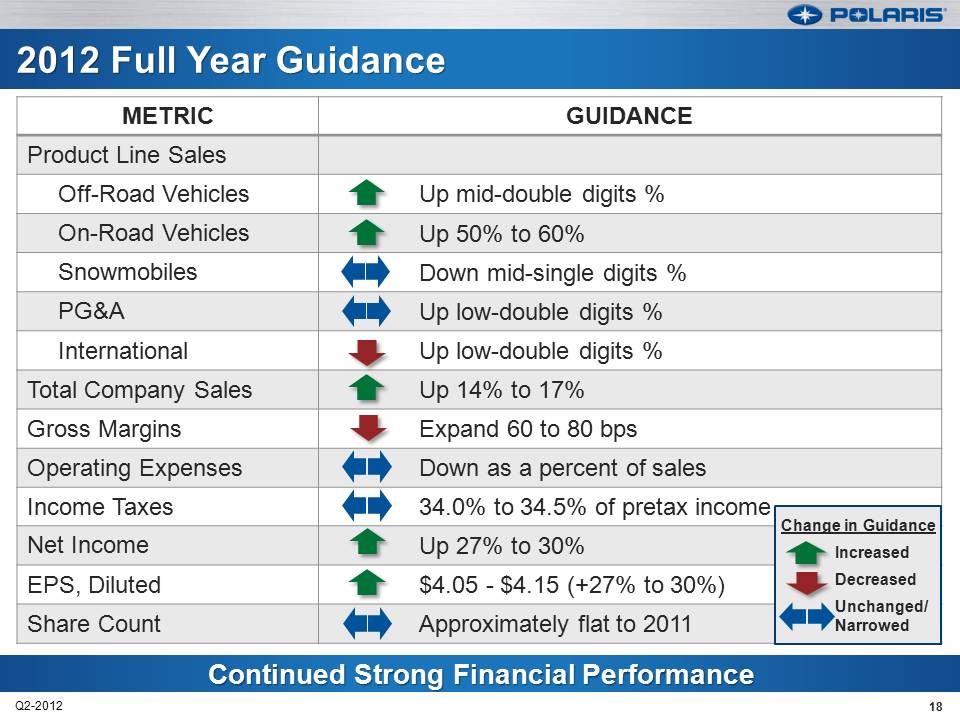
2012 Full Year Guidance METRIC GUIDANCE Product Line Sales Off-Road Vehicles Up mid-double digits % On-Road Vehicles Up 50% to 60% Snowmobiles Down mid-single digits % PG&A Up low-double digits % International Up low-double digits % Total Company Sales Up 14% to 17% Gross Margins Expand 60 to 80 bps Operating Expenses Down as a percent of sales Income Taxes 34.0% to 34.5% of pretax income Net Income Up 27% to 30% Change in Guidance Increased EPS, Diluted $4.05 -$4.15 (+27% to 30%) Decreased Share Count Approximately flat to 2011 Unchanged/ Narrowed Continued Strong Financial Performance 18
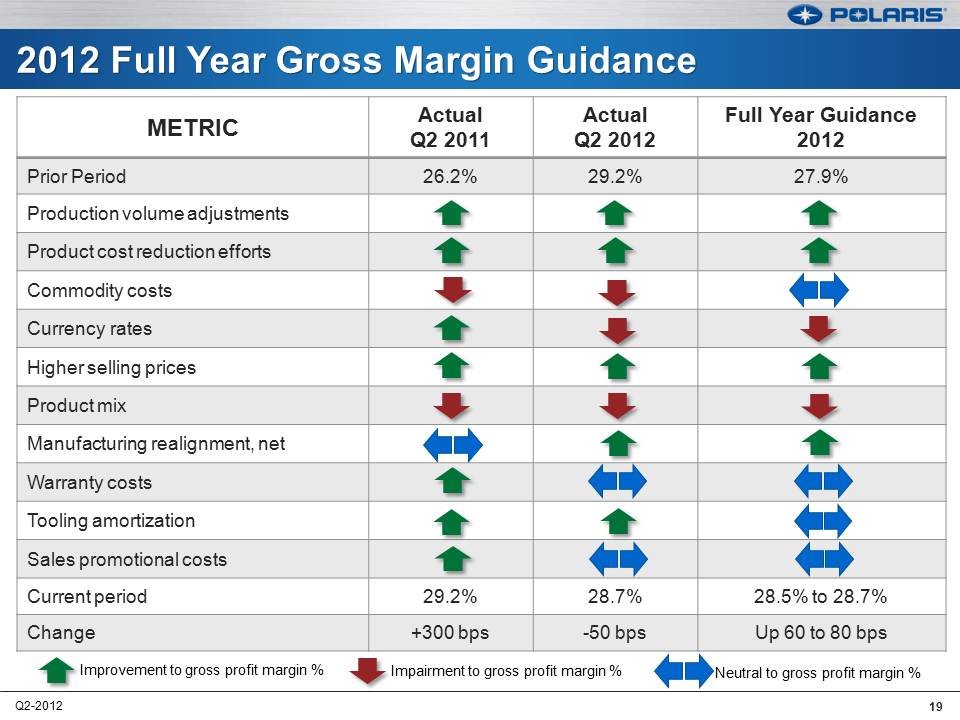
2012 Full Year Gross Margin Guidance METRIC Actual Q2 2011 Actual Q2 2012 Full Year Guidance 2012 Prior Period 26.2% 29.2% 27.9% Production volume adjustments Product cost reduction efforts Commodity costs Currency rates Higher selling prices Product mix Manufacturing realignment, net Warranty costs Tooling amortization Sales promotional costs Current period 29.2% 28.7% 28.5% to 28.7% Change +300 bps -50 bps Up 60 to 80 bps Improvement to gross profit margin % Impairment to gross profit margin % Neutral to gross profit margin % 19
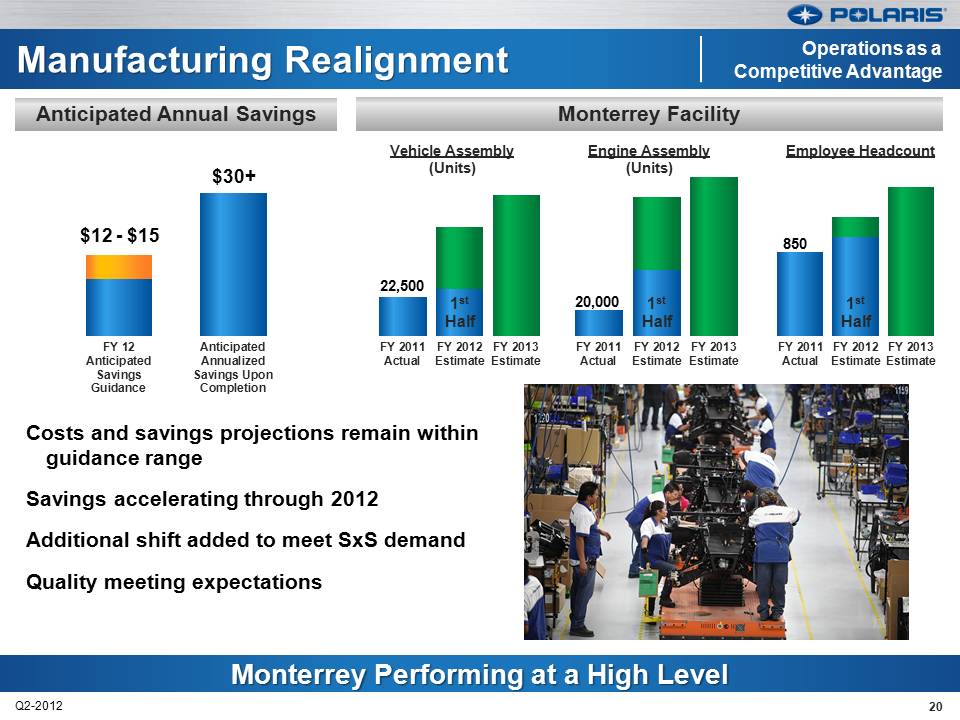
Manufacturing Realignment Monterrey Facility Operations as a Competitive Advantage Vehicle Assembly Engine Assembly Employee Headcount (Units) (Units) $30+ $12 -$15 850 1 st Half 22,500 20,0001st Half 1st Half FY 12 Anticipated FY 2011 FY 2012 FY 2013 FY 2011 FY 2012 FY 2013 FY 2011 FY 2012 FY 2013 Anticipated Annualized Actual Estimate Estimate Actual Estimate Estimate Actual Estimate Estimate Savings Savings Upon Guidance Completion Costs and savings projections remain within guidance range Savings accelerating through 2012 Additional shift added to meet SxS demand Quality meeting expectations Monterrey Performing at a High Level Monterrey Performing at a High Level 20
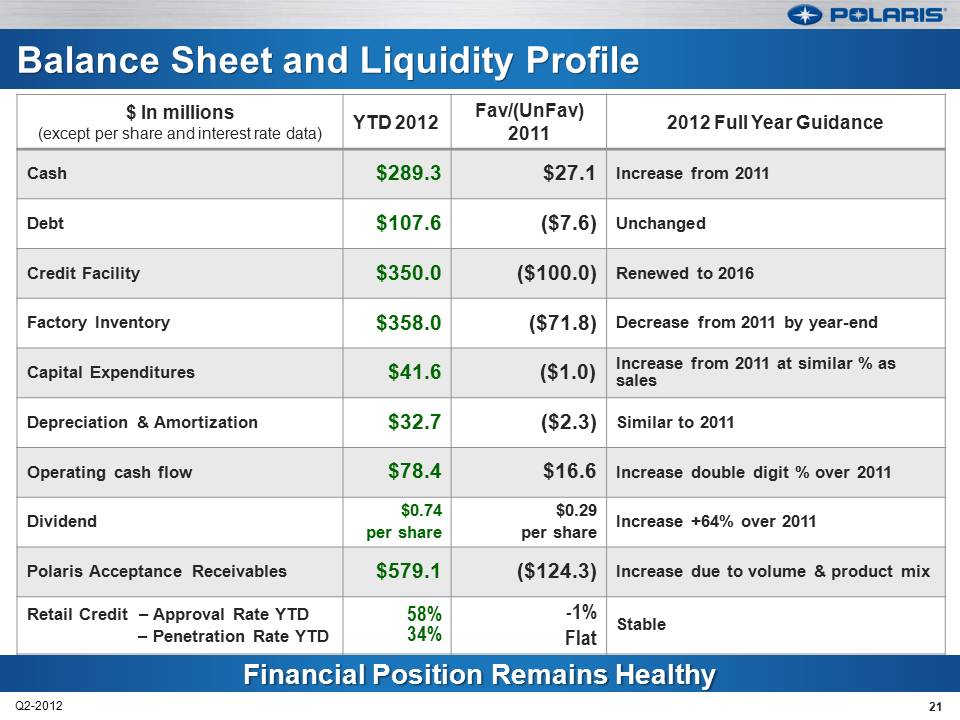
Balance Sheet and Liquidity Profile $ In millions (except per share and interest rate data) YTD 2012 Fav/(UnFav) 2011 2012 Full Year Guidance Cash $289.3 $27.1 Increase from 2011 Debt $107.6 ($7.6) Unchanged Credit Facility $350.0 ($100.0) Renewed to 2016 Factory Inventory $358.0 ($71.8) Decrease from 2011 by year-end Capital Expenditures $41.6 ($1.0) Increase from 2011 at similar % as sales Depreciation & Amortization $32.7 ($2.3) Similar to 2011 Operating cash flow $78.4 $16.6 Increase double digit % over 2011 Dividend $0.74 per share $0.29 per share Increase +64% over 2011 Polaris Acceptance Receivables $579.1 ($124.3) Increase due to volume & product mix Retail Credit – Approval Rate YTD – Penetration Rate YTD 58% 34% -1% Flat Stable Financial Position Remains Healthy 21

Scott Wine, CEO POLARIS INDUSTRIES INC. Second Quarter 2012 Earnings Results July 24, 2012
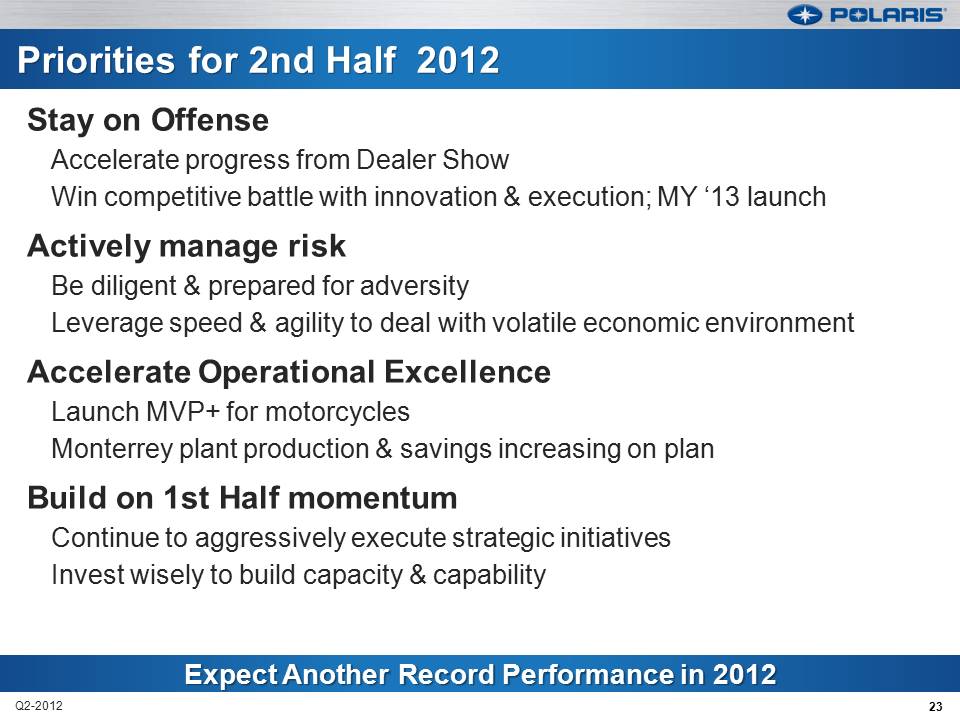
Priorities for 2nd Half 2012 Stay on Offense Accelerate progress from Dealer Show Win competitive battle with innovation & execution; MY ‘13 launch Actively manage risk Be diligent & prepared for adversity Leverage speed & agility to deal with volatile economic environment Accelerate Operational Excellence Launch MVP+ for motorcycles Monterrey plant production & savings increasing on plan Build on 1st Half momentum Continue to aggressively execute strategic initiatives Invest wisely to build capacity & capability Expect Another Record Performance in 2012 23
Thank you Q &A 24