Attached files
| file | filename |
|---|---|
| EX-23.1 - CONSENT OF INDEPENDENT REGISTERED PUBLIC ACCOUNTING FIRM - PEREGRINE SEMICONDUCTOR CORP | d118905dex231.htm |
| EX-23.3 - CONSENT OF FROST & SULLIVAN - PEREGRINE SEMICONDUCTOR CORP | d118905dex233.htm |
Table of Contents
As filed with the Securities and Exchange Commission on July 23, 2012.
Registration No. 333-170711
UNITED STATES
SECURITIES AND EXCHANGE COMMISSION
Washington, D.C. 20549
Amendment No. 8 to
FORM S-1
REGISTRATION STATEMENT
Under
THE SECURITIES ACT OF 1933
PEREGRINE SEMICONDUCTOR CORPORATION
(Exact Name of Registrant as Specified in its Charter)
| Delaware | 3674 | 86-0652659 | ||
| (State or Other Jurisdiction of | (Primary Standard Industrial | (I.R.S. Employer | ||
| Incorporation or Organization) | Classification Code Number) | Identification Number) |
9380 Carroll Park Drive San Diego, California 92121 Telephone: (858) 731-9400
(Address, including zip code and telephone number, including area code, of registrant’s principal executive offices)
Jay C. Biskupski
Chief Financial Officer
9380 Carroll Park Drive San Diego, California 92121 Telephone: (858) 731-9400
(Name, address, including zip code and telephone number, including area code, of agent for service)
Copies to:
| Gari L. Cheever Jeffrey P. Higgins John M. Tolpa Gunderson Dettmer Stough San Diego, California 92130 |
Eric C. Jensen Jason L. Kent Charles J. Bair Cooley LLP 4401 Eastgate Mall San Diego, California 92121 Telephone: (858) 550-6000 |
Approximate date of commencement of proposed sale to the public: As soon as practicable after the effective date of this Registration Statement.
If any of the securities being registered on this Form are to be offered on a delayed or continuous basis pursuant to Rule 415 under the Securities Act of 1933, check the following box. ¨
If this Form is filed to register additional securities for an offering pursuant to Rule 462(b) under the Securities Act, please check the following box and list the Securities Act registration statement number of the earlier effective registration statement for the same offering. ¨
If this Form is a post-effective amendment filed pursuant to Rule 462(c) under the Securities Act, check the following box and list the Securities Act registration statement number of the earlier effective registration statement for the same offering. ¨
If this Form is a post-effective amendment filed pursuant to Rule 462(d) under the Securities Act, check the following box and list the Securities Act registration statement number of the earlier effective registration statement for the same offering. ¨
Indicate by check mark whether the registrant is a large accelerated filer, an accelerated filer, a non-accelerated filer, or a smaller reporting company. See the definitions of “large accelerated filer,” “accelerated filer” and “smaller reporting company” in Rule 12b-2 of the Exchange Act. (Check one):
| Large accelerated filer ¨ | Accelerated filer ¨ | Non-accelerated filer x | Smaller reporting company ¨ |
(Do not check if a smaller reporting company)
The Registrant hereby amends this Registration Statement on such date or dates as may be necessary to delay its effective date until the Registrant shall file a further amendment which specifically states that this Registration Statement shall thereafter become effective in accordance with Section 8(a) of the Securities Act of 1933 or until the Registration Statement shall become effective on such date as the Commission, acting pursuant to such Section 8(a), may determine.
Table of Contents
The information in this preliminary prospectus is not complete and may be changed. These securities may not be sold until the registration statement filed with the Securities and Exchange Commission is effective. This preliminary prospectus is not an offer to sell nor does it seek an offer to buy these securities in any jurisdiction where the offer or sale is not permitted.
SUBJECT TO COMPLETION. DATED , 2012.
shares

Common Stock
This is our initial public offering of shares of common stock of Peregrine Semiconductor Corporation. The selling stockholders named in this prospectus are offering an additional 159,220 shares of common stock. We will not receive any proceeds from the sale of shares by the selling stockholders.
Prior to this offering, there has been no public market for the common stock. It is currently estimated that the initial public offering price per share will be between $ and $ . We have applied to list our common stock on the Nasdaq Global Market under the symbol “PSMI.”
We are an “emerging growth company” under the federal securities laws and will be subject to reduced public company reporting requirements. Investing in our common stock involves a high degree of risk. See “Risk Factors” beginning on page 9.
Neither the Securities and Exchange Commission nor any state securities commission has approved or disapproved of these securities or passed upon the adequacy or accuracy of this prospectus. Any representation to the contrary is a criminal offense.
| Per Share | Total | |||||||
| Public offering price |
$ | $ | ||||||
| Underwriting discounts and commissions |
$ | $ | ||||||
| Proceeds, before expenses, to us |
$ | $ | ||||||
| Proceeds, before expenses, to selling stockholders |
$ | $ | ||||||
To the extent that the underwriters sell more than shares of common stock, the underwriters have the option to purchase up to an additional shares from us at the initial public offering price less the underwriting discount.
The underwriters expect to deliver the shares against payment in New York, New York on , 2012.
| Deutsche Bank Securities | J.P. Morgan |
| RBC Capital Markets | Needham & Company | Oppenheimer & Co. | Pacific Crest Securities |
, 2012
Table of Contents

Table of Contents
| Page | ||||
| 1 | ||||
| 9 | ||||
| 34 | ||||
| 35 | ||||
| 35 | ||||
| 36 | ||||
| 38 | ||||
| 40 | ||||
| Management’s Discussion and Analysis of Financial Condition and Results of Operations |
42 | |||
| 69 | ||||
| 83 | ||||
| 101 | ||||
| 102 | ||||
| 106 | ||||
| 110 | ||||
| Material U.S. Federal Tax Considerations for Non-U.S. Holders |
112 | |||
| 116 | ||||
| 120 | ||||
| 120 | ||||
| 120 | ||||
| 120 | ||||
| F-1 | ||||
You should rely only on the information contained in this prospectus or in any free writing prospectus we may authorize to be delivered or made available to you. We have not, and the underwriters have not, authorized anyone to provide you with additional or different information. We are not, and the underwriters are not, making an offer to sell these securities in any jurisdiction where an offer or sale is not permitted.
No action is being taken in any jurisdiction outside the U.S. to permit a public offering of our common stock or possession or distribution of this prospectus in that jurisdiction. Persons who come into possession of this prospectus in a jurisdiction outside the U.S. are required to inform themselves about, and to observe any restrictions as to, this offering and the distribution of this prospectus applicable to that jurisdiction.
Table of Contents
This summary highlights information contained elsewhere in this prospectus. You should read the following summary together with the more detailed information appearing in this prospectus, including our consolidated financial statements and related notes, and our risk factors beginning on page 9, before deciding whether to purchase shares of our common stock. Unless the context otherwise requires, we use the terms “Peregrine,” the “company,” “we,” “us,” and “our” in this prospectus to refer to Peregrine Semiconductor Corporation and its subsidiaries.
Overview
We are a fabless provider of high performance radio frequency integrated circuits, or RFICs. Our solutions leverage our proprietary UltraCMOS® technology, which enables the design, manufacture, and integration of multiple radio frequency, or RF, mixed signal, and digital functions on a single chip. We believe our products deliver an industry leading combination of performance and monolithic integration. Our solutions target a broad range of applications in the aerospace and defense, broadband, industrial, mobile wireless device, test and measurement equipment, and wireless infrastructure markets. We have shipped over one billion RFICs based on our UltraCMOS technology since January 1, 2006.
Our UltraCMOS technology combines the ability to achieve the high levels of performance of traditional specialty processes, with the fundamental benefits of standard complementary metal oxide semiconductor, or CMOS, the most widely used semiconductor process technology. UltraCMOS technology utilizes a synthetic sapphire substrate, a near-perfect electrical insulator, providing greatly reduced unwanted electrical interaction between the RFIC and the substrate (referred to as parasitic capacitance), which enables high signal isolation and excellent signal fidelity with low distortion over a broad frequency range (referred to as broadband linearity). These two technical attributes result in RF devices with excellent high-frequency performance and power handling performance, and reduced crosstalk between frequencies. In addition, increased broadband linearity provides for faster data throughput and greater subscriber capacity over a wireless network, resulting in enhanced network efficiency. UltraCMOS technology also provides the benefits of standard CMOS, such as high levels of integration, low power consumption, reusable circuit libraries, widely available design tools and outsourced manufacturing capacity, and the ability to scale to smaller geometries. We own fundamental intellectual property, or IP, in UltraCMOS technology consisting of more than 125 U.S. and international issued and pending patents, and over 300 documented trade secrets covering basic circuit elements, RF circuit designs, manufacturing processes, and design know-how.
We leverage our extensive RF design expertise and systems knowledge to develop RFIC solutions that meet the stringent performance, integration, and reliability requirements of the rapidly evolving wireless markets. As of June 30, 2012, we offer a broad portfolio of more than 160 high performance RFICs including switches, digital attenuators, mixers / upconverters, prescalers, digitally tunable capacitors, or DTCs, and DC-DC converters, and we are currently developing power amplifiers, or PAs. During the year ended December 31, 2011, our products were sold to more than 1,500 module manufacturers, original equipment manufacturers, or OEMs, contract manufacturers, and other customers, including such companies as Ericsson AB, Flextronics International Ltd., Hitachi Metals, Ltd., Itron, Inc., Jabil Circuit Inc., LG Innotek Co., Ltd., Mini-Circuits, Inc., Motorola Solutions, Inc., Murata Manufacturing Company, Ltd., Northrop Grumman Corporation, Planet Technology Corp., Rockwell Collins, Inc., Rohde & Schwarz, Inc., SIPAT Co., Ltd., Skyworks Solutions, Inc., Sony Corporation, Source Photonics, Inc., TDK-EPC Corporation, Thales Alenia Space, and TriQuint Semiconductor, Inc. We believe our RFICs are included in products sold by many of the leading mobile handset OEMs. For the years ended December 25, 2010 and December 31, 2011, we generated net revenue of $91.1 million and $107.8 million, respectively, representing year-over-year growth of 18%. We generated net income of $3.8 million for the year ended December 25, 2010 and a net loss of $9.7 million for the year ended
1
Table of Contents
December 31, 2011. We recorded net revenue of $80.3 million and a net loss of $3.1 million for the six months ended June 30, 2012. As of June 30, 2012, we had an accumulated deficit of $231.3 million.
Industry Overview
Proliferation of wireless devices coupled with rapid advances in RF technologies have significantly enhanced wireless connectivity and revolutionized the mobile wireless, wireless infrastructure, broadband, and satellite communications markets. In addition, an array of other consumer, public safety, aerospace and defense, and industrial markets are increasingly incorporating advanced RF functionality into a wide variety of applications, resulting in increased demand for high performance RFICs in these markets. According to Frost & Sullivan, the worldwide market for RFICs across the aerospace and defense, broadband, industrial, mobile wireless device, test and measurement equipment, and wireless infrastructure industries is expected to grow from $12.2 billion in 2010 to $29.2 billion in 2015, representing a compound annual growth rate, or CAGR, of 19.1%.
The need for higher performance wireless solutions, combined with the increased demand for integrated components that reduce costs, overall power consumption, and size, has significantly increased the performance demands on the RF front-end subsystems used in wireless devices. However, the fundamental physical limitations of silicon have prevented standard CMOS solutions from meeting the high frequency and power handling requirements of high performance RF front-ends. As a result, RF front-end semiconductor manufacturers have historically utilized traditional specialty process technologies such as gallium arsenide, or GaAs, heterojunction bipolar transistor, or GaAs HBT, GaAs pseudomorphic high electron mobility transistor, or GaAs pHEMT, silicon-germanium, or SiGe, or bipolar junction transistor and CMOS, or BiCMOS. While discrete RF components produced with these processes may attain sufficient levels of performance, these technologies lack the ability to monolithically integrate multiple discrete components and digital logic, cannot leverage existing high volume standard CMOS manufacturing infrastructure, and are inherently limited in their ability to scale to smaller geometries as compared to standard CMOS.
Our Solution and Competitive Strengths
We design, develop, market, and sell high performance RFICs based on our patented UltraCMOS technology. Our UltraCMOS technology enables us to monolithically integrate multiple RF and mixed signal components and digital circuitry into high performance RFICs. Our UltraCMOS technology provides the fundamental benefits of standard CMOS, including high levels of integration, low power consumption, reusable circuit libraries, widely available design tools and outsourced manufacturing capacity, and the ability to scale to smaller geometries.
Our strengths that distinguish us from the competition include:
| • | Unique, Proprietary UltraCMOS Technology. We pioneered the development of UltraCMOS technology for production of high performance RFICs and believe we are the only high volume commercial supplier of RFICs based on silicon-on-sapphire, or SOS. |
| • | Broad, System Level Integration Capabilities. Our extensive RFIC design experience allows us to approach the challenges of RF integration at the system level, as well as the component level. We have created a proprietary design platform that includes a comprehensive portfolio of cell libraries, reference designs, design tools, and other IP that allows the design, production, and integration of highly scalable RFICs. |
| • | Broad, Highly Differentiated IP Portfolio. We have more than 125 U.S. and international issued and pending patents encompassing a broad range of technologies that include basic materials processing, fundamental “building block” circuit elements enabled by our UltraCMOS material system, and higher-level circuit designs comprised of these unique circuit elements. In addition, we have substantial materials, process, design, packaging, and testing know-how that we retain as documented trade secrets. |
2
Table of Contents
| • | Proven and Efficient Fabless Model. Our UltraCMOS manufacturing process is highly portable to third-party foundries and allows us to scale our business, utilize established and proven standard CMOS production technologies, and transition to smaller geometries and larger wafer sizes relative to specialty process technologies. |
| • | Broad Markets and Diverse Customer Base. Our products address broad end markets, including aerospace and defense, broadband, industrial, mobile wireless device, test and measurement equipment, and wireless infrastructure markets. We offer over 160 different products across eight product families, and in 2011, our products were sold to more than 1,500 customers worldwide. |
Our Strategy
Our goal is to be the market leader in large and growing markets where our UltraCMOS technology can provide a superior RFIC solution. Key elements of our strategy include:
| • | Drive Integration Across RF Applications. We intend to continue to integrate additional discrete RF components and digital circuits into comprehensive single-chip solutions. |
| • | Expand our Served Addressable Market. We intend to continue to invest in the development of future generations of our products to meet the evolving performance, form factor, and cost demands of customers in our existing markets, while also expanding our product offerings to address the requirements of new products and markets. |
| • | Deepen Relationships with Existing Customers and Expand our Customer Base. We intend to enhance our global reach and increase our penetration of key customers in our target markets and continue to develop and broaden our relationships with key players in the wireless ecosystem, including wireless network operators, leading device and equipment OEMs, and reference design partners. |
| • | Leverage our Flexible, Scalable Outsourced Manufacturing Model. We have rapidly scaled our business by leveraging the high-volume manufacturing expertise and capacity of our third-party partners involved in the supply of key raw materials, wafer foundry, and assembly and testing services. We intend to continually expand and improve our efficient and robust global supply chain utilizing a variety of business partners located around the world. |
Risks Affecting Us
Our business is subject to numerous risks, which are highlighted in the section titled “Risk Factors” immediately following this prospectus summary. These risks represent challenges to the successful implementation of our strategy and to the growth and future profitability of our business. Some of these risks are:
| • | our operating results may fluctuate significantly and our future results are difficult to predict, which may cause us to fail to meet the expectations of investors; |
| • | we have incurred significant losses and may incur losses in the future; |
| • | we may be unable to sustain our historical net revenue growth rate and if net revenue growth falls short of our expectations, we may not be able to immediately reduce our operating expenses proportionately, which could eliminate our profitability; |
| • | changes in our product mix and in our manufacturing operations utilization may adversely affect our gross margins and operating results; |
| • | we rely on a small number of customers for a significant percentage of our net revenue, and the loss of, or a reduction in, orders from these customers could result in a significant decline in our net revenue; |
| • | if we fail to develop new or enhanced products that achieve market acceptance in a cost-effective and timely manner, our operating results could be adversely affected; |
3
Table of Contents
| • | our failure to continue to keep pace with new or improved semiconductor process technologies could impair our competitive position; |
| • | we depend on outside semiconductor foundries to manufacture our products and implement our fabrication processes, and any failure to maintain sufficient foundry capacity could significantly delay our ability to ship our products, damage our relationships with module manufacturers, OEMs, distributors, and contract manufacturers, reduce our sales, and increase our expenses; |
| • | we depend on limited sources of supply for some of the key components and materials in our products, and a limited number of suppliers for wafer preparation, which makes us susceptible to shortages, price fluctuations, and quality risks that could adversely affect our operating results; |
| • | if our principal end markets fail to grow or experience declines, our net revenue may decrease; |
| • | we are currently, and expect to be in the future, party to patent lawsuits and other intellectual property rights claims that are expensive and time consuming, and, if resolved adversely, could have a significant impact on our business, financial condition, or results of operations; and |
| • | claims by others that we infringe their proprietary technology could adversely affect our business. |
For further discussion of these and other risks you should consider before making an investment in our common stock, see the section titled “Risk Factors” immediately following this prospectus summary.
Corporate Information
We were incorporated in Delaware in February 1990 and founded by Mark Burgener, Rory Moore, and Ron Reedy. Our principal executive offices are located at 9380 Carroll Park Drive, San Diego, California 92121. Our telephone number is (858) 731-9400. Our website address is www.psemi.com. Information contained on our website is not incorporated by reference into this prospectus, and you should not consider information contained on our website to be part of this prospectus or in deciding whether to purchase shares of our common stock.
“Peregrine Semiconductor Corporation,” “Peregrine Semiconductor,” “Peregrine,” “UltraCMOS,” “HaRP,” “DuNE,” “STeP,” and other trademarks or service marks of Peregrine appearing in this prospectus are the property of Peregrine. This prospectus contains additional trade names, trademarks, and service marks of ours and of other companies. We do not intend our use or display of other companies’ trade names, trademarks, or service marks to imply a relationship with, or endorsement or sponsorship of us by, these other companies.
4
Table of Contents
The Offering
| Common stock offered by us |
shares |
| Common stock offered by the selling stockholders |
159,220 shares |
| Use of proceeds |
We intend to use the net proceeds from this offering for working capital and other general corporate purposes. While we have not allocated the net proceeds of this offering to specified general corporate purposes, we may utilize such proceeds by allocating them amongst the following categories: finance our growth; develop new products; assert and defend our intellectual property rights; and fund capital expenditures. In addition, we may choose to repay our loan facility with Silicon Valley Bank or expand our current business through acquisitions of other businesses, products, or technologies. However, we do not have agreements or commitments for any specific acquisitions at this time. See “Use of Proceeds.” We will not receive any proceeds from the sale of shares of common stock by the selling stockholders. In connection with our initial public offering, eight employees are exercising options and selling a total of 159,220 shares issued upon exercise of these options. All of the options that are being exercised would otherwise expire during the 180-day lock-up period, when the holders would not be able to sell the shares, and therefore these holders are exercising these options and we are allowing them to sell these shares in our initial public offering. |
| Dividend policy |
Currently, we do not anticipate paying cash dividends, and under our loan and security agreement, we may not pay dividends without the prior written consent of Silicon Valley Bank. |
| Risk factors |
You should read the “Risk Factors” section of this prospectus for a discussion of factors that you should consider carefully before deciding to invest in shares of our common stock. |
| Proposed Nasdaq Global Market trading symbol |
PSMI |
The number of shares of our common stock to be outstanding following this offering is based on 25,229,301 shares of our common stock outstanding as of June 30, 2012, and excludes:
| • | 7,406,006 shares of common stock issuable upon the exercise of options outstanding under the Peregrine Semiconductor Corporation – 1996 Stock Plan, or 1996 Stock Plan, and the Peregrine Semiconductor Corporation – 2004 Stock Plan, or 2004 Stock Plan, as of June 30, 2012, at a weighted average exercise price of $4.48 per share; |
| • | 196,090 shares of common stock issuable upon the exercise of common and convertible preferred stock warrants outstanding as of June 30, 2012, at a weighted average exercise price of $6.86 per share; and |
5
Table of Contents
| • | 4,551,217 shares of common stock reserved for future issuance under our stock-based compensation plans, including 2,000,000 shares of common stock reserved for issuance under our 2012 Equity Incentive Plan, and 1,000,000 shares of common stock reserved for issuance under our 2012 Employee Stock Purchase Plan, subject in each case to automatic annual adjustment in accordance with the terms of the plan. |
Unless otherwise indicated, this prospectus reflects and assumes the following:
| • | the automatic conversion of all outstanding shares of our convertible preferred stock as of June 30, 2012, into 22,384,097 shares of common stock, upon the completion of this offering; |
| • | the filing of our amended and restated certificate of incorporation and the adoption of our amended and restated bylaws immediately prior to completion of this offering; |
| • | no exercise by the underwriters of their over-allotment option; and |
| • | a 1-for-7.34 reverse stock split of our outstanding capital stock prior to the completion of this offering. |
6
Table of Contents
Summary Consolidated Financial Data
The following tables set forth summary consolidated financial data. The consolidated statements of operations data for the years ended December 25, 2010 and December 31, 2011 have been derived from our audited consolidated financial statements included elsewhere in this prospectus. The consolidated statements of operations data for the six months ended June 25, 2011 and June 30, 2012, and the consolidated balance sheet data as of June 30, 2012 have been derived from our unaudited consolidated financial statements, included elsewhere in this prospectus. The unaudited financial statements include all adjustments, consisting of normal recurring accruals, which we consider necessary for a fair presentation of the financial position and the results of operations for these periods. You should read this summary consolidated financial data in conjunction with the sections titled “Selected Consolidated Financial Data” and “Management’s Discussion and Analysis of Financial Condition and Results of Operations” and our consolidated financial statements and related notes, included elsewhere in this prospectus. Our historical results are not necessarily indicative of the results to be expected for any future period.
| Fiscal Year Ended | Six Months Ended | |||||||||||||||
| December 25, 2010 |
December 31, 2011 |
June 25, 2011 |
June 30, 2012 |
|||||||||||||
| (unaudited) | ||||||||||||||||
| (in thousands, except per share amounts) | ||||||||||||||||
| Consolidated Statement of Operations Data: |
||||||||||||||||
| Net revenue |
$ | 91,071 | $ | 107,771 | $ | 45,729 | $ | 80,334 | ||||||||
| Cost of net revenue (1) |
49,520 | 70,955 | 26,720 | 52,858 | ||||||||||||
|
|
|
|
|
|
|
|
|
|||||||||
| Gross profit |
41,551 | 36,816 | 19,009 | 27,476 | ||||||||||||
|
|
|
|
|
|
|
|
|
|||||||||
| Operating expense |
||||||||||||||||
| Research and development (1) |
18,040 | 22,730 | 10,248 | 14,163 | ||||||||||||
| Selling, general and administrative (1) |
18,889 | 23,252 | 10,812 | 15,193 | ||||||||||||
|
|
|
|
|
|
|
|
|
|||||||||
| Total operating expense |
36,929 | 45,982 | 21,060 | 29,356 | ||||||||||||
|
|
|
|
|
|
|
|
|
|||||||||
| Income (loss) from operations |
4,622 | (9,166 | ) | (2,051 | ) | (1,880 | ) | |||||||||
| Interest expense |
(610 | ) | (318 | ) | (185 | ) | (1,076 | ) | ||||||||
| Other income (expense), net |
(105 | ) | (2 | ) | 66 | (38 | ) | |||||||||
|
|
|
|
|
|
|
|
|
|||||||||
| Income (loss) before income taxes |
3,907 | (9,486 | ) | (2,170 | ) | (2,994 | ) | |||||||||
| Provision for income taxes |
147 | 196 | 125 | 74 | ||||||||||||
|
|
|
|
|
|
|
|
|
|||||||||
| Net income (loss) |
3,760 | (9,682 | ) | (2,295 | ) | (3,068 | ) | |||||||||
| Net income allocable to preferred stockholders (2) |
(3,760 | ) | — | — | — | |||||||||||
|
|
|
|
|
|
|
|
|
|||||||||
| Net income (loss) attributable to common stockholders |
$ | — | $ | (9,682 | ) | $ | (2,295 | ) | $ | (3,068 | ) | |||||
|
|
|
|
|
|
|
|
|
|||||||||
| Basic and diluted net income (loss) per share attributable to common stockholders |
$ | — | $ | (3.57 | ) | $ | (0.85 | ) | $ | (1.10 | ) | |||||
|
|
|
|
|
|
|
|
|
|||||||||
| Shares used in computing basic and diluted net income (loss) per share |
2,504 | 2,715 | 2,693 | 2,790 | ||||||||||||
|
|
|
|
|
|
|
|
|
|||||||||
| Unaudited pro forma net income (loss) per share attributable to common stockholders: |
||||||||||||||||
| Basic |
$ | (0.39 | ) | $ | (0.12 | ) | ||||||||||
|
|
|
|
|
|||||||||||||
| Diluted |
$ | (0.39 | ) | $ | (0.12 | ) | ||||||||||
|
|
|
|
|
|||||||||||||
| Unaudited pro forma weighted average common shares outstanding: |
||||||||||||||||
| Basic |
25,080 | 25,157 | ||||||||||||||
|
|
|
|
|
|||||||||||||
| Diluted |
25,080 | 25,157 | ||||||||||||||
|
|
|
|
|
|||||||||||||
Footnotes on following page
7
Table of Contents
| As of June 30, 2012 | ||||||||||||
| Actual | Pro Forma | Pro Forma As Adjusted |
||||||||||
| (unaudited) | ||||||||||||
| (in thousands) |
||||||||||||
| Consolidated Balance Sheet Data: |
||||||||||||
| Cash and cash equivalents |
$ | 42,918 | $ | 42,918 | $ | |||||||
| Working capital |
15,100 | 15,100 | ||||||||||
| Total assets |
131,504 | 131,504 | ||||||||||
| Obligations under capital leases, less current portion |
114 | 114 | 114 | |||||||||
| Notes payable, less current portion |
310 | 310 | 310 | |||||||||
| Other long-term liabilities |
5,391 | 4,583 | 4,583 | |||||||||
| Convertible preferred stock |
172,907 | — | — | |||||||||
| Total stockholders’ equity (deficit) |
(143,594 | ) | 30,121 | |||||||||
The pro forma column in the consolidated balance sheet data table above reflects the automatic conversion of all outstanding shares of our convertible preferred stock into an aggregate of 22,384,097 shares of common stock and the conversion of our remaining warrants to purchase convertible preferred stock into warrants to purchase common stock and the related reclassification of $808,000 of other long-term liabilities into stockholders equity (deficit).
The pro forma as adjusted column in the consolidated balance sheet data table above reflects (1) the automatic conversion of all outstanding shares of our convertible preferred stock as of June 30, 2012 into an aggregate of 22,384,097 shares of common stock upon completion of this offering, (2) the conversion of our remaining warrants to purchase convertible preferred stock into warrants to purchase common stock and the related reclassification of $808,000 of other long-term liabilities into stockholders equity (deficit), and (3) our sale of shares of common stock in this offering at an assumed initial public offering price of $ per share, the midpoint of the initial public offering price range reflected on the cover page of this prospectus, and after deducting underwriting discounts and commissions and estimated offering expenses payable by us.
Footnotes from prior page:
| (1) | Includes stock-based compensation as follows: |
| Fiscal Year Ended | Six Months Ended | |||||||||||||||
| December 25, 2010 |
December 31, 2011 |
June 25, 2011 |
June 30, 2012 |
|||||||||||||
| (unaudited) | ||||||||||||||||
| (in thousands) | ||||||||||||||||
| Cost of net revenue |
$ | 407 | $ | 431 | $ | 208 | $ | 271 | ||||||||
| Research and development |
556 | 762 | 332 | 567 | ||||||||||||
| Selling, general and administrative |
1,554 | 1,891 | 943 | 1,126 | ||||||||||||
|
|
|
|
|
|
|
|
|
|||||||||
| Total |
$ | 2,517 | $ | 3,084 | $ | 1,483 | $ | 1,964 | ||||||||
|
|
|
|
|
|
|
|
|
|||||||||
| (2) | Please see Note 1 to our consolidated financial statements included elsewhere in this prospectus for an explanation of the method used to calculate net income allocable to preferred stockholders and net income (loss) attributable to common stockholders, including the method used to calculate the number of shares used in the computation of the per share amount. |
8
Table of Contents
Investing in our common stock involves a high degree of risk. You should consider carefully the risks and uncertainties described below, together with all of the other information in this prospectus, including our consolidated financial statements and related notes, before deciding whether to purchase shares of our common stock. If any of the following risks is realized, our business, financial condition, results of operations, and prospects could be materially and adversely affected. In that event, the price of our common stock could decline and you could lose part or all of your investment.
Risks Related to Our Business and Industry
Our operating results may fluctuate significantly and our future results are difficult to predict, which may cause us to fail to meet the expectations of investors.
We operate in a highly dynamic industry and our future results could be subject to significant fluctuations, particularly on a quarterly basis. Our quarterly net revenue and operating results have fluctuated significantly in the past and may continue to vary from quarter-to-quarter due to a number of factors, many of which are not within our control. As a result, comparing our operating results on a period-to-period basis may not be meaningful. A significant percentage of our net revenue in each quarter is dependent on sales that are booked and shipped during that quarter, typically attributable to a large number of orders placed through our distributors for diverse end users and markets. As a result, accurately forecasting our operating results, including our total net revenue and gross margins, in any quarter is difficult. For example, it is difficult for us to forecast the demand for our products, in part because of the complex supply chain between us and the end users of our products. We have limited visibility into future module manufacturer, OEM, distributor, and contract manufacturer demand and the product mix that they will require, which could adversely affect our net revenue forecasts and operating margins.
In addition, our failure to accurately forecast demand can lead to product shortages that can impede production by the module manufacturers and OEMs, and harm our relationships with them and the distributors of our products. Conversely, our failure to forecast declining demand or shifts in product mix can result in excess or obsolete inventory. The rapid pace of innovation in our industry could also render significant portions of our inventory obsolete. Excess or obsolete inventory levels could result in unexpected expenses or increases in our reserves that could adversely affect our business, operating results, and financial condition. In contrast, if we were to underestimate demand or if sufficient manufacturing capacity were unavailable, we could forego net revenue opportunities, potentially lose market share, and damage our relationships with parties that use or distribute our products.
Additional factors that can contribute to fluctuations in our operating results include:
| • | the rescheduling, increase, reduction, or cancellation of significant orders from module manufacturers, OEMs, distributors, or contract manufacturers; |
| • | our ability to develop, introduce, and ship in a timely manner new products and product enhancements that meet the requirements of module manufacturers, OEMs, or end users of our products, including performance, functionality, reliability, form factor, and cost requirements; |
| • | the rate at which module manufacturers, OEMs, and end users adopt our technologies in our target end markets; |
| • | the timing and success of the introduction of new products and technologies by us and our competitors, and the acceptance of our new products by module manufacturers, OEMs, and end users; |
| • | our gain or loss of a key module manufacturer, OEM, distributor, or contract manufacturer; |
| • | the availability, cost, and quality of materials and components that we purchase from third-party foundries and any problems or delays in the fabrication, wafer preparation, assembly, testing, or delivery of our products; |
9
Table of Contents
| • | fluctuations in manufacturing yields associated with new product introductions or changes in process technologies; |
| • | the quality of our products and any remediation costs, including costs associated with the return of previously sold products due to manufacturing defects; and |
| • | general economic conditions in our domestic and foreign markets. |
Due to these and other factors, quarter-to-quarter comparisons of our historical operating results should not be relied upon as accurate indicators of our future performance.
We have incurred significant losses and may incur losses in the future.
As of June 30, 2012, we had an accumulated deficit of $231.3 million. Although we achieved profitability on a quarterly basis in 2010, and our net income for the year ended December 25, 2010 was $3.8 million, we incurred net losses of $9.7 million for the year ended December 31, 2011 and $3.1 million for the six months ended June 30, 2012, and we expect to continue to make significant expenditures related to the development of our business. These include expenditures to hire additional personnel related to the sales, marketing, and development of our products, and to maintain and expand our research and development facilities. We may not have sufficient net revenue growth to offset increased expenses or to achieve or maintain profitability in future periods.
We may be unable to sustain our historical net revenue growth rate and if net revenue growth falls short of our expectations, we may not be able to immediately reduce our operating expenses proportionately, which could eliminate our profitability.
Our net revenue has grown rapidly in recent years. Our net revenue grew from $38.2 million in 2006 to $53.4 million in 2007, and to $68.4 million in 2008. In 2009, our net revenue continued to grow to $70.5 million, but at a less rapid pace than the year prior. Over our history, we have experienced periods of relatively flat period-over-period growth, as well as periods of more rapid growth. From 2007 through 2011, our annual net revenue has increased at a CAGR of 19%. Our net revenue in the year ended December 31, 2011 increased by 18% over the corresponding period in 2010. We believe that in planning our growth, it is prudent to take into account the cyclical nature of some of the end markets that we serve, as well as the longer term historical patterns in the development of our business. Even if our net revenue increases to higher levels, we believe that a decline in the rate of growth of our net revenue is, to some extent, inevitable. Although we base our planned operating expenses in large part on our expectations of future net revenue, a substantial portion of our expenses is relatively fixed, and cannot immediately be eliminated if our net revenue falls short of our expectations. Thus, if the rate in growth of our net revenue in any quarter is substantially less than we had anticipated, we may be unable to reduce our operating expenses commensurately in that quarter, which could negatively affect our results of operations for that quarter. For instance, for the quarter ended March 26, 2011, our net revenue declined to $21.2 million from $23.4 million for the quarter ended December 25, 2010. In addition, we experienced net losses of $1.0 million, $1.3 million, $4.5 million, $2.7 million, and $3.0 million for the quarters ended March 26, 2011, June 25, 2011, September 24, 2011, December 31, 2011, and March 31, 2012, respectively, compared to a net income of $1.2 million for the quarter ended December 25, 2010.
Changes in our product mix and in our manufacturing operations utilization may adversely affect our gross margins and operating results.
Our products have a wide range of gross margins, and our overall gross margin in any period is highly dependent on the percentage of our net revenue attributable to higher or lower margin products in that period. The product mix that module manufacturers, OEMs, distributors, and contract manufacturers will require varies greatly from period-to-period and is difficult for us to predict, and a shift in product mix in any given period to a greater percentage of lower margin products would adversely affect our gross margins and operating results. For
10
Table of Contents
example, for the three month periods ended December 25, 2010, March 26, 2011, June 25, 2011, September 24, 2011, December 31, 2011, March 31, 2012, and June 30, 2012, our gross margins were 48%, 43%, 40%, 27%, 30%, 31%, and 37%, respectively. As a result of changes in product mix, our operating results will vary from period-to-period and could be adversely affected.
In addition, we are generally faced with a decline in the utilization of our manufacturing operations during periods of reduced demand, as a certain portion of our manufacturing costs are relatively fixed. During periods of reduced demand, these overhead costs are allocated over a smaller number of units, which will result in increased product cost. Reduced market demand in the future may adversely affect our utilization and consequently result in lower gross margins for our products. Fluctuations in our gross margins for our products could have a material negative impact on our business, financial condition and results of operations.
We rely on a small number of customers for a significant percentage of our net revenue, and the loss of, or a reduction in, orders from these customers could result in a significant decline in net revenue.
Although we have shipped our products to a large number of customers, we have historically depended on a small number of customers for a significant percentage of our annual net revenue. The composition of this group can change from year to year. Net revenue derived from our three largest direct customers as a percentage of our annual net revenue was 59% and 68% for the years ended December 25, 2010 and December 31, 2011, respectively, and 60% and 82% for the six months ended June 25, 2011 and June 30, 2012, respectively. Included in these percentages for our three largest direct customers are sales to two of our distributors. Based on records from our distributors of shipments to their customers, net revenue derived from our three largest end customers as a percentage of annual net revenue was 39% and 49% for the years ended December 25, 2010 and December 31, 2011, respectively, and 38% and 67% for the six months ended June 25, 2011 and June 30, 2012, respectively. Sales through our distributor Macnica to module manufacturer Murata represented 39% of our net revenue for the year ended December 31, 2011 and 61% of our net revenue for the six months ended June 30, 2012 and we believe substantially all of the products sold by Murata are to a limited number of mobile handset manufacturers. Any decrease in mobile handset sales by such manufacturers could have a material negative impact on our business, financial condition and results of operations. While the composition of our top customers varies from year to year, we expect that shipments to a limited number of customers will continue to account for a significant percentage of our net revenue for the foreseeable future.
With the exception of a supply and prepayment agreement with Murata, substantially all of our business, including that from our largest customers, is conducted through standard purchase orders, which provide no contractual guarantees beyond the purchase order itself. It is possible that any of our major customers could terminate its purchasing relationship with us or significantly reduce or delay the amount of our products that it orders, purchase products from our competitors, or develop its own products internally. The loss of, or a reduction in, orders from any major customer could cause a decline in net revenue and adversely affect our results of operations. To date, we have not experienced significant risk with respect to customer credit risk, but this could change as we expand our business in size and into new geographies in the future.
If we fail to develop new or enhanced products that achieve market acceptance in a cost-effective and timely manner, our operating results could be adversely affected.
The markets for our products are characterized by frequent new product introductions and changes in product and process technologies. The future success of our business will depend on our ability to develop new products for existing and new markets, introduce these products in a cost-effective and timely manner, have our products designed into the products of leading module manufacturers and OEMs, and have our products gain broad adoption by end users. The development of new high performance RFICs is highly complex, and from time-to-time we may experience delays in completing the development and introduction of new products or fail to efficiently manufacture such products in the early production phase. Our ability to successfully develop, introduce, and deliver new high performance RFICs will depend on various factors, including our ability to:
| • | complete and introduce new product designs; |
| • | achieve design wins with module manufacturers and OEMs, and broad adoption by end users; |
11
Table of Contents
| • | meet the time pressures associated with the demands of the module manufacturers and OEMs to which we sell through our distributors and contract manufacturers; |
| • | accurately understand market requirements; |
| • | attract and retain skilled engineering, operations, and manufacturing personnel; |
| • | obtain adequate supplies of materials and components that meet our quality requirements; and |
| • | achieve adequate manufacturing yields and maintain sufficient supply through our third-party foundry relationships. |
We believe that our UltraCMOS platform gives us a competitive advantage because it enables us to develop new products that integrate RF, analog, digital, and other functions on a single chip. However, if demand for integrated components in the future is smaller than anticipated, our competitive advantage would be diminished and our business could be adversely affected.
Our failure to continue to keep pace with new or improved semiconductor process technologies could impair our competitive position.
The semiconductor industry has historically been characterized by advancing technology through smaller geometries and larger wafer sizes, as well as through other proprietary and non-proprietary techniques. Although we have certain proprietary semiconductor processes, such as the application of silicon on a sapphire substrate in our UltraCMOS process, we constantly seek to develop new and improved techniques and methods internally and with the assistance of our suppliers. For example, we are currently working with numerous suppliers with respect to our next generation technologies. There can be no assurance that our efforts with these suppliers will ultimately be successful or result in next generation technologies that enable us to cost effectively produce our products in the future. For example, higher costs associated with the introduction and start up of new technologies could negatively impact our gross margins if the selling prices for our products based on new technologies do not sufficiently offset our higher costs for these technologies. For instance, we implemented new manufacturing processes in 2011 which resulted in low yields of certain wafers. As such, we recorded reductions to the carrying value of inventory as a result of a lower of cost or market valuation. Gross margins declined in our third and fourth quarter of fiscal 2011 as a result. Our future success depends in part upon our ability to continue to improve our semiconductor process technologies in order to adapt to emerging module manufacturer and OEM requirements and to competitive market conditions. If we fail for any reason to remain abreast of new and improved semiconductor process technologies as they emerge, we may lose market share which could adversely affect our operating results.
Standard CMOS is the semiconductor industry’s most broadly used manufacturing process technology and the semiconductor industry has committed significantly greater resources to standard CMOS, silicon on insulator, or SOI, and GaAs process technologies, as compared to our technology. Therefore, with the resources available to competitors using those technologies, they may more quickly adapt to emerging module manufacturer and OEM requirements and competitive market conditions than we can.
If the manufacturing yields that we realize in our production of integrated circuits, or ICs, were to decrease, our operating results could be adversely affected.
The manufacture and assembly of ICs, particularly high performance RFICs that we supply, is a highly complex process that is sensitive to a wide variety of factors, including the level of contaminants in the manufacturing environment, impurities in the materials used, and the performance of the fabrication equipment. As is typical in the semiconductor industry, we have from time to time experienced lower than anticipated manufacturing yields. In particular, we have in the past and may experience in the future lower manufacturing yields with respect to the introduction of new products, migration to smaller geometries, or the installation and start up of new process technologies. Our operating results could be adversely affected if we were unable to maintain current manufacturing yields through our third-party foundry relationships. For example, for the quarter ended September 25, 2011 we experienced lower than anticipated yields on certain wafers due to the implementation of new manufacturing processes and recorded an inventory write-down of $3.1 million as a result of a lower of cost or market valuation.
12
Table of Contents
We depend on LAPIS Semiconductor Co., Ltd., MagnaChip Semiconductor Ltd., Silanna Semiconductor Pty Ltd., and other outside semiconductor foundries to manufacture our products and implement our fabrication processes, and any failure to maintain sufficient foundry capacity could significantly delay our ability to ship our products, damage our relationships with module manufacturers, OEMs, distributors, and contract manufacturers, reduce our sales, and increase our expenses.
We do not own or operate any fabrication facilities and instead outsource fabrication of our products to independent foundries. Prior to June 2008, we owned and operated a manufacturing facility in Sydney, Australia. In June 2008, after achieving volume outsourced production of our UltraCMOS products, we sold our ownership interest in this manufacturing operation to Silanna Foundries Pty. Ltd. and entered into an outsourced manufacturing arrangement with this company. Silanna Foundries and its wafer manufacturing subsidiary are referred to in this prospectus as Silanna Semiconductor. LAPIS Semiconductor, MagnaChip Semiconductor, and Silanna Semiconductor manufactured 100% of the wafers used in our products for the years ended December 25, 2010 and December 31, 2011, and the six months ended June 30, 2012.
We place our purchase orders with foundries based on sales forecasts for our products. If any third-party foundry does not provide competitive pricing or is not able to meet our required capacity for any reason, or if our business relationship with LAPIS Semiconductor, MagnaChip Semiconductor, Silanna Semiconductor, or any other semiconductor foundry deteriorates, we may not be able to obtain the required capacity and would have to seek alternative foundries, which may not be available on commercially reasonable terms, or at all. The process for qualifying a new foundry is time consuming, difficult, and may not be successful, particularly if we cannot promptly integrate our proprietary process technology with the process used by the new foundry. Using a foundry with which we have no established relationship could expose us to potentially unfavorable pricing, unsatisfactory quality, or insufficient capacity allocation.
We face a number of other significant risks associated with outsourcing fabrication, including:
| • | limited control over delivery schedules, quality assurance and control, and production costs; |
| • | discretion of foundries to reduce deliveries to us on short notice, allocate capacity to other customers that may be larger or have long-term customer or preferential arrangements with foundries we use; |
| • | inability of foundries to adequately allocate additional capacity to us based upon an increase in demand for our products; |
| • | unavailability of, or potential delays in accessing, key process technologies; |
| • | damage to equipment and facilities, power outages, equipment, or materials shortages that could limit manufacturing yields and capacity at the foundries; |
| • | potential unauthorized disclosure or misappropriation of IP, including use of our technology by the foundries to make products for our competitors; |
| • | financial difficulties and insolvency of foundries; |
| • | acquisition of foundries by third parties; and |
| • | lack of long-term manufacturing commitments by the foundries. |
Any of the foregoing risks could delay shipment of our products, result in higher expenses and reduced net revenue, damage our relationships with module manufacturers, OEMs, distributors, and contract manufacturers, and otherwise adversely affect our operating results.
We depend on limited sources of supply for some of the key components and materials in our products, and a limited number of suppliers for wafer preparation, which makes us susceptible to shortages, price fluctuations, and quality risks that could adversely affect our operating results.
We purchase a number of key components and materials used in our products from limited source suppliers. For example, we currently obtain synthetic sapphire substrates from three third-party suppliers, including Kyocera Corporation, Rubicon Technology, Inc., and Maintech Japan Corporation. Our current consumption
13
Table of Contents
levels of synthetic sapphire represent less than approximately two percent of worldwide synthetic sapphire production. We believe that our suppliers currently have manufacturing capacity adequate to meet our foreseeable requirements. However, if competition for capacity were to increase, our suppliers could increase the lead times required to deliver materials to us or could seek to increase the prices of materials we purchase from them. For example, competition for synthetic sapphire wafer capacity has increased significantly in recent years due to the use of sapphire as a substrate for blue and white light-emitting diodes, or LEDs. This increasing demand for synthetic sapphire for use in LEDs has resulted in substantial increases in the cost of sapphire substrates and could adversely impact our manufacturing costs as well as the availability of sapphire substrate supply. In addition, we and our outside foundries use a limited number of suppliers for wafer preparation. For example, we currently obtain bonded SOS substrate from Soitec USA, Inc.
If our limited source suppliers and suppliers for wafer preparation were to experience difficulties that affected their manufacturing yields or the quality of the materials they supply to us, our cost of net revenue could be adversely affected. Longer lead times and quality problems experienced by our suppliers could also prevent us from fulfilling the demands of the module manufacturers, OEMs, distributors, and contract manufacturers for our products on a timely basis, and thus adversely affect our net revenue. The ability of our suppliers to meet our requirements could be impaired or interrupted by factors beyond their control, such as earthquakes or other natural phenomena, labor strikes or shortages, or political unrest. In the event one of our suppliers is unable to deliver products to us or is unwilling to sell materials or components to us, our operations may be adversely affected. We might also experience difficulty identifying alternative sources of supply for the materials or components used in our products or products we obtain through outsourcing. We could experience delays if we were required to test and evaluate products of potential alternative suppliers or products we obtain through outsourcing. Furthermore, financial or other difficulties faced by our suppliers, or significant changes in demand for the components or materials they use in the products they supply to us, could limit the availability of those products, components, or materials to us. Any of these occurrences could negatively impact our operating results and adversely affect our business.
If our principal end markets fail to grow or experience declines, our net revenue may decrease.
Although our products are used in a variety of end markets, our future growth depends to a significant extent on the success of our principal end markets. The rate at which these markets will grow is difficult to predict. These markets may fail to grow or decline for many reasons, including insufficient consumer demand, decreased demand for bandwidth, lack of access to capital, changes in the U.S. defense budget and procurement processes, and changes in regulatory environments. If demand for high performance RFICs or devices in which our products are incorporated declines, fails to grow, or grows more slowly than we anticipate, purchases of our products may be reduced, and our net revenue could decline.
In particular, a significant portion of our products are incorporated into mobile wireless devices. Accordingly, demand for our products is dependent on the ability of mobile wireless device manufacturers to successfully sell wireless devices that incorporate our products. We cannot be certain whether these manufacturers will be able to create or sustain demand for their wireless devices that contain our products or how long they will remain competitive in their business, if at all. The success of these mobile wireless device manufacturers and the demand for their wireless devices can be affected by a number of factors, including:
| • | market acceptance of their mobile wireless devices that contain our products; |
| • | the impact of slowdowns or declines in sales of mobile wireless devices in general; |
| • | their ability to design products with features that meet the evolving tastes and preferences of consumers; |
| • | fluctuations in foreign currency; |
| • | relationships with wireless carriers in particular markets; |
14
Table of Contents
| • | the implementation of, or changes to, mobile wireless device certification standards and programs; |
| • | technological advancements in the functionality and capabilities of mobile wireless devices; |
| • | the imposition of restrictions, tariffs, duties, or regulations by foreign governments on mobile wireless device manufacturers; |
| • | failure to comply with governmental restrictions or regulations; |
| • | cost and availability of components for their products; and |
| • | inventory levels in the sales channels into which mobile wireless device manufacturers sell their products. |
Our future net revenue growth depends on demand for bandwidth for many of our relevant markets, including mobile wireless device, wireless infrastructure, and aerospace and defense. However, such bandwidth demands are subject to market changes and the evolving requirements of end users and therefore may not occur.
If we fail to penetrate key players in our existing markets or fail to penetrate new markets, our net revenue, net revenue growth rate, if any, and financial condition could be materially and adversely affected.
We currently sell most of our products into the aerospace and defense, broadband, industrial, mobile wireless device, test and measurement equipment, and wireless infrastructure markets. Our net revenue growth, if any, will depend in part on our ability to penetrate key customers in these target markets and to continue to develop and broaden our relationships with key players in the wireless ecosystem including wireless network operators, leading device and equipment OEMs, and reference design partners. Each of the markets we serve presents distinct and substantial risks. If any of these markets does not develop as we currently anticipate or if we are unable to penetrate them successfully, it could materially and adversely affect our net revenue and net revenue growth rate, if any.
In addition, the markets for certain of our products, such as DC-DC converters and DTCs, are new, still developing and relatively small. We have sold or provided samples of limited quantities of our products into these markets and cannot predict how or to what extent demand for our products in these markets will develop. If we fail to penetrate these or other new markets upon which we target our resources, our net revenue and net revenue growth rate, if any, likely will decrease over time and our financial condition could suffer.
If module manufacturers or OEMs do not design our RFICs into their product offerings, or if such module manufacturers’ or OEMs’ product offerings are not commercially successful, we would have difficulty selling our RFICs and our business could be adversely affected.
Our products are sold directly and through our distributors and contract manufacturers to module manufacturers who include our RFICs in the products they supply to OEMs, and to OEMs who include our RFICs in their products. Our RFICs are generally incorporated into the module manufacturers’ and OEMs’ products at the design stage. As a result, we rely on module manufacturers and OEMs to design our RFICs into the products they sell. Without these design wins, our business would be materially and adversely affected. We often incur significant expenditures on the development of a new RFIC without any assurance that a module manufacturer or OEM will select our RFIC for design into its own product. Once a module manufacturer or OEM designs a competitor’s semiconductor into its product offering, it becomes significantly more difficult for us to sell our RFICs directly or indirectly to that module manufacturer or OEM because changing suppliers involves significant cost, time, effort, and risk for the module manufacturer or OEM. Furthermore, even if a module manufacturer or OEM designs one of our RFICs into its product offering, we cannot be assured that its product will be commercially successful and that we will receive any net revenue from that product. If the module manufacturers’ or OEMs’ products incorporating our RFICs fail to meet the demands of their customers or otherwise fail to achieve market acceptance, we will be unable to achieve broad adoption of our UltraCMOS technology. As a result, our net revenue and business would be adversely affected.
15
Table of Contents
We design custom RFICs to meet specific requirements of the module manufacturers and OEMs. The amount and timing of net revenue from such products can cause fluctuations in our quarterly operating results.
The design and sales cycle for our custom RFICs, from initial contact by our sales force to the commencement of shipments of those products in commercial quantities, is lengthy and can range from six months to as long as two years or more. As part of this process, our sales and application engineers work closely with either the module manufacturer or OEM to analyze their respective product requirements and establish a technical specification for the custom RFIC. We then evaluate test wafers and components, and establish assembly and test procedures before manufacturing in commercial quantities can begin. The length of this cycle is influenced by many factors, including the difficulty of the technical specification, the novelty and complexity of the design and the module manufacturers’ or OEMs’ procurement processes. Module manufacturers and OEMs typically do not commit to purchase significant quantities of a custom RFIC until they are ready to commence volume shipment of their own products, and volume purchases of our custom RFICs by module manufacturers or OEMs generally do not occur until they have successfully introduced the modules or products incorporating our RFICs. Our receipt of substantial net revenue from sales of a custom RFIC depends on the module manufacturer’s or OEM’s commercial success in manufacturing and selling its product incorporating our custom RFIC. As a result, a significant period may elapse between our investment of time and resources in a custom RFIC and our receipt of substantial net revenue from sales of that product.
The length of this process increases the risk that such module manufacturer or OEM will decide to cancel or change its product plans. Such a cancellation or change in plans by the module manufacturer or OEM could cause us to lose anticipated sales. In addition, our financial condition and results of operations would be adversely affected if a significant module manufacturer or OEM curtails, reduces, or delays orders during our sales cycle, chooses not to release equipment that contains our custom RFICs, or are themselves not successful in the sale and marketing of their products that incorporate our custom RFICs. Additionally, a module manufacturer or OEM occasionally requests that we create custom RFICs and they agree to purchase such products only if we provide periods of exclusivity during which we will provide those custom RFICs only to that customer. These exclusivity periods restrict our ability to generate sales of these products with other customers and may cause us to lose significant sales to other module manufacturers and OEMs. Finally, if we fail to achieve initial design wins in the module manufacturer’s or OEM’s qualification process, we may lose the opportunity for significant sales to that module manufacturer or OEM for a lengthy period of time because the module manufacturer or OEM may be unlikely to change its source for those products in the future due to the significant costs associated with qualifying a new supplier and potentially redesigning its product.
The average selling prices of RFICs in our markets have historically decreased over time and will likely do so in the future, which could adversely impact our net revenue and gross profits.
Average selling prices of RFICs in the markets we serve have historically decreased over time and we expect such declines to continue to occur. Our gross profits and financial results will suffer if we are unable to offset reductions in our average selling prices by reducing our costs, developing new or enhanced RFICs on a timely basis with higher selling prices or gross profits, or increasing our sales volumes. Additionally, because we do not operate our own manufacturing, assembly, or testing facilities, we may not be able to reduce our costs as rapidly as companies that operate their own facilities, and our costs may even increase, which could also reduce our margins. In the past, we have reduced the prices of our RFICs in anticipation of future competitive pricing pressures, new product introductions by us or our competitors, and other factors. We expect that we will have to continue to do so in the future.
Our financial results are exposed to the cyclicality of the semiconductor industry, and as a result, we may experience reduced net revenue or operating income during any future semiconductor industry downturn.
The semiconductor industry is highly cyclical and has historically experienced significant fluctuations in demand, resulting in product overcapacity, high inventory levels, and accelerated erosion of average selling prices. These conditions have sometimes lasted for extended periods of time. Downturns in our target markets
16
Table of Contents
have in the past contributed to weak demand for semiconductor products. We experienced slower growth during periods of weak demand in the past, and our operating results may be adversely impacted by any downturns in the future. Future downturns in the semiconductor industry could adversely impact our net revenue and adversely affect our business, financial condition, and results of operations.
The segment of the semiconductor industry in which we participate is intensely competitive, and our inability to compete effectively could adversely affect our business.
The markets for our products are extremely competitive, and are characterized by rapid technological advances, frequent new product introductions, evolving industry standards, price erosion, and the continuously evolving requirements of module manufacturers and OEMs. This competition could result in increased pricing pressure, reduced profit margins, increased sales and marketing expenses, and failure to increase, or the loss of, market share, any of which could adversely affect our business. We compete primarily with other suppliers of high performance RFICs. We currently compete in the mobile wireless device and wireless infrastructure markets with Avago Technologies Limited, Hittite Microwave Corporation, M/A-COM Technology Solutions Inc., NEC Corporation, Renesas Electronics Corporation, RF Micro Devices, Inc., Skyworks, Sony Corporation, Texas Instruments Incorporated, Toshiba Corporation, TriQuint Semiconductor, Inc., and others. In the broadband, test and measurement equipment, and industrial markets, we principally compete with Hittite, M/A-COM, Renesas, Skyworks, and others. Our principal competitors in the aerospace and defense markets include Analog Devices, Inc., Hittite, Intersil Corporation, M/A-COM, and others. We expect increased competition from other established and emerging companies if our market continues to develop and expand. For example, current or potential competitors have established or may establish financial and strategic relationships with each other or with existing or potential customers or other third parties to increase the ability of their products to address the needs of our prospective customers. Accordingly, it is possible that new competitors or alliances among competitors could emerge and rapidly acquire significant market share, which would adversely affect our business. In addition, a competitor could acquire a partner to which we have licensed certain rights to sell products using our technology. There can be no assurance that we will be able to compete successfully against current or potential competitors, or that competition will not have a material adverse effect on our business, financial condition, and results of operations.
In addition, we may face competition because of the potential risks customers associate with purchasing products from sole sources. Because our products are manufactured using a proprietary technology, customers may be reluctant to purchase our products because they may view us as a sole source supplier for certain of their component parts. Customers generally prefer to incorporate components into their products that can be sourced from multiple suppliers.
We rely substantially on distributors for the sale of our products, and if we fail to retain or find additional distributors, or if these parties fail to perform as expected, it could reduce our future net revenue.
A significant portion of our net revenue is derived from a limited number of distributors, in particular, Macnica and Richardson. Our distributor sales to Macnica are primarily flow-through sales to Murata, since the vast majority of the sales of our products by Macnica are to Murata. For the year ended December 31, 2011, approximately 48% and 16% of our net revenue was derived from Macnica and Richardson, respectively, and for the six months ended June 30, 2012, Macnica and Richardson accounted for 66% and 14% of our net revenue, respectively. We anticipate that we will continue to be dependent upon a limited number of distributors, including a limited number of end customers purchasing from Macnica, for a significant portion of our net revenue in the foreseeable future. The portion of our net revenue attributable to certain distributors may also fluctuate in the future since we are unable to predict the extent to which these distributors will be successful in marketing and selling our products. Furthermore, termination of a relationship with a major distributor, either by us or by the distributor, could result in a temporary or permanent loss of net revenue. We may not be successful in finding suitable alternative distributors on satisfactory terms, or at all, and this could adversely affect our ability to sell in certain geographical locations or to certain end customers. Additionally, if we terminate our relationship with a major distributor, we may be obligated to repurchase unsold products, which could be difficult or impossible to sell to other end customers. Furthermore, distributors we do business with may face issues obtaining credit, which could impair their ability to make timely payments to us.
17
Table of Contents
In addition to distribution and sales activities, some of our distributors provide technical sales support to module manufacturers and OEMs. The activities of our distributors are not within our direct control. Our failure to manage our relationships with these distributors could impair the effectiveness of our sales, marketing, and support activities. A reduction in the sales efforts, technical capabilities, or financial viability of these parties, a misalignment of interest between us and them, or a termination of our relationship with our distributors could have a negative effect on our sales, financial results, and ability to support the OEMs and module manufacturers who purchase our products. We generally engage our distributors under short-term contracts, which typically may be terminated by either party upon 90 days’ notice. It generally takes approximately three months for a distributor to become educated about our products and capable of providing quality sales and technical support to the module manufacturers and OEMs. Recruiting and retaining qualified distributors and training them in our technology and product offerings requires significant time and resources. However, it may be difficult to terminate foreign distributors if they are not performing as expected. If our relationship with one of our other distributors were terminated for any reason, shipments to current and prospective module manufacturers and OEMs could be disrupted or delayed, and we could experience a diversion of substantial time and resources as we seek to identify, contract with, and train a replacement, all of which could adversely affect our operating results.
Defects and poor performance in our products could result in loss of module manufacturers and OEMs purchasing our products, decreased net revenue, unexpected expenses, and loss of market share, and we may face warranty and product liability claims arising from defective products.
Our products are complex and must meet stringent quality requirements. Products as complex as ours may contain undetected errors or defects, especially when first introduced or when new versions are released. Errors, defects, or poor performance can arise due to design flaws, defects in raw materials or components, or manufacturing difficulties, which can affect both the quality and the yield of the product. As our products become more complex, we face higher risk of undetected defects, because our testing protocols may not be able to fully test the products under all possible operating conditions. Any actual or perceived errors, defects, or poor performance in our products could result in the replacement or recall of our products, shipment delays, rejection of our products, damage to our reputation, lost net revenue, diversion of our engineering personnel from our product development efforts in order to address or remedy any defects, and increases in module manufacturer and OEM customer service and support costs, all of which could have a material adverse effect on our operations.
Furthermore, defective, inefficient, or poorly performing products may give rise to warranty and product liability claims against us that exceed any net revenue or profit we receive from the affected products. We could incur significant costs and liabilities if we are sued and if damages are awarded against us. Our agreements with the module manufacturers and OEMs who purchase our products through our distributors typically contain provisions designed to limit our exposure to potential product liability claims. However, the limitation of liability provisions contained in these agreements may still result in a significant financial exposure and may also not be effective as a result of federal, state, local, or foreign laws, or ordinances or unfavorable judicial decisions in the U.S. or other countries. In addition, even if ultimately unsuccessful, such claims against us could result in costly litigation, divert our management’s time and resources, and damage our relationships with the module manufacturers, OEMs, and distributors. Costs or payments we may make in connection with warranty and product liability claims or product recalls may adversely affect our financial condition and results of operations.
Our international sales and operations subject us to additional risks that can adversely affect our operating results.
The percentage of our net revenue attributable to customers based outside North America was 54% and 70% for the years ended December 25, 2010 and December 31, 2011, respectively, and 80% for the six months ended June 30, 2012. We expect that net revenue derived from customers outside North America will continue to account for a significant portion of our net revenue. Currently, we maintain international sales offices in Europe and Asia, and we rely on a network of third-party sales representatives and distributors to sell our products
18
Table of Contents
internationally. Moreover, we have in the past relied on, and expect to continue to rely on, suppliers, manufacturers, and subcontractors located in countries other than the U.S., including Australia, Japan and South Korea. For example, we have agreements with LAPIS Semiconductor, MagnaChip Semiconductor, and Silanna Semiconductor concerning the fabrication of certain of our semiconductor products. The LAPIS Semiconductor fabrication facility is located in Miyazaki, Japan, and the MagnaChip Semiconductor fabrication facility is located in Cheongju, South Korea. We also have an agreement with Silanna Semiconductor concerning the fabrication of certain of our semiconductor products at Silanna Semiconductor’s fabrication facility in Sydney, Australia. Accordingly, we are subject to several risks and challenges related to our international sales and operations, any of which could adversely affect our financial results. These risks and challenges include:
| • | difficulties and costs of staffing and managing international operations across different geographic areas and cultures; |
| • | compliance with a wide variety of domestic and foreign laws and regulations, including anti-bribery laws and laws relating to the import or export of semiconductor products; |
| • | legal uncertainties regarding taxes, tariffs, quotas, export controls, export licenses, and other trade barriers; |
| • | seasonal reductions in business activities; |
| • | our ability to receive timely payment and collect our accounts receivable; |
| • | political, legal, and economic instability, foreign conflicts, and the impact of regional and global infectious illnesses in the countries in which we and the module manufacturers, OEMs, distributors, contract manufacturers, suppliers, manufacturers, and subcontractors with whom we do business are located; |
| • | legal uncertainties regarding protection for contractual and intellectual property rights in some countries, which increase the risk of unauthorized and uncompensated use of our products or technologies; |
| • | fluctuations in foreign currency exchange rates and interest rates, including risks related to any interest rate swap or other hedging activities we undertake; and |
| • | fluctuations in freight rates and transportation disruptions. |
Any of these factors could adversely affect both our ability to effectively operate our foreign offices and the ability of our foreign suppliers to supply us with required materials or services. Any interruption or delay in the supply of our required components, products, materials, or services, or our inability to obtain these components, materials, products, or services from alternate sources at acceptable prices and within a reasonable amount of time, could impair our ability to meet scheduled product deliveries to module manufacturers, OEMs, distributors, and contract manufacturers and could cause them to cancel orders.
Additionally, most of our foreign sales, as well as our purchases of material from international suppliers, are denominated in U.S. dollars. An increase in the value of the U.S. dollar relative to foreign currencies could make our products more expensive for international module manufacturers, OEMs, distributors, and contract manufacturers to purchase, thus rendering the prices of our products less competitive. Conversely, a reduction in the value of the U.S. dollar relative to foreign currencies could increase our supply costs. At the present time, we do not have a foreign currency hedging policy in place.
Unfavorable economic conditions may adversely affect our net revenue, margins, and profitability.
Since 2008, the global economy has experienced significant financial turmoil and upheaval characterized by volatility and declines in prices of securities and commodities, diminished credit availability, declining consumer and business confidence, inability to access capital markets, proliferation of bankruptcies, and rising
19
Table of Contents
unemployment rates. It is not clear how long the uncertain economic conditions will continue, how quickly the economy and employment will recover, and how much adverse impact it will have on the global economy in general and, in particular, on the economies in North America, Europe, Asia, and other regions where we market and sell our products. Uncertain economic conditions may cause module manufacturers, OEMs, distributors, and contract manufacturers to reduce demand for our products, resulting from reduced demand of their customers, which would adversely affect our financial condition and results of operations.
Furthermore, consumer products that contain our RFIC products are discretionary purchases for consumers. Consumers are generally more willing to make discretionary purchases during favorable economic conditions. As a result of unfavorable economic conditions, including higher consumer debt levels and lower availability of consumer credit, consumers’ purchases of discretionary items may decline, which could adversely affect our net revenue.
If we lose key personnel or are unable to attract and retain personnel on a cost-effective basis, our business could be adversely affected.
Our performance is substantially dependent on the continued services and performance of our senior management and our highly qualified team of engineers, many of whom have numerous years of experience and specialized expertise in our business. Highly skilled RFIC design engineers, in particular, are in short supply. We expect to continue to hire additional engineering personnel in 2012 as we expand our RFIC design and system-level engineering capabilities. If we are not successful in hiring and retaining highly qualified engineers, we may not be able to extend or maintain our engineering expertise, and our future product development efforts could be adversely affected. Furthermore, the loss of members of our senior management could significantly delay or prevent the achievement of our strategic objectives, which could adversely affect our operating results.
Our future success also depends on our ability to identify, attract, hire, train, retain, and motivate highly skilled managerial, operations, sales, marketing, and customer service personnel. We have in the past maintained a rigorous, highly selective, and time-consuming hiring process. We believe that our approach to hiring has significantly contributed to our success to date. However, our highly-selective hiring process has made it more difficult for us to hire a sufficient number of qualified employees, and, as we grow, our hiring process may prevent us from hiring the personnel we need in a timely manner. Moreover, the cost of living in the San Diego area, where our corporate headquarters are located, has been an impediment to attracting new employees in the past, and we expect that this will continue to impair our ability to attract and retain employees in the future. If we fail to attract, integrate, and retain the necessary personnel, our ability to maintain and grow our business could suffer significantly.
We may not generate positive returns on our research and development investments.
Developing our products is expensive, and our investment in product development may involve a long payback cycle. In 2010 and 2011, our research and development expenses were $18.0 million, or approximately 20% of our total net revenue, and $22.7 million, or approximately 21% of our total net revenue, respectively. In the six-month period ended June 30, 2012, our research and development expenses were $14.2 million, or approximately 18% of our total net revenue. Our future plans include significant investments in research and development and related product opportunities. In addition, having the majority of research and development in the U.S. creates a cost disadvantage as compared to our competitors who may obtain significantly lower personnel and other costs by locating their research and development operations outside the U.S.
We believe that we must continue to dedicate a significant amount of resources to our research and development efforts to maintain our competitive position. However, our ability to generate positive returns on these investments may take several years, if we are able to do so at all.
20
Table of Contents
If we fail to manage future growth effectively, our product quality, operations, and financial results could be adversely impacted.
We are experiencing a period of significant growth and expansion, which will continue to require the increased efforts of our management and other resources. We will also need to expand our office and facilities space to accommodate our growth in employees and operations. As of June 30, 2012, we had 340 employees, up from 164 employees as of December 31, 2005, and we shipped over 230 million RFICs in 2011, up from 14 million RFICs in 2005. This expansion has in the past required and may continue in the future to require substantial managerial and financial resources, and our efforts in this regard may not be successful. Our current systems, procedures, offices, facilities, and controls may not be adequate to support our future operations. If we fail to adequately manage our growth, or to improve our operational, financial, and management information systems, or fail to effectively hire, train, motivate, or manage our new and future employees, the quality of our products and the management of our operations could suffer, which could adversely affect our operating results.
We may encounter difficulties in operating a newly implemented enterprise resource planning, or ERP, system, which may adversely affect our operations and financial reporting.
We implemented a new ERP system in the third quarter of fiscal 2010 as part of our ongoing efforts to improve and strengthen our operational and financial processes and our reporting systems. Any difficulties in the operation of our current ERP system could cause significant issues in the management of our business. We may fail to meet, or incur higher costs to meet, customer demand for our products, or we could be delayed in our ability to meet our financial reporting obligations as a result of ERP system errors, any of which could materially adversely affect our results of operations.
We may engage in future acquisitions or dispositions that could disrupt our business, cause dilution to our stockholders, or adversely impact our financial condition and operating results.
In the future we may acquire companies or assets or dispose of portions of our business in order to enhance our market position or strategic strengths. A portion of the net proceeds from this offering may be used for acquisition purposes. We are not currently a party to any agreements or commitments and we have no understandings with respect to any such acquisitions or dispositions. Our ability as an organization to make acquisitions is unproven. We may not be able to find suitable acquisition candidates and we may not be able to complete acquisitions or dispositions on favorable terms, if at all, even after devoting substantial resources to them. If we do complete acquisitions or dispositions, we cannot be sure that they will ultimately strengthen our competitive position or that they will not be viewed negatively by customers, financial markets, or investors. In addition, any acquisitions that we make could lead to difficulties in integrating personnel and operations from the acquired businesses and in retaining and motivating key personnel from these businesses. Acquisitions or dispositions may disrupt our ongoing operations, divert management from day-to-day responsibilities, increase our expenses, and adversely impact our operating results or financial condition. Future acquisitions may reduce our cash available for operations and other uses and could result in an increase in amortization expense related to identifiable assets acquired, potentially dilutive issuances of equity securities, or the incurrence of debt, any of which could adversely effect our financial condition and operating results.
Global or regional political and social conditions could adversely affect our operating results.
External factors such as geopolitical and social turmoil, terrorist attacks, and acts of war in those parts of the world that serve as markets for our products, such as North America, Europe, Asia, or elsewhere, could significantly adversely affect our business and operating results in ways that cannot be predicted. These uncertainties could make it difficult for the module manufacturers, OEMs, distributors, and contract manufacturers who purchase our products and for us to accurately plan future business activities. The occurrence of any of these events or circumstances could adversely affect our operating results.
21
Table of Contents
We conduct substantially all of our design, marketing, and back-end test operations at our corporate headquarters in San Diego, California, and any fire, earthquakes, or other unanticipated events affecting our corporate headquarters could adversely impact our business, results of operations, or financial condition.
We conduct substantially all of our design, marketing, and back-end test operations at our corporate headquarters in San Diego, California. Our headquarters are subject to the risk of catastrophic loss due to unanticipated events such as fires or earthquakes. This facility and the equipment that we use there would be difficult to repair or replace and could require substantial lead time to do so. Any disruption or other unanticipated events affecting our corporate headquarters, and therefore our design, marketing, and back-end test operations, as well as administrative activities, would adversely impact our business, results of operations, and financial condition.
Our global business operations could be significantly impacted by natural disasters or global epidemics, or by interruptions resulting from manmade problems such as computer viruses or terrorism.
A number of our facilities and those of our third-party fabrication facilities are located in areas with above average seismic activity. Our primary facility and headquarters are located in San Diego, California, and we have an office in Tokyo, Japan for marketing and sales. We could suffer significant business disruption due to earthquakes, and the risk of an earthquake in Southern California or the Pacific Rim region is significant due to the proximity of major earthquake fault lines. We are not currently covered by insurance against business disruption caused by earthquakes. Furthermore, if our third-party fabrication facilities operated by LAPIS Semiconductor in Miyazaki, Japan, MagnaChip Semiconductor in Cheongju, South Korea, or Silanna Semiconductor in Sydney, Australia were to experience any problems or downtime, including those caused by fire, earthquake, floods, or other natural disasters, we would be unable to meet our production targets and our business would be adversely affected. For example, although the LAPIS Semiconductor manufacturing facility was not directly impacted by the massive earthquake and tsunami that hit northeastern Japan on March 11, 2011, LAPIS Semiconductor or our other suppliers or customers located in Japan could have experienced serious production delays in the aftermath of the disaster resulting from supply disruptions, transportation difficulties in Japan, rationing of electricity, or other reasons. In addition, if any piece of equipment were to break down or experience down-time, it could cause our production lines to go down. There is no assurance that we would be able to secure replacement wafer production capacity on a timely basis or at all, or that if available, it could be obtained on favorable terms. In addition, our servers are vulnerable to computer viruses, break-ins, and similar disruptions from unauthorized tampering with our computer systems. In addition, acts of terrorism could cause disruptions in our business or the respective businesses of the module manufacturers, OEMs, distributors, and contract manufacturers, who purchase or sell our products, or the economy as a whole. To the extent that such disruptions result in delays or cancellations of orders by the module manufacturers, OEMs, distributors, or contract manufacturers or delays the deployment of our products, our business, results of operations, and financial condition could be adversely affected.
The occurrence of any of the foregoing or other natural or man-made disasters could cause damage or disruption to us, our employees, operations, distribution channels, markets, and customers, which could result in significant delays in deliveries or substantial shortages of our products and adversely affect our business, results of operations, financial condition, or prospects.
Our insurance may not cover all losses, including losses resulting from business disruption or product liability claims.
We have limited product liability, general liability, or other business insurance coverage for our operations. In addition, we do not have any business insurance coverage for our operations to cover losses that may be caused by some natural disasters. Any occurrence of uncovered loss could harm our results of operations and financial condition.
22
Table of Contents
Potential changes in our effective tax rate could harm our future operating results.
We are subject to income taxes in the U.S. and various foreign jurisdictions, and our domestic and international tax liabilities are subject to the allocation of expenses in differing jurisdictions. Our tax rate is affected by changes in the mix of earnings and losses in countries with differing statutory tax rates, research tax credits, certain non-deductible expenses including those arising from the requirement to expense stock options, and the valuation of deferred tax assets and liabilities, including our ability to utilize our net operating loss, or NOL, carryforwards. Increases in our effective tax rate could adversely impact our results of operations.
Risks Related to Our Intellectual Property
We are currently, and expect to be in the future, party to patent lawsuits and other intellectual property rights claims that are expensive and time consuming, and, if resolved adversely, could have a significant impact on our business, financial condition, or results of operations.
The semiconductor industry is characterized by frequent claims and litigation, including claims regarding patent and other intellectual property rights. We are presently involved in two related patent infringement matters that we commenced, and we expect the number of patent and other intellectual property matters, including claims that may be asserted against us, to increase.
On February 14, 2012, we filed a complaint with the U.S. International Trade Commission, or ITC, and a lawsuit in the U.S. District Court for the Central District of California, which on April 13, 2012 we moved to the U.S. District Court for the Southern District of California. Each of these actions allege the infringement of five of our patents relating to RFICs and switching technology by RF Micro Devices, Inc., or RFMD, and Motorola Mobility, Inc., or Motorola Mobility. On May 11, 2012, we also amended the ITC complaint and filed an additional lawsuit in the U.S. District Court for the Southern District of California to add HTC Corporation, or HTC, to the previous actions. The complaints filed with the ITC claim that certain of RFMD’s products and certain of Motorola Mobility’s and HTC’s smartphones infringe our patents relating to SOI design technology for RFICs and seeks, among other remedies, an exclusion order preventing the importation and sale of infringing products in the U.S. Separately, the suits we filed in the U.S. District Court allege infringement of the same patents and seeks, in addition to damages, to permanently enjoin RFMD, Motorola Mobility, and HTC from further infringement. On April 16, 2012, RFMD filed a lawsuit against us in the U.S. District Court for the Middle District of North Carolina, seeking a declaratory judgment that RFMD does not infringe the patents we have asserted in our actions against them or that these patents are invalid. The lawsuit filed by RFMD has been stayed pending the outcome of the ITC complaint.
Although the results of any litigation and claims cannot be predicted with certainty, we do not believe that the final outcome of intellectual property claims we are currently pursuing will have a material adverse effect on our business, financial condition, or results of operations. However, prosecuting and defending intellectual property claims is costly and can impose a significant burden on management and employees, we may receive unfavorable preliminary or interim rulings in the course of litigation, and there can be no assurance that favorable final outcomes will be obtained in all cases, if any. We may decide to settle any such lawsuits and disputes on terms that are unfavorable to us. Similarly, if any litigation to which we are a party is resolved adversely, we may be subject to an unfavorable judgment that may not be reversed on appeal. The terms of such a settlement or judgment may require us to license our technology to third parties, cease some or all of our operations or pay substantial amounts to a counterparty to such litigation. Our business, financial condition, or results of operations could be adversely affected as a result.
Claims by others that we infringe their proprietary technology could adversely affect our business.
In recent years there has been significant litigation involving intellectual property rights in many technology-based industries, including the semiconductor industry. Although we have not in the past been subject to claims that any of our products infringe any patents or other proprietary rights of third parties, we could be subject to such claims in the future. There can be no assurance that claims that may arise in the future
23
Table of Contents
can be amicably resolved, and it is possible that litigation could ensue. We do not know whether we would prevail in these proceedings given the complex technical issues and inherent uncertainties in intellectual property litigation.
Claims that our products, processes, or technology infringe third-party intellectual property rights, regardless of their merit or resolution, could be costly to defend or settle and could divert the efforts and attention of our management and technical personnel. If any pending or future proceedings result in an adverse outcome, we could be required to:
| • | cease the manufacture, use, or sale of the infringing products, processes, or technology; |
| • | pay substantial damages for infringement; |
| • | expend significant resources to develop non-infringing products, processes, or technology; |
| • | license technology from the third-party claiming infringement, which license may not be available on commercially reasonable terms, or at all; |
| • | cross-license our technology to a competitor to resolve an infringement claim, which could weaken our ability to compete with that competitor; or |
| • | pay substantial damages to module manufacturers, OEMs, distributors, contract manufacturers, or end users to discontinue their use of or to replace infringing technology sold to them with non-infringing technology. |
Any of the foregoing results could have a material adverse effect on our business, financial condition, and results of operations.
We could be required to incur significant costs to defend our intellectual property, which could have a negative impact on our business, financial condition, and results of operations.
We rely primarily on patent, copyright, trademark and trade secret laws, as well as nondisclosure and confidentiality agreements and other methods, to protect our proprietary information, technologies and processes, including our patent portfolio. Policing unauthorized use of our products, technologies and proprietary information is difficult and time consuming. We cannot be certain that the steps we have taken, or may take in the future, will prevent the misappropriation or unauthorized use of our proprietary information and technologies, particularly in foreign countries where the laws may not protect our proprietary intellectual property rights as fully as U.S. laws. We cannot be certain that the laws and policies of any country, including the United States, or the practices of any of the standard bodies, foreign or domestic, with respect to intellectual property enforcement or licensing or the adoption of standards, will not be changed in a way detrimental to the sale or use of our products or technology.
A substantial portion of our patents and patent applications relate to our UltraCMOS technology. We may need to litigate in the United States or elsewhere in the world to enforce our intellectual property rights, protect our trade secrets or determine the validity and scope of proprietary rights of others. As a result of any such litigation, we could lose our ability to enforce one or more patents or incur substantial unexpected operating costs. Any action we take to enforce our intellectual property rights could be costly and could absorb significant management time and attention, which, in turn, could negatively impact our operating results.
In addition, we license to certain of our foundry partners non-exclusive rights to manufacture and sell products using our technology in a particular field. In any potential dispute involving our patents or other intellectual property, our licensees could also become the target of litigation. We are bound to indemnify certain licensees under the terms of certain license agreements, and we may agree to indemnify others in the future. Our indemnification obligations could result in substantial expenses to us.
24
Table of Contents
If we are unable to protect our intellectual property rights, our competitive position could be adversely impacted, or we could be required to incur significant expenses to enforce our rights.
We depend on our ability to protect our proprietary technology. We rely on trade secret, patent, and trademark laws and confidentiality agreements with employees and third parties, all of which offer only limited protection. We had more than 125 U.S. and international patents issued or pending as of June 30, 2012 and have emphasized patents as a source of significant competitive advantage. Despite our efforts, the steps we have taken to protect our proprietary rights may not be adequate to preclude misappropriation of our proprietary information or infringement of our intellectual property rights, and our ability to police such misappropriation or infringement is uncertain, particularly in certain foreign countries in which the laws may not protect our intellectual property rights to the same extent as they do in the U.S. We have not conducted an exhaustive search of existing patent rights; however, we are not aware of any patent rights or other intellectual property held by others that could impact our ability to operate. With respect to patent rights, we do not know whether any of our pending patent applications will result in the issuance of patents or whether the examination process will require us to narrow our claims, and even if patents are issued, they may be contested, circumvented, or invalidated. Moreover, the rights granted under any issued patents may not provide us with proprietary protection or competitive advantages, and, as with any technology, competitors may be able to develop similar or superior technologies to our own now or in the future. Protecting against the unauthorized use of our products, trademarks, and other proprietary rights is expensive, difficult and, in some cases, impossible. Litigation may be necessary in the future to enforce or defend our intellectual property rights, to protect our trade secrets, or to determine the validity and scope of the proprietary rights of others. Such litigation could result in substantial costs and diversion of management resources. Many of our current and potential competitors have the ability to dedicate substantially greater resources to enforce their intellectual property rights than we do. Accordingly, despite our efforts, we may not be able to prevent third parties from infringing upon or misappropriating our intellectual property. We may use a portion of the net proceeds of this offering in the future to assert or defend our intellectual property rights.
Risks Related to Government Regulation
Our failure to comply with U.S. laws and regulations relating to the export and import of goods, technology, and software could subject us to penalties and other sanctions and restrict our ability to sell and develop our products.
We are obligated by law to comply with all U.S. laws and regulations governing the export and import of goods, technology, and services, including the International Traffic in Arms Regulations, or ITAR, the Export Administration Regulations, or EAR, regulations administered by the Department of Treasury’s Office of Foreign Assets Control, and regulations administered by the Bureau of Alcohol Tobacco Firearms and Explosives governing the importation of items on the U.S. Munitions Import List. Pursuant to these regulations, we are responsible for determining the proper licensing jurisdiction and export classification of our products, and obtaining all necessary licenses or other approvals, if required, for exports and imports of hardware, technical data, and software, or for the provision of technical assistance or other defense services to or on behalf of foreign persons. We are also required to obtain export licenses, if required, before employing or otherwise utilizing foreign persons in the performance of our contracts if the foreign person will have access to export-controlled technical data or software. The violation of any of the applicable laws and regulations could subject us to administrative, civil, and criminal penalties.
These regulations could restrict our ability to sell existing products and develop new product lines. For example, as a result of ITAR requirements, we are unable to supply certain products to China satellite companies or end users, which comprise a significant part of the overall satellite market. Changes in our products or changes in export and import regulations may create delays in the introduction of our products in international markets, prevent our customers with international operations from deploying our products throughout their global systems or, in some cases, prevent the export or import of our products to certain countries altogether. Any change in export or import regulations or related legislation, shift in approach to the enforcement or scope of existing
25
Table of Contents
regulations, or change in the countries, persons, or technologies targeted by such regulations, could result in decreased use of our products by, or our ability to export or sell our products to, existing or potential customers with international operations and decreased revenue. Additionally, failure to comply with these laws could result in sanctions by the U.S. government, including substantial monetary penalties, denial of export privileges, and debarment from government contracts.
Additionally, in September 2008, we received a Commodity Jurisdiction ruling from the U.S. Department of State that determined certain of our products sold in the aerospace and defense markets are subject to the ITAR rather than the EAR. Given this ruling, a number of past product shipments that we believed were subject to the EAR were exported without the required ITAR license. We also transferred ITAR technical data to one foreign person employee with the belief such data was subject to the EAR rather than the ITAR. We have taken steps to mitigate the impact of these violations. In December 2008, we submitted a voluntary disclosure to the U.S. Department of State to report the unlicensed exports. The U.S. Department of State encourages voluntary disclosures and generally affords parties mitigating credit under such circumstances. In addition, to reduce the likelihood of violations in the future, we have strengthened our export-related controls and procedures. For example, we implemented export classification training for employees and annual export compliance audits. As of the date of this prospectus, we have not received a response from the U.S. Department of State. Despite the steps we have taken, we could be subject to continued investigation and potential regulatory consequences related to these violations ranging from a no-action letter, government oversight of facilities and export transactions, monetary penalties, and in extreme cases, debarment from government contracting, denial of export privileges and criminal penalties.
If we fail to comply with government contracting regulations, we could suffer a loss of net revenue or incur price adjustments or other penalties.
Some of our net revenue is derived from contracts with agencies of the U.S. government and subcontracts with its prime contractors as well as contracts and grants with other governments. As a U.S. government contractor or subcontractor, we are subject to federal contracting regulations, including the Federal Acquisition Regulations, which govern the allowability of costs incurred by us in the performance of U.S. government contracts. We must comply with these regulations in order to bid successfully for government contracts. Additionally, the U.S. government is entitled after final payment on certain negotiated contracts to examine all of our cost records with respect to such contracts and to seek a downward adjustment to the price of the contract if it determines that we failed to furnish complete, accurate, and current cost or pricing data in connection with the negotiation of the price of the contract.
In connection with our U.S. and other government business, we are also subject to government review and approval of our policies, procedures, and internal controls for compliance with procurement regulations and applicable laws. In certain circumstances in which a contractor has not complied with the terms of a contract or with regulations or statutes, the contractor might be debarred or suspended from obtaining future contracts for a specified period of time, or could be subject to downward contract price adjustments, refund obligations or civil and criminal penalties. Any such suspension or debarment or other sanction could have an adverse effect on our operating results.
Our U.S. and other government contracts and subcontracts typically can be terminated by the government for its convenience. If a U.S. government contract is terminated for the convenience of the government, we may not be entitled to recover more than our costs incurred or committed, settlement expenses, and profit on work completed prior to termination.
Under some of our government subcontracts, we are required to maintain secure facilities and to obtain security clearances for personnel involved in performance of the contract, in compliance with applicable federal standards. If we were unable to comply with these requirements, or if personnel critical to our performance of these contracts were to lose their security clearances, we might be unable to perform these contracts or compete for other projects of this nature, which could adversely affect our net revenue.
26
Table of Contents
If we fail to comply with environmental regulations we could be subject to substantial fines or be required to suspend production, alter manufacturing processes, or cease operations.
We and our foundry partners are subject to a variety of international, federal, state, and local governmental regulations relating to the storage, discharge, handling, generation, disposal, and labeling of toxic or other hazardous substances used to manufacture our products. If we and our foundry partners fail to comply with these regulations, substantial fines could be imposed on us, and we could be required to suspend production, alter manufacturing processes, or cease operations, any of which could have a negative effect on our sales, income, and business operations. Failure to comply with environmental regulations could subject us to civil or criminal sanctions and property damage or personal injury claims. Furthermore, environmental laws and regulations could become more stringent over time, imposing even greater compliance costs and increasing risks and penalties associated with violations, which could seriously harm our financial condition and results of operations.
If we fail to comply with anti-bribery laws, including the U.S. Foreign Corrupt Practices Act, or FCPA, we could be subject to civil and/or criminal penalties.
As a result of our international operations we are subject to anti-bribery laws, including the FCPA, which prohibits companies from making improper payments to foreign officials for the purpose of obtaining or keeping business. If we fail to comply with these laws, the U.S. Department of Justice, the Securities and Exchange Commission, or SEC, or other U.S. or foreign governmental authorities could seek civil and/or criminal sanctions, including monetary fines and penalties against us or our employees, as well as additional changes to our business practices and compliance programs, which could have a material adverse effect on our business, results of operations, or financial condition.
Risks Related to this Offering and Ownership of Our Common Stock
The market price of our common stock may be volatile, which could result in substantial losses for investors purchasing shares in this offering.
Prior to this offering, there has not been a public market for our common stock, and an active market for our common stock may not develop or be sustained after this offering. The market price of our common stock after this offering may vary from its initial public offering price. Fluctuations in market price and volume are particularly common among securities of technology companies. As a result, you may be unable to sell your shares of common stock at or above the initial offering price. The market price of our common stock may fluctuate significantly in response to the following factors, among others, some of which are beyond our control:
| • | general market conditions; |
| • | domestic and international economic factors unrelated to our performance; |
| • | actual or anticipated fluctuations in our quarterly operating results; |
| • | changes in or failure to meet publicly disclosed expectations as to our future financial performance; |
| • | changes in securities analysts’ estimates of our financial performance or lack of research and reports by industry analysts; |
| • | changes in market valuations or earnings of similar companies; |
| • | announcements by us or our competitors of significant products, contracts, acquisitions, or strategic partnerships; |
| • | developments or disputes concerning patents or proprietary rights, including increases or decreases in litigation expenses associated with intellectual property lawsuits we may initiate, or in which we may be named as defendants; |
| • | failure to complete significant sales; |
| • | any future sales of our common stock or other securities; and |
| • | additions or departures of key personnel. |
27
Table of Contents
Our securities have no prior market and our stock price may decline after the offering.
Prior to this offering, there has been no public market for shares of our common stock. Although we have applied to list our common stock on the Nasdaq Global Market, or Nasdaq, an active public trading market for our common stock may not develop or, if it develops, may not be maintained after this offering. For example, Nasdaq imposes certain securities trading requirements, including requirements related to a minimum bid price, minimum number of stockholders, minimum number of trading market makers, and minimum market value of publicly traded shares. Our company and the representatives of the underwriters will negotiate to determine the initial public offering price. The initial public offering price may be higher than the trading price of our common stock following this offering. As a result, you could lose all or part of your investment.
Future sales of shares by existing stockholders could cause our stock price to decline.
Sales of substantial amounts of our common stock in the public market following this offering, or the perception that these sales could occur, could cause the market price of our common stock to decline. Based on shares outstanding as of June 30, 2012, upon completion of this offering, we will have outstanding shares of common stock (or outstanding shares of common stock assuming exercise of the underwriters’ over-allotment option in full). All of the shares sold pursuant to this offering will be immediately tradable without restriction under the Securities Act of 1933, as amended, or the Securities Act, unless held by “affiliates,” as that term is defined in Rule 144 under the Securities Act.
Substantially all of the holders of our equity securities have entered into lock-up agreements that restrict them from selling their shares for a period of at least 180 days following the date of this prospectus, although the representatives of the underwriters may, in their sole discretion and at any time without notice, release all or any portion of the securities subject to lock-up agreements. After the lock-up agreements pertaining to this offer expire and based on shares outstanding as of June 30, 2012, an additional shares will be eligible for sale in the public market. In addition, shares underlying options that are either subject to the terms of our stock-based compensation plans or reserved for future issuance under our stock-based compensation plans will become eligible for sale in the public market to the extent permitted by the provisions of various option agreements, the lock-up agreements, and Rules 144 and 701 under the Securities Act. As resale restrictions end, the market price of our common stock could decline if the holders of those shares sell them or are perceived by the market as intending to sell them.
Holders of approximately shares, or %, of our common stock following this offering will have rights, subject to some conditions, to require us to file registration statements covering the sale of their shares or to include their shares in registration statements that we may file for ourselves or other stockholders. We also intend to register the offer and sale of 11,957,223 shares of common stock that we may issue under our stock-based compensation plans. Once we register the offer and sale of shares for the holders of registration rights and option holders, they can be freely sold in the public market upon issuance, subject to the restrictions contained in the lock-up agreements described in the section of this prospectus captioned “Underwriting.”
In addition, in the future, we may issue additional shares of common stock or other equity or debt securities convertible into common stock in connection with a financing, acquisition, litigation settlement, employee arrangement, or otherwise. Any such issuance could result in substantial dilution to our existing stockholders and could cause the trading price of our common stock to decline.
If securities or industry analysts do not publish research or publish misleading or unfavorable research about our business, our stock price and trading volume could decline.
The trading market for our common stock will depend in part on the research and reports that securities or industry analysts publish about us or our business. We do not currently have and may never obtain research coverage by securities and industry analysts. If no securities or industry analysts commence coverage of our company, the trading price for our stock would be negatively impacted. In the event we obtain securities or
28
Table of Contents
industry analyst coverage, if one or more of the analysts who covers us downgrades our stock or publishes misleading or unfavorable research about our business, our stock price would likely decline. If one or more of these analysts ceases coverage of our company or fails to publish reports on us regularly, demand for our stock could decrease, which could cause our stock price or trading volume to decline.
Insiders will continue to have substantial control over us after this offering and will be able to influence corporate matters.
Upon completion of this offering, our directors and executive officers and their affiliates will beneficially own, in the aggregate, approximately % of our outstanding common stock, assuming no exercise of the underwriters’ over-allotment option, compared to approximately % represented by the shares sold in this offering, assuming no exercise of the underwriters’ over-allotment option. As a result, these stockholders will be able to exercise significant influence over all matters requiring stockholder approval, including the election of directors and approval of significant corporate transactions, such as a merger or other sale of our company or its assets. This concentration of ownership could limit your ability to influence corporate matters and may have the effect of delaying or preventing a third-party from acquiring control over us. For information regarding the ownership of our outstanding stock by our executive officers and directors and their affiliates, please see the section titled “Principal and Selling Stockholders.”
We will incur increased costs and demands upon management as a result of complying with the laws and regulations affecting public companies, which could adversely affect our operating results.
As a public company we will incur significant legal, accounting, and other expenses that we did not incur as a private company, including costs associated with public company reporting requirements. We also have incurred and will incur costs associated with corporate governance requirements, including requirements under the Sarbanes-Oxley Act of 2002, as well as new rules implemented by the SEC or Nasdaq. In addition, our management team will also have to adapt to the requirements of being a public company. The expenses incurred by public companies generally for reporting and corporate governance purposes have been increasing. We expect compliance with these rules and regulations to increase our legal and financial compliance costs and to make some activities more time-consuming and costly, although we are unable to currently estimate these costs with any degree of certainty. We also expect these rules and regulations may make it more difficult and more expensive for us to obtain director and officer liability insurance, and we may be required to accept reduced policy limits and coverage or incur substantially higher costs to obtain the same or similar coverage than used to be available. As a result, it may be more difficult for us to attract and retain qualified individuals to serve on our board of directors or as our executive officers.
However, for as long as we remain an “emerging growth company” as defined in the Jumpstart Our Business Startups Act of 2012, or the JOBS Act, we intend to take advantage of certain exemptions from various reporting requirements that are applicable to other public companies that are not “emerging growth companies” including, but not limited to, not being required to comply with the auditor attestation requirements of Section 404 of the Sarbanes-Oxley Act of 2002, reduced disclosure obligations regarding executive compensation in our periodic reports and proxy statements, and exemptions from the requirements of holding a nonbinding advisory vote on executive compensation and stockholder approval of any golden parachute payments not previously approved. We intend to take advantage of these reporting exemptions until we are no longer an “emerging growth company.”
Under the JOBS Act, “emerging growth companies” can delay adopting new or revised accounting standards until such time as those standards apply to private companies. We have irrevocably elected not to avail ourself of this exemption from new or revised accounting standards and, therefore, we will be subject to the same new or revised accounting standards as other public companies that are not “emerging growth companies.”
We will remain an “emerging growth company” for up to five years, although if the market value of our common stock that is held by non-affiliates exceeds $700 million as of any June 30 before that time, we would cease to be an “emerging growth company” as of the following December 31.
29
Table of Contents
After we are no longer an “emerging growth company,” we expect to incur significant expenses and devote substantial management effort toward ensuring compliance with the requirements of Section 404 of the Sarbanes-Oxley Act of 2002, when applicable to us. In that regard, we currently do not have an internal audit function, and we will need to hire additional accounting and financial staff with appropriate public company experience and technical accounting knowledge. We cannot predict or estimate the amount of additional costs we may incur as a result of becoming a public company or the timing of such costs. We also expect that operating as a public company will make it more difficult and more expensive for us to obtain director and officer liability insurance, and we may be required to accept reduced policy limits and coverage or incur substantially higher costs to obtain the same or similar coverage. As a result, it may be more difficult for us to attract and retain qualified people to serve on our board of directors, our board committees, or as executive officers.
We will be required to evaluate our internal control over financial reporting under Section 404 of the Sarbanes-Oxley Act of 2002, and any adverse results from such evaluation could result in a loss of investor confidence in our financial reports and have an adverse effect on our stock price.
Pursuant to Section 404 of the Sarbanes-Oxley Act of 2002, we will be required to furnish a report by our management on our internal control over financial reporting at the later of the year following our first annual report required to be filed with the SEC, or the date we are no longer an “emerging growth company” as defined in the JOBS Act. We will remain an “emerging growth company” for up to five years, although if the market value of our common stock that is held by non-affiliates exceeds $700 million as of any June 30 before that time, we would cease to be an “emerging growth company” as of the following December 31. When required, such report will contain, among other matters, an assessment of the effectiveness of our internal control over financial reporting as of the end of our fiscal year, including a statement as to whether or not our internal control over financial reporting is effective. This assessment must include disclosure of any material weaknesses in our internal control over financial reporting identified by management. If we are unable to assert that our internal control over financial reporting is effective, we could lose investor confidence in the accuracy and completeness of our financial reports, which could have an adverse effect on our stock price. Furthermore, as a result of the extended time period afforded us as an “emerging growth company,” the effectiveness of our internal control over financial reporting may not be as transparent to our investors as they may otherwise expect of a public reporting company, which could further impact investor confidence in the accuracy and completeness of our financial reports.
Our independent registered public accounting firm is not required to formally attest to the effectiveness of our internal control over financial reporting until the later of the year following our first annual report required to be filed with the SEC, or the date we are no longer an “emerging growth company.” At such time, our independent registered public accounting firm may issue a report that is adverse in the event it is not satisfied with the level at which our controls are documented, designed or operating. Our remediation efforts may not enable us to avoid a material weakness in the future.
We are an “emerging growth company” and we cannot be certain if the reduced disclosure requirements applicable to emerging growth companies will make our common stock less attractive to investors.
We are an “emerging growth company,” as defined in the JOBS Act, and we intend to take advantage of certain exemptions from various reporting requirements that are applicable to other public companies that are not “emerging growth companies” including, but not limited to, not being required to comply with the auditor attestation requirements of section 404 of the Sarbanes-Oxley Act of 2002, reduced disclosure obligations regarding executive compensation in our periodic reports and proxy statements, and exemptions from the requirements of holding a nonbinding advisory vote on executive compensation and stockholder approval of any golden parachute payments not previously approved. We cannot predict if investors will find our common stock less attractive because we will rely on these exemptions. If some investors find our common stock less attractive as a result, there may be a less active trading market for our common stock and our stock price may be more volatile.
30
Table of Contents
If we need additional capital in the future, it may not be available on favorable terms, or at all.
We have financed our operations primarily through the sale of convertible preferred stock, equipment term notes and leases, a credit facility, and in fiscal 2010, by cash generated from operations. However, we may require additional capital from equity or debt financing in the future to fund our operations, respond to competitive pressures, or strategic opportunities. Our continued growth is dependent upon increasing revenues and managing working capital to a level that is adequate to support our increased cost structure or obtaining adequate debt financing to fulfill our obligations as they become due. If we are unable to successfully manage our working capital and require additional financing, we may not be able to secure timely additional financing on favorable terms, or at all. The terms of additional financing may place limits on our financial and operating flexibility. If we raise additional funds through further issuances of equity, convertible debt securities, or other securities convertible into equity, our existing stockholders could suffer significant dilution in their percentage ownership of our company, and any new securities we issue could have rights, preferences, and privileges senior to those of holders of our common stock, including shares of common stock sold in this offering. In addition, the terms of any new debt financing may include negative covenants or other restrictions on our business that could impair our operational flexibility, and would also require us to incur interest expense. If we are unable to obtain adequate financing or financing on terms satisfactory to us, if and when we require it, our ability to grow or support our business and to respond to business challenges could be significantly limited.
We could be the subject of securities class action litigation due to future stock price volatility, which could divert management’s attention and adversely affect our results of operations.
The stock market in general, and market prices for the securities of technology companies like ours in particular, have from time to time experienced volatility that often has been unrelated to the operating performance of the underlying companies. A certain degree of stock price volatility can be attributed to being a newly public company. These broad market and industry fluctuations may adversely affect the market price of our common stock, regardless of our operating performance. In several recent situations where the market price of a stock has been volatile, holders of that stock have instituted securities class action litigation against the company that issued the stock. If any of our stockholders were to bring a lawsuit against us, the defense and disposition of the lawsuit could be costly and divert the time and attention of our management and harm our operating results.
Anti-takeover provisions in our charter documents and Delaware law could discourage, delay, or prevent a change in control of our company and may affect the trading price of our common stock.
We are a Delaware corporation and the anti-takeover provisions of the Delaware General Corporation Law may discourage, delay, or prevent a change in control by prohibiting us from engaging in a business combination with an interested stockholder for a period of three years after the person becomes an interested stockholder, even if a change of control would be beneficial to our existing stockholders. For more information, see “Description of Capital Stock — Anti-Takeover Effects of Our Charter and Bylaws and Delaware Law.” In addition, our amended and restated certificate of incorporation and amended and restated bylaws may discourage, delay, or prevent a change in our management or control over us that stockholders may consider favorable. Our amended and restated certificate of incorporation and amended and restated bylaws, which will be in effect as of the closing of this offering:
| • | authorize the issuance of “blank check” preferred stock that could be issued by our board of directors to thwart a takeover attempt; |
| • | establish a classified board of directors, as a result of which the successors to the directors whose terms have expired will be elected to serve from the time of election and qualification until the third annual meeting following their election; |
| • | require that directors only be removed from office for cause; |
| • | provide that vacancies on the board of directors, including newly-created directorships, may be filled only by a majority vote of directors then in office; |
31
Table of Contents
| • | limit who may call special meetings of stockholders; |
| • | prohibit stockholder action by written consent, thereby requiring all actions to be taken at a meeting of the stockholders; and |
| • | require supermajority stockholder voting to effect certain amendments to our amended and restated certificate of incorporation and amended and restated bylaws. |
Our management will have broad discretion over the use of the proceeds we receive in this offering and might not apply the proceeds in ways that increase the value of your investment.
Our management will have broad discretion to use the net proceeds from this offering, and you will be relying on the judgment of our management regarding the application of these proceeds. Our management might not apply the net proceeds of this offering in ways that increase the value of your investment. We intend to use the net proceeds from this offering for working capital and other general corporate purposes, including to finance our growth, develop new products, assert and defend our intellectual property rights, and fund capital expenditures. In addition, we may choose to repay our loan facility with Silicon Valley Bank or expand our current business through acquisitions of other businesses, products, or technologies. However, we do not have agreements or commitments for any specific acquisitions at this time. We have not allocated these net proceeds for any specific purposes. Our management might not be able to yield a significant return, if any, on any investment of these net proceeds. You will not have the opportunity to influence our decisions on how to use the net proceeds from this offering.
Further significant changes in our stockholder composition may jeopardize our ability to use some or all of our NOL and research tax credit carryforwards.
Pursuant to Sections 382 and 383 of the Internal Revenue Code, or the Code, annual use of our NOL and research tax credit carryforwards to offset future taxable income and tax, respectively, may be limited in the event of an ownership change as defined under Section 382 of the Code, which results from a cumulative change in ownership of 50% of certain stockholders occurring within a three-year period.
We completed a study to assess whether an ownership change has occurred since our formation through December 25, 2010. There were no significant transactions that would be expected to effect ownership changes during the year ended December 31, 2011 or the six months ended June 30, 2012. Based on this study, we concluded that we incurred ownership changes on September 29, 2000, August 2, 2002, and October 20, 2004. As a result of these changes, we expect the following tax attributes to expire unused: approximately $52.2 million in federal NOL carryforwards, approximately $17.5 million of state NOL carryforwards and approximately $3.0 million of federal research tax credit carryforwards. These tax attributes have been excluded from the U.S. federal and state NOL carryforwards and federal and state research tax credit carryforwards. We have $156.6 million in federal NOL carryforwards available as of December 31, 2011, of which $136.0 million in losses were available for immediate use and $1.6 million will be available each year from 2012 through 2024. Our state NOL carryforwards consist of $73.4 million for California and $32.3 million for various other states. Of our $73.4 million in California state NOL carryforwards available as of December 31, 2011, $62.3 million in losses were available for immediate use and $1.6 million will be available each year from 2012 through 2018. The availability and timing of utilization of the losses are subject to tax law changes that have occurred or may occur. All of our $32.3 million in non-California state NOL carryforwards were available for immediate use as of December 31, 2011, subject to any temporary deferrals due to state tax law changes.
Our initial public offering could result in another ownership change as defined under Section 382 of the Code. In addition, future sales of our shares by, or changes in ownership of our existing significant stockholders could cause us to undergo an ownership change as defined under Section 382 of the Code in the future. Consequently, whether we undergo an ownership change which results in a limitation on our ability to utilize our NOL and tax credit carryforwards may be a matter beyond our control.
32
Table of Contents
If our income tax provisions taken in the U.S. and foreign countries are not sustained under examination by tax authorities in these jurisdictions, our results of operations could be adversely affected.
We are subject to income taxes in the U.S. and foreign countries, and are subject to routine corporate income tax audits in many of these jurisdictions. We believe that our tax return positions are fully supported, but tax authorities could challenge certain positions, which may not be fully sustained. However, our income tax expense includes amounts intended to satisfy income tax assessments that result from these challenges. Determining the income tax expense for these potential assessments and recording the related assets and liabilities requires management judgment and estimates. We believe that our provision for uncertain tax positions, including related interest and penalties, is adequate based on information currently available to us. The amount ultimately paid upon resolution of audits could be materially different from the amounts previously included in income tax expense and therefore could have a material impact on our tax provision, net income and cash flows. Our overall provision requirement could change due to the issuance of new regulations or new case law, negotiations with tax authorities, resolution with respect to individual audit issues, or the entire audit, or the expiration of statutes of limitations.
Investors purchasing common stock in this offering will experience substantial dilution as a result of this offering and future equity issuances.
The initial public offering price per share is substantially higher than the pro forma net tangible book (deficit) value per share of our common stock outstanding prior to this offering. As a result, investors purchasing common stock in this offering will experience immediate substantial dilution of $ a share, assuming an initial public offering price of $ per share, the midpoint of the initial public offering price range reflected on the cover page of this prospectus. This dilution is due in large part to the fact that our earlier investors paid substantially less than the initial public offering price when they purchased their shares of common stock. Investors purchasing shares of common stock in this offering will contribute approximately % of the total amount we have raised since our inception, but will own only approximately % of our total common stock immediately following the completion of this offering. In addition, we have issued options to acquire common stock at prices significantly below the initial public offering price. To the extent outstanding options are ultimately exercised, there will be further dilution to investors purchasing common stock in this offering. In addition, if the underwriters exercise their over-allotment option, if outstanding warrants to purchase our common stock are exercised, or if we issue additional equity securities, investors purchasing common stock in this offering will experience additional dilution.
We have never declared or paid dividends on our capital stock and we do not intend to do so for the foreseeable future and, consequently, the ability of investors purchasing common stock in this offering to achieve a return on their investment will depend on appreciation in the price of our common stock.
We have never declared or paid dividends on our capital stock and we do not intend to do so for the foreseeable future. We currently intend to invest our future earnings, if any, to fund our growth. Additionally, the terms of our loan facility with Silicon Valley Bank restrict our ability to pay dividends. Therefore, investors purchasing common stock in this offering are not likely to receive any dividends on our common stock for the foreseeable future and the success of an investment in shares of our common stock will depend upon any future appreciation in our common stock’s value. There is no guarantee that shares of our common stock will appreciate in value or even maintain the price at which our stockholders have purchased their shares.
33
Table of Contents
SPECIAL NOTE REGARDING FORWARD-LOOKING STATEMENTS
This prospectus contains forward-looking statements that are based on our management’s beliefs and assumptions and on information currently available to our management. The forward-looking statements are contained principally in “Prospectus Summary,” “Risk Factors,” “Management’s Discussion and Analysis of Financial Condition and Results of Operations,” “Business,” and “Compensation Discussion and Analysis.” Forward-looking statements include information concerning our possible or assumed future results of operations, business strategies, financing plans, competitive position, industry environment, potential growth opportunities, and the effects of competition. Forward-looking statements include all statements that are not historical facts and, in some cases, can be identified by terms such as “anticipates,” “believes,” “could,” “seeks,” “estimates,” “expects,” “intends,” “may,” “plans,” “potential,” “predicts,” “projects,” “should,” “will,” “would,” or similar expressions and the negatives of those terms.
Forward-looking statements involve known and unknown risks, uncertainties and other factors that may cause our actual results, performance or achievements to be materially different from any future results, performance or achievements expressed or implied by the forward-looking statements, including those described in “Risk Factors” and elsewhere in this prospectus. Given these uncertainties, you should not place undue reliance on these forward-looking statements. Also, forward-looking statements represent our management’s beliefs and assumptions only as of the date of this prospectus. You should read this prospectus and the documents that we have filed as exhibits to the registration statement, of which this prospectus is a part, completely and with the understanding that our actual future results may be materially different from what we expect.
Any forward-looking statement made by us in this prospectus speaks only as of the date on which it is made. Except as required by law, we assume no obligation to update these forward-looking statements publicly, or to update the reasons actual results could differ materially from those anticipated in these forward-looking statements, even if new information becomes available in the future.
This prospectus also contains estimates and other information concerning our industry, including market size and growth rates, that are based on industry publications, surveys and forecasts, including those generated by the Cisco Visual Networking Index, Frost & Sullivan, Gartner, Inc., and Infonetics. This information involves a number of assumptions and limitations. Although we believe the information in these industry publications, surveys, and forecasts is reliable, we have not independently verified the accuracy or completeness of the information. The industry in which we operate is subject to a high degree of uncertainty and risk due to variety of factors, including those described in “Risk Factors.” These and other factors could cause results to differ materially from those expressed in these publications, surveys, and forecasts.
34
Table of Contents
We estimate that our net proceeds from the sale of the common stock that we are offering will be approximately $ million, assuming an initial public offering price of $ per share, the midpoint of the initial public offering price range reflected on the cover page of this prospectus, and after deducting estimated underwriting discounts and commissions and estimated offering expenses payable by us. If the underwriters’ option to purchase additional shares in this offering is exercised in full, we estimate that our net proceeds will be approximately $ million. We will not receive any proceeds from the sale of shares of common stock by the selling stockholders. In connection with our initial public offering, eight employees are exercising options and selling a total of 159,220 shares issued upon exercise of these options. All of the options that are being exercised would otherwise expire during the 180-day lock-up period, when the holders would not be able to sell the shares, and therefore these holders are exercising these options and we are allowing them to sell these shares in our initial public offering.
We intend to use the net proceeds to us from this offering for working capital and other general corporate purposes. While we have not allocated the net proceeds of this offering to specified general corporate purposes, we may utilize such proceeds by allocating them amongst the following categories: finance our growth; develop new products; assert and defend our intellectual property rights; and fund capital expenditures. In addition, we may choose to repay our loan facility with Silicon Valley Bank or expand our current business through acquisitions of other businesses, products, or technologies. However, we do not have agreements or commitments for any specific acquisitions at this time. Our loan facility with Silicon Valley Bank provides us with a revolving line of credit and also an equipment line. The revolving line of credit has a maturity date of December 30, 2014, and carries an annual interest rate equal to the prime rate plus 0.50%, subject to an interest rate floor of 3.75% and an interest rate ceiling of 7.50%. The equipment line is available until December 31, 2012 and has a maturity date of 36 months from the date of each draw. The equipment line carries an annual interest rate equal to 4.75%.
The expected use of net proceeds of this offering represents our current intentions based upon our present plans and business conditions. The amounts we actually expend in these areas may vary significantly from our current intentions and will depend upon a number of factors, including future sales growth, success of our engineering efforts, cash generated from future operations, if any, and actual expenses to operate our business. As of the date of this prospectus, we cannot specify with certainty all of the particular uses for the net proceeds to be received upon the closing of this offering. Accordingly, our management will have broad discretion in the application of the net proceeds, and investors will be relying on the judgment of our management regarding the application of the net proceeds of this offering.
Pending use of proceeds from this offering, we intend to invest the proceeds in a variety of capital preservation investments, including short-term, investment-grade, interest-bearing instruments.
We have never declared or paid cash dividends on our common or preferred stock. We currently intend to retain all available funds and any future earnings for use in the operation of our business and do not anticipate paying any cash dividends in the foreseeable future. Any future determination to declare cash dividends will be made at the discretion of our board of directors, subject to compliance with certain covenants under our loan facility with Silicon Valley Bank, which restrict or limit our ability to pay dividends, and will depend on our financial condition, results of operations, capital requirements, general business conditions, and other factors that our board of directors may deem relevant.
35
Table of Contents
The table below sets forth our cash and cash equivalents and capitalization as of June 30, 2012:
| • | on an actual basis; |
| • | our pro forma capitalization after giving effect to (1) the automatic conversion of all outstanding shares of our convertible preferred stock as of June 30, 2012, into an aggregate of 22,384,097 shares of common stock upon the completion of this offering,* (2) the conversion of our remaining warrants to purchase convertible preferred stock into warrants to purchase common stock and the related reclassification of $808,000 of other long-term liabilities into stockholders’ equity (deficit), and (3) the filing of an amended and restated certificate of incorporation upon the completion of this offering; and |
| • | our pro forma as adjusted capitalization reflecting (1) our pro forma capitalization, and (2) the sale of shares of common stock in this offering at an assumed initial public offering price of $ per share, the midpoint of the initial public offering price range reflected on the cover page of this prospectus, after deducting underwriting discounts and commissions and estimated offering expenses payable by us. |
You should read the information in this table together with our financial statements and accompanying notes and “Management’s Discussion and Analysis of Financial Condition and Results of Operations” appearing elsewhere in this prospectus.
| As of June 30, 2012 | ||||||||||||
| Actual | Pro Forma | Pro Forma As Adjusted |
||||||||||
| (unaudited) | ||||||||||||
|
(in thousands, except share and per share amounts) |
||||||||||||
| Obligations under capital leases, including current portion |
$ | 436 | $ | 436 | $ | 436 | ||||||
| Notes payable, including current portion |
1,192 | 1,192 | 1,192 | |||||||||
| Other long-term liabilities |
5,391 | 4,583 | 4,583 | |||||||||
| Convertible preferred stock, $0.001 par value: |
||||||||||||
| Series A1 convertible preferred stock, 5,967,577 shares authorized; 5,762,851 shares issued and outstanding, liquidation preference of $29,324, actual; no shares issued and outstanding, pro forma and pro forma as adjusted |
31,837 | — | — | |||||||||
| Series B1 convertible preferred stock, 1,642,281 shares authorized; 1,628,936 shares issued and outstanding, liquidation preference of $11,000, actual; no shares issued and outstanding, pro forma and pro forma as adjusted |
11,298 | — | — | |||||||||
| Series C1 convertible preferred stock, 6,113,655 shares authorized; 6,107,910 shares issued and outstanding, liquidation preference of $35,134, actual; no shares issued and outstanding, pro forma and pro forma as adjusted |
35,469 | — | — | |||||||||
| Series D1 convertible preferred stock, 9,148,073 shares authorized; 8,884,400 shares issued and outstanding, liquidation preference of $96,937, actual; no shares issued and outstanding, pro forma and pro forma as adjusted |
94,303 | — | — | |||||||||
| Stockholders’ equity (deficit): |
||||||||||||
| Common stock, $0.001 par value: 35,101,752 shares authorized; 2,845,204 shares issued and outstanding, actual; 35,101,752 shares authorized, 25,229,301 shares issued and outstanding pro forma; 35,101,752 shares authorized, shares issued and outstanding pro forma as adjusted |
3 | 25 | ||||||||||
| Additional paid-in capital |
87,900 | 261,593 | ||||||||||
| Accumulated deficit |
(231,275 | ) | (231,275 | ) | (231,275 | ) | ||||||
| Accumulated other comprehensive loss |
(222 | ) | (222 | ) | (222 | ) | ||||||
|
|
|
|
|
|
|
|||||||
| Total stockholders’ equity (deficit) |
|
(143,594 |
) |
|
30,121 |
|
||||||
|
|
|
|
|
|
|
|||||||
| Total capitalization |
$ |
36,332 |
|
$ |
36,332 |
|
$ |
|
| |||
|
|
|
|
|
|
|
|||||||
36
Table of Contents
| * | All outstanding shares of convertible preferred stock automatically convert into shares of common stock at the then applicable conversion rate upon (1) the consummation of a firm commitment underwritten public offering of our common stock pursuant to a registration statement filed with the SEC pursuant to the Securities Act where the aggregate sales price is not less than $25,000,000 and the per share sales price is not less than $27.31 (subject to appropriate adjustment for stock splits, stock dividends, recapitalizations, reclassifications, and similar events), or (2) the affirmative vote or written consent of a majority of the outstanding shares of convertible preferred stock. |
Each $1.00 increase (decrease) in the assumed public offering price of $ per share, the midpoint of the initial public offering price range reflected on the cover page of this prospectus, would increase (decrease) each of cash and cash equivalents, additional paid-in capital, total stockholders’ equity, and total capitalization by approximately $ million, assuming that the number of shares offered by us, as set forth on the cover page of this prospectus, remains the same, and after deducting underwriting discounts and commissions and estimated offering expenses payable by us. We may also increase or decrease the number of shares we are offering. Each increase (decrease) of 1,000,000 shares in the number of shares offered by us would increase (decrease) each of cash and cash equivalents, additional paid-in capital, total stockholders’ equity, and total capitalization by approximately $ million, assuming that the assumed initial public offering price remains the same, and after deducting underwriting discounts and commissions and estimated offering expenses payable by us. The as adjusted information discussed above is illustrative only and will adjust based on the actual initial public offering price and other terms of this offering determined at pricing.
The number of shares of our common stock to be outstanding following this offering is based on 25,229,301 shares of our common stock outstanding as of June 30, 2012, and excludes:
| • | 7,406,006 shares of common stock issuable upon the exercise of options outstanding as of June 30, 2012 under the 1996 Stock Plan and the 2004 Stock Plan at a weighted average exercise price of $4.48 per share; |
| • | 196,090 shares of common stock issuable upon the exercise of common and convertible preferred stock warrants outstanding as of June 30, 2012, at a weighted average exercise price of $6.86 per share; and |
| • | 4,551,217 shares of common stock reserved for future issuance under our stock-based compensation plans, including 2,000,000 shares of common stock reserved for issuance under our 2012 Equity Incentive Plan, and 1,000,000 shares of common stock reserved for issuance under our 2012 Employee Stock Purchase Plan, subject in each case to automatic annual adjustment in accordance with the terms of the plan. |
37
Table of Contents
At June 30, 2012, our net tangible book value (deficit) was approximately $(143.6) million, or $(50.47) per share of common stock. Net tangible deficit per share represents the amount of our tangible assets less our liabilities, divided by the shares of common stock outstanding at June 30, 2012. As of June 30, 2012, the pro forma net tangible book value of our common stock was approximately $30.1 million, or approximately $1.19 per share of our pro forma outstanding common stock after giving effect to the conversion of all outstanding shares of our convertible preferred stock as of June 30, 2012 into an aggregate of 22,384,097 shares of common stock upon the completion of this offering and the conversion of our remaining warrants to purchase convertible preferred stock into warrants to purchase common stock and the related reclassification of $0.8 million of other long-term liabilities into stockholders’ equity (deficit).
Purchasers of common stock in this offering will incur immediate, substantial dilution. After giving effect to (1) the sale of shares of common stock in this offering at an assumed initial public offering price of $ per share, the mid-point of the price range set forth on the cover page of this prospectus, and after deducting the estimated underwriting discounts and commissions and estimated offering costs payable by us, and (2) the pro forma transactions and other adjustments described in the preceding paragraph, our pro forma as adjusted net tangible book value of our common stock as of June 30, 2012 would have been approximately $ million, or approximately $ per share of our pro forma as adjusted outstanding common stock. This represents an immediate increase in pro forma as adjusted net tangible book value of $ per share to our existing stockholders and an immediate dilution in the pro forma as adjusted net tangible book value of $ per share to purchasers of common stock in this offering. The following table illustrates this per share dilution:
| Assumed initial public offering price per share |
$ | |||||||
| Historical net tangible book value (deficit) per share as of June 30, 2012 |
$ | (50.47 | ) | |||||
| Pro forma increase in net tangible book value (deficit) per share attributable to pro forma transaction described in the first preceding paragraph |
51.66 | |||||||
|
|
|
|||||||
| Pro forma net tangible book value per share before this offering |
1.19 | |||||||
| Increase in pro forma net tangible book value per share attributable to investors participating in this offering |
||||||||
|
|
|
|||||||
| Pro forma as adjusted net tangible book value per share after this offering |
||||||||
|
|
|
|||||||
| Pro forma as adjusted dilution per share to purchasers of common stock in this offering |
$ | |||||||
|
|
|
Each $1.00 increase (decrease) in the assumed initial public offering price of $ per share would increase (decrease) our pro forma net tangible book value by $ million, or $ per share, and the pro forma dilution per share to purchasers of common stock in this offering by $ per share, assuming that the number of shares offered by us, as set forth on the cover page of this prospectus, remains the same, and after deducting underwriting discounts and commissions and estimated offering expenses payable by us. We may also increase or decrease the number of shares we are offering. An increase of 1,000,000 shares in the number of shares offered by us would increase our pro forma net tangible book value by approximately $ million, or $ per share, and the pro forma dilution per share to purchasers of common stock in this offering would be $ per share, assuming that the assumed initial public offering price remains the same, and after deducting the estimated underwriting discounts and commissions and estimated offering expenses payable by us. Similarly, a decrease of 1,000,000 shares in the number of shares offered by us would decrease our pro forma net tangible book value by approximately $ million, or $ per share, and the pro forma dilution per share to purchasers of common stock in this offering would be $ per share, assuming that the assumed initial public offering price remains the same, and after deducting the underwriting discounts and commissions and estimated offering expenses payable by us. The pro forma information discussed above is illustrative only and will adjust based on the actual initial public offering price and other terms of this offering determined at pricing.
38
Table of Contents
If the underwriters exercise their option to purchase additional shares of our common stock in full in this offering, the pro forma net tangible book value per share after this offering would be $ per share, the increase in pro forma net tangible book value per share to existing stockholders would be $ per share and the dilution to purchasers of common stock in this offering would be $ per share.
The following table presents, on a pro forma basis as of June 30, 2012, the differences between existing stockholders and the purchasers of common stock in the offering with respect to the number of shares purchased from us, the total consideration paid and the average price paid per share:
| Shares Purchased | Total Consideration | Average
Price Per Share |
||||||||||||||||||
| Number | Percent | Amount | Percent | |||||||||||||||||
| Existing stockholders |
25,229,301 | % | $ | 244,296,000 | % | $ | 9.68 | |||||||||||||
| Purchasers of common stock in this offering |
||||||||||||||||||||
|
|
|
|
|
|
|
|
|
|||||||||||||
| Totals |
100.0% | $ | 100.0% | |||||||||||||||||
|
|
|
|
|
|
|
|
|
|||||||||||||
The foregoing tables exclude:
| • | 7,406,006 shares of common stock issuable upon the exercise of options outstanding as of June 30, 2012 under the 1996 Stock Plan and the 2004 Stock Plan at a weighted average exercise price of $4.48 per share; |
| • | 196,090 shares of common stock issuable upon the exercise of common and preferred stock warrants outstanding as of June 30, 2012, at a weighted average exercise price of $6.86 per share; and |
| • | 4,551,217 shares of common stock reserved for future issuance under our stock-based compensation plans, including 2,000,000 shares of common stock reserved for issuance under our 2012 Equity Incentive Plan, and 1,000,000 shares of common stock reserved for issuance under our 2012 Employee Stock Purchase Plan, subject in each case to automatic annual adjustment in accordance with the terms of the plan. |
If all of these stock options and warrants were exercised, then our existing stockholders, including the holders of these options and warrants, would own % and purchasers of common stock in this offering would own % of the total number of shares of our common stock outstanding upon completion of this offering. The total consideration paid by our existing stockholders, including the holders of these stock options and warrants, would be approximately $ million, or %, and the total consideration paid by purchasers of common stock in this offering would be $ million, or %. The average price per share paid by our existing stockholders, including holders of these stock options and warrants, would be $ and the average price per share paid by purchasers of common stock in this offering would be $ .
If the underwriters exercise their option to purchase additional shares of our common stock in full, our existing stockholders would own % and purchasers of common stock in this offering would own % of the total number of shares of our common stock outstanding upon completion of this offering. The total consideration paid by existing stockholders would be approximately $244.3 million, or %, and the total consideration paid by purchasers of common stock in this offering would be $ million, or %.
39
Table of Contents
SELECTED CONSOLIDATED FINANCIAL DATA
The following tables set forth selected consolidated financial data. We derived the selected consolidated statement of operations data for the years ended December 25, 2010 and December 31, 2011, and the selected consolidated balance sheet data as of December 25, 2010 and December 31, 2011 from our audited consolidated financial statements and related notes included elsewhere in this prospectus. We derived the consolidated statement of operations data for the six months ended June 25, 2011 and June 30, 2012, and the consolidated balance sheet data as of June 30, 2012, from our unaudited consolidated financial statements included elsewhere in this prospectus. The unaudited financial statements include all adjustments, consisting of normal recurring accruals, which we consider necessary for a fair presentation of the financial position and the results of operations for these periods. Our historical results are not necessarily indicative of the results to be expected for any future period.
The following selected consolidated financial data should be read in conjunction with “Management’s Discussion and Analysis of Financial Condition and Results of Operations” and our consolidated financial statements and related notes included elsewhere in this prospectus.
| Fiscal Year Ended | Six Months Ended | |||||||||||||||
| December 25, 2010 |
December 31, 2011 |
June 25, 2011 |
June 30, 2012 |
|||||||||||||
| (unaudited) | ||||||||||||||||
| (in thousands, except per share amounts) |
||||||||||||||||
| Consolidated Statement of Operations Data: |
||||||||||||||||
| Net revenue |
$ | 91,071 | $ | 107,771 | $ | 45,729 | $ | 80,334 | ||||||||
| Cost of net revenue (1) |
49,520 | 70,955 | 26,720 | 52,858 | ||||||||||||
|
|
|
|
|
|
|
|
|
|||||||||
| Gross profit |
41,551 | 36,816 | 19,009 | 27,476 | ||||||||||||
|
|
|
|
|
|
|
|
|
|||||||||
| Operating expense: |
||||||||||||||||
| Research and development (1) |
18,040 | 22,730 | 10,248 | 14,163 | ||||||||||||
| Selling, general and administrative (1) |
18,889 | 23,252 | 10,812 | 15,193 | ||||||||||||
|
|
|
|
|
|
|
|
|
|||||||||
| Total operating expense |
36,929 | 45,982 | 21,060 | 29,356 | ||||||||||||
|
|
|
|
|
|
|
|
|
|||||||||
| Income (loss) from operations |
4,622 | (9,166 | ) | (2,051 | ) | (1,880 | ) | |||||||||
| Interest expense |
(610 | ) | (318 | ) | (185 | ) | (1,076 | ) | ||||||||
| Other income (expense), net |
(105 | ) | (2 | ) | 66 | (38 | ) | |||||||||
|
|
|
|
|
|
|
|
|
|||||||||
| Income (loss) before income taxes |
3,907 | (9,486 | ) | (2,170 | ) | (2,994 | ) | |||||||||
| Provision for income taxes |
147 | 196 | 125 | 74 | ||||||||||||
|
|
|
|
|
|
|
|
|
|||||||||
| Net income (loss) |
3,760 | (9,682 | ) | (2,295 | ) | (3,068 | ) | |||||||||
| Net income allocable to preferred stockholders |
(3,760 | ) | — | — | — | |||||||||||
|
|
|
|
|
|
|
|
|
|||||||||
| Net income (loss) attributable to common stockholders |
$ | — | $ | (9,682 | ) | $ | (2,295 | ) | $ | (3,068 | ) | |||||
|
|
|
|
|
|
|
|
|
|||||||||
| Basic and diluted net income (loss) per share attributable to common stockholders |
$ | — | $ | (3.57 | ) | $ | (0.85 | ) | $ | (1.10 | ) | |||||
|
|
|
|
|
|
|
|
|
|||||||||
| Shares used in computing basic and diluted net income (loss) per share |
2,504 | 2,715 | 2,693 | 2,790 | ||||||||||||
|
|
|
|
|
|
|
|
|
|||||||||
| Unaudited pro forma net income per share attributable to common stockholders: |
||||||||||||||||
| Basic |
$ | (0.39 | ) | $ | (0.12 | ) | ||||||||||
|
|
|
|
|
|||||||||||||
| Diluted |
$ | (0.39 | ) | $ | (0.12 | ) | ||||||||||
|
|
|
|
|
|||||||||||||
| Unaudited pro forma weighted average common shares outstanding: |
||||||||||||||||
| Basic |
25,080 | 25,157 | ||||||||||||||
|
|
|
|
|
|||||||||||||
| Diluted |
25,080 | 25,157 | ||||||||||||||
|
|
|
|
|
|||||||||||||
Footnotes on the following page.
40
Table of Contents
| As of | ||||||||||||
| December 25, 2010 |
December
31, 2011 |
June 30, 2012 |
||||||||||
| (unaudited) | ||||||||||||
| (in thousands) |
||||||||||||
| Consolidated Balance Sheet Data: |
||||||||||||
| Cash and cash equivalents |
$ | 15,226 | $ | 12,119 | $ | 42,918 | ||||||
| Working capital |
28,390 | 18,914 | 15,100 | |||||||||
| Total assets |
62,349 | 70,858 | 131,504 | |||||||||
| Obligations under capital leases, less current portion |
529 | 189 | 114 | |||||||||
| Notes payable, less current portion |
1,623 | 757 | 310 | |||||||||
| Convertible preferred stock (2) |
172,430 | 172,430 | 172,907 | |||||||||
| Stockholders’ deficit |
(136,172 | ) | (142,600 | ) | (143,594 | ) | ||||||
| Footnotes |
| (1) | Includes stock-based compensation expense related to options granted to employees and others as follows: |
| Fiscal Year Ended | Six Months Ended | |||||||||||||||
| December 25, 2010 |
December 31, 2011 |
June 25, 2011 |
June 30, 2012 |
|||||||||||||
| (unaudited) | ||||||||||||||||
| (in thousands) |
||||||||||||||||
| Cost of net revenue |
$ | 407 | $ | 431 | $ |
208 |
|
$ |
271 |
| ||||||
| Research and development |
556 | 762 | 332 | 567 | ||||||||||||
| Selling, general and administrative |
1,554 | 1,891 | 943 | 1,126 | ||||||||||||
|
|
|
|
|
|
|
|
|
|||||||||
| Total |
$ | 2,517 | $ | 3,084 | $ | 1,483 | $ | 1,964 | ||||||||
|
|
|
|
|
|
|
|
|
|||||||||
| (2) | Upon certain change of control events that may be outside of our control, including liquidation, sale or transfer of control, holders of the convertible preferred stock can cause its redemption. Accordingly, these shares are considered contingently redeemable and have been classified as temporary equity on our balance sheet. |
41
Table of Contents
MANAGEMENT’S DISCUSSION AND ANALYSIS OF FINANCIAL
CONDITION AND RESULTS OF OPERATIONS
You should read the following discussion and analysis of our financial condition and results of operations in conjunction with the “Selected Consolidated Financial Data” and our consolidated financial statements and notes thereto appearing elsewhere in this prospectus. In addition to historical consolidated financial information, the following discussion and analysis contains forward-looking statements that involve risks, uncertainties, and assumptions. Our actual results could differ materially from those anticipated by these forward-looking statements as a result of many factors. We discuss factors that we believe could cause or contribute to these differences below and elsewhere in this prospectus, including these set forth under “Risk Factors” and “Special Note Regarding Forward-Looking Statements.”
Overview
We are a fabless provider of high performance RFICs. Our solutions leverage our proprietary UltraCMOS technology, which enables the design, manufacture, and integration of multiple RF, mixed signal, and digital functions on a single chip. We believe our products deliver an industry leading combination of performance and monolithic integration. Our solutions target a broad range of applications in the aerospace and defense, broadband, industrial, mobile wireless device, test and measurement equipment, and wireless infrastructure markets. We have shipped over one billion RFICs based on our UltraCMOS technology since January 1, 2006.
Our UltraCMOS technology combines the ability to achieve the high levels of performance of traditional specialty processes, with the fundamental benefits of standard CMOS, the most widely used semiconductor process technology. UltraCMOS technology utilizes a synthetic sapphire substrate, a near-perfect electrical insulator, providing greatly reduced unwanted electrical interaction between the RFIC and the substrate (referred to as parasitic capacitance), which enables high signal isolation and excellent signal fidelity with low distortion over a broad frequency range (referred to as broadband linearity). These two technical attributes result in RF devices with excellent high-frequency performance and power handling performance, and reduced crosstalk between frequencies. In addition, increased broadband linearity provides for faster data throughput and greater subscriber capacity over a wireless network, resulting in enhanced network efficiency. UltraCMOS technology also provides the benefits of standard CMOS, such as high levels of integration, low power consumption, reusable circuit libraries, widely available design tools and outsourced manufacturing capacity, and the ability to scale to smaller geometries. We own fundamental IP in UltraCMOS technology consisting of more than 125 U.S. and international issued and pending patents, and over 300 documented trade secrets covering basic circuit elements, RF circuit designs, manufacturing processes, and design know-how.
We leverage our extensive RF design expertise and systems knowledge to develop RFIC solutions that meet the stringent performance, integration, and reliability requirements of the rapidly evolving wireless markets. As of June 30, 2012, we offer a broad portfolio of more than 160 high performance RFICs including switches, digital attenuators, mixers / upconverters, prescalers, DTCs, and DC-DC converters, and we are currently developing PAs. During the year ended December 31, 2011, our products were sold to more than 1,500 module manufacturers, OEMs, contract manufacturers, and other customers, including such companies as Ericsson, Flextronics, Hitachi Metals, Itron, Jabil, LG Innotek, Mini-Circuits, Motorola Solutions, Murata, Northrop Grumman, Planet Technology, Rockwell Collins, Rohde & Schwarz, SIPAT, Skyworks, Sony Corporation, Source Photonics, TDK-EPC, Thales Alenia Space, and TriQuint. We believe our RFICs are included in products sold by many of the leading mobile handset OEMs. For the years ended December 25, 2010 and December 31, 2011, we generated net revenue of $91.1 million, and $107.8 million, respectively, representing year-over-year growth of 18%. We generated net income of $3.8 million for the year ended December 25, 2010 and a net loss of $9.7 million for the year ended December 31, 2011. We recorded net revenue of $80.3 million and a net loss of $3.1 million for the six months ended June 30, 2012. As of June 30, 2012, we had an accumulated deficit of $231.3 million.
42
Table of Contents
Under the JOBS Act, “emerging growth companies” can delay adopting new or revised accounting standards until such time as those standards apply to private companies. We have irrevocably elected not to avail ourself of this exemption from new or revised accounting standards and, therefore, we will be subject to the same new or revised accounting standards as other public companies that are not “emerging growth companies.”
Key Financial Measures
Net Revenue. Our net revenue is derived primarily from the sale of our products, which include both our application specific standard products and customer specific standard products. We develop application specific standard products from our own specifications, and we sell these products through our direct sales force, our network of sales representatives, and our distributors. For higher volume markets, we also develop customer specific standard products to meet the specialized requirements of individual customers, and we sell these products through our direct sales organization. We sell our products worldwide through our direct sales force and field applications engineering staff, our network of domestic and international independent sales representatives, and both worldwide and regional distribution partners. Each of these channels is supported by our customer service and marketing organizations. Prior to a customer’s selection and purchase of our products, our direct sales force and field applications engineers provide our customers technical assistance in the use of our products for the design of their equipment. Our network of sales representatives and distributors have been selected based on their focus on and knowledge of RFICs, their ability to provide a high level of field application engineering support or their regional logistical support capabilities. We provide ongoing technical training for new products to our sales representatives and distributors to keep them informed of product enhancements and new product releases. We share product information and technical specifications with our customers using web-based tools. We plan to expand our direct sales and support capabilities and our network of independent sales representatives in key regions domestically and internationally.
Our sales channel depends on the type of customer (module manufacturer, OEM, or contract manufacturer), the volume and types of products purchased by the customer, and the regional location of the customer. For larger module manufacturer and OEM customers, we endeavor to sell our products through both our direct sales force and our sales representatives. For sale of products to Asia-based customers, we use a logistics provider and distributor to facilitate local stocking of our products to meet changes in demand, and to facilitate the billing, customs, and duties administration for these transactions. For customers that order less frequently, we use distributors on a worldwide basis as our sales channel. We monitor the purchase levels of the end customers of our distributors, and from time-to-time we may convert these end customers to direct customers to the extent that their unit volume and sales support requirements justify selling to them directly.
We also receive a portion of our net revenue from customer or government sponsored research and development activities, and from wafer services provided to third-parties who develop their own ICs using our UltraCMOS processes, both of which we refer to as “net other revenue.” Research and development activities range from development activities to investigate technological capabilities, in which we receive funded research for IC design techniques or new semiconductor technologies at the request of a customer, to custom development projects in which we are paid to enhance or modify an existing product or develop a new product to meet a customer’s specifications. The amount of this type of net revenue we record in any period is not expected to be significant, and the amount recorded will vary from period to period depending on the timing of third-party development activity opportunities, and the related effort we incur in each period.
Our net revenue has grown rapidly in recent years. The principal driver of our net revenue growth has been increased volume sales of our products, which is attributable to the increasing breadth and diversity of our product offerings, the growing market acceptance of products we introduced in prior periods, and the expansion of our domestic and international sales efforts. Our customers generally do not enter into long-term contracts with us. Our commercial relationships with our customers vary, from single purchases of our products through a distributor to large volume purchases of our products directly from us. Large volume customers provide us with periodic longer term forecasts of their expected needs. These forecasts do not commit the customer to minimum purchases, and generally may be revised without penalty.
43
Table of Contents
A significant portion of our net revenue in each quarter is attributable to purchase orders for products that are received and fulfilled within the same quarter, often including a large number of orders from diverse customers and end markets. Our forecasting of sales of products takes into account a number of factors, including historical sales patterns for each individual product, our assessment of overall market conditions, and our knowledge of the current requirements and purchasing practices of our larger customers.
Although we believe we have multiple opportunities for additional net revenue growth and are planning our business accordingly, our future net revenue levels will be impacted by our ability to achieve design wins with module manufacturers and OEMs, as well as the success of OEM devices that incorporate our products. A large portion of our shipments are made to intermediary manufacturers, such as module manufacturers and contract manufacturers, who incorporate our product into their products, which are in turn sold to OEMs. OEMs have a variety of alternative solutions available to meet their needs, and often diversify their supply chain by ordering products from more than one module or contract manufacturer, and shifting demand between them to achieve cost reductions and performance improvements. As the end markets where our products are used are very competitive, we expect to experience shifts in our net revenue between customers and regions where we ship products, and changes in demand for our products as a result of module manufacturer or OEM changes in designs and supply chain decisions.
Although we have shipped our products to a large number of customers, we have historically depended on a small number of customers for a significant percentage of our annual net revenue. The composition of this group can change from year-to-year. Net revenue derived from our three largest direct customers as a percentage of our annual net revenue was 59% and 68% for the years ended December 25, 2010 and December 31, 2011, respectively, and 60% and 82% for the six months ended June 25, 2011 and June 30, 2012, respectively. Included in these percentages for our three largest direct customers are sales to two of our distributors. Based on records from our distributors of shipments to their customers, net revenue derived from our three largest end customers as a percentage of annual net revenue was 39% and 49% for the years ended December 25, 2010 and December 31, 2011, respectively, and 38% and 67% for the six months ended June 25, 2011 and June 30, 2012, respectively. While the composition of our top customers varies from year-to-year, we expect that shipments to a limited number of customers will continue to account for a significant percentage of our net revenue for the foreseeable future. Our largest customers typically use our products in multiple systems or programs for different OEM end customers, each having differing product life cycles, end users, and market dynamics.
Cost of Net Revenue. Cost of net revenue consists primarily of the cost of purchasing sapphire substrates, wafer processing, and testing and packaging. Cost of net revenue also includes manufacturing related personnel costs, which include stock-based compensation expenses, facilities, supplies and equipment costs, and quality assurance costs.
One of our most important objectives is maintaining and improving our gross margin, which we define as gross profit expressed as a percentage of our net revenue. Our total gross margin in any period can be materially affected by product mix, that is, the percentage of our net revenue in that period that is attributable to higher or lower margin products, and by other factors, some of which are not under our control. Due to these factors, our gross margins have fluctuated from quarter-to-quarter. For example, gross margin declined in the second half of fiscal 2011 due to implementation of new manufacturing processes, product mix, and low yields of certain wafers, which resulted in reductions to the carrying value of inventory as a result of a lower of cost or market valuation.
The factors that can influence the gross margins of any individual product, include the following:
| • | the pricing that the features and performance of our products can command; |
| • | the volume of products produced using the same manufacturing overhead structure for procurement, test, and quality support, and their related costs; |
44
Table of Contents
| • | the competitive pressures on the pricing of our products from similar product offerings from other semiconductor manufacturers; and |
| • | the costs and yields of semiconductor wafers, packages, and other materials used in manufacturing our products; fabrication costs; assembly and test costs; factory equipment utilization; and operating efficiencies. |
Research and Development. Research and development expense consists primarily of personnel-related expenses of our research and development organization, which include stock-based compensation expense, and costs for development wafers and mask sets, license fees for computer-aided design software, costs of development testing and evaluation, and allocated facilities costs. We incur research and development costs for the development of our products and for improvements of our UltraCMOS technology.
Selling, General and Administrative. Selling, general and administrative expense includes personnel-related costs, which include stock-based compensation expense, and sales commissions paid to our independent sales representatives, costs of advertising and corporate marketing promotions, travel costs, professional and consulting fees, legal fees, allocated facilities costs and other corporate expenses.
Interest Income. Interest income consists of interest earned on our cash and cash equivalent balances.
Interest Expense. Interest expense is associated with our borrowings, imputed interest on capital leases and customer deposit financing arrangement, and changes in fair value of warrant liabilities.
Other Income (Expense). Other income (expense) consists of currency gains (losses) on conversion of non-U.S. dollar transactions into U.S. dollars and other income (expense) generated from minor non-operating transactions.
Provision for Income Taxes. The provision for income taxes consists of our estimated federal, state and foreign income taxes based on our pre-tax income. We have recorded a valuation allowance for the full amount of our domestic net deferred tax assets, as the realization of our domestic net deferred tax assets is uncertain.
At December 31, 2011, we have U.S. federal and state NOL carryforwards of approximately $156.6 million and $105.6 million, respectively, after taking into consideration the impact of Code section 382 as discussed below. The federal NOL carryforwards will expire between 2021 and 2029, unless previously utilized. The state NOL carryforwards will expire between 2015 and 2029, unless previously utilized. We have federal and state research tax credit carryforwards of approximately $3.9 million and $5.7 million, respectively, at December 31, 2011. The federal credits will begin to expire in 2024. The state credits do not expire.
Pursuant to Sections 382 and 383 of the Code, annual use of our NOL and research and development tax credit carryforwards may be limited in the event a cumulative change in ownership of 50% of certain stockholders occurs within a three year period. An ownership change may limit the amount of NOL and research and development tax credit carryforwards that can be utilized annually to offset future taxable income and tax, respectively. In general, an “ownership change” as defined by Section 382 of the Code results from a transaction or series of transactions over a three-year period resulting in an ownership change of more than 50 percentage points of the outstanding stock of a company by certain stockholders.
We completed a study to assess whether an ownership change has occurred since our formation through December 25, 2010. There were no significant transactions that would be expected to effect ownership changes during the year ended December 31, 2011 or the six months ended June 30, 2012. Based on this study, we concluded that we incurred ownership changes on September 29, 2000, August 2, 2002, and October 20, 2004. As a result of these changes, we expect the following tax attributes to expire unused: approximately $52.2 million in federal NOL carryforwards; approximately $17.5 million of state NOL carryforwards; and approximately $3.0 million of federal research tax credit carryforwards. These tax attributes have been excluded
45
Table of Contents
from the U.S. federal and state NOL carryforwards and federal and state research tax credit carryforwards discussed above. Of our $156.6 million in federal NOL available as of December 31, 2011, $136.0 million in losses were available for immediate use and $1.6 million will be available each year from 2012 through 2024. Our state NOL carryforwards consist of $73.4 million for California and $32.3 million for various other states. Of our $73.4 million in California state NOL carryforwards available as of December 31, 2011, $62.3 million in losses available for immediate use and $1.6 million will be available each year from 2012 through 2018. All of our $32.3 million in non-California state NOL carryforwards were available for immediate use as of December 31, 2011. Future ownership changes may further limit our ability to utilize our remaining tax attributes.
Critical Accounting Policies and Estimates
Our consolidated financial statements and related notes included elsewhere in this prospectus are prepared in accordance with U.S. generally accepted accounting principles. The preparation of these consolidated financial statements requires management to make estimates and assumptions that affect the reported amounts of assets, liabilities, net revenue, and expenses, and any related disclosures. We base our estimates on historical experience and on various other assumptions that we believe to be reasonable under the circumstances. Changes in accounting estimates are reasonably likely to occur from period to period. Accordingly, actual results could differ significantly from the estimates made by our management. We evaluate our estimates and assumptions on an ongoing basis. To the extent that there are material differences between these estimates and our actual results, our future financial statement presentation, financial condition, results of operations, and cash flows will be affected.
We believe that the following accounting policies involve a greater degree of judgment and complexity than our other accounting policies. Accordingly, these are the policies we believe are the most critical to understanding and evaluating our consolidated financial condition and results of operations.
Revenue Recognition
Our net revenue is primarily generated from sales of RFICs. We recognize net revenue when each of the following have occurred: (1) there is persuasive evidence that an arrangement with our customer exists, which is generally a customer purchase order; (2) the products are delivered, which generally occurs when the products are shipped and risk of loss has been transferred to the customer; (3) the selling price is fixed or determinable; and (4) collection of the customer receivable is deemed reasonably assured.
We record revenue based on facts available at the time of sale. Amounts that are not probable of collection once the product has shipped and title has transferred to the customer are deferred until the amount that is probable of collection can be determined. Items that are considered when determining the amounts that will be ultimately collected are the customer’s overall creditworthiness and payment history.
For distributors with rights of return, revenue is not recognized until product is shipped to the end customer of the distributor and the amount that will ultimately be collected is determinable. On shipments where net revenue is not recognized, we record an accounts receivable and deferred net revenue for the selling price as there is a legally enforceable right to payment. Inventory at distributors remains on our books at carrying value until sold by the distributor at which time we recognize the net revenue and cost of net revenue.
We record reductions of revenue for estimated product returns in the same period that the related revenue is recorded. The amount of these reductions is based on historical sales returns, analysis of credit memo data, and other factors known at the time. Additional reductions of revenue would result if actual product returns exceed our estimates. To date, product returns have not been significant.
We offer our distributors rights of return, price protection, and in some situations, credits on pricing depending on their end customer (ship and debit credits). For these distributors revenue is not recognized until product is shipped to the end customer of the distributor and the amount that will ultimately be collected is
46
Table of Contents
determinable. On shipments where net revenue is not recognized, we record an accounts receivable and deferred net revenue for the selling price as there is a legally enforceable right to payment. Inventory at distributors remains on our books at carrying value until sold by the distributor at which time we recognize the net revenue and cost of net revenue. Revenues to these distributors are recorded net of any pricing adjustments for price protection or ship and debit credits in the same period as the sale of goods to their customers. The amount of any pricing adjustment is based on the difference between the price at which the distributor originally purchased our inventory and either: (1) a lower distribution price then being offered on those products for price protection; or (2) a special price offered to the distributor in order to meet competitive pressures in the marketplace for ship and debit credits. We do not currently offer rebates or other pricing incentives, except for volume purchase pricing at the time of sale, to direct customers or distributors.
We also maintain an allowance for doubtful accounts for estimated losses resulting from the inability of customers to make required payments. If the financial condition of any customer were to deteriorate, resulting in an impairment of its ability to make payments, additional allowances could be required.
We record net revenue for cost reimbursable service contracts as the services are performed. On a limited basis, certain of our net revenue arrangements include additional elements, such as future product deliveries or services. Judgment is required to properly identify the accounting units of the multiple deliverable transactions and to determine the manner in which revenue should be allocated among the accounting units. When we enter into an arrangement that includes multiple elements, the allocation of value to each element is derived based on management’s best estimate of selling price when vendor specific evidence or third party evidence is unavailable.
Vendor Consideration Received
In certain situations we enter into license agreements related to our UltraCMOS technology simultaneously with foundry agreements with outsourced manufacturers. When we receive consideration for the license and cannot sufficiently separate the identifiable benefit attributable to the license or reasonably estimate the fair value of the license provided from the inventory purchases, we classify the consideration received as a reduction to cost of net revenues over the period that the consideration is earned.
Inventory Valuation
We continually assess the recoverability of our inventory based on assumptions about demand and market conditions. Forecasted demand is determined based on historical sales and expected future sales. We value our inventory at the lower of cost or market value, with cost determined on a first-in, first-out basis. We reduce our inventory to the estimated lower of cost or market value to account for its obsolescence or lack of marketability. Reductions are calculated as the difference between the cost of inventory and the estimated market value based upon assumptions about future demand and market conditions. Determination of the market value may be complex, and therefore requires management to make assumptions and to apply judgment. In order for management to make the appropriate determination of market value, the following items are commonly considered: inventory turnover statistics; inventory quantities on hand in our facilities and customer inventories; unfilled customer order quantities; forecasted customer demand; competitive pricing; seasonality factors; consumer trends; and performance of similar products or accessories. Subsequent changes in facts or circumstances do not result in the reversal of previously recorded reserves. If actual market conditions are less favorable than those projected by management, additional inventory write-downs may be required that may adversely affect our operating results. If actual market conditions are more favorable, we may have higher gross profits when products are sold.
Warranty Accrual
We generally provide a warranty on our products for a period of one year; however, it may be longer for certain customers. Accordingly, we establish provisions for estimated product warranty costs at the time net revenue is recognized based upon our historical activity and, additionally, for any known product warranty
47
Table of Contents
issues. Warranty provisions are recorded as a cost of net revenue. The determination of such provisions requires us to make estimates of product return rates and expected costs to replace or rework the products under warranty. When the actual product failure rates, cost of replacements and rework costs differ from our estimates, revisions to the estimated warranty accrual are made. Actual claims are charged against the warranty reserve.
Income Taxes
We account for income taxes under the asset and liability approach. We record a valuation allowance to reduce our deferred tax assets to the amount we believe is more likely than not to be realized. In assessing the need for a valuation allowance, we consider all positive and negative evidence, including scheduled reversals of deferred tax liabilities, projected future taxable income, tax planning strategies, and recent financial performance. Forming a conclusion that a valuation allowance is not required is difficult when there is negative evidence such as cumulative losses in recent years. As a result of our cumulative losses in the U.S., we have concluded that a full valuation allowance against our net deferred tax assets is appropriate. In foreign jurisdictions we do not have cumulative losses, and we have not recorded a valuation allowance to reduce our net deferred tax assets. Realization of our deferred tax assets is dependent primarily upon our future U.S. taxable income. Our judgments regarding our future profitability may change due to the trend of our operating results, future market conditions, changes in U.S. or international tax laws, and other factors. These changes, if any, may require possible material adjustments to these deferred tax assets, resulting in a reduction in net income or an increase in net loss in the period when such determinations are made.
We are subject to income taxes in the U.S. and foreign countries, and are subject to routine corporate income tax audits in many of these jurisdictions. We believe that our tax return positions are fully supported, but tax authorities could challenge certain positions, which may not be fully sustained. However, our income tax expense includes amounts intended to satisfy income tax assessments that result from these challenges. Determining the income tax expense for these potential assessments and recording the related assets and liabilities requires management judgment and estimates. We believe that our provision for uncertain tax positions, including related interest and penalties, is adequate based on information currently available to us. The amount ultimately paid upon resolution of audits could be materially different from the amounts previously included in income tax expense and therefore could have a material impact on our tax provision, net income and cash flows. Our overall provision requirement could change due to the issuance of new regulations or new case law, negotiations with tax authorities, resolution with respect to individual audit issues, or the entire audit, or the expiration of statutes of limitations.
Stock-Based Compensation
We measure stock-based compensation cost at the grant date, based on the estimated fair value of the award. The fair value of each option award is estimated on the date of grant using the Black-Scholes option pricing model. The Black-Scholes option pricing model requires us to estimate certain key assumptions including future stock price volatility, expected term of the options, risk free interest rates, and dividend yields. The resulting cost is recognized over the period during which the employee is required to provide services in exchange for the award, which is usually the vesting period. We recognize compensation expense over the vesting period using the straight-line method and classify these amounts in the statement of operations based on the department to which the related employee is assigned.
Stock options issued to non-employees are accounted for at their estimated fair value determined using the Black-Scholes option pricing model. The fair value of options granted to non-employees is re-measured as they vest, and the resulting increase in value, if any, is recognized as expense during the period the related services are rendered.
48
Table of Contents
For each of the years ended December 25, 2010 and December 31 2011, and the six months ended June 25, 2011 and June 30, 2012, we estimated the grant date fair value of stock options using the Black-Scholes option pricing model with the following weighted-average assumptions:
| Fiscal Year Ended | Six Months Ended | |||||||||||||||
| December
25, 2010 |
December 31, 2011 |
June 25, 2011 |
June 30, 2012 |
|||||||||||||
| (unaudited) | ||||||||||||||||
| Risk-free interest rate |
2.07 | % | 1.26 | % | 2.37 | % | 0.84 | % | ||||||||
| Dividend yield |
— | — | — | — | ||||||||||||
| Expected term (years) |
6.08 | 5.24 | 6.08 | 5.00 | ||||||||||||
| Volatility |
60 | % | 61 | % | 59 | % | 62 | % | ||||||||
We based our expected volatility on the expected volatilities of a peer group of public companies within the semiconductor industry that are similar except for having publicly traded securities. When making the selections of our industry peer companies to be used in our expected volatility determination, we also considered the stage of development, size, and financial leverage of such peer companies.
We calculated the weighted-average expected term using the SEC Staff’s Simplified Method for options granted through September 2011. In October 2011 we revised our estimates to utilize data of peer companies to determine the weighted average life. We believe this change in estimate more accurately reflects the expected term of our options by basing the estimate on the specific experience of our peers.
We derived the risk-free interest rate assumption from the yield as of the grant date for U.S. Treasury zero-coupon bonds with maturities similar to those of the expected term of the award being valued. We based the assumed dividend yield on the expectation that we will not pay cash dividends in the foreseeable future.
We estimated forfeitures at the time of grant and will revise these estimates, if necessary, in subsequent periods if actual forfeitures differ from those estimates. We utilized our historical forfeiture rates to estimate our future forfeiture rate at 2% for 2010 and through September 2011 and 3% starting in October 2011. We will continue to evaluate the appropriateness of estimating the forfeiture rate based on actual forfeiture experience, analysis of employee turnover behavior, and other factors. Quarterly changes in the estimated forfeiture rate can have a significant effect on stock-based compensation expense as the cumulative effect of adjusting the rate for all stock-based compensation expense amortization is recognized in the period the forfeiture estimate is changed. If a revised forfeiture rate is higher than the previously estimated forfeiture rate, an adjustment is made that will result in a decrease to the stock-based compensation expense recognized in the consolidated financial statements. If a revised forfeiture rate is lower than the previously estimated forfeiture rate, an adjustment is made that will result in an increase to the stock-based compensation expense recognized in the consolidated financial statements. The effect of forfeiture adjustments during fiscal 2010 and 2011 was insignificant. We will continue to use judgment in evaluating the expected term, volatility, and forfeiture rate related to our stock-based compensation on a prospective basis and incorporating these factors in the Black-Scholes option pricing model.
If in the future we determine that other methods are more reasonable, or other methods for calculating these assumptions are prescribed by authoritative guidance, the fair value calculated for our stock options could change significantly. Higher volatility and longer expected award lives result in an increase to stock-based compensation expense determined at the date of grant. Stock-based compensation expense affects our cost of net revenue research and development expense, and our selling, general and administrative expense.
In order to determine the grant date fair value of stock options, we are required to estimate the fair value of our common stock. The exercise price for all stock options granted was at or above the estimated fair value of the underlying common stock as determined on the date of grant by our board of directors.
49
Table of Contents
The following table summarizes, by quarter, the number of stock options granted since December 26, 2009 and the associated per share exercise price, and per share fair value of our common stock as determined by our board of directors, with input from management, during each of these quarters:
| Grant During the Quarter Ended |
Number of Options Granted |
Exercise Price Per Share |
Fair Value Per Share |
|||||||||
| March 27, 2010 |
134,319 | $ | 5.73 | $ | 5.73 | |||||||
| June 26, 2010 |
242,220 | $ | 6.61 | $ | 6.61 | |||||||
| September 25, 2010 |
998,574 | $ | 7.12 | $ | 7.12 | |||||||
| December 25, 2010 |
137,605 | $ | 8.95 | $ | 8.95 | |||||||
| March 26, 2011 |
61,025 | $ | 8.95 | $ | 8.95 | |||||||
| June 25, 2011 |
98,077 | $ | 8.95 | $ | 8.95 | |||||||
| September 24, 2011 |
138,134 | $ | 9.76 | $ | 9.76 | |||||||
| December 31, 2011 |
1,051,924 | $ | 9.76 | $ | 8.66 | |||||||
| March 31, 2012 |
48,899 | $ | 10.13 | $ | 10.13 | |||||||
| June 30, 2012 |
236,550 | $ | 14.02 | $ | 14.02 | |||||||
Given the absence of an active trading market for our common stock, our board of directors was required to estimate the fair value of our common stock at the time of each grant, with the assistance of management. Our board of directors, which includes members who are experienced in valuing securities, considered objective and subjective factors in determining the estimated fair value of our common stock on each option grant date. Factors considered by our board of directors included the following:
| • | the price of our convertible preferred stock sold to outside investors in arm’s-length transactions; |
| • | the rights, preferences, and privileges of our convertible preferred stock relative to those of our common stock; |
| • | our operating and financial performance; |
| • | general economic outlook and specific industry conditions; |
| • | our actual financial condition and results of operations relative to our formal operating plan during the relevant period, as well as forecasts of our financial results; |
| • | the range of market multiples of comparable companies; |
| • | the fact that option grants involve illiquid securities in a private company; |
| • | the risks inherent in the development of our products and in the expansion of our target markets; |
| • | contemporaneous independent valuations performed at periodic intervals; and |
| • | the likelihood of achieving a liquidity event, such as an initial public offering or sale of our company, given prevailing market conditions. |
At the date of each option grant, our board of directors determined that the exercise price for each option was equivalent to or above the then-existing fair value of our common stock. During the quarter ended December 31, 2011, after considering the factors identified above our board of directors concluded that the per share fair value of our common stock was $8.66. Our board of directors decided to maintain the per share exercise price of $9.76 from the quarter ended September 24, 2011 for stock options granted during the quarter ended December 31, 2011.
Starting in February 2006, our board of directors has also considered a number of different factors, including contemporaneous valuations of our common stock for purposes of granting stock options in a manner consistent with the methods outlined in the American Institute of Certified Public Accountants Practice Aid, Valuation of Privately-Held-Company Equity Securities Issued as Compensation.
50
Table of Contents
Since August 2006, we considered a probability-weighted expected return method, or PWERM, to estimate the value of the common stock. This valuation method was considered to be most appropriate given the status of our business and the anticipated liquidity events. Under the PWERM method, management assigned probabilities and timing estimates to potential liquidity events for us based on a variety of factors, including primarily our recent operating history, the amount of cash held by us, and the preferences held by the preferred stock relative to our common stock. Three principal scenarios were examined: a merger or acquisition, or M&A, scenario; an initial public offering, or IPO, scenario; and a scenario in which the company continues to operate as a private entity. For each valuation date, we prepared a financial forecast to be used in the computation of the enterprise value. The financial forecasts took into account our past experience and future expectations.
| • | To arrive at a value for common shares under the M&A scenario and the IPO scenario, the Guideline Public Company Method was used to estimate our total shareholder value at the time of the respective anticipated liquidity event. The Guideline Public Company Method estimates the fair value of a company by applying to that company market revenue multiples of publicly traded firms in similar lines of business. When choosing the comparable companies to be used for the Guideline Public Company Method, we focused on companies in the semiconductor industry. Some of the specific criteria we used to select and analyze comparable companies within our industry included the business description, business size, projected growth, financial condition, and historical operating results. We analyzed the business and financial profiles of the selected companies for relative similarity to us, and once such differences and similarities were determined and proper adjustments were made, we selected an appropriate total shareholder value revenue multiple for us. This revenue multiple was applied to the trailing twelve months’ revenue at the time of the anticipated future liquidity event to arrive at our anticipated total shareholder value at the time of the respective liquidity event. The total shareholder value was then allocated amongst share classes based on the amount of liquidation preferences, and the resulting equity values were discounted to the present using a discount rate which accounted for the market cost of capital and risk. |
| • | To estimate the value of the common shares under the continuing to operate as a private company scenario, we used two approaches: a Guideline Public Company Method and a Discounted Cash Flow approach. The Guideline Public Company Method, as discussed previously, was applied at the valuation date to estimate the total shareholder value of the company at the present. Under the Discounted Cash Flow approach, we analyzed the forecast of our expected future financial performance, and discounted those to a present value using an appropriate discount rate which reflected the then-current company’s cost of capital. We weighed the total shareholder values determined by the Guideline Public Company Method and the Discounted Cash Flow approach to arrive at a single enterprise value for the continuing to operate as a private company scenario. Subsequently, we apportioned this total shareholder value to the various share classes, based on their respective liquidation preferences, to arrive at a value for the common shares under the continuing to operate as a private company scenario. Finally, we applied a marketability discount to reflect the fact that our common stockholders were unable to liquidate their holdings at will, or possibly at all, which resulted in a value for the common shares under the continuing to operate as a private entity scenario. |
| • | Lastly, we probability-weighed the common shareholder values under each of the scenarios to arrive at an indication of value for our common equity. |
The factors described above were considered by our board of directors each time it determined the fair value of our common stock. The following additional factors had particular relevance in connection with the board of directors’ determination during each of the following periods:
December 27, 2009 — March 27, 2010: $5.73 per share fair value
| • | Improvement by the last quarter of fiscal 2009 and first quarter of fiscal 2010 of general macroeconomic conditions as the U.S. economy and global financial markets began to recover and capital and debt markets continued to improve; |
51
Table of Contents
| • | continued improvement in our financial performance, as reflected by the establishment of a low but stable level of profitability and general stabilizing of net revenue; |
| • | our updated company financial outlook reflecting expected net revenue growth and profitability improvement; |
| • | updated liquidity scenarios, including increased likelihood of our undertaking a public offering during the last quarter of fiscal 2010 or the first two quarters of fiscal 2011; and |
| • | the most recent independent contemporaneous valuation report as of December 31, 2009. |
March 28, 2010 — June 26, 2010: $6.61 per share fair value
| • | The slowing pace of the general recovery of the U.S. economy and global financial markets relative to the rate of improvement during the last quarter of fiscal 2009; |
| • | an improved initial public offering market for private semiconductor companies; |
| • | a consistent financial outlook for our business relative to our outlook three months earlier; and |
| • | the most recent independent contemporaneous valuation report as of March 31, 2010. |
June 27, 2010 — September 25, 2010: $7.12 per share fair value
| • | A decline in peer company valuations, resulting from general concerns about the U.S. economy and global financial markets during the second quarter of fiscal 2010; |
| • | a reduction in our financial projections based on the slower than expected short-term ramp of net revenue, and expected delays in additional net revenue from new customers; |
| • | continued possibility of our commencing the process of undertaking a public offering in the last quarter of 2010; and |
| • | the most recent independent contemporaneous valuation report as of June 26, 2010. |
September 26, 2010 — December 25, 2010: $8.95 per share fair value
| • | Increased likelihood of commencing a public offering in 2011; |
| • | consistent financial outlook for our business; and |
| • | the most recent independent contemporaneous valuation report as of September 25, 2010. |
December 26, 2010 — March 26, 2011: $8.95 per share fair value
| • | A reduction in our financial projections based on slower than expected short-term ramp of net revenue; |
| • | increased valuations of our peer companies; |
| • | updated liquidity scenarios which reflected an increased likelihood of a delay in the possible timing of potential liquidity events during the second half of fiscal 2011; and |
| • | the most recent independent contemporaneous valuation report as of January 31, 2011. |
March 27, 2011 — June 25, 2011: $8.95 per share fair value
| • | Consistent valuations of our peer companies; |
| • | a slight reduction in the financial outlook for our business; |
| • | updated liquidity scenarios which reflected potential liquidity events during the second half of fiscal 2011; and |
| • | the most recent independent contemporaneous valuation report as of March 26, 2011. |
52
Table of Contents
June 26, 2011 — September 24, 2011: $9.76 per share fair value
| • | Updated liquidity scenarios which reflected liquidity events taking place at a later stage of our revenue ramp up; |
| • | consistent financial outlook for our business; |
| • | consistent valuations of our peer companies; and |
| • | the most recent independent contemporaneous valuation report as of June 25, 2011. |
September 25, 2011 — December 31, 2011: $8.66 per share fair value
| • | Reduced valuations of our peer companies; |
| • | updated liquidity scenarios which reflected a reduced likelihood of commencing a public offering in 2011 or during the first half of fiscal 2012; |
| • | a reduction in our financial projections based on slower than expected revenue growth; and |
| • | the most recent independent contemporaneous valuation report as of September 24, 2011. |
January 1, 2012 — March 31, 2012: $10.13 per share fair value
| • | An increase in our financial projections based on our growing net revenue; |
| • | a slight reduction in valuations of our peer companies; |
| • | updated liquidity scenarios which reflected a consistent likelihood of commencing a public offering in fiscal 2012; and |
| • | the most recent independent contemporaneous valuation report as of December 31, 2011. |
April 1, 2012 — June 30, 2012: $14.02 per share fair value
| • | An increase in our financial projections based on our growing net revenue; |
| • | increased valuations of our peer companies; |
| • | updated liquidity scenarios which reflected a consistent likelihood of commencing a public offering in fiscal 2012; and |
| • | the most recent independent contemporaneous valuation report as of March 31, 2012. |
Our calculations are sensitive to highly subjective assumptions that we were required to make at each valuation date relating to an appropriate present value discount rate. The following table summarizes these assumptions at the end of each quarter since December 26, 2009:
| Valuation Date |
Present Value Discount Rate |
|||
| March 27, 2010 |
29 | % | ||
| June 26, 2010 |
29 | % | ||
| September 25, 2010 |
28 | % | ||
| December 25, 2010 |
28 | % | ||
| March 26, 2011 |
25 | % | ||
| June 25, 2011 |
22 | % | ||
| September 24, 2011 |
22 | % | ||
| December 31, 2011 |
21 | % | ||
| March 31, 2012 |
20 | % | ||
| June 30, 2012 |
18 | % | ||
53
Table of Contents
Our present value discount rate was determined using a Capital Asset Pricing Model, or CAPM. The discount rate was based on an analysis of comparable companies in the semiconductor industry. We also compared the results of the CAPM discount rate to discount rates published in various studies of venture capital required rated of return for investments in companies of an equivalent stage of development.
Determining the fair market value of our common stock involves complex and subjective judgments including estimates of revenue, assumed market growth rates and estimated costs, as well as appropriate discount rates. At the time of each valuation, the significant estimates used in the discounted cash flow approach included estimates of our revenue and revenue growth rates for several years into the future. Although each time we prepared such forecasts for use in the preparation of a valuation report, we did so based on assumptions that we believed to be reasonable and appropriate, there can be no assurance that any such estimates for earlier periods or for future periods will prove to be accurate. There is also significant volatility in the semiconductor industry. Our valuations incorporate the volatility in the markets based on the Guideline Public Company Method described above. We also experience fluctuations in our own financial forecasts on a quarter to quarter basis which impacts the related valuations.
As a result of our fair value calculations using Black-Scholes option pricing model and the allocation of value to the vesting periods using the straight-line vesting attribution method, we recognized employee stock-based compensation in the statements of operations as follows:
| Fiscal Year Ended | Six Months Ended | |||||||||||||||
| December 25, 2010 |
December 31, 2011 |
June 25, 2011 |
June 30, 2012 |
|||||||||||||
| (unaudited) | ||||||||||||||||
| (in thousands) | ||||||||||||||||
| Cost of net revenue |
$ | 407 | $ | 431 | $ | 208 | $ | 271 | ||||||||
| Research and development |
556 | 762 | 332 | 567 | ||||||||||||
| Selling, general and administrative |
1,554 | 1,891 | 943 | 1,126 | ||||||||||||
|
|
|
|
|
|
|
|
|
|||||||||
| Total |
$ | 2,517 | $ | 3,084 | $ | 1,483 | $ | 1,964 | ||||||||
|
|
|
|
|
|
|
|
|
|||||||||
The total compensation cost related to unvested stock option grants not yet recognized as of June 30, 2012 was $8.8 million, and the weighted-average period over which these grants are expected to vest is 2.1 years.
Based on an assumed initial public offering price of $ per share, the midpoint of the initial public offering price range reflected on the cover page of this prospectus, the intrinsic value of stock options outstanding at June 30, 2012 was $ million, of which $ million and $ million related to stock options that were vested and unvested, respectively, at that time.
Fair Value of Warrants to Purchase Convertible Preferred Stock and Common Stock
We classify outstanding warrants to purchase shares of our convertible preferred stock and our estimate of warrants issuable to purchase common stock as other long-term liabilities and adjust their carrying values to fair value at the end of each reporting period. The value of each warrant is determined using the Black-Scholes valuation model which has a number of variables including risk-free interest rates, volatility, remaining contractual warrant term and the fair value of our common stock. Our board of directors estimates the fair value of the underlying common stock by evaluating and considering a number of objective and subjective factors. There is inherent uncertainty in these estimates and the valuation of each warrant is sensitive to movements in the underlying value of our stock. If we had made different assumptions and estimates, the fair value amounts recorded for our warrants could have been materially different.
Accounting Periods
We use a 52- or 53-week fiscal year ending on the last Saturday in December. Fiscal 2010 was a 52-week year ending on December 25, 2010. Fiscal year 2011 was a 53-week year ending on December 31, 2011. Our first six months for fiscal year 2011 and 2012 were 26-week periods ending on June 25, 2011 and June 30, 2012, respectively. Fiscal year 2012 will be a 52-week year ending on December 29, 2012.
54
Table of Contents
Results of Operations
The following table sets forth, for the periods indicated, certain statements of operations data (in thousands). Our historical results are not necessarily indicative of our results of operations to be expected for any future period.
| Fiscal Year Ended | Six Months Ended | |||||||||||||||
| December 25, 2010 |
December 31, 2011 |
June 25, 2011 |
June 30, 2012 |
|||||||||||||
| (unaudited) | ||||||||||||||||
| Net revenue |
$ | 91,071 | $ | 107,771 | $ | 45,729 | $ | 80,334 | ||||||||
| Cost of net revenue |
49,520 | 70,955 | 26,720 | 52,858 | ||||||||||||
|
|
|
|
|
|
|
|
|
|||||||||
| Gross profit |
41,551 | 36,816 | 19,009 | 27,476 | ||||||||||||
|
|
|
|
|
|
|
|
|
|||||||||
| Operating expense: |
||||||||||||||||
| Research and development |
18,040 | 22,730 | 10,248 | 14,163 | ||||||||||||
| Selling, general and administrative |
18,889 | 23,252 | 10,812 | 15,193 | ||||||||||||
|
|
|
|
|
|
|
|
|
|||||||||
| Total operating expense |
36,929 | 45,982 | 21,060 | 29,356 | ||||||||||||
|
|
|
|
|
|
|
|
|
|||||||||
| Income (loss) from operations |
4,622 | (9,166 | ) | (2,051 | ) | (1,880 | ) | |||||||||
| Interest income |
13 | 7 | 5 | 42 | ||||||||||||
| Interest expense |
(610 | ) | (318 | ) | (185 | ) | (1,076 | ) | ||||||||
| Other income (expense), net |
(118 | ) | (9 | ) | 61 | (80 | ) | |||||||||
|
|
|
|
|
|
|
|
|
|||||||||
| Income (loss) before income taxes |
3,907 | (9,486 | ) | (2,170 | ) | (2,994 | ) | |||||||||
| Provision for income taxes |
147 | 196 | 125 | 74 | ||||||||||||
|
|
|
|
|
|
|
|
|
|||||||||
| Net income (loss) |
$ | 3,760 | $ | (9,682 | ) | $ | (2,295 | ) | $ | (3,068 | ) | |||||
|
|
|
|
|
|
|
|
|
|||||||||
The following table sets forth, for the periods indicated, certain statements of operations data as a percentage of net revenue. Our historical results are not necessarily indicative of our results of operations to be expected for any future period.
| Fiscal Year Ended | Six Months Ended | |||||||||||||||
| December 25, 2010 |
December 31, 2011 |
June 25, 2011 |
June 30, 2012 |
|||||||||||||
| (unaudited) | ||||||||||||||||
| Net revenue |
100 | % | 100 | % | 100 | % | 100 | % | ||||||||
| Cost of net revenue |
54 | 66 | 58 | 66 | ||||||||||||
|
|
|
|
|
|
|
|
|
|||||||||
| Gross margin |
46 | 34 | 42 | 34 | ||||||||||||
|
|
|
|
|
|
|
|
|
|||||||||
| Operating expense: |
||||||||||||||||
| Research and development |
20 | 21 | 22 | 18 | ||||||||||||
| Selling, general and administrative |
21 | 22 | 24 | 19 | ||||||||||||
|
|
|
|
|
|
|
|
|
|||||||||
| Total operating expense |
41 | 43 | 46 | 37 | ||||||||||||
|
|
|
|
|
|
|
|
|
|||||||||
| Income (loss) from operations |
5 | (9 | ) | (4 | ) | (3 | ) | |||||||||
| Interest income |
— | — | — | — | ||||||||||||
| Interest expense |
(1 | ) | — | (1 | ) | (1 | ) | |||||||||
| Other income (expense), net |
— | — | — | — | ||||||||||||
|
|
|
|
|
|
|
|
|
|||||||||
| Income (loss) before income taxes |
4 | (9 | ) | (5 | ) | (4 | ) | |||||||||
| Provision for income taxes |
— | — | — | — | ||||||||||||
|
|
|
|
|
|
|
|
|
|||||||||
| Net income (loss) |
4 | % | (9 | )% | (5 | )% | (4 | )% | ||||||||
|
|
|
|
|
|
|
|
|
|||||||||
55
Table of Contents
Comparison of the Six Months Ended June 25, 2011 and June 30, 2012
Net Revenue
| Six Months Ended | ||||||||||||
| June 25, 2011 |
June 30, 2012 |
% Change | ||||||||||
| (unaudited) | ||||||||||||
| (in thousands) | ||||||||||||
| Product net revenue |
$ | 43,621 | $ | 80,255 | 84 | % | ||||||
| Other net revenue |
2,108 | 79 | (96 | )% | ||||||||
|
|
|
|
|
|||||||||
| Total net revenue |
$ | 45,729 | $ | 80,334 | 76 | % | ||||||
|
|
|
|
|
|||||||||
A significant portion of our net revenue results from the sale of our antenna and broadband and general purpose RF switches used in mobile wireless device, wireless infrastructure, broadband, industrial and other markets. The balance of our product sales being derived from digital attenuators, synthesizers, mixers / upconverters, and prescalers used in broadband, industrial, wireless infrastructure, test and measurement equipment, and aerospace and defense markets. For the six months ended June 30, 2012, our product net revenue increased by $36.6 million, or 84% compared to the same period in fiscal 2011. Product net revenue from switches used in handset antenna applications increased by $36.2 million compared to the same period in fiscal 2011, as products sold through one of our distributors for Asia (Macnica) significantly increased. This increase in volume of our antenna switches resulted mainly from additional design wins by a module manufacturer (Murata) who incorporates our products into its modules which are then sold to OEMs. Product net revenue also increased by $2.9 million from sales of antenna and broadband switches used in broadband applications due to increased shipments through North American distributors. This increase was partially offset by reduced net revenue for synthesizers of $2.5 million due to less products sold into aerospace and defense markets.
Other net revenue for the six months ended June 30, 2012 decreased by $2.0 million compared to the same period in fiscal 2011, primarily due the completion of a government research and development contract in the second quarter of fiscal 2011.
We market and sell our products worldwide. We attribute net revenue to the geographic region where the customer, or its business unit that makes the purchase, is based. Our net revenue by geographic region for the periods indicated was as follows:
| Six Months Ended | ||||||||||||||||
| June 25, 2011 | June 30, 2012 | |||||||||||||||
| (unaudited) | ||||||||||||||||
| (in thousands) | ||||||||||||||||
| United States |
$ | 17,998 | 39 | % | $ | 16,403 | 20 | % | ||||||||
| Japan |
15,769 | 34 | 52,630 | 66 | ||||||||||||
| Germany |
1,582 | 3 | 1,414 | 2 | ||||||||||||
| All others |
10,380 | 24 | 9,887 | 12 | ||||||||||||
|
|
|
|
|
|
|
|
|
|||||||||
| $ | 45,729 | 100 | % | $ | 80,334 | 100 | % | |||||||||
|
|
|
|
|
|
|
|
|
|||||||||
Cost of Net Revenue and Gross Profit
| Six Months Ended | ||||||||||||
| June 25, 2011 |
June 30, 2012 |
% Change | ||||||||||
| (unaudited) | ||||||||||||
| (in thousands) | ||||||||||||
| Cost of net revenue |
$ | 26,720 | $ | 52,858 | 98 | % | ||||||
| % of net revenue |
58 | % | 66 | % | ||||||||
| Gross profit |
$ | 19,009 | $ | 27,476 | 45 | % | ||||||
| % of net revenue |
42 | % | 34 | % | ||||||||
56
Table of Contents
Cost of net revenue for the six months ended June 30, 2012 increased by $26.1 million compared to the same period in fiscal 2011 primarily due to increased product cost. We incurred higher product cost due to the implementation of new manufacturing processes in fiscal 2011 and higher volume. Gross margin for the six months ended June 30, 2012 decreased to 34% from 42% compared to the same period in fiscal 2011. The gross margin decline of 8% was mainly due to increased product cost and a change in the mix of products sold. Our product cost was negatively impacted by lower than anticipated yields and expedite fees in the new manufacturing processes. We expect our gross margin will fluctuate from quarter to quarter in the future based on changes in the mix of products we sell, the impact of competitive pricing pressure, variations in our manufacturing costs, or market volatility leading to fluctuations in the volumes we ship.
Included in our cost of net revenue are costs related to our other net revenue of $1.5 million for the six months ended June 25, 2011. Costs related to other net revenue for the six months ended June 30, 2012 decreased by $1.5 million compared to the same period in fiscal 2011 mainly due to lower activity in 2012 and the completion of a government research and development contract in the second quarter of fiscal 2011, for which we include the cost of performing the contracted activity in cost of net revenue.
Research and Development
| Six Months Ended | ||||||||||||
| June 25, 2011 |
June 30, 2012 |
% Change | ||||||||||
| (unaudited) | ||||||||||||
| (in thousands) | ||||||||||||
| Research and development |
$ | 10,248 | $ | 14,163 | 38 | % | ||||||
| % of net revenue |
22 | % | 18 | % | ||||||||
Research and development expense for the six months ended June 30, 2012 increased by $3.9 million compared to the same period in fiscal 2011. The increase was in part due to increased compensation expense of $1.3 million as a result of higher headcount. Other non-personnel related research and development expenditures increased by $2.6 million due to the number of new product development and existing product enhancement initiatives undertaken during the six months ended June 30, 2012. We expect our research and development expense to increase in absolute dollars as we continue to expand our product portfolio, enhance existing products, and improve our UltraCMOS technology.
Selling, General and Administrative
| Six Months Ended | ||||||||||||
| June 25, 2011 |
June 30, 2012 |
% Change | ||||||||||
| (unaudited) | ||||||||||||
| (in thousands) | ||||||||||||
| Selling, general and administrative |
$ | 10,812 | $ | 15,193 | 41 | % | ||||||
| % of net revenue |
24 | % | 19 | % | ||||||||
Selling, general and administrative expense for the six months ended June 30, 2012 increased by $4.4 million compared to the same period in fiscal 2011. The increase was in part attributable to additional compensation costs of $1.6 million mainly as a result of an increase in sales headcount compared to the prior year period. Other increases included additional professional fees of $1.6 million and a number of other smaller increases. We expect our selling, general and administrative expense to increase in absolute dollars in the future as we add sales, finance, and administrative personnel and as we incur incremental expense associated with being a public company.
57
Table of Contents
Other Income (Expense)
| Six Months Ended | ||||||||
| June 25, 2011 |
June 30, 2012 |
|||||||
| (unaudited) | ||||||||
| (in thousands) | ||||||||
| Interest income |
$ | 5 | 42 | |||||
| Interest expense |
$ | (185 | ) | $ | (1,076 | ) | ||
| Other income (expense), net |
$ | 61 | $ | (80 | ) | |||
Interest expense for the six months ended June 30, 2012 increased by $0.9 million compared to the same period in fiscal 2011 mainly due to the change in fair value of our warrant liability and imputed interest on our customer deposit financing arrangement. The details of this arrangement is discussed in “Liquidity and Capital Resources.”
Other income (expense), net consists primarily of realized foreign exchange gains and losses. Other income (expense), net for the six months ended June 30, 2012 decreased by $0.1 million compared to the same period in fiscal 2011, primarily due to lower realized foreign exchange gains.
Comparison of the Fiscal Years Ended December 25, 2010 and December 31, 2011
Net Revenue
| Fiscal Year Ended | ||||||||||||
| December 25, 2010 |
December 31, 2011 |
% Change | ||||||||||
| (in thousands) | ||||||||||||
| Product net revenue |
$ | 87,538 | $ | 104,889 | 20 | % | ||||||
| Other net revenue |
3,533 | 2,882 | (18 | )% | ||||||||
|
|
|
|
|
|||||||||
| Total net revenue |
$ | 91,071 | $ | 107,771 | 18 | % | ||||||
|
|
|
|
|
|||||||||
A significant portion of our net revenue results from the sale of our antenna and broadband and general purpose RF switches used in mobile wireless device, wireless infrastructure, broadband, industrial and other markets, with the balance of our product sales being derived from digital attenuators, synthesizers, mixers / upconverters, and prescalers used in broadband, industrial, wireless infrastructure, test and measurement equipment, and aerospace and defense markets.
For the year ended December 31, 2011, our product net revenue increased by $17.4 million or 20% compared to fiscal 2010. Product net revenue from switches used in handset antenna applications increased by $14.3 million compared to fiscal 2010. Shipments of switches used in handsets decreased in the first half of fiscal 2011 compared to fiscal 2010. However, products sold through one of our distributors for Asia (Macnica) significantly increased in the second half of fiscal 2011 compared to the first half of fiscal 2011, resulting in an overall increase of $14.3 million. Product net revenue from antenna and broadband switches used in broadband applications increased by $3.6 million due to higher shipments through both North American and Asian distributors. Digital attenuator product net revenue increased by $2.4 million as a result of additional design wins with various OEMs. These increases were partially offset by a decrease of $2.9 million due to changes in various other product families.
Other net revenue for the year ended December 31, 2011 decreased by $0.7 million compared to fiscal 2010, primarily due the completion of a government research and development contract in the second quarter of fiscal 2011.
58
Table of Contents
We market and sell our products worldwide. We attribute net revenue to the geographic region where the customer, or its business unit that makes the purchase, is based. Our net revenue by geographic region for the periods indicated was as follows:
| Fiscal Year Ended | ||||||||||||||||
| December 25, 2010 | December 31, 2011 | |||||||||||||||
| (in thousands) | ||||||||||||||||
| United States |
$ | 41,794 | 46% | $ | 31,921 | 30% | ||||||||||
| Japan |
29,917 | 33% | 52,062 | 48% | ||||||||||||
| Germany |
5,954 | 7% | 3,510 | 3% | ||||||||||||
| All others |
13,406 | 14% | 20,278 | 19% | ||||||||||||
|
|
|
|
|
|
|
|
|
|||||||||
| $ | 91,071 | 100% | $ | 107,771 | 100% | |||||||||||
|
|
|
|
|
|
|
|
|
|||||||||
Cost of Net Revenue and Gross Profit
| Fiscal Year Ended | ||||||||||||
| December 25, 2010 |
December 31, 2011 |
% Change | ||||||||||
| (in thousands) | ||||||||||||
| Cost of net revenue |
$ | 49,520 | $ | 70,955 | 43 | % | ||||||
| % of net revenue |
54 | % | 66 | % | ||||||||
| Gross profit |
$ | 41,551 | $ | 36,816 | (11 | )% | ||||||
| % of net revenue |
46 | % | 34 | % | ||||||||
Cost of net revenue for the year ended December 31, 2011 increased by $21.4 million compared to fiscal 2010 primarily due to increased product cost. We incurred higher product cost due to the implementation of new manufacturing processes. In addition, our product cost was negatively impacted by inventory write downs of $3.4 million during the second half of fiscal 2011. These write downs were the result of lower than anticipated yields of certain wafers in the new manufacturing processes. Gross margin for the year ended December 31, 2011 decreased to 34% from 46% compared to fiscal 2010. The gross margin decline of 12% for fiscal 2011 was mainly due to increased product cost and a change in the mix of products sold. We expect our gross margin will fluctuate from quarter to quarter in the future based on changes in the mix of products we sell, the impact of competitive pricing pressure, variations in our manufacturing costs, or market volatility leading to fluctuations in the volumes we ship.
Included in our cost of net revenue are costs related to our other net revenue of $2.4 million and $1.6 million for the years ended December 25, 2010 and December 31, 2011, respectively. The decrease was mainly due to lower activity in 2011 and the completion of a government research and development contract in the third quarter of fiscal 2011, for which we include the cost of performing the contracted activity in cost of net revenue.
Research and Development
| Fiscal Year Ended | ||||||||||||
| December 25, 2010 |
December 31, 2011 |
% Change | ||||||||||
| (in thousands) | ||||||||||||
| Research and development |
$ | 18,040 | $ | 22,730 | 26 | % | ||||||
| % of net revenue |
20 | % | 21 | % | ||||||||
Research and development expense for the year ended December 31, 2011 increased by $4.7 million compared to fiscal 2010. The increase was primarily due to increased compensation expense of $1.6 million as a result of higher headcount. Other non-personnel related research and development expenditures increased by $3.1 million due to the number of new product development and existing product enhancement initiatives undertaken
59
Table of Contents
during fiscal 2011. We expect our research and development expense to increase in absolute dollars as we continue to expand our product portfolio, enhance existing products, and improve our UltraCMOS technology.
Selling, General and Administrative
| Fiscal Year Ended | ||||||||||||
| December 25, 2010 |
December 31, 2011 |
% Change | ||||||||||
| (in thousands) | ||||||||||||
| Selling, general and administrative |
$ | 18,889 | $ | 23,252 | 23 | % | ||||||
| % of net revenue |
21 | % | 22 | % | ||||||||
Selling, general and administrative expense for the year ended December 31, 2011 increased by $4.4 million compared to fiscal 2010. Approximately half of the increase was attributable to incremental compensation costs of $2.3 million mainly as a result of an increase in sales headcount compared to fiscal 2010. Other increases included additional professional fees of $0.2 million, additional travel expense of $0.5 million, additional stock-based compensation of $0.3 million, and a number of other smaller increases. We expect our selling, general and administrative expense to increase in absolute dollars in the future as we add sales, finance, and administrative personnel and as we incur incremental expense associated with being a public company.
Other Income (Expense)
| Fiscal Year Ended | ||||||||
| December 25, 2010 |
December 31, 2011 |
|||||||
| (in thousands) | ||||||||
| Interest income |
$ | 13 | $ | 7 | ||||
| Interest expense |
$ | (610 | ) | $ | (318 | ) | ||
| Other expense, net |
$ | (118 | ) | $ | (9 | ) | ||
Interest income for the year December 31, 2011 decreased compared to the same period in 2010, due to reduced yields and lower cash and cash equivalent balances.
Interest expense for the year ended December 31, 2011 decreased by $0.3 million compared to fiscal 2010 mainly due to lower levels of borrowing through the majority of fiscal 2011 as well as the change in fair value of our warrant liability.
Other expense, net consists primarily of realized foreign exchange gains and losses. Other expense for the year ended December 31, 2011 decreased by $0.1 million compared to fiscal year 2010, primarily due to lower realized foreign exchange losses.
60
Table of Contents
Selected Quarterly Results
The following table presents our unaudited consolidated statements of operations data for each of the ten quarters up to the period ended June 30, 2012. The quarterly data have been prepared on the same basis as the audited consolidated financial statements appearing elsewhere in this prospectus. You should read this information together with our consolidated financial statements and related notes included elsewhere in this prospectus.
| Three Months Ended | ||||||||||||||||||||||||||||||||||||||||
| March 27, 2010 |
June 26, 2010 |
September 25, 2010 |
December 25, 2010 |
March 26, 2011 |
June 25, 2011 |
September 24, 2011 |
December 31, 2011 |
March 31, 2012 |
June 30, 2012 |
|||||||||||||||||||||||||||||||
| (unaudited) | ||||||||||||||||||||||||||||||||||||||||
| (in thousands) |
||||||||||||||||||||||||||||||||||||||||
| Net revenue |
$ | 22,896 | $ | 23,597 | $ | 21,139 | $ | 23,439 | $ | 21,200 | $ | 24,529 | $ | 26,495 | $ | 35,547 | $ | 36,695 | $ | 43,639 | ||||||||||||||||||||
| Cost of net revenue (1) |
13,186 | 12,855 | 11,244 | 12,235 | 11,992 | 14,728 | 19,370 | 24,865 | 25,460 | 27,398 | ||||||||||||||||||||||||||||||
|
|
|
|
|
|
|
|
|
|
|
|
|
|
|
|
|
|
|
|
|
|||||||||||||||||||||
| Gross profit |
9,710 | 10,742 | 9,895 | 11,204 | 9,208 | 9,801 | 7,125 | 10,682 | |
11,235 |
|
16,241 | ||||||||||||||||||||||||||||
|
|
|
|
|
|
|
|
|
|
|
|
|
|
|
|
|
|
|
|
|
|||||||||||||||||||||
| Operating expense: |
||||||||||||||||||||||||||||||||||||||||
| Research and development (1) |
4,220 | 4,659 | 4,801 | 4,360 | 4,776 | 5,472 | 6,044 | 6,438 | 6,442 | 7,721 | ||||||||||||||||||||||||||||||
| Selling, general and administrative (1) |
3,982 | 4,417 | 4,840 | 5,650 | 5,467 | 5,345 | 5,733 | 6,707 | 7,112 | 8,081 | ||||||||||||||||||||||||||||||
|
|
|
|
|
|
|
|
|
|
|
|
|
|
|
|
|
|
|
|
|
|||||||||||||||||||||
| Total operating expense |
8,202 | 9,076 | 9,641 | 10,010 | 10,243 | 10,817 | 11,777 | 13,145 |
|
13,554 |
|
15,802 | ||||||||||||||||||||||||||||
|
|
|
|
|
|
|
|
|
|
|
|
|
|
|
|
|
|
|
|
|
|||||||||||||||||||||
| Income (loss) from operations |
1,508 | 1,666 | 254 | 1,194 | (1,035 | ) | (1,016 | ) | (4,652 | ) | (2,463 | ) |
|
(2,319 |
) |
439 | ||||||||||||||||||||||||
| Interest income |
2 | 2 | 4 | 5 | 4 | 1 | 2 | — | — | 42 | ||||||||||||||||||||||||||||||
| Interest expense |
(350 | ) | (243 | ) | (129 | ) | 112 | (32 | ) | (153 | ) | 71 | (204 | ) | (680 | ) | (396 | ) | ||||||||||||||||||||||
| Other income (expense), net |
(112 | ) | (21 | ) | 35 | (20 | ) | 59 | 2 | (27 | ) | (43 | ) |
|
6 |
|
(86 | ) | ||||||||||||||||||||||
|
|
|
|
|
|
|
|
|
|
|
|
|
|
|
|
|
|
|
|
|
|||||||||||||||||||||
| Income (loss) before income taxes |
1,048 | 1,404 | 164 | 1,291 | (1,004 | ) | (1,166 | ) | (4,606 | ) | (2,710 | ) |
|
(2,993 |
) |
(1 | ) | |||||||||||||||||||||||
| Provision (benefit) for income taxes |
29 | 37 | 32 | 49 | 21 | 104 | 69 | 2 |
|
49 |
|
25 | ||||||||||||||||||||||||||||
|
|
|
|
|
|
|
|
|
|
|
|
|
|
|
|
|
|
|
|
|
|||||||||||||||||||||
| Net income (loss) |
$ | 1,019 | $ | 1,367 | $ | 132 | $ | 1,242 | $ | (1,025 | ) | $ | (1,270 | ) | $ | (4,675 | ) | $ | (2,712 | ) | $ | (3,042 | ) | $ | (26 | ) | ||||||||||||||
|
|
|
|
|
|
|
|
|
|
|
|
|
|
|
|
|
|
|
|
|
|||||||||||||||||||||
| (1) | Includes stock-based compensation expense related to options granted to employees and others as follows: |
| Three Months Ended | ||||||||||||||||||||||||||||||||||||||||
| March 27, 2010 |
June 26, 2010 |
September 25, 2010 |
December 25, 2010 |
March 26, 2011 |
June 25, 2011 |
September 24, 2011 |
December 31, 2011 |
March 31, 2012 |
June 30, 2012 |
|||||||||||||||||||||||||||||||
| (unaudited) | ||||||||||||||||||||||||||||||||||||||||
| (in thousands) | ||||||||||||||||||||||||||||||||||||||||
| Cost of net revenue |
$ | 90 | $ | 91 | $ | 111 | $ | 115 | $ | 115 | $ | 93 | $ | 94 | $ | 129 | $ | 143 | $ | 128 | ||||||||||||||||||||
| Research and development |
124 | 121 | 145 | 166 | 179 | 153 | 177 | 253 | 268 | 299 | ||||||||||||||||||||||||||||||
| Selling, general and administrative |
356 | 304 | 402 | 492 | 516 | 427 | 405 | 543 | 569 | 557 | ||||||||||||||||||||||||||||||
|
|
|
|
|
|
|
|
|
|
|
|
|
|
|
|
|
|
|
|
|
|||||||||||||||||||||
| Total |
$ | 570 | $ | 516 | $ | 658 | $ | 773 | $ | 810 | $ | 673 | $ | 676 | $ | 925 | $ | 980 | $ | 984 | ||||||||||||||||||||
|
|
|
|
|
|
|
|
|
|
|
|
|
|
|
|
|
|
|
|
|
|||||||||||||||||||||
61
Table of Contents
The following table presents certain unaudited quarterly information as a percentage of our net revenue for each of the ten quarters up to the period ended June 30, 2012 on a historical basis:
| Three Months Ended | ||||||||||||||||||||||||||||||||||||||||
| March 27, 2010 |
June 26, 2010 |
September 25, 2010 |
December 25, 2010 |
March 26, 2011 |
June 25, 2011 |
September 24, 2011 |
December 31, 2011 |
March 31, 2012 |
June 30, 2012 |
|||||||||||||||||||||||||||||||
| (unaudited) | ||||||||||||||||||||||||||||||||||||||||
| Net revenue |
100 | % | 100 | % | 100 | % | 100 | % | 100 | % | 100 | % | 100 | % | 100 | % | 100 | % | 100 | % | ||||||||||||||||||||
| Cost of net revenue |
58 | 54 | 53 | 52 | 57 | 60 | 73 | 70 | 69 | 63 | ||||||||||||||||||||||||||||||
|
|
|
|
|
|
|
|
|
|
|
|
|
|
|
|
|
|
|
|
|
|||||||||||||||||||||
| Gross margin |
42 | 46 | 47 | 48 | 43 | 40 | 27 | 30 | 31 | 37 | ||||||||||||||||||||||||||||||
|
|
|
|
|
|
|
|
|
|
|
|
|
|
|
|
|
|
|
|
|
|||||||||||||||||||||
| Operating expense: |
||||||||||||||||||||||||||||||||||||||||
| Research and development |
19 | 20 | 23 | 19 | 22 | 22 | 23 | 18 | 18 | 18 | ||||||||||||||||||||||||||||||
| Selling, general and administrative |
17 | 19 | 23 | 24 | 26 | 22 | 21 | 19 | 19 | 18 | ||||||||||||||||||||||||||||||
|
|
|
|
|
|
|
|
|
|
|
|
|
|
|
|
|
|
|
|
|
|||||||||||||||||||||
| Total operating expense |
36 | 39 | 46 | 43 | 48 | 44 | 44 | 37 | 37 | 36 | ||||||||||||||||||||||||||||||
|
|
|
|
|
|
|
|
|
|
|
|
|
|
|
|
|
|
|
|
|
|||||||||||||||||||||
| Income (loss) from operations |
6 | 7 | 1 | 5 | (5 | ) | (4 | ) | (17 | ) | (7 | ) | (6 | ) | 1 | |||||||||||||||||||||||||
| Interest income |
— | — | — | — | — | — | — | — | — | — | ||||||||||||||||||||||||||||||
| Interest expense |
(2 | ) | (1 | ) | — | — | — | (1 | ) | — | (1 | ) | (2 | ) | (1 | ) | ||||||||||||||||||||||||
| Other income (expense), net |
— | — | — | — | — | — | — | — | — | — | ||||||||||||||||||||||||||||||
|
|
|
|
|
|
|
|
|
|
|
|
|
|
|
|
|
|
|
|
|
|||||||||||||||||||||
| Income (loss) before income taxes |
4 | 6 | 1 | 5 | (5 | ) | (5 | ) | (17 | ) | (8 | ) | (8 | ) | — | |||||||||||||||||||||||||
| Provision for income taxes |
— | — | — | — | — | — | 1 | — | — | — | ||||||||||||||||||||||||||||||
|
|
|
|
|
|
|
|
|
|
|
|
|
|
|
|
|
|
|
|
|
|||||||||||||||||||||
| Net income (loss) |
4 | % | 6 | % | 1 | % | 5 | % | (5 | )% | (5 | )% | (18 | )% | (8 | )% | (8 | )% | — | % | ||||||||||||||||||||
|
|
|
|
|
|
|
|
|
|
|
|
|
|
|
|
|
|
|
|
|
|||||||||||||||||||||
We believe net revenue has generally increased over the ten quarters presented due to increased end market demand for our products, continued new product introductions during the period, our success in acquiring new customers, and increased sales to existing customers in our target markets.
Gross margin has fluctuated over the past nine quarters between 27% in the third quarter of fiscal 2011 and 48% in the fourth quarter of fiscal 2010. Gross margin increased throughout fiscal 2010 mainly due to reductions in manufacturing costs attributable to efficiencies from increased volumes, the sale of previously reserved inventory, and improved yields. Gross margin declined in the first three quarters of fiscal 2011 due to the implementation of new manufacturing processes, product mix, and low yields of certain wafers, which resulted in reductions to the carrying value of inventory as a result of a lower of cost or market valuation. Gross margin increased in the fourth quarter of 2011 and continued to increase in the first two quarters of fiscal 2012 compared to the third quarter of fiscal 2011 as we implemented improvements to our new manufacturing processes to improve yields. We anticipate that gross margin will fluctuate from quarter-to-quarter due to changing product mix, competitive pressures on selling prices, actual product yields, and our ability to reduce manufacturing costs.
In general, research and development expense and selling, general and administrative expense as a percentage of net revenue have remained materially consistent over the past nine quarters. As our net revenue increases, research and development expense and selling, general and administrative expense are expected to decrease as a percentage of net revenue.
Liquidity and Capital Resources
Our principal source of liquidity as of June 30, 2012 consisted of our cash and cash equivalent holdings of $42.9 million. We have financed our operations primarily through the sale of convertible preferred stock, equipment term notes, leases, a credit facility, a customer deposit financing arrangement, and in fiscal 2010, by cash generated from operations. We continue to focus on monitoring our cash usage, controlling operating expense growth, and satisfying liquidity requirements. As of June 30, 2012, we have an accumulated deficit of $231.3 million. We have financed our historical operations primarily through the sale of convertible preferred stock, debt financing, and through cash generated from operations. We believe our cash and cash equivalents, together with cash generated from operations and our access to existing debt facility will be sufficient to meet our liquidity requirements through June 30, 2013. Our continued growth is dependent upon increasing revenues and managing working capital to a level that is adequate to support our increased cost structure or obtaining adequate debt financing to fulfill our obligations as they become due.
62
Table of Contents
We use cash primarily to fund operating expenses, purchase inventory, and acquire property and equipment. Cash used to fund operating expenses is impacted by the timing of when we pay these expenses as reflected in the change in our outstanding accounts payable and accrued expenses and excludes the impact of non-cash items such as depreciation and stock-based compensation.
One of our primary sources of cash is cash receipts on accounts receivable from our shipment of products to our customers. Aside from the growth in amounts billed to our customers, net cash collections of accounts receivable are impacted by the efficiency of our cash collection process, which can vary from period to period depending on the payment cycles of our major customers.
During the six months ended June 30, 2012 we entered into a supply and prepayment agreement with Murata. The agreement is for an initial term of 18 months. Under the terms of the agreement, Murata agreed to prepay on its purchase orders placed through a third party distributor and to pay us a total deposit of $14.0 million between March and July 2012. We will repay the deposit at a rate based on the number of RFICs purchased by Murata over the four quarters starting from the fourth quarter of fiscal 2012 of up to $14.0 million. As of June 30, 2012, we received $12.0 million in deposits under the supply and prepayment agreement. In addition, our balance of received prepayments on purchase orders from the third party distributor was $31.1 million as of June 30, 2012.
Below is a summary of our cash flows used in operating activities, investing activities, and financing activities for the periods indicated:
| Fiscal Year Ended | Six Months Ended | |||||||||||||||
| December 25, 2010 |
December 31, 2011 |
June 25, 2011 |
June 30, 2012 |
|||||||||||||
| (unaudited) | ||||||||||||||||
| (in thousands) |
||||||||||||||||
| Net cash provided by (used in) operating activities |
$ | 7,751 | $ | (97 | ) | $ | 3,096 | $ | 22,934 | |||||||
| Net cash used in investing activities |
(3,445 | ) | (4,330 | ) | (2,015 | ) | (6,126 | ) | ||||||||
| Net cash provided by (used in) financing activities |
(3,724 | ) | 1,302 | (1,250 | ) | 13,988 | ||||||||||
| Effect of exchange rates on cash and cash equivalents |
(73 | ) | 18 | 71 | 3 | |||||||||||
|
|
|
|
|
|
|
|
|
|||||||||
| Net increase (decrease) in cash and cash equivalents |
$ | 509 | $ | (3,107 | ) | $ | (98 | ) | $ | 30,799 | ||||||
|
|
|
|
|
|
|
|
|
|||||||||
Net Cash Provided by (Used in) Operating Activities
Net cash provided by operating activities amounted to $7.8 million during the year ended December 25, 2010, and was primarily attributable to our net income of $3.8 million, depreciation and amortization of $3.6 million, stock-based compensation of $2.5 million, and an increase in our deferred revenue of $1.4 million, offset by an increase in inventory of $3.1 million. Deferred revenue increased as our revenue grew and our distributors carried higher inventory balances. Our inventory grew due to our increased purchasing activity in support of our increasing sales forecasts.
Net cash used in operating activities amounted to $0.1 million during the year ended December 31, 2011, and was primarily attributable to our depreciation and amortization of $4.0 million, stock-based compensation of $3.1 million, and an increase in accounts payable and accrued liabilities of $13.0 million, offset by our net loss of $9.7 million, an increase in accounts receivable of $1.3 million, an increase in inventory of $7.5 million, and an increase in prepaids and other current and noncurrent assets of $2.3 million. Our accounts payable and accrued liabilities increased along with our increased production volumes and overall growth in operations. Accounts receivable increased due to higher net revenues in the fourth quarter of fiscal 2011. Inventory increased to support our growing sales volume and due to longer cycle time and higher cost of implementing new manufacturing processes. Prepaids and other current and noncurrent assets increased due to higher volume of wafers sold to our wafer preparation suppliers and timing of payment.
Net cash provided by operating activities amounted to $22.9 million during the six months ended June 30, 2012, and was primarily attributable to customer deposits of $31.1 million, an increase in accounts payable and accrued liabilities of $15.9 million, depreciation and amortization of $1.9 million, stock-based compensation of $2.0 million, and our revaluation of our preferred warrants to fair value of $0.6 million, offset by our net loss of
63
Table of Contents
$3.1 million, an increase in accounts receivable of $5.0 million, an increase in inventory of $12.7 million, and an increase in prepaids and other current and noncurrent assets of $8.4 million. Our accounts payable and accrued liabilities increased along with our increased production volumes and overall growth in operations. Accounts receivable increased due to timing and higher volume of products shipped to our distributors in the first half of fiscal 2012. Inventory increased to support our growing sales volume and due to longer cycle time and higher cost of implementing new manufacturing processes. Prepaids and other current and noncurrent assets increased due to higher volume of wafers sold to our wafer preparation suppliers, prepayments made to suppliers, and timing of payment.
Net Cash Used in Investing Activities
Net cash used in investing activities during the years ended December 25, 2010 and December 31, 2011 and the six months ended June 30, 2012 consisted primarily of purchases of property and equipment of $3.5 million, $4.4 million, and $6.1 million, respectively, to support growth in our operations. Net cash used in investing activities during the year ended December 25, 2010 consisted of $1.1 million of capitalized software development costs associated with our new ERP system implementation and $2.3 million of purchases of property and equipment. The majority of our capital expenditures in 2011 and the six months ended June 30, 2012 related to new testing machinery and equipment.
Net Cash Provided by (Used in) Financing Activities
For the year ended December 25, 2010, net cash used in financing activities amounted to $3.7 million and was primarily attributable to payments on product financing arrangement of $3.2 million, payments on our notes payable of $2.1 million, payments on leases of $0.7 million, and costs paid in connection with our initial public offering of $0.8 million, offset by proceeds from notes payable of $2.6 million and proceeds from stock option exercises of $0.6 million. In June 2010, we amended our existing loan and security agreement, which increased the line of credit availability to $10.0 million in accounts receivable financing and to $3.0 million in equipment financing available until December 31, 2010. We are obligated to pay interest at the rate of prime plus 0.50%, subject to an interest rate floor and ceiling of 3.75% and 7.50%, respectively. The interest is payable monthly, with the principal due at the maturity date, June 23, 2013. We were obligated to pay interest at a fixed rate of 5.75% on our note payable for the equipment financing through March 31, 2011. We are obligated to pay interest at a fixed rate of 4.75% for the equipment financing from April 1, 2011 through the maturity date. Principal and interest is due in 36 equal monthly payments from the date of each draw. At December 25, 2010, the outstanding balance under the line of credit was $3.2 million, and there was $6.3 million available. At December 25, 2010, there was $2.4 million outstanding under the note payable, and there was $0.6 million available. We did not draw on the remaining amount available before the equipment financing availability expired on December 31, 2010.
Net cash provided by financing activities amounted to $1.3 million during the year ended December 31, 2011, and was primarily attributable to proceeds from our line of credit of $4.5 million, offset by costs paid in connection with our initial public offering of $1.8 million, payments on notes payable of $0.8 million, and payments on capital leases of $0.7 million. At December 31, 2011, the outstanding balance under the line of credit was $7.7 million, and there was $1.8 million available. At December 31, 2011, there was $1.6 million outstanding under the note payable, and there was no remaining borrowing capacity. We were in compliance with our loan covenants at December 31, 2011.
As of December 25, 2010 and December 31, 2011, we maintained outstanding standby letters of credit in total of $0.4 million as collateral in relation to a software lease agreement. The total amount has been collateralized by our line of credit.
In January 2012, we amended the existing loan and security agreement, which increased the line of credit availability to $20.0 million in accounts receivable financing and to $4.0 million in equipment financing available until December 31, 2012. In February 2012, we drew an additional $3.0 million from our line of credit. We are
64
Table of Contents
obligated to pay interest at the rate of prime plus 0.50%, subject to an interest rate floor and ceiling of 3.75% and 7.50%, respectively, for the accounts receivable financing. Interest is payable monthly with the principal due at the maturity date, December 30, 2014. We are obligated to pay interest at a fixed rate of 4.75% for the equipment financing. Principal and interest is due in 36 equal monthly payments from the date of each draw. The agreement contains certain financial covenants, including covenants relating to our required liquidity ratio, minimum tangible net worth, and minimum EBITDA.
Net cash provided by financing activities amounted to $14.0 million during the six months ended June 30, 2012, and was primarily attributable to proceeds from customer deposits from Murata of $12.0 million and proceeds from our line of credit of $3.0 million, offset by payments on notes payable of $0.4 million, costs paid in connection with our initial public offering of $0.4 million, and payments on capital leases of $0.3 million. Murata agreed to pay us a total customer deposit of $14.0 million between March and July 2012. We will repay the customer deposit over the four quarters starting from the fourth quarter of fiscal 2012. At June 30, 2012, the outstanding balance under the line of credit was $10.7 million, and there was $7.1 million available. At June 30, 2012, there was $1.2 million outstanding under the note payable, and there was $4.0 million available. We were in compliance with our loan covenants at June 30, 2012.
Contractual Obligations, Commitments, and Contingencies
The following table summarizes our outstanding contractual obligations as of December 31, 2011 and the effect those obligations are expected to have on our liquidity and cash flows in future periods:
| Payments Due by Period | ||||||||||||||||||||
| Contractual Obligations |
Total | Less Than 1 Year |
1-3 Years |
3-5 Years |
More Than 5 Years |
|||||||||||||||
| (in thousands) | ||||||||||||||||||||
| Notes payable |
$ | 1,618 | $ | 861 | $ | 757 | $ | — | $ | — | ||||||||||
| Capital lease obligations |
760 | 555 | 205 | — | — | |||||||||||||||
| Operating lease obligations |
4,995 | 1,928 | 2,094 | 973 | — | |||||||||||||||
| Inventory purchase obligations |
21,995 | 21,995 | — | — | — | |||||||||||||||
|
|
|
|
|
|
|
|
|
|
|
|||||||||||
| Total |
$ | 29,368 | $ | 25,339 | $ | 3,056 | $ | 973 | $ | — | ||||||||||
|
|
|
|
|
|
|
|
|
|
|
|||||||||||
As of December 31, 2011, we had recorded liabilities of $2.0 million for uncertain tax positions and $0.1 million for potential interest and penalty, which are not included in the table because we are unable to reliably estimate the amount of payments in individual years that will be made in connection with these uncertain tax positions.
In March 2012, we entered into a supply and prepayment agreement with Murata. The agreement is for an initial term of 18 months. Under the terms of the agreement, Murata agreed to prepay on its purchase orders placed through a third party distributor and to pay us a total deposit of $14.0 million between March to July 2012. We will repay the deposit at a rate based on the number of RFICs purchased by Murata over the four quarters starting from the fourth quarter of fiscal 2012 of up to $14.0 million. As of June 30, 2012 we had received $12.0 million in deposits under the supply and prepayment agreement with Murata.
In May 2012, we amended our existing operating lease agreement to lease additional office space in San Diego, CA. Additional future minimum annual payments under the operating lease for fiscal 2013, 2014, and 2015 are approximately $0.3 million.
Contingencies
In September 2008, we received a Commodity Jurisdiction ruling from the U.S. Department of State that determined certain of our products sold in the aerospace and defense markets are subject to ITAR rather than the EAR. Given this ruling, a number of past product shipments that we believed were subject to the EAR were
65
Table of Contents
exported without the required State Department ITAR license. We also transferred ITAR technical data to one foreign person employee with the belief such data was subject to the EAR rather than the ITAR. We have taken steps to mitigate the impact of these violations. In December 2008, we submitted a voluntary disclosure to the U.S. Department of State to report the unlicensed exports. The U.S. Department of State encourages voluntary disclosures and generally affords parties mitigating credit under such circumstances. In addition, to reduce the likelihood of violations in the future, we have strengthened our export-related controls and procedures. For example, we implemented export classification training for employees and annual export compliance audits. As of the date of this prospectus, we have not received a response from the U.S. Department of State. Despite the steps we have taken, we could be subject to continued investigation and potential regulatory consequences related to these violations ranging from a no-action letter, government oversight of facilities and export transactions, monetary penalties, and in certain cases, debarment from government contracting, denial of export privileges, and criminal penalties. No claims have been asserted and no amounts have been accrued for this contingency in the consolidated financial statements.
Commitments
In November 2009, we entered into a software capital lease associated with the implementation of a new ERP system for a term of three years beginning in January 2010. The present value of the capital lease obligation was $0.7 million as of December 26, 2009. Future minimum annual payments under the capital lease for fiscal 2012 is approximately $0.3 million. In July 2010, we amended the existing operating lease agreement for our facility in San Diego, California. The amendment included a lease term extension of our existing facility from August 1, 2012 until December 31, 2015. In addition, we leased 23,209 additional square feet of office space from January 1, 2011 through December 31, 2015. Future minimum annual payments under the operating lease for fiscal 2012, 2013, 2014, and 2015 are approximately $0.9 million, $0.7 million, $0.8 million, and $0.8 million, respectively.
In June 2010, we signed a new foundry agreement with Silanna Semiconductor obligating us to purchase $5.4 million of wafer services from Silanna Semiconductor over a period of 24 months beginning July 1, 2010.
On February 14, 2012, we filed a complaint with the ITC and a lawsuit in the U.S. District Court for the Central District of California, which on April 13, 2012 we moved to the U.S. District Court for the Southern District of California. Each of these actions allege the infringement of five of our patents relating to RFICs and switching technology by RFMD and Motorola Mobility. On May 11, 2012, we also amended the ITC complaint and filed an additional lawsuit in the U.S. District Court for the Southern District of California to add HTC to the previous actions. The complaints filed with the ITC claim that certain of RFMD’s products and certain of Motorola Mobility’s and HTC’s smartphones infringe our patents relating to SOI design technology for RFICs and seeks, among other remedies, an exclusion order preventing the importation and sale of infringing products in the U.S. Separately, the suits we filed in the U.S. District Court allege infringement of the same patents and seeks, in addition to damages, to permanently enjoin RFMD, Motorola Mobility, and HTC from further infringement. On April 16, 2012, RFMD filed a lawsuit against us in the U.S. District Court for the Middle District of North Carolina, seeking a declaratory judgment that RFMD does not infringe the patents we have asserted in our actions against them or that these patents are invalid. Pursuing these actions is costly and could impose a significant burden on management and employees. We may receive unfavorable interim rulings in the course of this litigation and there can be no assurance that a favorable outcome will ultimately be obtained.
Off Balance Sheet Arrangements
As of June 30, 2012, we did not have any relationships with unconsolidated entities or financial partnerships, such as entities often referred to as structured finance, variable interest, or special purpose, which would have been established for the purpose of facilitating off-balance-sheet arrangements or other contractually narrow or limited purposes. In addition, we do not engage in trading activities involving non-exchange traded
66
Table of Contents
contracts. As such, we are not materially exposed to any financing, liquidity, market, or credit risk that could arise if we had engaged in such relationships. We do not have relationships or transactions with persons or entities that derive benefits from their non-independent relationship with us or our related parties.
Quantitative and Qualitative Disclosures about Market Risk
We are exposed to market risk in the ordinary course of business, which consists primarily of interest rate risk associated with our cash and cash equivalents, our debt, and foreign exchange rate risk.
Interest rate risk. The primary objective of our investment activity is to preserve principal, provide liquidity, and maximize income without increasing risk. Our investments have limited exposure to market risk. To minimize this risk, we maintain our portfolio of cash equivalents consisting of U.S. Treasuries money market funds. The interest rates are variable and fluctuate with current market conditions. The risk associated with fluctuating interest rates is limited to our cash and cash equivalents portfolio. We do not believe that we have any material exposure to changes in the fair value of cash and cash equivalents as a result of changes in interest rates due to their short-term nature. Declines in interest rates, however, will reduce future interest income.
Our exposure to market risk also relates to the changes in the amount of interest expense we must pay on our bank debt and borrowings on our bank credit facility. We are obligated to pay interest on our line of credit at the prime rate plus 0.50%, subject to an interest rate floor and ceiling of 3.75% and 7.50%, respectively. A 1% change in interest rates on our variable debt at June 30, 2012 would have resulted in interest expense fluctuating by an immaterial amount.
Foreign currency risk. Our sales to international customers, as well as our purchases of material from international suppliers, have been denominated primarily in U.S. dollars. Accordingly, we have limited exposure to foreign currency exchange rates and do not enter into foreign currency hedging transactions. The functional currency of our foreign operations in Europe and Asia is the local currency, and as such, any fluctuation in the exchange rates of these net assets, denominated in local currency, would be reflected in the translation gains or losses, which are accounted for in other comprehensive income in our statements of changes in equity. Our inventory purchases are also denominated in U.S. dollars. We do not believe that a change of 10% in the foreign currency exchange rates would have a material impact on our financial position or results of operations.
Recent Accounting Pronouncements
In September 2009, the FASB reached a consensus on Accounting Standards Update, or ASU, 2009-13, Revenue Recognition (Topic 605) – Multiple-Deliverable Revenue Arrangements, or ASU 2009-13, and ASU 2009-14, Software (Topic 985) – Certain Revenue Arrangements That Include Software Elements, or ASU 2009-14. ASU 2009-13 modifies the requirements that must be met for an entity to recognize revenue from the sale of a delivered item that is part of a multiple-element arrangement when other items have not yet been delivered. ASU 2009-13 eliminates the requirement that all undelivered elements must have either: (1) vendor specific objective evidence, or VSOE, or (2) third-party evidence, or TPE, before an entity can recognize the portion of overall arrangement consideration that is attributable to items that already have been delivered. In the absence of VSOE or TPE of the standalone selling price for one or more delivered or undelivered elements in a multiple-element arrangement, entities will be required to estimate the selling prices of those elements. Overall arrangement consideration will be allocated to each element (both delivered and undelivered items) based on their relative selling prices, regardless of whether those selling prices are evidenced by VSOE or TPE or are based on the entity’s estimated selling price. The residual method of allocating arrangement consideration has been eliminated. ASU 2009-14 modifies the software revenue recognition guidance to exclude from its scope tangible products that contain both software and non-software components that function together to deliver a product’s essential functionality. These new updates are effective for revenue arrangements entered into or materially modified in fiscal years beginning on or after June 15, 2010. Early adoption was permitted. The adoption of these ASUs as of December 26, 2010 did not have a material impact on our consolidated financial statements.
67
Table of Contents
In March 2010, the FASB ratified the final consensus that offers an alternative method of revenue recognition for milestone payments. The guidance states that an entity can make an accounting policy election to recognize a payment that is contingent upon the achievement of a substantive milestone in its entirety in the period in which the milestone is achieved. The guidance will be effective for fiscal years, and interim periods within those years, beginning on or after June 15, 2010 with early adoption permitted, provided that the revised guidance is applied retrospectively to the beginning of the year of adoption. The guidance may be applied retrospectively or prospectively for milestones achieved after the adoption date. The adoption of this guidance as of December 26, 2010 did not have a material impact on our consolidated financial statements.
In 2011, the FASB issued amended standards to increase the prominence of items reported in other comprehensive income. These amendments eliminate the option to present components of other comprehensive income as part of the statement of changes in stockholders’ equity and require that all changes in stockholders’ equity—except investments by, and distributions to, owners—be presented either in a single continuous statement of comprehensive income or in two separate but consecutive statements. These new standards are effective for us beginning in the first quarter of 2012 and are to be applied retrospectively. These amended standards will impact the presentation of other comprehensive income (loss) but will not impact our consolidated financial position or consolidated results of operations.
68
Table of Contents
Our Company
We are a fabless provider of high performance RFICs. Our solutions leverage our proprietary UltraCMOS technology which enables the design, manufacture, and integration of multiple RF, mixed signal, and digital functions on a single chip. We believe our products deliver an industry leading combination of performance and monolithic integration. Our solutions target a broad range of applications in the aerospace and defense, broadband, industrial, mobile wireless device, test and measurement equipment, and wireless infrastructure markets. We have shipped over one billion RFICs based on our UltraCMOS technology since January 1, 2006.
Our UltraCMOS technology combines the ability to achieve the high levels of performance of traditional specialty processes, with the fundamental benefits of standard CMOS, the most widely used semiconductor process technology. UltraCMOS technology utilizes a synthetic sapphire substrate, a near-perfect electrical insulator, providing greatly reduced unwanted electrical interaction between the RFIC and the substrate (referred to as parasitic capacitance), which enables high signal isolation and excellent signal fidelity with low distortion over a broad frequency range (referred to as broadband linearity). These two technical attributes result in RF devices with excellent high-frequency performance and power handling performance, and reduced crosstalk between frequencies. In addition, increased broadband linearity provides for faster data throughput and greater subscriber capacity over a wireless network, resulting in enhanced network efficiency. UltraCMOS technology also provides the benefits of standard CMOS, such as high levels of integration, low power consumption, reusable circuit libraries, widely available design tools and outsourced manufacturing capacity, and the ability to scale to smaller geometries. We own fundamental IP in the UltraCMOS technology consisting of more than 125 U.S. and international issued and pending patents, and over 300 documented trade secrets covering basic circuit elements, RF circuit designs, manufacturing processes, and design know-how.
We leverage our extensive RF design expertise and systems knowledge to develop RFIC solutions that meet the stringent performance, integration, and reliability requirements of the rapidly evolving wireless markets. As of June 30, 2012, we offered a broad portfolio of more than 160 high performance RFICs including switches, digital attenuators, mixers / upconverters, prescalers, DTCs, and DC-DC converters, and were developing PAs. During the year ended December 31, 2011, our products were sold to more than 1,500 module manufacturers, OEMs, contract manufacturers, and other customers, including such companies as Ericsson, Flextronics, Hitachi Metals, Itron, Jabil, LG Innotek, Mini-Circuits, Motorola Solutions, Murata, Northrop Grumman, Planet Technology, Rockwell Collins, Rohde & Schwarz, SIPAT, Skyworks, Sony Corporation, Source Photonics, TDK-EPC, Thales Alenia Space, and TriQuint. We believe our RFICs are included in products sold by many of the leading mobile handset OEMs. For the years ended December 25, 2010 and December 31, 2011, we generated net revenue of $91.1 million and $107.8 million, respectively, representing year-over-year growth of 18%. We generated net income of $3.8 million for the year ended December 25, 2010 and a net loss of $9.7 million for the year ended December 31, 2011. We recorded net revenue of $80.3 million and a net loss of $3.1 million for the six months ended June 30, 2012. As of June 30, 2012, we had an accumulated deficit of $231.3 million.
Industry Overview
Wireless is Everywhere
Proliferation of wireless devices coupled with rapid advances in RF technologies have significantly enhanced wireless connectivity and revolutionized the mobile wireless, wireless infrastructure, broadband, and satellite communications markets. In addition, an array of other consumer, public safety, aerospace and defense and industrial markets are increasingly incorporating advanced RF functionality into a wide variety of applications. According to Frost & Sullivan, the worldwide market for RFICs across the aerospace and defense, broadband, industrial, mobile wireless device, test and measurement equipment, and wireless infrastructure industries is expected to grow from $12.2 billion in 2010 to $29.2 billion in 2015, representing a CAGR of 19.1%.
69
Table of Contents
The following graphic shows the broad array of applications in which advanced, high performance RFICs are currently being deployed:
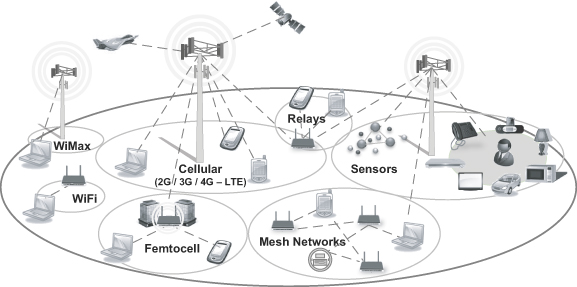
Growing worldwide demand for mobile wireless communications and mobile multimedia applications is driving the proliferation of mobile devices. According to Gartner Research, approximately 2.0 billion mobile handsets are expected to be produced worldwide in 2012, in addition to other mobile wireless devices.* The evolution of mobile wireless networks from predominantly voice-centric networks to advanced high-speed networks that deliver voice, video, and data, is enabling consumers to access bandwidth intensive rich media content on mobile devices through applications such as videoconferencing, streaming media, and interactive gaming. As a result, mobile wireless devices have evolved from supporting only a single cellular standard, operating on two or three frequencies and utilizing a single antenna, to supporting multiple wireless protocols, supporting up to 10 frequency bands and integrating multiple antennas. According to Gartner Research, the number of smartphone units produced worldwide is expected to grow from 653 million units in 2012 to 1,341 million units in 2016, representing a CAGR of 20%.*
The combination of an increasing global subscriber base, expansion of advanced wireless networks, and the proliferation of powerful devices offering high-speed wireless Internet access, has dramatically increased mobile data traffic. According to the Cisco Visual Networking Index forecast, global mobile data traffic is expected to increase 18 times between 2011 and 2016. Mobile data traffic is expected to grow at a CAGR of 78% from 2011 to 2016, reaching 10.8 exabytes per month by 2016. This increase in data traffic is straining the existing wireless network infrastructure. As a result, operators are expanding their network capacity by acquiring additional wireless spectrum, deploying more third generation, or 3G, base stations, extending coverage with microcell technologies such as femtocells to improve localized coverage, and introducing fourth generation, or 4G, technologies, such as Long Term Evolution, or LTE, and Worldwide Interoperability for Microwave Access, or WiMAX. In addition, the demand for global wireless connectivity is driving operators to deploy network infrastructure in new geographies. Infonetics projects second generation, 3G, and 4G (LTE and WiMAX) base station deployments worldwide will grow from 947,120 units in 2009 to 2.7 million units in 2014, representing a CAGR of 24%, and sales of femtocell products will increase from 175,975 units in 2009 to 37.7 million units in 2014, representing a CAGR of 193%.
| * | Gartner report: Forecast Analysis: Mobile Phones and Consumer Electronics, Worldwide, 1Q12 Update |
| Published: 12 April 2012 |
| Analyst(s): Marielena Oppenheimer, Jon Erensen, Paul O’Donovan, Ben Lee, Amy Teng, Hiroyaki Shimizu |
70
Table of Contents
In addition to the mobile wireless handset and infrastructure markets, high performance RFICs are increasingly being deployed in a variety of other wired and wireless market applications. The increasing data transfer requirements of broadband communications, satellite communications, and test and measurement equipment; the high reliability and radiation-hard performance requirements of aerospace and defense communications; and the ruggedness, high temperature, and electrostatic discharge, or ESD, tolerance of automotive and industrial applications have resulted in increased demand for high performance RFICs in these markets. Accordingly, advanced RF semiconductor solutions are evolving to deliver increased functionality, performance, and reliability across a broad array of markets while simultaneously achieving smaller form factors and lower cost per function.
Requirements of the RF Semiconductor Market
Significant market opportunities exist for RFIC suppliers that address the stringent requirements of wireless systems such as:
| • | Better Performance. Wireless systems require components that can consistently deliver better signal quality, higher data rates, lower noise and system interference, and less power consumption across a variety of operating conditions and applications. High performance RFICs must interoperate with other wireless system components to avoid performance issues such as dropped calls, slower than expected transfer rates and poor battery life. |
| • | Increasing Functionality. To enable higher data rates, compatibility with legacy networks, and simultaneous voice and data communications, wireless systems must support multiple protocols and frequency bands. This increases overall design complexity and can increase the number of components, size and power consumption of wireless systems. For example, smartphones often utilize as many as 10 frequency bands to support a variety of wireless protocols and require separate RF components for each band. |
| • | Higher Reliability. Module manufacturers and OEMs demand that high performance RFICs perform reliably for long periods of time under a variety of conditions. In particular, manufacturers of wireless network infrastructure, and aerospace and defense products must meet stringent reliability standards that require specialized design, manufacturing, quality assurance, and testing processes. |
| • | Smaller Form Factor and More Cost Effective Solutions. High performance RFICs must enable module manufacturers and OEMs to design wireless products with an increasingly smaller form factor while also reducing overall product cost, both of which require increasing levels of integration. |
Challenges Facing RF Semiconductor Suppliers
The need for higher performance wireless solutions, combined with the increased demand for integrated components that reduce costs, overall power consumption and size, has put significant pressure on wireless component suppliers. A typical wireless device contains three primary subsystems – the digital baseband processor, the transceiver, and the RF front-end. Baseband processors, and more recently transceivers, are implemented in standard silicon-based CMOS. However, fundamental physical limitations of silicon have prevented standard silicon-based CMOS solutions from meeting the high frequency and power handling requirements of high performance RF front-ends. As a result, RF front-end semiconductor manufacturers have historically utilized specialty process technologies such as GaAs HBT, GaAs pHEMT, SiGe, or BiCMOS. While discrete RF components produced with these processes can attain sufficient levels of performance, these technologies face the following significant challenges:
| • | Inability to Monolithically Integrate. An RF front-end module consists of a number of discrete components, including PAs, low noise amplifiers, switches, filters, control interfaces, power regulators, diplexers and passive elements, most of which are manufactured using different specialty process technologies. As a result, traditional RFICs cannot monolithically integrate these discrete components, |
71
Table of Contents
| leading to RF front-end modules with higher component counts, greater system design complexity, larger overall form factor, and lower module yields. This inability to monolithically integrate also limits cost reduction opportunities. |
| • | Lack of Digital Integration. Specialty process technologies are generally not capable of integrating digital circuitry on the same IC as the RF components. As the digital content of the RF front-end increases and OEMs demand greater levels of configurability, the inability to monolithically integrate digital logic, memory, and other mixed-signal functions on an RFIC manufactured using specialty process technologies can limit performance improvements and reductions in device size, and result in a higher component count for the same functionality. |
| • | Manufacturing Inefficiencies. Suppliers of traditional RFICs typically operate their own fabrication facilities using highly customized process technologies for each type of RFIC product. This not only requires significant investment in process equipment by these suppliers, but also limits their ability to reduce costs by leveraging the existing high volume standard CMOS manufacturing infrastructure currently used by much of the broader semiconductor industry. |
| • | Lack of Scalability. Specialty process technologies, such as GaAs HBT, GaAs pHEMT, SiGe, and BiCMOS, are inherently limited in their ability to scale to smaller geometries as compared to standard CMOS and therefore IC suppliers utilizing these process technologies are increasingly unable to achieve reductions in manufacturing costs and form factors, lower power consumption, or higher performance. |
Advanced wireless system module manufacturers and OEMs continue to implement more complex system architectures to achieve higher levels of performance, which in turn requires them to seek out more integrated solutions that are beyond the capabilities of RFICs produced using specialty process technologies.
Our Solution
We design, develop, market, and sell high performance RFICs based on our patented UltraCMOS technology. Our UltraCMOS technology enables us to monolithically integrate multiple RF and mixed signal components and digital circuitry into high performance RFICs. Our UltraCMOS technology provides the fundamental benefits of standard CMOS including high levels of integration, low power consumption, reusable circuit libraries, widely available design tools and outsourced manufacturing capacity, and the ability to scale to smaller geometries. Furthermore, our UltraCMOS technology utilizes a synthetic sapphire substrate, which enables the low parasitic capacitance, high signal isolation, and excellent broadband linearity required for high frequency and high power RF devices. As of June 30, 2012, we offered a broad portfolio of more than 160 high performance RFICs including switches, digital attenuators, mixers / upconverters, prescalers, DTCs, and DC-DC converters, and were developing PAs.
We leverage our extensive design and process expertise and systems knowledge to develop RFICs that meet the stringent performance, integration, and reliability requirements of the rapidly evolving wireless markets. For example, our monolithic RFICs enable smaller and more power efficient mobile wireless devices. In the wireless base station market, our RFICs enable the management of multiple bands which are driven by growth in 3G and 4G wireless networking protocols.
72
Table of Contents
The following graphic illustrates how a 3G antenna switch built using our UltraCMOS technology (shown on the left) is much smaller, eliminates the complexity of wirebonding, and integrates all functionality on a single chip, compared with a similar switch built using a typical GaAs based approach (shown on the right).
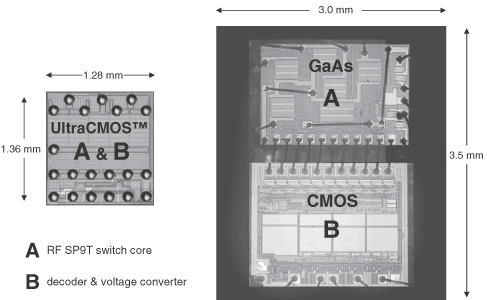
Our Competitive Strengths
Our strengths that distinguish us from our competitors include:
| • | Unique, Proprietary UltraCMOS Technology. We pioneered the development of UltraCMOS technology and have invested significant resources to optimize the technology for volume production of high performance RFICs. With our UltraCMOS technology, we enjoy the substantial benefits of standard CMOS while achieving RFIC performance equal to or better than the performance achieved with specialty process technologies. We believe we are the only high volume commercial supplier of RFICs based on SOS. |
| • | Broad, System Level Integration Capabilities. Our UltraCMOS technology enables high levels of monolithic RFIC integration, allowing the discrete components found in a typical RF front-end to be incorporated into one chip using a single process technology. Our extensive RFIC design experience allows us to approach the challenges of RF integration at the system level, as well as the component level. We have created a proprietary process design platform that includes a comprehensive portfolio of cell libraries, reference designs, design tools, and other intellectual property that allows the design, production, and integration of highly scalable RFICs. |
| • | Broad, Highly Differentiated IP Portfolio. We own fundamental IP in UltraCMOS technology and its implementation. We have more than 125 issued and pending patents encompassing a broad range of technologies that include basic materials processing, fundamental “building block” circuit elements enabled by our UltraCMOS material system, and higher-level circuit designs comprised of these unique circuit elements. In addition we have substantial materials, process, design, packaging, and testing know-how that we retain as documented trade secrets. |
| • | Proven and Efficient Fabless Model. Our UltraCMOS manufacturing process is highly portable to third-party foundries globally, and since January 1, 2006, we have shipped more than one billion RFICs. Our fabless model allows us to scale our business, utilize established and proven standard CMOS production technologies, and transition to smaller geometries and larger wafer sizes relative to |
73
Table of Contents
| specialty process technologies. In contrast to leading edge digital ICs, UltraCMOS solutions can be manufactured using mature and widely available standard CMOS foundries, resulting in lower outsourced manufacturing costs. |
| • | Broad Markets and Diverse Customer Base. Our products address broad end markets, including aerospace and defense, broadband, industrial, mobile wireless device, test and measurement equipment, and wireless infrastructure markets. We offer over 160 different products across eight product families, and for the year ended December 31, 2011, our products were sold to more than 1,500 module manufacturers, OEMs, contract manufacturers, and other customers worldwide. Our unique ability to provide high performance integrated RFICs has led to design wins with numerous leading wireless product module manufacturers and OEMs. |
Our Strategy
Our goal is to be the market leader in large and growing markets where our UltraCMOS technology can provide a superior RFIC solution. Key elements of our strategy include:
| • | Drive Integration Across RF Applications. UltraCMOS technology facilitates the development and manufacture of highly integrated RFICs. We intend to continue to integrate additional discrete RF components and digital circuits into comprehensive single-chip solutions. We currently sell integrated solutions that combine multiple functions onto a single IC and intend to leverage our broad portfolio of RF design blocks to integrate all key RF elements over time. |
| • | Expand our Served Addressable Market. Our UltraCMOS platform enables us to develop new products that integrate RF, analog, digital, and other functions capable of supporting the increasing complexity of a wide range of wireless devices across a number of markets. We intend to continue to invest in the development of future generations of our products to meet the evolving performance, form factor, and cost demands of customers in our existing markets while also expanding our product offerings to address the requirements of new products and markets. |
| • | Deepen Relationships with Existing Customers and Expand our Customer Base. We intend to enhance our global reach and increase our penetration of key customers in our target markets by growing our global sales, design, and technical support organizations. In addition, we will continue to develop and broaden our relationships with key players in the wireless ecosystem including wireless network operators, leading device and equipment OEMs, and reference design partners. |
| • | Leverage our Flexible, Scalable Outsourced Manufacturing Model. We have rapidly scaled our business by leveraging the high-volume manufacturing expertise and capacity of our third-party partners involved in the supply of key raw materials, wafer foundry, and assembly and testing services. We intend to continually expand and improve our efficient and robust global supply chain utilizing a variety of business partners located around the world. |
74
Table of Contents
Products
Our broad product portfolio includes both highly integrated monolithic RFICs as well as discrete components. Our proprietary UltraCMOS technology enables us to integrate most RF functions as well as analog and digital circuits and high quality factor, or high Q, passive elements on a single chip. We believe we are able to deliver a unique combination of best-in-class RFIC performance, power consumption, monolithic integration, and size required by increasingly advanced wireless communications applications. Our ICs address a broad range of advanced wireless product requirements in the aerospace and defense, broadband, industrial, mobile wireless device, test and measurement equipment, and wireless infrastructure markets. The table below summarizes our product portfolio and target end markets.
| End Market | ||||||||||||
| Product families |
Aerospace and Defense |
Broadband | Industrial | Mobile Wireless Devices |
Test and Measurement |
Wireless Infrastructure | ||||||
| RF Switches – Antenna |
x | x | x | x | x | x | ||||||
| RF Switches – Broadband |
x | x | x | x | x | |||||||
| Digital Attenuators |
x | x | x | x | x | |||||||
| Synthesizers |
x | x | x | x | ||||||||
| Mixers / Upconverters |
x | x | x | x | ||||||||
| Prescalers |
x | x | x | x | ||||||||
| Variable Gain Amplifiers |
x | |||||||||||
| Digitally Tunable |
x | x | x | x | x | |||||||
| DC-DC Converters |
x | |||||||||||
| Power Amplifiers |
o | |||||||||||
x = Product in production
o = Product sampling or in development
The following is a brief description of our product families:
| • | RF Switches – Antenna. RF Switches are utilized in the RF section of mobile devices to route RF signals between the antenna and the handset core, through one or more signal paths. As the design of the mobile device becomes more complex, more signal paths are required. Our portfolio of RF switches includes products that vary in complexity and performance depending on the design of the application. For mobile handsets, our existing switch products offer up to 10 RF signal paths with integrated digital bus support and onboard voltage regulation, enabling us to capture a leading market position with more than 160 million units shipped in 2011. |
| • | RF Switches – Broadband and General Purpose. Our broadband and general purpose RF switches deliver an industry leading combination of broadband linearity, settling time, and isolation while routing RF signals to their respective transmit or receive paths. We believe these attributes are being used by the OEMs of LED and plasma digital televisions, or DTVs, set top box, cable infrastructure, test and measurement devices, and high performance wireless applications to replace legacy mechanical relays and GaAs-based designs. |
| • | Digital Attenuators. We provide digital step attenuators that are used to control the amplitude of an RF or analog signal. These products include digital control circuitry integrated with an RF attenuator core and are used in 3G and 4G cellular base stations, repeaters, and point-to-point nodes. Our highly linear and configurable digital attenuators reduce design complexity by maintaining excellent performance in both intermediate frequency, or IF, and RF applications and over a range of supply voltages. |
| • | Synthesizers. Our frequency synthesizers provide an electronic system for generating any of a range of frequencies from a single fixed timebase or oscillator. Our synthesizers provide low-power, ultra-low phase noise, programmable frequency synthesis for defense, broadband, industrial, and wireless infrastructure markets. |
| • | Mixers / Upconverters. Our mixers / upconverters are used to translate encoded voice/data signals from one frequency to another to enable radio transmission. Our mixers / upconverters are incorporated into leading mixer modules and provide industry leading linearity, which is a key metric to maximizing wireless data transmission rates. These attributes are critical in 3G and 4G cellular base station designs. |
75
Table of Contents
| • | Prescalers. Our prescalers operate in the C, X, and Ku bands to divide the frequency of a wireless signal in order to extend the operating range of a synthesizer beyond its base capability. Our prescalers complement our frequency synthesizer line, providing our customers with a comprehensive design solution while significantly lowering power consumption. |
| • | Variable Gain Amplifiers. Our VGAs are used in both the receive and transmit path of a radio system to maintain a signal’s strength at a level necessary for other circuits to operate optimally. Our new Digital VGA, or DVGA, product line offers what we believe is a best-in-class combination of linearity, low distortion, low noise, superior attenuation accuracy, market-leading gain control and a high level of functional integration. We believe our DVGA is the first monolithic IC to integrate three functional blocks including digital attenuators, RF / IF amplifiers and a common serial interface onto a single IC. |
| • | Digitally Tunable Capacitors. Our DTCs are designed to enable RF circuits to perform optimally at many different frequencies. Our products support a wide range of applications in a variety of end markets, including antenna and filter tuning, and impedance matching between circuits. We believe our DTC products are designed to offer an industry leading combination of power handling, performance, manufacturability, and small form factor. |
| • | DC-DC Converters. Our frequency-configurable DC-DC converters efficiently perform voltage conversion using a high frequency switching technique that minimizes system noise. Our DC-DC converters are designed to enable a distributed power management architecture designed for satellite applications, replacing inefficient drop out regulators and large central converters. This increases efficiency, reduces weight and form factor, and provides redundant power management. |
| • | Power Amplifiers. Our PAs amplify RF signals in order to generate the necessary power required to establish a radio link between a base station and a mobile device. These products are designed to be reconfigurable to optimize efficiency under different load conditions and modulations. We believe this attribute is highly valued by 3G and 4G handset OEMs to address battery life under high data usage. With our UltraCMOS technology we have the ability to integrate our PAs on a single chip with other RF, mixed signal, and digital components. |
Technology
We have successfully developed and optimized UltraCMOS technology, a proprietary process technology for manufacturing silicon CMOS circuits on insulating substrates. We believe that our fundamental competitive advantage lies in the design and manufacturing of high performance RFIC products using our UltraCMOS technology and have secured broad patent rights covering the significant aspects of our manufacturing processes and circuit designs based on this material system. We refer to our distinctive generations of our UltraCMOS processes as “STeP” and our most recent production version of our UltraCMOS process is “STeP5”.
Our UltraCMOS Process Technology
The fundamental manufacturing processes we utilize involve the placement of a thin monocrystalline silicon layer onto a substrate material that has the distinction of being a near-perfect electrical insulator while also being thermally conductive. The crystalline form of alumina, more commonly known as sapphire, is a manufactured material that exhibits this unusual physical property. The thin silicon layer becomes the basis for building CMOS-based circuit elements using industry standard semiconductor fabrication equipment, while the electrically-insulating and thermally-conductive substrate results in a broad set of unique physical and electrical properties with particular applicability in RF as well as other areas.
Due to the unique physical characteristics of the UltraCMOS material system, our products are able to overcome the inherent limitations of standard CMOS devices manufactured on bulk silicon substrates, as well as products manufactured using specialty process technologies, while exhibiting the best characteristics of both sets of technologies. Products manufactured using our UltraCMOS technology have advantages in high frequency and high power performance, and can include significantly higher quality passive elements than is possible with
76
Table of Contents
bulk silicon CMOS or bipolar devices. In addition, our UltraCMOS technology allows higher levels of monolithic integration, more aggressive technology scaling, and lower power operation than can be achieved with specialty GaAs processes.
The unique combination of performance, integration, and scaling characteristics of our UltraCMOS technology results in numerous key attributes for use in RFICs:
| • | extremely low parasitic capacitance, resulting in excellent high-frequency performance, high power handling capability, and low power consumption characteristics; |
| • | extremely high signal isolation, leading to minimal crosstalk between different frequencies and the ability to reduce the physical size of the device; |
| • | excellent broadband linearity, which results in improved network efficiency, subscriber carrying capacity, and enhanced communication data rates; |
| • | ability to integrate multiple analog RF devices and high quality passive devices, such as inductors, along with digital logic, memory, and other mixed-signal functions with a single manufacturing process, which enables monolithically-integrated RFICs with improved performance characteristics and dramatically smaller device size; |
| • | ability to scale to advanced process geometries, per Moore’s Law, resulting in further improvements in performance, cost, and reduced product footprint; |
| • | excellent tolerance to high-voltage ESD effects, thereby reducing the external protective circuitry required and improving manufacturing yields of module manufacturers, OEMs, and contract manufacturers; |
| • | ability to support advanced chip-scale packaging, or CSP, offering dramatically smaller device size and the elimination of undesirable package-related electrical effects; and |
| • | high radiation resistance, making our UltraCMOS technology ideal for products used in satellite communications and certain medical applications subjected to single-event and total dose radiation effects. |
Comprehensive UltraCMOS RFIC Design Capability
The many unique attributes offered by UltraCMOS technology have provided our product designers with an unmatched level of flexibility to solve many long-standing high performance RFIC design challenges inadequately addressed by prevailing semiconductor technologies. Through our pioneering work in SOS based products, we have developed many innovative circuit designs and techniques for which we have secured broad patent rights.
For example, through a patented technique involving the stacking of multiple transistors, we have developed circuits able to handle high power levels not possible using standard CMOS technology. We also have patented design advancements, enabled by our UltraCMOS process, including HaRP™ technology, which significantly improves the harmonic and linearity performance of RF switches, as well as DuNE technology, a patent pending circuit design technique that we have used to develop our advanced DTC products.
We have gained extensive experience and know-how in developing optimized circuit block design techniques and computer-aided design, or CAD, tools that take full advantage of the unique physical and electrical properties of the SOS material system. We have also leveraged the sophisticated CAD tools available to support the standard CMOS design environment, to gain substantial expertise in the use of these tools for the automated design, simulation and design validation of high performance UltraCMOS-based RFICs. As we have grown our portfolio of RFICs over time, we have amassed a significant library of RF circuit “building blocks” that were developed utilizing our CAD tools. Unlike most other RF product suppliers, since all of our products
77
Table of Contents
are based on a single process technology, our library of proven UltraCMOS building blocks can increasingly be assembled into more complex monolithically integrated RFICs to meet our customers’ expanding system requirements. In addition, we have utilized our extensive system-level expertise to design our RFIC products to work seamlessly in our OEM customers’ system environment.
Research and Development
We view our technology as a competitive advantage, and invest heavily in research and development to ensure our products meet the requirements of module manufacturers and OEMs. Our research and development expense was $18.0 million in 2010 and $22.7 million in 2011. At June 30, 2012, there were 113 people in our research and development organization, located at our facilities in California, Illinois, New Hampshire, and France.
We focus our research and development efforts on designing and introducing new products and enhancing our UltraCMOS process technology. Our circuit design efforts are focused on developing products that provide high levels of performance together with integration of RF functions as well as analog, digital, and passive elements on a single chip. Our core team of experienced engineers works closely with a number of our customers to develop and introduce custom products that address the specific requirements of those customers.
We also engage in customer and government sponsored research and development activities. We believe these activities help support the continued development of our core technologies and enhance our relationships with customers and other partners. Our policy is to accept sponsored research and development where it aligns with our other strategies, as well as our technology and product roadmaps, for the enhancement of our UltraCMOS technology and RFICs. We also undertake such activities where we are able to retain proprietary rights with respect to our technology developed in the course of such sponsored research and development activities.
Sales and Marketing
We sell our products worldwide through our direct sales force and field applications engineering staff, our network of domestic and international independent sales representatives, and both worldwide and regional distribution partners. Each of these channels is supported by our customer service and marketing organizations. We have sales and customer support offices in the U.S., France, China, United Kingdom, South Korea, Taiwan, and Japan.
Our design cycle from initial engagement to volume shipment can be from six months to two years, with product life cycles in the markets we serve ranging from one to five years or more. For many of our products, early engagement with the module manufacturers’ and OEMs’ technical staff is necessary for success. To ensure an adequate level of early engagement, our application and development engineers work closely with the module manufacturers, OEMs, and contract manufacturers to identify and propose solutions to their system challenges.
Our direct sales force and field applications engineers provide our customers technical assistance with the selection and use of our products. Our network of sales representatives and distributors have been selected based on their focus on and knowledge of RFICs, their ability to provide a high level of field application engineering support or their regional logistical support capabilities. We provide ongoing technical training for new products to our sales representatives and distributors to keep them informed of product enhancements and new product releases. We plan to expand our direct sales and support capabilities and our network of independent sales representatives in key regions domestically and internationally. We share product information and technical specifications with our customers using web-based tools.
We maintain an internal marketing organization responsible for the production and distribution of sales and marketing materials, including press releases, product announcements, product brochures, advertisements, and featured articles in trade publications. We also participate in industry tradeshows and conferences to enhance our visibility.
78
Table of Contents
Customers
Our products are sold directly and indirectly to leading companies in each of our target markets, including aerospace and defense, broadband, industrial, mobile wireless device, test and measurement equipment, and wireless infrastructure markets. We sell our products through our direct sales force, our network of sales representatives and distributors, as well as to contract manufacturers and module manufacturers who incorporate our products into their modules which are then sold to OEMs. Macnica and Richardson are our primary distributors, and represented 48% and 16%, respectively, of our net revenue for the year ended December 31, 2011 and 66% and 14%, respectively, of our net revenue for the six months ended June 30, 2012.
We currently rely, and expect to continue to rely, on a limited number of customers for a significant portion of our net revenue. Sales through our distributor Macnica to module manufacturer Murata represented 39% of our net revenue for the year ended December 31, 2011 and 61% of our net revenue for the six months ended June 30, 2012 and we believe substantially all of the products sold by Murata are to a limited number of mobile handset manufacturers. With the exception of the supply and prepayment agreement with Murata, the majority of our business from our largest customers, including sales to Murata through our distributor Macnica, is conducted through standard purchase orders, which provide no contractual guarantees beyond the purchase order itself. No other direct or indirect customer accounted for more than 10% of our total net revenue for the year ended December 31, 2011 or the six months ended June 30, 2012.
Based on our direct customer sales, and records from our distributors of shipments to their customers, the top 10 end customers of our products represented 66% of our net revenue for the year ended December 31, 2011 and 80% of our net revenue for the six months ended June 30, 2012. For the year ended December 31, 2011, our products were sold to more than 1,500 module manufacturers, OEMs, contract manufacturers, and other customers, including such companies as Ericsson, Flextronics, Hitachi Metals, Itron, Jabil, LG Innotek, Mini-Circuits, Motorola Solutions, Murata, Planet Technology, Rockwell Collins, Rohde & Schwarz, SIPAT, Skyworks, Sony Corporation, Source Photonics, TDK-EPC, Thales Alenia Space, and TriQuint. We believe our RFICs are included in products sold by many of the leading mobile handset OEMs.
A substantial portion of our net revenue is generated from customers outside of North America, and we anticipate that such net revenue will continue to comprise a significant portion of our net revenue. For the year ended December 31, 2011, 30%, 61%, and 9% of our net revenue was attributed to customers based in North America, Asia, and Europe, respectively. For the six months ended June 30, 2012, 20%, 74%, and 6% of our net revenue was attributed to customers based in North America, Asia, and Europe, respectively.
Competition
The design, development, marketing and sale of high performance RFICs to the aerospace and defense, broadband, industrial, mobile wireless device, test and measurement equipment, and wireless infrastructure markets are intensely competitive and characterized by rapid technological change, evolving standards, varying product life cycles, and pricing pressures. We expect competition to intensify as competitors expand their product offerings and as new competitors enter the market. We believe that high performance RFIC providers compete principally on product capabilities, levels of integration, innovation, reliability, price, time-to-market, overall system cost, intellectual property, customer support, reliability of supply, and reputation. We believe we compete favorably with respect to these factors.
We compete with a number of large domestic and international suppliers of RFICs in our target markets. We currently compete in the mobile wireless device and wireless infrastructure markets with Avago, Hittite, M/A-COM, NEC, Renesas, RFMD, Skyworks, Sony, Texas Instruments, Toshiba, TriQuint Semiconductor, and others. In the broadband, test and measurement equipment, and industrial markets, we principally compete with Hittite, Intersil, M/A-COM, Renesas, Skyworks, and others. Our principal competitors in the aerospace and defense markets include Analog Devices, Hittite, M/A-COM, and others. We also expect that in the future we may face competition from suppliers of RFICs based on new or emerging technologies.
79
Table of Contents
Although we have a long operating history, many of our current and potential competitors may have better name recognition, access to a larger customer base and significantly greater financial, sales and marketing, manufacturing, distribution, technical, and other resources than us. As a result, those companies may be able to respond more quickly to changing customer demands or devote greater resources to the development, promotion, and sale of their RFICs than we can.
Manufacturing
We are a fabless semiconductor company and we utilize third-party foundries, wafer preparation suppliers, and packaging contractors, along with a combination of internal and external testing, to manufacture our RFICs. Prior to June 2008, we owned and operated a manufacturing facility in Sydney, Australia. In June 2008, after achieving volume outsourced production of our UltraCMOS products, we sold our ownership interest in our manufacturing operation to, and entered into an outsourced manufacturing arrangement with, Silanna Semiconductor. This outsourced manufacturing relationship was extended in June 2010. We have accumulated significant materials, process, test and packaging, and we work closely with each of our manufacturing partners to implement our proprietary technologies in order to meet the extremely high quality and reliability standards of our end customers. Our outsourced manufacturing approach allows us to minimize our capital expenditures, scale our business rapidly, and leverage the high volume manufacturing expertise of others. The following is an overview of our manufacturing process:
| • | Sapphire Wafer Procurement. Synthetic sapphire wafers are a key raw material used in our manufacturing processes. Worldwide production and availability of synthetic sapphire has risen dramatically in recent years as a number of new producers have entered the market given the widespread use of sapphire as a substrate for blue and white LEDs. We currently rely on Kyocera, Rubicon, and Maintech Japan for the supply of our sapphire substrates and are not dependent on any single source; however, in some circumstances we may be required to qualify new sources of sapphire supplies if we, or our third-party foundries, are unable to obtain adequate supplies from our current suppliers. |
| • | Wafer Preparation. Our fundamental manufacturing processes involve the placement of a thin monocrystalline silicon layer onto a sapphire substrate. The thin silicon layer is either epitaxially grown or bonded onto the sapphire substrate. We carefully qualify each of our epitaxial and bonded outside suppliers for wafer preparation. Our principal outside suppliers for epitaxial services are LAPIS Semiconductor and Hermes Epitek Corp. Our principal outside supplier for bonded wafers is Soitec. |
| • | Wafer Fabrication. Our RFICs are currently manufactured by third-party CMOS foundries located in Japan, South Korea, and Australia. We carefully qualify each of our foundries to ensure their ability to implement our proprietary UltraCMOS technology within their wafer fabrication facilities. Our principal foundries are currently LAPIS Semiconductor, MagnaChip Semiconductor, and Silanna Semiconductor. |
| • | Test and Packaging. Our products are shipped as known-good-die, or KGD, or as packaged products. We test KGD both internally and at third-party subcontractors prior to finishing the product for shipment to customers, while our packaged products are assembled by third-party contractors utilizing industry standard packages prior to testing. We design and control our own test processes, utilizing a combination of both internal and outsourced testing. Our in-house testing provides us with additional insight into the performance of our products and enables faster time-to-market for our new products, while our use of third-party test service providers enables us to balance demand with our internal capacity. We believe our extensive experience in the testing of RFICs, and particularly as required for UltraCMOS technology, is a significant barrier-to-entry. |
The majority of our relationships with our suppliers and manufacturing partners is on a basis which provides limited contractual guarantees of long term supply commitment. It is possible that any of our suppliers could terminate their supplier relationship with us, and in such event, we are typically provided reasonable notice of termination and a last time buy opportunity.
80
Table of Contents
Quality Assurance
We are committed to providing high quality products and services that meet or exceed our customers’ expectations. We have developed and implemented a quality management system to create an organizational environment designed to meet the highest level of quality and reliability standards. Our quality management system has been certified and maintained to ISO 9001 standards since 2001. We achieved AS9100 Quality Management System Standards certification in 2003 to address the strict quality system requirements of the aerospace industry. In early 2012, we further improved the robustness of our quality management system by receiving our ISO/TS 16949:2009 Quality Management System certification by the automotive industry.
Intellectual Property
Our success depends upon our ability to protect our core technology and intellectual property. To accomplish this, we rely on a combination of intellectual property rights, including patents, trade secrets, copyrights and trademarks, as well as customary contractual protections.
We plan to pursue and maintain broad intellectual property protection in the U.S. and in our relevant markets worldwide. As of June 30, 2012, we had 58 issued and allowed U.S. patents and eight issued and allowed international patents. In addition, as of the same date we had 33 pending U.S. patent applications and 30 pending international patent applications. Together, our patents and patent applications protect key aspects of our UltraCMOS technologies. We also rely on copyrights, trade secrets, technical know-how, and continuing innovation to develop and maintain our competitive position. Our 66 issued and allowed patents as of June 30, 2012 have expiration dates ranging from 2013 to 2030 with an average remaining patent life of approximately nine years.
We seek to protect our proprietary information and other intellectual property by generally requiring our employees, consultants, contractors, outside scientific collaborators, and other advisors to execute non-disclosure agreements on commencement of their employment or engagement as well as by documenting and maintaining the confidentiality of our trade secrets and other proprietary and confidential information.
Legal Proceedings
On February 14, 2012, we filed a complaint with the ITC and a lawsuit in the U.S. District Court for the Central District of California, which on April 13, 2012 we moved to the U.S. District Court for the Southern District of California. Each of these actions allege the infringement of five of our patents relating to RFICs and switching technology by RFMD and Motorola Mobility. On May 11, 2012, we also amended the ITC complaint and filed an additional lawsuit in the U.S. District Court for the Southern District of California to add HTC to the previous actions. The complaints filed with the ITC claim that certain of RFMD’s products and certain of Motorola Mobility’s and HTC’s smartphones infringe our patents relating to SOI design technology for RFICs and seeks, among other remedies, an exclusion order preventing the importation and sale of infringing products in the U.S. Separately, the suits we filed in the U.S. District Court allege infringement of the same patents and seeks, in addition to damages, to permanently enjoin RFMD, Motorola Mobility, and HTC from further infringement. On April 16, 2012, RFMD filed a lawsuit against us in the U.S. District Court for the Middle District of North Carolina, seeking a declaratory judgment that RFMD does not infringe the patents we have asserted in our actions against them or that these patents are invalid. The lawsuit filed by RFMD has been stayed pending the outcome of the ITC complaint. Pursuing these actions is costly and could impose a significant burden on management and employees. We may receive unfavorable interim rulings in the course of this litigation and there can be no assurance that a favorable outcome will ultimately be obtained. Other than the patent infringement actions against RFMD and Motorola Mobility, we are not currently a party to any material litigation, and we are not aware of any pending or threatened litigation against us that we believe would adversely affect our business, operating results, financial condition or cash flows. The semiconductor industry is characterized by frequent claims and litigation, including claims regarding patent and other intellectual property rights. As a result, in the future, we may be involved in various legal proceedings from time to time.
81
Table of Contents
Employees
As of June 30, 2012, we had 340 employees, of which 315 were located in the U.S., 16 were located in Asia, and nine were located in Europe. Of these employees, 113 were in research and development, 121 were in operations and manufacturing operations, 56 were in sales, applications, and marketing, and 50 were in general and administrative functions. Our employees are not covered by any collective bargaining arrangement. We have never had a work stoppage and we consider our employee relations to be good.
Facilities
Our primary facility and headquarters are located in San Diego, California in a 71,355 square foot leased facility, which houses our manufacturing and supply chain organization, research and design function, as well as the majority of our marketing, sales and administration functions. In May 2012, we amended our existing operating lease agreement to lease additional 25,029 square foot office space in San Diego, CA. The lease expires at the end of December 2015. In addition, we lease facilities in the following locations: Arlington Heights, Illinois for product development, marketing, and sales; Nashua, New Hampshire for product development; Aix-en-Provence, France for product development, marketing and sales; and Tokyo, Japan for marketing and sales. We believe that our leased facilities are adequate to meet our current needs and that additional facilities will be available on suitable, commercially reasonable terms to accommodate future needs.
82
Table of Contents
Executive Officers and Directors
Our executive officers, key employees and directors, and their ages and positions as of June 30, 2012, are set forth below:
| Name |
Age | Position | ||||
| James S. Cable, Ph.D. |
53 | Chief Executive Officer, President and Chairman | ||||
| Jay C. Biskupski |
54 | Chief Financial Officer | ||||
| Ronald E. Reedy, Ph.D. |
64 | Chief Technology Officer | ||||
| Rodd E. Novak |
46 | Chief Marketing Officer | ||||
| Dylan J. Kelly |
34 | Vice President and General Manager, Mobile Wireless Solutions Business Unit | ||||
| David R. Shepard |
51 | Vice President and General Manager, High Performance Solutions Business Unit | ||||
| John H. Allen (1) |
60 | Director | ||||
| Jeffrey K. Belk (2) |
49 | Director | ||||
| Paul N. D’Addario |
59 | Director | ||||
| Gary A. Monetti (1)(3) |
53 | Director | ||||
| Robert D. Pavey (3) |
70 | Director | ||||
| Carl P. Schlachte (2) |
49 | Director | ||||
| Elton B. Sherwin (2)(3) |
58 | Director | ||||
| Anthony S. Thornley (1) |
66 | Director | ||||
| (1) | Member of Audit Committee. |
| (2) | Member of Compensation Committee. |
| (3) | Member of Nominating and Corporate Governance Committee. |
James S. Cable, Ph.D. has served as our Chief Executive Officer since September 2002, and as our President and Chairman since December 2008. Since joining us in 1996, Dr. Cable also has held positions as our Chief Operating Officer and Vice President of Technology and Operations. Dr. Cable has over 25 years of experience in semiconductor research, development, and production, including management positions with Hughes Microelectronics Center, Hughes Technology Center and TRW Inc. Dr. Cable received a B.S. from the University of California, Riverside and a M.S.E.E. and a Ph.D. from the University of California, Los Angeles. Dr. Cable’s significant semiconductor research experience and Ph.D. in electrical engineering, and the fact that he serves as our Chief Executive Officer and President, led to the conclusion that he should serve as a director.
Jay C. Biskupski has served as our Chief Financial Officer since February 2009. From October 2008 to February 2009, Mr. Biskupski was as a principal of a financial consulting firm. From July 2004 to May 2008, Mr. Biskupski served as Vice President and Chief Financial Officer of Xantrex Technology, Inc., a developer of advanced power electronics products for mobile applications. From February 2001 to June 2004, he served as Corporate Controller of PMC-Sierra, Inc., a company providing Internet infrastructure semiconductor solutions, and from May 2000 to February 2001, he served as Chief Financial Officer of ThinkPulse Inc. From March 1990 to May 1999, Mr. Biskupski held a variety of executive finance roles with Schlumberger Ltd. in the smart card and metering businesses. Prior to Schlumberger, Mr. Biskupski worked as controller and accounting systems manager for Nortel Networks Corporation and was an auditor for Touche Ross & Co., now Deloitte & Touche. He is a C.P.A. (Illinois) and a Chartered Accountant (Canada). Mr. Biskupski received a Bachelor of Mathematics / Accounting from the University of Waterloo in Canada and an M.B.A. from the University of California, Los Angeles.
Ronald E. Reedy, Ph.D. has served as our Chief Technology Officer since July 2011. From February 1990 to July 2011, he held various positions with Peregrine, including President, Chairman, Chief Executive Officer,
83
Table of Contents
Chief Operating Officer, Chief Technology Officer, Vice President and Chief of Staff. Prior to joining us, Dr. Reedy led the microelectronics division at Navy Research and Development and was engaged in research and development of fiber communications and photonic systems. He is a co-inventor of UltraCMOS technology. Dr. Reedy received a B.S. and M.S.E.E. from the U.S. Naval Academy and a Ph.D. from the University of California, San Diego.
Rodd E. Novak has served as our Chief Marketing Officer since January 2010. Since joining us in January 2003, he has held various positions, including Vice President of Marketing and most recently Vice President of Sales and Marketing. Prior to joining us, Mr. Novak served in corporate marketing for both CTS Corporation and Northrop Grumman. Mr. Novak began his career as an electrical engineer with Comsat Laboratories and later moved to Xetron Corporation. Mr. Novak received a B.S.E.E. from the University of Cincinnati and an M.B.A. from Xavier University.
Dylan J. Kelly has served as our Vice President and General Manager, Mobile Wireless Solutions Business Unit since January 2010. Since joining us in June 2000, Mr. Kelly has held various technical and management positions in RFIC design and marketing. Prior to joining us, he performed transceiver design for Motorola. Mr. Kelly received a B.S. from the University of Texas, Austin and an M.S. from the University of California, San Diego.
David R. Shepard has served as our Vice President and General Manager, High Performance Solutions Business Unit since April 2010. From October 2003 to August 2009, Mr. Shepard served as President and Chief Executive Officer of Sequoia Communications, an early stage company specializing in RF transceivers for mobile handsets. Prior to that, he held various positions at Texas Instruments, including General Manager of the Wireless Infrastructure Business Unit. Mr. Shepard received a B.A. from Lawrence University and an M.S.E.E. from the University of Wisconsin, Madison.
John H. Allen has served as a member of our board of directors since June 2006. Since November 2007, Mr. Allen has served as Vice President Administration of Cohu, Inc., a supplier of test handling, burn-in, and thermal solutions used by the global semiconductor industry, microwave communications, and video equipment. From June 1995 until November 2007, Mr. Allen served as Vice President Finance and Chief Financial Officer of Cohu, Inc. Prior to joining Cohu, Mr. Allen held various positions with Ernst & Young LLP from 1976 until June 1995 and had been a partner with that firm since 1987. Mr. Allen received a B.A. and an M.B.A. from Michigan State University. Mr. Allen’s experience as a C.P.A. with Ernst & Young LLP and as Chief Financial Officer of Cohu, Inc. led to the conclusion that he should serve as a director.
Jeffrey K. Belk has served as a member of our board of directors since January 2008. Since January 2008, Mr. Belk has served as Managing Director of ICT168 Capital, LLC, focused on developing and guiding global growth opportunities in the information and communication technology space. Prior to founding ICT168 Capital, Mr. Belk spent nearly 14 years with QUALCOMM Incorporated, a developer and provider of digital wireless communications products and services, where he held various positions including Senior Vice President, Global Marketing. Mr. Belk also serves on the board of InterDigital, Inc., a designer and developer of digital wireless technologies for use in digital cellular and wireless IEEE 802-related products and networks. He also serves on the board of the Wireless-Life Sciences Alliance, a think tank connecting global leaders in healthcare and wireless technology. Mr. Belk received a B.A. from the University of California, San Diego and an M.B.A. from the University of California, Irvine. Mr. Belk’s marketing and management experience with wireless technology companies led to the conclusion that he should serve as a director.
Paul N. D’Addario has served as a member of our board of directors since May 2007. Since September 2001, Mr. D’Addario has served as Senior Managing Director of Palisades Ventures, a venture capital fund making growth stage investments in information technology, communications, and media technology companies. Prior to co-founding Palisades Ventures, Mr. D’Addario was a member of the Media/Telecom Group of Credit Suisse First Boston, which acquired Donaldson, Lufkin & Jenrette at the time Mr. D’Addario was a Managing
84
Table of Contents
Director and member of the investment committee of the DLJ New Economy Fund. Mr. D’Addario received a B.A. from Boston College, a M.Sc. from the London School of Economics, and a J.D. from Villanova Law School. Mr. D’Addario’s six years of legal practice and 18 years of investment banking experience as well as his relationship with Palisades Ventures, one of our largest stockholders, led to the conclusion that he should serve as a director.
Gary A. Monetti has served as a member of our board of directors since May 2005. Since 2004 Mr. Monetti has worked as an industry consultant and advisor to various private venture businesses. Mr. Monetti worked with Sawtek Inc., a manufacturer of RF SAW filters, from 1982 to 2004, where he held various positions including Vice President of Sales & Marketing, Vice President of Engineering, Chief Operating Officer, President, Chief Executive Officer, and, following the acquisition of Sawtek by TriQuint Semiconductor, in 2001, President of the Sawtek Division. Mr. Monetti has also served on the board of directors of Sawtek and a number of private companies. Mr. Monetti received a B.S. in electrical engineering from the University of Illinois and an M.B.A. from Rollins College. Mr. Monetti’s 22-year career at Sawtek, during which he helped lead the company in numerous operational and strategic initiatives (including Sawtek’s initial public offering and two subsequent public offerings), led to the conclusion that he should serve as a director.
Robert D. Pavey has served as a member of our board of directors since November 2007. Mr. Pavey joined Morgenthaler Ventures, a venture capital and private equity firm, in 1969 and has been a Partner there since 1971. From 1990 to 1992, Mr. Pavey served as volunteer President and then Chairman of the National Venture Capital Association. His major current focus is on wireless markets as well as semiconductors, materials and devices. Mr. Pavey also serves on the boards of a number of private companies, including CLK Design Automation, Inc., OmniPV, Inc., and R2 Semiconductor. Mr. Pavey received a B.S. from The College of William & Mary, an M.S. from Columbia University, and an M.B.A. from Harvard Graduate School of Business Administration. Mr. Pavey’s extensive experience in private equity, venture capital, and as a member of the boards of directors of a number of private companies and several past public companies as well as his relationship with Morgenthaler Partners, one of our largest stockholders, led to the conclusion that he should serve as a director.
Carl P. Schlachte has served as a member of our board of directors since October 2010. Since July 2010, Mr. Schlachte has served as Chief Executive Officer and Chairman of the board of directors of Ventiva Corporation. Mr. Schlachte served on the board of MOSAID Technologies a leading licensor of semiconductor intellectual property. He was its Chairman until its sale in December 2011. From February 2004 to May 2009, Mr. Schlachte was President and Chief Executive Officer of ARC International, a provider of configurable processor technology to semiconductor companies worldwide. He has more than twenty five years of experience in the semiconductor industry, including Chief Executive Officer roles at global fabless semiconductor and IP companies and executive positions at Motorola and ARM Holdings plc. At ARM, he established its North American operations and secured strategic relationships with semiconductor and system companies in the U.S. Mr. Schlachte received a B.S. from Clemson University. Mr. Schlachte’s recent experience as a director of other companies, coupled with his significant experience in semiconductor intellectual property and licensing, led to the conclusion that he should serve as a director.
Elton B. Sherwin has served as a member of our board of directors since October 2004. Mr. Sherwin has been a Senior Managing Director of Ridgewood Capital Management, LLC since 1999. During his career, Mr. Sherwin also spent over twenty years at IBM and Motorola, Inc. in various marketing and management roles, including establishing the West Coast office of Motorola’s venture capital business. Mr. Sherwin has authored two books and has been granted eight patents. Mr. Sherwin is a member of the boards of directors of Scintera Networks, Inc., Ethertronics, Inc., NRG Dynamix, and Pixim, Inc. Mr. Sherwin received a B.A. from the University of California at Berkeley. Mr. Sherwin’s extensive experience in corporate governance and venture capital as well as his relationship with Ridgewood Peregrine, one of our largest stockholders, led to the conclusion that he should serve as a director.
85
Table of Contents
Anthony S. Thornley has served as a director since November 2010. Mr. Thornley served as Interim President and Chief Executive Officer of Callaway Golf Company, a golf equipment manufacturer, from June 2011 to March 5, 2012. He was employed by QUALCOMM Inc. from March 1994 to June 2005, serving as Chief Financial Officer from March 1994 to July 2001, Chief Financial and Operating Officer from July 2001 to February 2002, and President and Chief Operating Officer from February 2002 to June 2005. Prior to joining QUALCOMM, he was with Nortel Networks, a telecommunications equipment manufacturer, for 16 years in various financial and information systems management positions, including Vice President Finance and IS, Public Networks, Vice President Finance, NT World Trade, and Corporate Controller, Nortel Limited. He has also worked for Coopers and Lybrand in public accounting. Mr. Thornley is a director of Callaway Golf, Cavium Networks Inc., a semiconductor company enabling intelligent network applications, Transdel Pharmaceuticals, Inc., a development stage pharmaceutical company, Proximetry, Inc., a network software company, Public Wireless Inc., a wireless infrastructure company, Basho Technologies Inc., a database software company, TipCity Inc., a software company focused on the restaurant industry, and Gorgon Media LLC, a specialized investment company. Mr. Thornley received his B.Sc. from the University of Manchester, England and qualified as a chartered accountant in England and Wales. Mr. Thornley’s experience as a chief financial officer, chief operating officer and director, as well as his experience in the semiconductor industry, led to the conclusion he should serve as a director.
Board Composition
Members of our board of directors are elected at our annual meeting of stockholders.
Independent Directors
Our board of directors is currently composed of nine members. Messrs. Allen, Belk, D’Addario, Monetti, Pavey, Schlachte, Sherwin, and Thornley qualify as independent directors in accordance with the published listing requirements of Nasdaq. The independent members of our board of directors also will hold separate regularly scheduled executive session meetings at which only independent directors are present.
Classified Board
Immediately after this offering, our board of directors will be divided into three classes with staggered three-year terms. At each annual meeting of stockholders, the successors to directors whose terms then expire will be elected to serve from the time of election and qualification until the third annual meeting following election. Our directors will be divided among the three classes as follows:
| • | The Class I directors will be Dr. Cable and Messrs. D’Addario and Monetti, and their terms will expire at the annual meeting of stockholders to be held in 2013; |
| • | The Class II director will be Messrs. Allen, Pavey, and Schlachte, and their terms will expire at the annual meeting of stockholders to be held in 2014; and |
| • | The Class III directors will be Messrs. Belk, Sherwin, and Thornley, and their terms will expire at the annual meeting of stockholders to be held in 2015. |
The authorized number of directors may be changed only by resolution of the board of directors. This classification of the board of directors into three classes with staggered three-year terms may have the effect of delaying or preventing changes in our control or management.
Board Leadership Structure
Our board of directors is currently chaired by our Chief Executive Officer and President, Dr. Cable.
86
Table of Contents
We believe, at this time, that combining the positions of Chief Executive Officer and Chairman of the board of directors helps to ensure that the board of directors and management act with a common purpose. In our view, separating the positions of Chief Executive Officer and Chairman of the board of directors has the potential to give rise to divided leadership, which could interfere with good decision-making or weaken our ability to develop and implement strategy. Instead, we believe that combining the positions of Chief Executive Officer and Chairman of the board of directors provides a single, clear chain of command to execute our strategic initiatives and business plans. In addition, we believe, at this time, that a combined Chief Executive Officer and Chairman of the board of directors is better positioned to act as a bridge between management and the board of directors, facilitating the regular flow of information. We also believe that it is currently advantageous to have a Chairman of the board of directors with an extensive history with and knowledge of our company, as is the case with our current Chief Executive Officer. The board of directors has not appointed a lead independent director.
Board Oversight of Risk
Our audit committee is primarily responsible for overseeing our risk management processes on behalf of the full board of directors. Going forward, we expect that the audit committee will receive regular reports from management regarding our assessment of risks. In addition, the audit committee shall report regularly to the full board of directors, which also considers our risk profile. The audit committee and the full board of directors will focus on the most significant risks we face and our general risk management strategies. While the board of directors oversees our risk management, company management is responsible for day-to-day risk management processes. Our board of directors expects company management to consider risk and risk management in each business decision, to proactively develop and monitor risk management strategies and processes for day-to-day activities and to effectively implement risk management strategies adopted by the audit committee and the board of directors. We believe this division of responsibilities is the most effective approach for addressing the risks we face.
Board Committees
Our board of directors has established an audit committee, a compensation committee, and a nominating and corporate governance committee. Our board of directors and its committees set schedules to meet throughout the year and can also hold special meetings and act by written consent from time to time, as appropriate. Our board of directors has delegated various responsibilities and authority to its committees as generally described below. The committees will regularly report on their activities and actions to the full board of directors. Each member of each committee of our board of directors qualifies as an independent director in accordance with Nasdaq standards. Each committee of our board of directors has a written charter approved by our board of directors. Upon the effectiveness of the registration statement of which this prospectus forms a part, copies of each charter will be posted on our website at www.psemi.com under the Investor Relations section. The inclusion of our website address in this prospectus does not include or incorporate by reference the information on our website into this prospectus.
Audit Committee
The current members of our audit committee are Messrs. Allen, Monetti, and Thornley, each of whom can read and understand fundamental financial statements. Messrs. Allen, Monetti, and Thornley are each independent under the rules and regulations of the SEC and the listing standards of Nasdaq applicable to audit committee members. Mr. Allen chairs the audit committee.
The audit committee of our board of directors oversees our accounting practices, system of internal controls, audit processes and financial reporting processes. Among other things, our audit committee is responsible for reviewing our disclosure controls and processes and the adequacy and effectiveness of our internal controls. It also discusses the scope and results of the audit with our independent registered public accounting firm, reviews
87
Table of Contents
with our management and our independent registered public accounting firm our interim and year-end operating results and, as appropriate, initiates inquiries into aspects of our financial affairs. Our audit committee is responsible for establishing procedures for the receipt, retention, and treatment of complaints regarding accounting, internal accounting controls or auditing matters, and for the confidential, anonymous submission by our employees of concerns regarding questionable accounting or auditing matters. In addition, our audit committee has sole and direct responsibility for the appointment, retention, compensation, and oversight of the work of our independent registered public accounting firm, including approving services and fee arrangements. Significant related party transactions will be approved by our audit committee before we enter into them, as required by applicable rules and listing standards.
Compensation Committee
The current members of our compensation committee are Messrs. Belk, Schlachte, and Sherwin. Mr. Belk chairs the compensation committee. The purpose of our compensation committee is to discharge the responsibilities of our board of directors relating to executive compensation policies and programs. Among other things, specific responsibilities of our compensation committee include evaluating the performance of our Chief Executive Officer and determining our Chief Executive Officer’s compensation. The compensation committee also determines the compensation of our other executive officers in consultation with our Chief Executive Officer. In addition, our compensation committee administers our stock-based compensation plans, including granting equity awards and approving modifications of such awards. Our compensation committee also reviews and approves various other compensation policies and matters.
Nominating and Corporate Governance Committee
The current members of our nominating and corporate governance committee are Messrs. Monetti, Pavey, and Sherwin. Mr. Pavey chairs the nominating and corporate governance committee. The nominating and corporate governance committee oversees the nomination of directors, including, among other things, identifying, evaluating, and making recommendations of nominees to our board of directors and evaluates the performance of our board of directors and individual directors. Our nominating and corporate governance committee is also responsible for reviewing developments in corporate governance practices, evaluating the adequacy of our corporate governance practices, and making recommendations to our board of directors concerning corporate governance matters.
Code of Ethics and Business Conduct
Our board of directors has adopted a code of ethics and business conduct that will become effective upon the effectiveness of the registration statement of which this prospectus forms a part. The code of ethics and business conduct will apply to all of our employees, officers, and directors. Upon the effectiveness of the registration statement of which this prospectus forms a part, the full text of our code of ethics and business conduct will be posted on our website at www.psemi.com under the Investor Relations section. We intend to disclose future amendments to provisions of our code of ethics and business conduct, or waivers of such provisions, at the same location on our website identified above and also in public filings. Information contained on our website is not incorporated by reference into this prospectus, and you should not consider information contained on our website to be part of this prospectus or in deciding whether to purchase shares of our common stock.
Compensation Committee Interlocks and Insider Participation
As noted above, the compensation committee of our board of directors currently consists of Messrs. Belk, Schlachte, and Sherwin. None of our executive officers has ever served as a member of the board of directors or compensation committee of any other entity that has or has had one or more executive officers serving as a member of our board of directors or our compensation committee.
88
Table of Contents
SUMMARY COMPENSATION TABLE
The following table provides information concerning the compensation paid to our “principal executive officer,” and our next two most highly compensated executive officers during fiscal 2011. We refer to these individuals as our “named executive officers.”
| Name and Principal Position |
Year | Salary ($) | Option Awards (1) ($) |
Non-Equity Incentive Plan Compensation (2) ($) |
Total ($) | |||||||||||||||
| James S. Cable, Ph.D. |
2011 | 285,000 | 489,600 | 84,563 | (3) | 859,163 | ||||||||||||||
| Chairman, Chief Executive Officer and President |
||||||||||||||||||||
| Jay C. Biskupski |
2011 | 225,000 | 345,600 | 50,625 | 621,225 | |||||||||||||||
| Chief Financial Officer |
||||||||||||||||||||
| David R. Shepard |
2011 | 220,000 | 259,200 | 49,500 | 528,700 | |||||||||||||||
| Vice President and General Manager, High Performance Solutions Business Unit |
||||||||||||||||||||
| (1) | The amounts in this column represent the aggregate grant date fair value of option awards granted to the officer in the applicable fiscal year computed in accordance with FASB ASC Topic No. 718. See Note 4 of the notes to our consolidated financial statements included elsewhere in this prospectus for a discussion of the assumptions made by the company in determining the grant date fair value of its equity awards. |
| (2) | The amounts in this column include amounts paid in early 2012 with respect to 2011 performance under our 2011 cash incentive bonus program. |
| (3) | Includes $1,200 paid during 2011 under a company program that rewards employees in connection with certain patent filing successes. |
Narrative Explanation of Certain Aspects of the Summary Compensation Table
The base salaries of all executive officers are reviewed annually and adjusted when our Board or its compensation committee determine appropriate. In fiscal 2011, as in fiscal 2010, the annual base salaries for our named executive officers were as follows: Dr. Cable – $285,000; Mr. Biskupski – $225,000; and Mr. Shepard – $220,000. In April 2012, our Board’s compensation committee approved increases in base salaries for our named executive officers, effective upon completion of this offering, as follows: Dr. Cable, $400,000; Mr. Biskupski, $270,000; and Mr. Shepard, $255,000.
Each year, the company adopts a cash incentive bonus program that incorporates certain short-term performance objectives designed to further our long-term business objectives. These objectives, which can change from year to year, have included corporate as well as individual objectives. We also require that participants continue to be employed through the date payments under our annual cash bonus program are made.
The 2011 cash incentive bonus program included a portion (80% of target bonus amount) that tied to specified performance objectives and incorporated a payment formula based upon actual achievement of these objectives relative to the targets and a portion (20% of the target bonus amount) that was entirely subjective and reserved by our compensation committee to be paid only in the event of above-target achievement (superior performance) in corporate performance. The 2011 program allowed for payment of above-target bonus amounts in the event of extraordinary corporate performance, with maximum payment capped at 180% of the target bonus amount. Our compensation committee increased Dr. Cable’s target bonus for 2011 from 50% to 65% of base salary. Mr. Biskupski’s and Mr. Shepard’s target bonus amounts were 50% of their respective base salaries. In April 2012, our compensation committee approved an increase in Dr. Cable’s target bonus for 2012 to 75% of his base salary, effective upon completion of this offering.
89
Table of Contents
The objective portion of the 2011 bonus program incorporated financial objectives (revenue growth, gross margins, operating income, and cash management objectives) plus strategic initiatives (including preparations for this offering). These objectives were established in the early part of the fiscal year, and evaluated throughout 2011 and into 2012. However, our compensation committee retained substantial discretion to determine amounts paid out under the program. Although our actual revenue improved on an annual basis in 2011, including to an extent that resulted in over-achievement under the terms of our 2011 annual incentive bonus program, we did not achieve the target level of performance specified under the program for the gross margins or operating income objectives. In reviewing achievement under the program, our compensation committee placed great emphasis on the fact that we did not fully achieve all objectives in determining that no payment would be made with respect to the 20% “superior performance” portion of the program and further determined that under the program formula established early in 2011 no payments had been earned under the 80% objectives portion of the program. Our compensation committee took note, however, of the fact that we had finished the year well positioned for 2012 and beyond, including as a result of our revenues having grown and our having experienced certain design wins, market share gains, and product and process milestones. Following this review, the compensation committee approved bonus payments equal to 45% of target bonuses in order to recognize the significant effort and judgment that the management team, individually and as a team, demonstrated during 2011.
In recent years, we have granted options to purchase shares of our common stock under our 2004 Stock Plan. Executive officers typically receive a stock option grant upon joining the company and may receive additional options thereafter, including in recognition of a promotion or extraordinary performance. In addition, our board of directors has historically allowed our named executive officers (as well as other employees) to exercise their options prior to vesting, with any shares issued upon such exercise subject to repurchase by us at the exercise price, in the event the executive terminates his employment with us prior to vesting in such shares. For information regarding vesting acceleration provisions applicable to the options held by our named executive officers, which provisions determine the extent of the company’s repurchase rights of unvested shares, please see the section titled “Severance or Employment Agreements” below.
In recent years, our named executive officers have generally received a new hire option grant that vests over a four year period with 25% vesting after the first twelve months of service and the remainder vesting over the next three years of continued service. Subsequent grants made on an annual basis, or in recognition of a promotion or extraordinary performance, have generally vested in equal installments over a one year period in the fourth year following the date of grant, subject to continued service. In July 2010, in contemplation of this offering, our compensation committee decided to cease granting incentive stock options and issue all options as nonstatutory stock options, cease granting options that allow for exercise of unvested shares, and changed the vesting schedule that applied after any cliff vesting date from daily to monthly vesting. All options are granted with an exercise price equal to or above the grant date fair market value of our common stock, as determined in good faith by our board of directors. For more information, please see the section titled “Management’s Discussion and Analysis of Financial Condition and Results of Operations” above.
In October 2011 our board of directors approved certain option grants, each of which had an exercise price of $9.76 per share, to our named executive officers as follows:
| Name |
# of
Shares Underlying Option Grants |
|||
| James S. Cable, Ph.D. |
115,803 | |||
| Jay C. Biskupski |
81,743 | |||
| David R. Shepard |
61,307 | |||
90
Table of Contents
Other than relocation benefits offered in connection with hiring a new executive officer or tax preparation assistance in connection with cross-border employment arrangements, we generally have not provided perquisites (or personal benefits) to our named executive officers. See “Severance or Employment Agreements.” We offer and allow our named executive officers to participate in a tax-qualified retirement plan commonly known as a “401(k) plan.”
OUTSTANDING EQUITY AWARDS AT 2011 FISCAL YEAR-END
The following table sets forth information regarding each unexercised option held by each of our named executive officers as of December 31, 2011.
The vesting schedule applicable to each outstanding award is described in the footnotes to the table below. For information regarding the vesting acceleration provisions applicable to the options held by our named executive officers, please see the section titled “Severance or Employment Agreements” below.
| Option Awards | ||||||||||||||||||||||||
| Name |
Date of Grant |
Initial Vesting Date |
Number of Securities Underlying Unexercised Options Exercisable (#) (*) |
Number of Securities Underlying Unexercised Options Unexercisable (#) |
Option Exercise Price ($) |
Option Expiration Date |
||||||||||||||||||
| James S. Cable, Ph.D. |
11/21/02 | 9/4/02 | 93,460 | (1)(2) | — | 0.73 | 11/21/12 | |||||||||||||||||
| 1/30/03 | 1/30/03 | 27,247 | (1) | — | 0.73 | 1/30/13 | ||||||||||||||||||
| 4/2/04 | 4/2/04 | 14,713 | (3) | — | 0.73 | 4/2/14 | ||||||||||||||||||
| 4/2/04 | 4/2/04 | 8,174 | (4) | — | 0.73 | 4/2/14 | ||||||||||||||||||
| 6/9/04 | 4/1/04 | 35,422 | (5) | — | 0.73 | 6/9/14 | ||||||||||||||||||
| 6/9/04 | 4/1/06 | 15,432 | (6) | — | 0.73 | 6/9/14 | ||||||||||||||||||
| 6/9/04 | 4/1/07 | 31,321 | (6) | — | 0.73 | 6/9/14 | ||||||||||||||||||
| 5/19/05 | 4/1/08 | 80,354 | (7) | — | 0.88 | 5/19/15 | ||||||||||||||||||
| 5/25/06 | 5/25/06 | 272,479 | (5) | — | 1.76 | 5/25/16 | ||||||||||||||||||
| 4/1/09 | 2/1/08 | 119,302 | (8)(9) | — | 1.76 | 1/31/18 | ||||||||||||||||||
| 4/1/09 | 4/1/10 | 163,039 | (8)(10) | — | 1.76 | 1/31/18 | ||||||||||||||||||
| 5/28/09 | 3/31/11 | 136,239 | (10) | — | 1.76 | 5/28/19 | ||||||||||||||||||
| 5/28/09 | 3/31/12 | 136,239 | (10) | — | 1.76 | 5/28/19 | ||||||||||||||||||
| 7/22/10 | 4/1/13 | 115,803 | (10) | — | 7.12 | 7/22/20 | ||||||||||||||||||
| 10/25/11 | 4/1/14 | 115,803 | (6) | — | 9.76 | 10/25/21 | ||||||||||||||||||
| Jay C. Biskupski |
4/14/09 | 4/14/09 | 166,042 | (11) | — | 1.76 | 4/14/19 | |||||||||||||||||
| 4/14/09 | 4/14/09 | 55,347 | (12) | — | 1.76 | 4/14/19 | ||||||||||||||||||
| 7/22/10 | 4/1/13 | 81,743 | (10) | — | 7.12 | 7/22/20 | ||||||||||||||||||
| 10/25/11 | 4/1/14 | 81,743 | (6) | — | 9.76 | 10/25/21 | ||||||||||||||||||
| David R. Shepard |
1/28/10 | 1/28/10 | 8,174 | (13) | — | 5.73 | 1/28/20 | |||||||||||||||||
| 5/20/10 | 5/20/10 | 136,239 | (14) | — | 6.61 | 5/20/20 | ||||||||||||||||||
| 10/25/11 | 4/1/14 | 40,871 | (6) | — | 9.76 | 10/25/21 | ||||||||||||||||||
| 10/25/11 | 10/25/11 | 20,435 | (15) | — | 9.76 | 10/25/21 | ||||||||||||||||||
| * | Unless otherwise indicated in the notes below, each of the options described in this table is exercisable in full as of the grant date but is subject to a right of repurchase held by us that lapses on the option’s vesting schedule. |
| (1) | Shares underlying the option vest with respect to 25% of the shares when the option holder completes 12 months of continuous service after the initial vesting date and as to an additional 36 successive equal monthly installments thereafter. |
| (2) | 98,038 shares were originally subject to this option. 4,577 shares were exercised by Dr. Cable during fiscal 2010. |
91
Table of Contents
| (3) | Shares underlying the option vest immediately on the initial vesting date. |
| (4) | Shares underlying the option vest with respect to 7,220 shares on the initial vesting date and the remaining shares vest in seven successive equal monthly installments from the initial vesting date. |
| (5) | Shares underlying the option vest in 48 successive equal monthly installments from the initial vesting date. |
| (6) | Shares underlying the option vest in 12 successive equal monthly installments from the initial vesting date. |
| (7) | Shares underlying the option vest in 24 successive equal monthly installments from the initial vesting date. |
| (8) | The shares under this option were repriced in February 2009 pursuant to a repricing program approved by our board of directors. For more information, please see the section titled “Compensation Discussion and Analysis” above. |
| (9) | Shares underlying the option vest in successive equal daily installments over a 26-month period from the initial vesting date. |
| (10) | Shares underlying the option vest in successive equal daily installments over a 12-month period from the initial vesting date. |
| (11) | Shares underlying the option vest with respect of 55,347 shares on February 9, 2010 and in equal daily installments over a 36-month period thereafter. |
| (12) | Shares underlying the option vest with in successive equal daily installments from the initial vesting date to February 9, 2011. |
| (13) | Shares underlying the option vest in five successive equal monthly installments from the initial vesting date. |
| (14) | Shares underlying the option vest with respect to 25% of the shares when the option holder completes 12 months of continuous service after the initial vesting date and in additional successive equal daily installments over a 36-month period thereafter. |
| (15) | Shares underlying the option vest in 30 successive equal monthly installments from the initial vesting date. |
Severance or Employment Agreements
In April 2012, in anticipation of completion of this offering, our compensation committee approved new employment agreements with each of Dr. Cable and Mr. Biskupski. These new agreements will become effective and supersede existing agreements between us and each officer at the time of this offering. The following describes the material terms of these new agreements, as well as the manner in which Dr. Cable’s and Mr. Biskupski’s benefits under the new agreements differ from their benefits under their prior agreements.
In the event of the officer’s involuntary termination of employment, whether or not in connection with a change of control, he will become entitled to salary continuation and payment of healthcare benefits for a period of up to 24 months in the case of Dr. Cable and up to 12 months in the case of Mr. Biskupski. In addition, if the involuntary termination occurs within 12 months following a change of control of the company, each officer will be entitled to full vesting of all equity awards then held. All benefits under these agreements are contingent upon the officer’s delivery of a release of claims in favor of the company.
For purposes of these agreements, the following definitions apply:
| • | Involuntary termination of employment means either: |
| • | termination of employment by the company other than for cause (generally defined as illegal conduct or serious breaches of duties to us) or due to death or disability; or |
| • | voluntary resignation following a material reduction in duties, authority, compensation, or benefits; a forced relocation of the place of employment; or our breach of the employment agreement, including our failure to have the employment agreement assumed in the event of our change of control. |
| • | Change of control means any of the following: |
| • | A sale of our assets; |
| • | Our merger with or into any other entity (other than one in which our existing stockholders retain control of the combined entity); |
92
Table of Contents
| • | The acquisition by any person of more than 50% of the voting power represented by our voting stock; or |
| • | A change in a majority of our board members during any 12-month period under circumstances such as a proxy contest. |
These agreements will replace and supersede agreements between us and each of Dr. Cable, originally entered into in 2004, and Mr. Biskupski, entered into at the time of his hiring in early 2009. The new agreements replace the change of control definition in the prior agreement with the Change of Control definition in our 2012 Equity Incentive Plan, expanding the definition to include a change in a majority of our board members during any 12-month period under circumstances such as a proxy contest. In addition, under his prior agreement, Dr. Cable was not entitled to any severance benefits outside of the change of control context and such severance benefits were provided only for 12 months. Under Mr. Biskupski’s prior agreement, he was entitled to only six months of severance benefits (without regard to whether a triggering termination occurred in connection with a change of control) and his change of control-related vesting acceleration benefits applied only if his involuntary termination occurred within six months of a qualifying transaction. In exchange for the additional benefits provided under the new employment agreement, Mr. Biskupski gave up his right to six months of vesting acceleration in the event his involuntary termination occurred outside of the change of control context.
2011 Director Compensation
The following table sets forth information about the compensation of each person who served as a director during the 2011 fiscal year, other than a director who also served as a named executive officer.
| Name |
Cash Compensation ($) |
Option Awards ($)(1) |
Total ($) |
|||||||||
| Paul N. D’Addario |
— | — | — | |||||||||
| John H. Allen (2) |
30,750 | 46,080 | 76,830 | |||||||||
| Jeffrey K. Belk (3) |
26,250 | 46,080 | 72,330 | |||||||||
| Gary A. Monetti (4) |
27,000 | 46,080 | 73,080 | |||||||||
| Robert D. Pavey |
— | — | — | |||||||||
| Carl P. Schlachte (5) |
22,125 | 46,080 | 68,205 | |||||||||
| Elton B. Sherwin |
— | — | — | |||||||||
| Anthony S. Thornley (6) |
23,250 | 46,080 | 69,330 | |||||||||
| (1) | The amounts in this column represent the aggregate grant date fair value of the stock option, computed in accordance with FASB ASC Topic No. 718 excluding the impact of estimated forfeitures. See Note 4 of the section titled “Notes to Consolidated Financial Statements” included elsewhere in this prospectus for a discussion of the assumptions made by the company in determining the grant date fair value of its equity awards. |
| (2) | Mr. Allen held options to purchase an aggregate of 50,066 shares of common stock as of December 31, 2011. |
| (3) | Mr. Belk held options to purchase an aggregate of 66,275 shares of common stock as of December 31, 2011. |
| (4) | Mr. Monetti held options to purchase an aggregate of 64,705 shares of common stock as of December 31, 2011. |
| (5) | Mr. Schlachte held options to purchase an aggregate of 43,596 shares of common stock as of December 31, 2011. |
| (6) | Mr. Thornley held options to purchase an aggregate of 43,596 shares of common stock as of December 31, 2011. |
93
Table of Contents
Non-Employee Director Compensation
In October 2010, our board of directors adopted a compensation program for our non-employee directors. Beginning in April 2011, each non-employee member of our board of directors became entitled to receive an annual cash retainer of $25,000. In addition, each non-employee director serving on our audit committee, compensation committee, and nomination and corporate governance committee became entitled to an annual cash retainer of $6,000, $4,500, and $2,500, respectively, and the chair of each such committee became entitled to an additional annual cash retainer of $10,000, $3,000, and $2,500, respectively. The retainer fees are paid in quarterly payments on the first day of each calendar quarter.
Non-employee directors are entitled to an initial stock option award to purchase 21,798 shares of our common stock upon such director’s election to our board of directors. Each initial option will vest in 25% of the shares after 12 months of board service and as to the remainder of the shares in a series of 36 successive equal monthly installments thereafter. Each year thereafter, each non-employee director continuing to serve on our board following our annual stockholders meeting will receive an annual stock option award to purchase 10,899 shares of our common stock. Each annual option will vest over 12 months in a series of 12 successive equal monthly installments. All such options will have an exercise price equal to the fair market value of our common stock on the date of the award. On October 25, 2011, we granted to each of Messrs. Allen, Belk, Monetti, Schlachte, and Thornley a stock option to purchase 10,899 shares of our common stock in connection with his service on our board of directors. Each option vests in 12 equal monthly installments from April 1, 2014 and will fully vest if we are acquired while each such director is in our service. For further information regarding our equity compensation programs, see “Management – Stock-based Compensation Plans – 2012 Equity Incentive Plan.” We have a policy of reimbursing directors for travel, lodging, and other reasonable expenses incurred in connection with their attendance at board or committee meetings.
Stock-based Compensation Plans
2012 Equity Incentive Plan
Our board of directors adopted our 2012 Equity Incentive Plan on April 24, 2012, and our stockholders approved it on May 8, 2012. The 2012 Equity Incentive Plan became effective on adoption although no awards may be made under it until the effective date of the registration statement of which this prospectus is a part, at which time our 2012 Equity Incentive Plan will replace our 2004 Stock Plan and the 1996 Stock Plan. No further grants will be made under either of those plans after the effective date of the registration statement of which this prospectus is a part. However, options outstanding after this offering under the 2004 Stock Plan or the 1996 Stock Plan will continue to be governed by their existing terms.
Share Reserve. We have reserved 2,000,000 shares of our common stock for issuance under the 2012 Equity Incentive Plan, plus the number of shares (not to exceed 9,008,407) remaining available for issuance under the 2004 Stock Plan and 1996 Stock Plan and any shares subject to awards under the 2004 Stock Plan and 1996 Stock Plan. In general, if awards are forfeited, repurchased, expire or are settled in cash, then the corresponding shares will again become available for awards under the 2012 Equity Incentive Plan. The number of shares reserved for issuance under the plan will be increased automatically on the first day of each fiscal year of the company, starting with fiscal year 2013, by a number equal to the smallest of:
| • | 2,250,000 shares; |
| • | 4% of the shares of common stock outstanding at that time; or |
| • | the number of shares determined by our board of directors. |
In general, to the extent that awards under the 2012 Equity Incentive Plan are forfeited or terminate for any other reason without the issuance of shares, those shares will again become available for awards, as will shares issued upon the exercise of options that are reacquired by the company. Further, in general, to the extent awards under
94
Table of Contents
the 2004 Stock Plan and 1996 Stock Plan are forfeited or terminate for any other reason without the issuance of shares, those shares will again become available for awards under the 2012 Equity Incentive Plan, as will unvested shares issued upon the exercise of options that are reacquired by the company at their original purchase price and shares surrendered pursuant to an exchange program. All share numbers described in this summary of the 2012 Equity Incentive Plan will automatically adjust in the event of a stock split, a stock dividend, or a reverse stock split.
Administration. The compensation committee of our board of directors administers the 2012 Equity Incentive Plan. The committee has the complete discretion to make all decisions relating to the plan and outstanding awards, including repricing outstanding options and modifying outstanding awards in other ways.
Eligibility. Employees, non-employee directors, and consultants are eligible to participate in our 2012 Equity Incentive Plan.
Types of Awards. Our 2012 Equity Incentive Plan provides for the following types of awards:
| • | incentive and nonstatutory stock options to purchase shares of our common stock; |
| • | stock appreciation rights; |
| • | restricted shares of our common stock; |
| • | stock units; and |
| • | performance cash awards. |
Options and Stock Appreciation Rights. The exercise price for options granted under the 2012 Equity Incentive Plan may not be less than 100% of the fair market value of our common stock on the option grant date. Optionees may pay the exercise price in cash, or with the consent of the compensation committee:
| • | with shares of common stock that the optionee already owns; |
| • | by an immediate sale of the option shares through a broker approved by us; or |
| • | with a full-recourse promissory note, if permitted by applicable law. |
A participant who exercises a stock appreciation right receives the increase in value of our common stock over the base price. The base price for stock appreciation rights may not be less than 100% of the fair market value of our common stock on the grant date. The settlement value of a stock appreciation right may be paid in cash, shares of common stock or a combination of both.
Options and stock appreciation rights vest as determined by the compensation committee. In general, they will vest over a four-year period following the date of grant. Options and stock appreciation rights expire at the time determined by the compensation committee, but in no event more than ten years after they are granted. They generally expire earlier if the participant’s service terminates earlier. No participant may receive options or stock appreciation rights under the 2012 Equity Incentive Plan covering more than 500,000 shares in any fiscal year, except that a new employee may receive options or stock appreciation rights covering up to 2,000,000 shares in the fiscal year in which employment starts.
Restricted Shares and Stock Units. Restricted shares and stock units may be awarded under the 2012 Equity Incentive Plan in return for any lawful consideration, and participants who receive restricted shares or stock units generally are not required to pay for their awards in cash. In general, these awards will be subject to vesting. Vesting may be based on length of service, the attainment of performance-based milestones, or a combination of both, as determined by the compensation committee. No participant may receive restricted shares or stock units
95
Table of Contents
with performance-based vesting covering more than 200,000 shares in any fiscal year, except that a new employee may receive restricted shares or stock units covering up to 700,000 shares in the fiscal year in which his or her employment starts. Settlement of vested stock units may be made in cash, shares of common stock, or a combination of both.
Performance Cash Awards. Performance cash awards may be granted under the 2012 Equity Incentive Plan that qualify as performance-based compensation that is not subject to the income tax deductibility limitations imposed by Section 162(m) of the Code, if the award is approved by our compensation committee and the grant or vesting of the award is tied solely to the attainment of performance goals during a designated performance period.
Performance goals for the grant or vesting of performance cash awards, as well as stock performance based awards, granted under the 2012 Equity Incentive Plan may be based on any one of, or combination of, the following: (a) earnings (before or after taxes); (b) earnings per share; (c) earnings before interest, taxes and depreciation; (d) earnings before interest, taxes, depreciation and amortization; (e) total stockholder return; (f) return on equity or average stockholders’ equity; (g) return on assets, investment or capital employed; (h) operating income; (i) gross margin; (j) operating margin; (k) net operating income; (l) net operating income after tax; (m) return on operating revenue; (n) objective corporate or individual strategic goals; (o) sales or revenue; (p) expense or cost reduction; (q) working capital; (r) economic value added (or an equivalent metric); (s) market share; (t) cash measures including cash flow and cash balance; (u) operating cash flow; (v) cash flow per share; (w) share price; (x) debt reduction; (y) customer satisfaction; (z) stockholders’ equity; (aa) contract awards or backlog; and (bb) objective individual performance goals. Finally, to the extent a performance cash award is not intended to comply with Section 162(m) of the Code, our compensation committee may select other measures of performance.
No participant may be paid more than $10,000,000 in cash in any calendar year pursuant to a performance cash award granted under the 2012 Equity Incentive Plan. The Section 162(m)-related annual limits that apply to stock performance based awards granted under the 2012 Equity Incentive Plan are described above.
Changes in Capitalization. In the event that there is a specified type of change in our capital structure without our receipt of consideration, such as a stock split, appropriate adjustments will be made to (a) the kind and maximum number of shares reserved for issuance under the 2012 Equity Incentive Plan, (b) the kind and maximum number of shares by which the share reserve may increase automatically each year, (c) the kind and maximum number of shares subject to stock awards that can be granted to a participant in a calendar year (as established under the 2012 Equity Incentive Plan pursuant to Section 162(m) of the Code), (d) the kind and maximum number of shares that may be issued upon the exercise of incentive stock options, and (e) the kind and number of shares and exercise price, strike price, or purchase price, if applicable, of all outstanding stock awards.
Corporate Transactions. In the event that we are a party to a merger, consolidation, or a change in control transaction, all outstanding stock awards will be governed by the terms of the definitive transaction agreement or in a manner determined by our board of directors. Such treatment may include any of the following actions with respect to each outstanding stock award:
| • | the continuation, assumption, or substitution of a stock award by a surviving corporation or its parent company; |
| • | the cancellation of options and stock appreciation rights, provided that participants be given an opportunity to exercise their awards prior to the closing of the transaction; |
| • | the acceleration of the vesting of a stock award followed by its termination prior to the closing of the transaction; |
| • | the cancellation of options and stock appreciation rights in exchange for a payment equal to the excess, if any, of (a) the value of the property the participant would have received upon exercise of the stock award over (b) the exercise price otherwise payable in connection with the stock award; or |
96
Table of Contents
| • | the cancellation of stock units in exchange for a payment equal to the value that the holder of each share of common stock receives in the transaction. |
For this purpose, a change in control transaction includes:
| • | any person acquiring beneficial ownership of more than 50% of our total voting power; |
| • | the sale or disposition of all or substantially all of our assets; or |
| • | any merger or consolidation of the company where our voting securities represent 50% or less of the total voting power of the surviving entity or its parent. |
Our board of directors is not obligated to treat all stock awards, or portions thereof, in the same manner.
Changes in Control. In the event of specified change in control transactions, our board of directors may accelerate the vesting of stock awards (a) immediately upon the occurrence of the transaction, whether or not the stock award is continued, assumed, or substituted by a surviving corporation or its parent in the transaction, or (b) in connection with a termination of a participant’s service following such a transaction.
Amendments or Termination. Our board of directors may amend or terminate the 2012 Equity Incentive Plan at any time. If our board of directors amends the plan, it does not need to ask for stockholder approval of the amendment unless applicable law so requires or the board of directors deems such approval to be advisable. The 2012 Equity Incentive Plan will continue in effect for 10 years from its adoption date, unless the board of directors terminates the plan earlier.
2004 Stock Plan and 1996 Stock Plan
Our 2004 Stock Plan was adopted by our board of directors on June 23, 2004, and our stockholders approved it on August 19, 2004. Our 1996 Stock Plan was adopted by our board of directors on November 15, 1996, and our stockholders approved it on May 1, 1997. No further awards will be made under our 2004 and 1996 Stock Plans after this offering. Awards outstanding under the 2004 and 1996 Stock Plans after the effective date of the registration statement of which this prospectus is a part will continue to be governed by their existing terms.
Share Reserve. As of June 30, 2012, options to purchase 7,406,006 shares of our common stock are outstanding under the 2004 Stock Plan and 1996 Stock Plan. No other awards are outstanding under the 2004 or 1996 Stock Plans.
Administration. The compensation committee of the board of directors administers the 2004 and 1996 Stock Plans.
Eligibility. Employees, consultants and members of the company’s board of directors (including non-employee board members) are eligible to participate in our 2004 and 1996 Stock Plans.
Types of Awards. Our 2004 and 1996 Stock Plans provide for the following types of awards granted with respect to shares of our common stock:
| • | incentive and nonstatutory stock options; and |
| • | stock purchase rights. |
Vesting and Expiration. Awards vest as determined by the board of directors or its compensation committee, generally over a four-year period following the date of grant.
97
Table of Contents
Under the 2004 Stock Plan, awards vest in full if the company is subject to a merger or experiences a change of control, unless the surviving entity assumes the award or replaces it with a comparable award. A change of control includes:
| • | a merger or consolidation of the company, other than a transaction that results in the voting securities of the company outstanding immediately prior to the transaction continuing to represent at least 50% of the total voting power of the company, the surviving entity or its parent as of immediately after such transaction; |
| • | a sale or disposition of all or substantially all of our assets; or |
| • | an acquisition of at least 50% of the total voting power of the company’s then-outstanding stock by any person or group, other than as a result of a private financing of the company approved by the board of directors. |
Under the 1996 Stock Plan, in the event of a merger or the sale of substantially all of the company’s assets, awards vest in full unless the successor corporation or its parent assumes the award or replaces it with a comparable award.
Payment. The exercise price for options granted under the 2004 Stock Plan is determined by the board of directors or the compensation committee but, with respect to incentive stock options, may not be less than 100% of the fair market value of our common stock on the grant date. The exercise price for nonstatutory stock options granted under the 1996 Stock Plan may not be less than 85% of the fair market value of our common stock on the grant date, and the exercise price for incentive stock options may not be less than 100% of the fair market value of our common stock on the grant date. Under both the 2004 and 1996 Stock Plans, optionees may pay the exercise price by using:
| • | cash or cash equivalents; |
| • | shares of common stock that the optionee already owns, but only if such shares have been owned for at least six months on the date of surrender; |
| • | a promissory note; or |
| • | a cashless exercise program implemented by the company. |
Stock purchase rights may be awarded under the 2004 and 1996 Stock Plans in consideration of services rendered to us prior to the grant date of the award.
Expiration. Options expire not more than 10 years after they are granted but generally expire earlier if the optionee’s service terminates earlier.
Other Stock Option Arrangements
In 2001 and 2002, we granted a series of nonstatutory stock options outside of any equity compensation plan to members of our board of directors. As of March 31, 2012, options to purchase 381 shares of our common stock remain outstanding under these arrangements.
2012 Employee Stock Purchase Plan
Our 2012 Employee Stock Purchase Plan was adopted by our board of directors on April 24, 2012 and our stockholders approved it on May 8, 2012. The 2012 Employee Stock Purchase Plan will become effective on the effective date of the registration statement of which this prospectus is a part although no offering period will commence until such time following this offering as the Compensation Committee determines to commence operation of the 2012 Employee Stock Purchase Plan. Our 2012 Employee Stock Purchase Plan is intended to qualify under Section 423 of the Code.
98
Table of Contents
Share Reserve. We have reserved 1,000,000 shares of our common stock for issuance under the plan. The number of shares reserved under the 2012 Employee Stock Purchase Plan will automatically adjust in the event of a stock split, a stock dividend, or a reverse stock split (including an adjustment to the per-purchase period share limit).
Administration. The compensation committee of our board of directors will administer the plan.
Eligibility. All of our employees are eligible to participate if we employ them for more than 20 hours per week and for more than five months per year. Eligible employees may begin participating in the 2012 Employee Stock Purchase Plan at the start of any offering period.
Offering Periods. Each offering period will last a number of months determined by the compensation committee, not to exceed 27 months. A new offering period will begin periodically, as determined by the compensation committee. Offering periods may overlap or may be consecutive. Unless otherwise determined by the compensation committee, two offering periods of six months’ duration will begin in each calendar year on May 1 and November 1. The compensation committee anticipates commencing offering periods at some time following the completion of this offering.
Amount of Contributions. Our 2012 Employee Stock Purchase Plan permits each eligible employee to purchase common stock through payroll deductions. Each employee’s payroll deductions may not exceed 15% of the employee’s cash compensation. A maximum number of shares that may be purchased by a participant during each offering or purchase period will apply. The value of the shares purchased in any calendar year may not exceed $25,000. Participants may withdraw their contributions at any time before stock is purchased.
Purchase Price. The price of each share of common stock purchased under our 2012 Employee Stock Purchase Plan will not be less than 85% of the lower of:
| • | the fair market value per share of common stock on the first day of the applicable offering period; or |
| • | the fair market value per share of common stock on the purchase date. |
Other Provisions. Employees may end their participation in the 2012 Employee Stock Purchase Plan at any time. Participation ends automatically upon termination of employment with the company. If a change of control of the company occurs, our 2012 Employee Stock Purchase Plan will end and shares will be purchased with the payroll deductions accumulated to date by participating employees. Our board of directors or the compensation committee may amend or terminate the 2012 Employee Stock Purchase Plan at any time.
Limitation of Liability and Indemnification
We have entered into indemnification agreements with each of our directors and executive officers and certain other key employees. The indemnification agreements provide that we will indemnify each of our directors, executive officers, and such other key employees against any and all expenses incurred by that director, executive officer, or other key employee because of his or her status as one of our directors, executive officers, or other key employees, to the fullest extent permitted by Delaware law, our amended and restated certificate of incorporation and our amended and restated bylaws. In addition, the indemnification agreements provide that, to the fullest extent permitted by Delaware law, we will advance all expenses incurred by our directors, executive officers, and other key employees in connection with a legal proceeding.
Our amended and restated certificate of incorporation and amended and restated bylaws contain provisions relating to the limitation of liability and indemnification of directors and officers. Our amended and restated certificate of incorporation provides that our directors will not be personally liable to us or our stockholders for monetary damages for any breach of fiduciary duty as a director, except for liability:
| • | for any breach of the director’s duty of loyalty to us or our stockholders; |
| • | for acts or omissions not in good faith or that involve intentional misconduct or a knowing violation of law; |
99
Table of Contents
| • | in respect of unlawful payments of dividends or unlawful stock repurchases or redemptions as provided in Section 174 of the Delaware General Corporation Law; or |
| • | for any transaction from which the director derives any improper personal benefit. |
Our amended and restated certificate of incorporation also provides that if Delaware law is amended after the approval by our stockholders of the certificate of incorporation to authorize corporate action further eliminating or limiting the personal liability of directors, then the liability of our directors will be eliminated or limited to the fullest extent permitted by Delaware law.
Our amended and restated bylaws provide that we will indemnify our directors and officers to the fullest extent permitted by Delaware law, as it now exists or may in the future be amended, against all expenses and liabilities reasonably incurred in connection with their service for or on our behalf. Our amended and restated bylaws provide that we shall advance the expenses incurred by a director or officer in advance of the final disposition of an action or proceeding, and permit us to secure insurance on behalf of any officer, director, employee, or other enterprise agent for any liability arising out of his or her action in that capacity, whether or not Delaware law would otherwise permit indemnification.
100
Table of Contents
CERTAIN RELATIONSHIPS AND RELATED PARTY TRANSACTIONS
In addition to the compensation arrangements with directors and executive officers and the registration rights described elsewhere in this prospectus, the following is a description of each transaction since January 1, 2009 and each currently proposed transaction in which:
| • | we have been or are to be a participant; |
| • | the amount involved exceeds $120,000; and |
| • | any of our directors, executive officers, or holders of 5% or greater of our capital stock, or any immediate family member of or person sharing the household with any of these individuals (other than tenants or employees), had or will have a direct or indirect material interest. |
Indemnification Agreements
We have entered into indemnification agreements with each of our directors and executive officers and certain other key employees. The indemnification agreements provide that we will indemnify each of our directors, executive officers, and such other key employees against any and all expenses incurred by that director, executive officer, or other key employee because of his or her status as one of our directors, executive officers, or other key employees, to the fullest extent permitted by Delaware law, our amended and restated certificate of incorporation, and our amended and restated bylaws. In addition, the indemnification agreements provide that, to the fullest extent permitted by Delaware law, we will advance all expenses incurred by our directors, executive officers, and other key employees in connection with a legal proceeding. For more information regarding these agreements, please refer to the “Management – Limitation of Liability and Indemnification” section of this prospectus.
Policies and Procedures for Related Party Transactions
We have adopted a related party transaction policy under which our directors and executive officers, including their immediate family members and affiliates, are not permitted to enter into a related party transaction with us without the prior consent of our audit committee, or other independent committee of our board of directors in the case it is inappropriate for our audit committee to review such transaction due to a conflict of interest. Any request for us to enter into a transaction with an executive officer, director, or any of such persons’ immediate family members or affiliates, in which the amount involved exceeds $120,000 must first be presented to our audit committee for review, consideration and approval. All of our directors and executive officers are required to report to our audit committee any such related party transaction. In approving or rejecting the proposed agreement, our audit committee shall consider the relevant facts and circumstances available and deemed relevant to the audit committee, including, but not limited to the risks, costs, and benefits to us, the terms of the transaction, the availability of other sources for comparable services or products, and, if applicable, the impact on a director’s independence. Our audit committee shall approve only those agreements that, in light of known circumstances, are not inconsistent with our best interests, as our audit committee determines in the good faith exercise of its discretion.
All of the transactions described above were entered into prior to the adoption of our related party transaction policy and were approved by our board of directors. However, all of the transactions set forth above were approved by a majority of our board of directors, including a majority of the independent and disinterested members of our board of directors. We believe that we have executed all of the transactions set forth above on terms no less favorable to us than we could have obtained from unaffiliated third-parties. It is our intention to ensure that all future transactions between us and our officers, directors, and principal stockholders and their affiliates are approved by a majority of our board of directors, including a majority of the independent and disinterested members of our board of directors, and are on terms no less favorable to us than those that we could obtain from unaffiliated third-parties.
101
Table of Contents
PRINCIPAL AND SELLING STOCKHOLDERS
The following table provides information concerning beneficial ownership of our capital stock as of June 30, 2012, and as adjusted to reflect the sale of the common stock being sold in this offering, by:
| • | each stockholder, or group of affiliated stockholders, that owns 5% or greater of our outstanding capital stock; |
| • | each of our named executive officers; |
| • | each of our directors; |
| • | all of our directors and executive officers as a group; and |
| • | the selling stockholders. |
The following table lists the number of shares and percentage of shares beneficially owned based on 25,229,301 shares of common stock outstanding as of June 30, 2012. This number reflects:
| • | 2,845,204 shares of common stock; |
| • | the conversion of 5,762,851 shares of Series A1 convertible preferred stock into 5,762,851 shares of common stock upon the closing of this offering; |
| • | the conversion of 1,628,936 shares of Series B1 convertible preferred stock into 1,628,936 shares of common stock upon the closing of this offering; |
| • | the conversion of 6,107,910 shares of Series C1 convertible preferred stock into 6,107,910 shares of common stock upon the closing of this offering; and |
| • | the conversion of 8,884,400 shares of Series D1 convertible preferred stock into 8,884,400 shares of common stock upon the closing of this offering. |
The table also lists the applicable percentage beneficial ownership based on shares of common stock outstanding upon completion of this offering, assuming no exercise of the underwriters’ over-allotment option to purchase up to an aggregate of shares of our common stock.
Beneficial ownership is determined in accordance with the rules of the SEC, and generally includes voting power and/or investment power with respect to the securities held. Shares of common stock subject to options currently exercisable or exercisable within 60 days of June 30, 2012, are deemed outstanding and beneficially owned by the person holding such options for purposes of computing the number of shares and percentage beneficially owned by such person, but are not deemed outstanding for purposes of computing the percentage beneficially owned by any other person. Except as indicated in the footnotes to this table, and subject to applicable community property laws, the persons or entities named have sole voting and investment power with respect to all shares of our common stock shown as beneficially owned by them.
102
Table of Contents
Unless otherwise indicated, the principal address of each of the stockholders below is c/o Peregrine Semiconductor Corporation, 9380 Carroll Park Drive, San Diego, California 92121.
| Shares Beneficially Owned Prior to the Offering |
Number
of Shares Offered |
Shares Beneficially Owned After the Offering |
||||||||||||||||||
| Name and Address of Beneficial Owner |
Number | Percentage | Number | Percentage | ||||||||||||||||
| 5% or Greater Stockholders |
||||||||||||||||||||
| Morgenthaler Partners VI, L.P. (1) |
3,551,013 | 14.07 | % | — | 3,551,013 | % | ||||||||||||||
| 2710 Sand Hill Road, Suite 100 Menlo Park, CA 94025 |
||||||||||||||||||||
| Entities affiliated with Advanced Equities, Inc. (2) |
2,756,395 | 10.87 | % | — | 2,756,395 | % | ||||||||||||||
| 311 S. Wacker Drive, Suite 1650 Chicago, IL 60606 |
||||||||||||||||||||
| U.S. Small Business Administration (3) |
2,677,236 | 10.61 | % | — | 2,677,236 | % | ||||||||||||||
| 1100 G Street, N.W., 11th Floor Washington, D.C. 20005 |
||||||||||||||||||||
| Ridgewood Peregrine LLC (4) |
2,603,781 | 10.32 | % | — | 2,603,781 | % | ||||||||||||||
| 14 Philips Parkway Montvale, NJ 07645 |
||||||||||||||||||||
| Entities affiliated with Palisades Ventures, L.P. (5) |
1,559,700 | 6.18 | % | — | 1,559,700 | % | ||||||||||||||
| 11726 San Vicente Blvd., Suite 450 Los Angeles, CA 90049 |
||||||||||||||||||||
| Entities affiliated with TVP No. 3 Fund Nominees Pty |
1,520,502 | 6.03 | % |
|
— |
|
1,520,502 | % | ||||||||||||
| Level 4, 19 Harris Street Pyrmont, NSW 2009 Australia |
||||||||||||||||||||
| Directors and Named Executive Officers |
||||||||||||||||||||
| James S. Cable, Ph.D. (7) |
1,143,786 | 4.34 | % | — | 1,143,786 | % | ||||||||||||||
| Jay C. Biskupski (8) |
221,389 | * | — | 221,389 | * | |||||||||||||||
| David R. Shepard (9) |
149,181 | * | — | 149,181 | * | |||||||||||||||
| John H. Allen (10) |
49,633 | * | — | 49,633 | * | |||||||||||||||
| Jeffrey K. Belk (11) |
62,663 | * | — | 62,663 | * | |||||||||||||||
| Gary A. Monetti (12) |
55,984 | * | — | 55,984 | * | |||||||||||||||
| Paul N. D’Addario (13) |
1,559,700 | 6.18 | % | — | 1,559,700 | % | ||||||||||||||
| Robert D. Pavey (14) |
3,551,013 | 14.07 | % | — | 3,551,013 | % | ||||||||||||||
| Elton B. Sherwin (15) |
2,603,781 | 10.32 | % | — | 2,603,781 | % | ||||||||||||||
| Carl P. Schlachte (16) |
19,527 | * | — | 19,527 | * | |||||||||||||||
| Anthony S. Thornley (17) |
19,073 | * | — | 19,073 | * | |||||||||||||||
| All current directors and executive officers as a group (14 persons) (7)(18) |
10,239,604 | 37.13 | % | 104,848 | 10,134,756 | % | ||||||||||||||
| Selling Stockholders |
||||||||||||||||||||
| Jaroslaw Adamski (19) |
13,810 | * | 136 | 13,674 | * | |||||||||||||||
| Mark L. Burgener (20) |
211,765 | * | 19,523 | 192,242 | * | |||||||||||||||
| Dylan J. Kelly (21) |
141,586 | * | 626 | 140,960 | * | |||||||||||||||
| Eugene F. Lyons (22) |
132,691 | * | 10,463 | 122,228 | * | |||||||||||||||
| Mark A. Miscione (23) |
215,211 | * | 18,256 | 196,955 | * | |||||||||||||||
| Dan W. Nobbe (24) |
201,128 | * | 5,994 | 195,134 | * | |||||||||||||||
| Rodd E. Novak (25) |
219,360 | * | 3,405 | 215,955 | * | |||||||||||||||
| Ron E. Reedy, Ph.D. (26) |
439,173 | 1.71 | 100,817 | 338,356 | — | % | ||||||||||||||
103
Table of Contents
| * | Less than 1% of the outstanding shares of common stock. |
| (1) | Consists of 3,551,013 shares held by Morgenthaler Partners VI, L.P. as of March 31, 2012. The general partner of Morgenthaler Partners VI, L.P. is Morgenthaler Management Partners VI, L.L.C. The managing members of Morgenthaler Management Partners VI, L.L.C. are Robert C. Bellas, Jr., Gary J. Morgenthaler, Robert D. Pavey, John D. Lutsi, G. Gary Shaffer, Gary R. Little, Peter G. Taft, Theodore A. Laufik and Paul R. Levine. The managing members have shared voting and dispositive power over the shares held by Morgenthaler Partners VI, L.P. Each of the managing members disclaims beneficial ownership of the shares held by Morgenthaler Partners VI, L.P., except to the extent of their pecuniary interest therein. |
| (2) | Consists of 164,486 shares held by Advanced Equities Peregrine Investments I, LLC, 611,898 shares held by Advanced Equities Peregrine Investments II, LLC, 224,377 shares held by Advanced Equities Peregrine Investments III, LLC, 1,245,628 shares held by Advanced Equities Peregrine Investments IV, LLC, 104,350 shares held by AEI 2007 Venture Investments I, LLC, 262,255 shares held by AEI 2007 Venture Investments II, LLC, and 18,836 shares held by Advanced Equities Financial Corp. Also represents 2,358 warrants issued to Advanced Equities, Inc. and 122,207 warrants issued to Advanced Equities Financial Corp. The managing members of each of Advanced Equities Peregrine Investments I, LLC, Advanced Equities Peregrine Investments II, LLC, Advanced Equities Peregrine Investments III, LLC, Advanced Equities Peregrine Investments IV, LLC, AEI 2007 Venture Investments I, LLC, AEI 2007 Venture Investments II, LLC (together, the Advanced Equities Entities) are wholly-owned subsidiaries of Advanced Equities Financial Corp. Advanced Equities, Inc. is a wholly-owned subsidiary of Advanced Equities Financial Corp. Advanced Equities Financial Corp., Advanced Equities, Inc. and each of the managing members of the Advanced Equities Entities disclaims beneficial ownership of the shares held by the Advanced Equities Entities, except to the extent of their pecuniary interests therein. Keith Daubenspeck and Dwight Badger both possess shared voting and dispositive power over the shares held by Advanced Equities Financial Corp., Advanced Equities, Inc. and the Advanced Equities Entities. |
| (3) | Consists of 525,674 shares held by the U.S. Small Business Administration and 2,151,562 shares held by the U.S. Small Business Administration as receiver for WAV, L.P. Pursuant to an Order of the U.S. District Court for the Southern District of New York dated May 10, 2005 (“Receivership Order”) in the civil action captioned United States of America v. WAV, L.P., Case No. 1:05-CV-04196-CM, the U.S. Small Business Administration (“SBA”) was appointed Receiver (the “Receiver”) for WAV, L.P. (“WAV”, f/k/a Wasserstein Adelson Ventures, L.P.). The Receivership Order grants to the Receiver “all power, authorities, rights and privileges heretofore possessed by the officers, directors, managers and general limited partners of WAV under applicable state and federal law, by the Limited Partnership Agreement, and the By-Laws of said limited partnership.” |
| (4) | Ridgewood Peregrine, LLC is managed by Ridgewood Venture Management Corporation which is owned by Robert E. Swanson. Elton B. Sherwin is Senior Managing Director of Ridgewood Capital Management, LLC, an affiliate of Ridgewood Venture Management Corporation. Messrs. Swanson and Sherwin disclaim beneficial ownership of the shares held by the Ridgewood Peregrine, LLC, except to the extent of their pecuniary interests therein. |
| (5) | Consists of 1,200,327 shares held by Palisades Ventures, L.P., 349,978 shares held by Palisades Qualified Investors, L.P. and 9,395 shares held by Palisades Non-Qualified Investors, L.P. The general partner of Palisades Ventures L.P., Palisades Qualified Investors, L.P., and Palisades Non-Qualified Investors, L.P., or together, the Palisades Entities, is Palisades Ventures Management, LLC. The managing member of Palisades Ventures Management, LLC is Paul N. D’Addario. The managing member has voting and dispositive power over the shares held by the Palisades Entities. The managing member disclaims beneficial ownership of the shares held by the Palisades Entities, except to the extent of his pecuniary interest therein. |
| (6) | Consists of 1,245,548 shares held by TVP No 3 Fund Nominees Pty Limited and 274,954 shares held in Peregrine Co-Investment Trust. The general partner of TVP No 3 Fund Nominees Pty Limited and Peregrine Co-Investment Trust, or together, the TVP Entities is Technology Venture Partners Pty Ltd. The managing members of Technology Venture Partners Pty Ltd are Allan A. Aaron and John Murray. The managing members have shared voting and dispositive power over the shares held by the TVP Entities. Each of the managing members disclaims beneficial ownership of the shares held by the TVP Entities, except to the extent of their pecuniary interest therein. |
104
Table of Contents
| (7) | Consists of 10,366 shares held by UBS Financial Services as IRA custodian for James S. Cable, and 1,133,420 shares issuable upon exercise of options exercisable within 60 days of June 30, 2012. 79,878 of these shares are subject to a right of repurchase by the company in the event Dr. Cable’s service terminates prior to vesting of these shares. Does not include 4,442 shares held by family members of James S. Cable, Ph.D. On July 20, 2012, Dr. Cable exercised an option for 93,460 shares, which would have expired on November 21, 2012 and an option for 27,247 shares, which would have expired on January 30, 2013. In order to satisfy taxes as a result of Dr. Cable’s exercise of these options, Dr. Cable sold 47,000 shares issued upon exercise of these options in a private transaction. |
| (8) | Represents 221,389 shares issuable upon exercise of options exercisable within 60 days of June 30, 2012. 24,834 of these shares are subject to a right of repurchase by the company in the event Mr. Biskupski’s service terminates prior to vesting of these shares. |
| (9) | Represents 149,862 shares issuable upon exercise of options exercisable within 60 days of June 30, 2012. 58,642 of these shares are subject to a right of repurchase by the company in the event Mr. Shepard’s service terminates prior to vesting of these shares. |
| (10) | Consists of 33,831 shares held by John H. Allen, and 16,524 shares issuable upon exercise of options exercisable within 60 days of June 30, 2012. 2,996 of these shares are subject to a right of repurchase by the company in the event Mr. Allen’s service terminates prior to vesting of these shares. |
| (11) | Consists of 20,435 shares held by Jeffrey K. Belk, 10,217 shares held by the Jeffrey K. Belk and Kim Z. Belk Trust Dated July 22, 1998 and 32,733 shares issuable to Mr. Belk upon exercise of options exercisable within 60 days of June 30, 2012. 2,996 of these shares are subject to a right of repurchase by the company in the event Mr. Belk’s service terminates prior to vesting of these shares. |
| (12) | Consists of 25,544 shares held by Gary A. Monetti, and 31,163 shares issuable upon exercise of options exercisable within 60 days of June 30, 2012. 2,996 of these shares are subject to a right of repurchase by us in the event Mr. Monetti’s service terminates prior to vesting of these shares. |
| (13) | Represents 1,559,700 shares held by the Palisades Entities. |
| (14) | Represents 3,551,013 shares held by Morgenthaler Partners VI, L.P. |
| (15) | Represents 2,603,781 shares held by Ridgewood Peregrine, LLC. |
| (16) | Represents 19,981 shares issuable upon exercise of options exercisable within 60 days of June 30, 2012. |
| (17) | Represents 19,527 shares issuable upon exercise of options exercisable within 60 days of June 30, 2012. |
| (18) | Includes 2,349,123 shares issuable upon exercise of options exercisable within 60 days of June 30, 2012, including 376,547 shares issuable to Ronald E. Reedy, Ph.D., 10,217 shares held by Ron E. Reedy, Ph.D., 52,409 shares held by Ron and Robin Ready Living Trust, 219,360 shares issuable to Rodd E. Novak, 128,617 shares issuable to Dylan J. Kelly, and 12,969 shares held by Dylan J. Kelly. |
| (19) | Represents 2,838 shares held by Jaroslaw Adamski and 10,972 shares issuable to Mr. Adamski upon exercise of options. Mr. Adamski is one of our employees. |
| (20) | Represents 43,378 shares held by Mark and Sandra Burgener Living Trust and 168,387 shares issuable to Mark L. Burgener upon exercise of options. Mr. Burgener is one of our employees. |
| (21) | Represents 12,969 shares held by Dylan J. Kelly and 128,617 shares issuable to Mr. Kelly upon exercise of options. Mr. Kelly is our Vice President and General Manager, Mobile Wireless Solutions Business Unit. |
| (22) | Represents 987 shares held by Eugene Lyons and 131,704 shares issuable to Mr. Lyons upon exercise of options. Mr. Lyons is one of our employees. |
| (23) | Represents 6,811 shares held by Anthony Miscione and 208,400 shares issuable to Mr. Miscione upon exercise of options. Mr. Miscione is one of our employees. |
| (24) | Represents 201,128 shares issuable to Dan W. Nobbe upon exercise of options. Mr. Nobbe is one of our employees. |
| (25) | Represents 219,360 shares issuable to Rodd E. Novak upon exercise of options. Mr. Novak is our Chief Marketing Officer. |
| (26) | Represents 10,217 shares held by Ron E. Reedy, Ph.D., 52,409 shares held by Ron and Robin Ready Living Trust, and 376,547 shares issuable to Dr. Reedy upon exercise of options. Dr. Reedy is our Chief Technology Officer. |
105
Table of Contents
General
The following is a summary of our capital stock and certain provisions of our amended and restated certificate of incorporation and amended and restated bylaws, as they will be in effect upon the closing of this offering. This summary does not purport to be complete and is qualified in its entirety by the provisions of our amended and restated certificate of incorporation and amended and restated bylaws, copies of which have been filed as exhibits to the registration statement of which this prospectus is a part.
Following the closing of this offering, our authorized capital stock will consist of 100,000,000 shares of common stock, par value $0.001 per share, and 5,000,000 shares of preferred stock, par value $0.001 per share.
Common Stock
As of June 30, 2012, there were 25,229,301 shares of common stock outstanding, as adjusted to reflect:
| • | 2,845,204 shares of common stock outstanding as of that date; |
| • | the conversion of 5,762,851 shares of Series A1 convertible preferred stock outstanding as of that date into 5,762,851 shares of common stock upon the completion of this offering; |
| • | the conversion of 1,628,936 shares of Series B1 convertible preferred stock outstanding as of that date into 1,628,936 shares of common stock upon the completion of this offering; |
| • | the conversion of 6,107,910 shares of Series C1 convertible preferred stock outstanding as of that date into 6,107,910 shares of common stock upon the completion of this offering; and |
| • | the conversion of 8,884,400 shares of Series D1 convertible preferred stock outstanding as of that date into 8,884,400 shares of common stock upon the completion of this offering. |
There will be shares of common stock outstanding, assuming no exercise of the underwriters’ over-allotment option and assuming no exercise after June 30, 2012 of outstanding options or warrants, after giving effect to the sale of the shares of common stock to the public offered in this prospectus.
The holders of common stock are entitled to one vote per share on all matters to be voted upon by the stockholders. The holders of common stock are entitled to receive ratably such dividends, if any, as may be declared from time to time by the board of directors out of funds legally available, subject to preferences that may be applicable to preferred stock, if any, then outstanding. See section titled “Dividend Policy.” In the event of a liquidation, dissolution, or winding up of our company, the holders of common stock are entitled to share ratably in all assets remaining after payment of liabilities, subject to prior distribution rights of preferred stock, if any, then outstanding. The common stock has no preemptive or conversion rights or other subscription rights. There are no redemption or sinking fund provisions applicable to the common stock. All outstanding shares of common stock are fully paid and non-assessable, and the shares of common stock to be issued upon completion of this offering will be fully paid and non-assessable.
Preferred Stock
Upon the completion of this offering, outstanding shares of Series A1 convertible preferred stock will be converted into 5,762,851 shares of common stock, outstanding shares of Series B1 convertible preferred stock will be converted into 1,628,936 shares of common stock, outstanding shares of Series C1 convertible preferred stock will be converted into 6,107,910 shares of common stock and outstanding shares of Series D1 convertible preferred stock will be converted into 8,884,400 shares of common stock.
Our board of directors is authorized to issue preferred stock in one or more series, to establish the number of shares to be included in each such series and to fix the designation, powers, preferences and rights of such shares and any qualifications, limitations or restrictions thereof. The issuance of preferred stock may have the effect of
106
Table of Contents
delaying, deferring or preventing a change of control of our company without further action by the stockholders and may adversely affect the voting and other rights of the holders of common stock. The issuance of preferred stock with voting and conversion rights may adversely affect the voting power of the holders of common stock, including the loss of voting control to others. At present, we have no plans to issue any of the preferred stock.
Warrants
There were 196,090 shares of common stock issuable upon the exercise of warrants outstanding as of June 30, 2012, at a weighted average exercise price of $6.86 per share, assuming conversion of all outstanding convertible preferred stock into common stock and giving effect to the amendment on November 18, 2010 of a variable share warrant to establish the exact number of shares exercisable under such warrant.
Registration Rights
After this offering, holders of 23,070,406 shares of common stock and the holders of warrants to purchase up to 196,090 shares of our common stock will be entitled to rights with respect to the registration of those shares under the Securities Act. Under the terms of the amended and restated investors’ rights agreement between us and the holders of these registrable securities, if we propose to register any of our securities under the Securities Act, either for our own account or for the account of other security holders exercising registration rights, these holders are entitled to notice of registration and are entitled to include their shares of common stock in the registration. Certain of the holders of the registrable securities are also entitled to specified demand registration rights under which they may require us to file a registration statement under the Securities Act at our expense with respect to our shares of common stock, and we are required to use our commercially reasonable efforts to effect this registration. Further, the holders of these registrable securities may require us to file additional registration statements on Form S-3. All of these registration rights are subject to conditions and limitations, among them the right of the underwriters of an offering to limit the number of shares included in the registration and our right not to effect a requested registration within six months following this offering.
Anti-Takeover Effects of Our Amended and Restated Certificate of Incorporation and Bylaws and Delaware Law
Some provisions of Delaware law and our amended and restated certificate of incorporation and amended and restated bylaws could make the following transactions more difficult:
| • | acquisition of our company by means of a tender offer, a proxy contest or otherwise; and |
| • | removal of our incumbent officers and directors. |
These provisions, summarized below, are expected to discourage and prevent coercive takeover practices and inadequate takeover bids. These provisions are designed to encourage persons seeking to acquire control of our company to first negotiate with our board of directors. They are also intended to provide our management with the flexibility to enhance the likelihood of continuity and stability if our board of directors determines that a takeover is not in our best interests or the best interests of our stockholders. These provisions, however, could have the effect of discouraging attempts to acquire us, which could deprive our stockholders of opportunities to sell their shares of common stock at prices higher than prevailing market prices. We believe that the benefits of these provisions, including increased protection of our potential ability to negotiate with the proponent of an unfriendly or unsolicited proposal to acquire or restructure our company, outweigh the disadvantages of discouraging takeover proposals, because negotiation of takeover proposals could result in an improvement of their terms.
Election and Removal of Directors. Our amended and restated certificate of incorporation and our amended and restated bylaws contain provisions that establish specific procedures for appointing and removing members of the board of directors. Under our amended and restated certificate of incorporation and amended and restated
107
Table of Contents
bylaws, our board of directors will be classified into three classes of directors and directors will be elected by a plurality of the votes cast in each election. Only one class will stand for election at each annual meeting, and directors will be elected to serve three-year terms. Under our amended and restated certificate of incorporation and amended and restated bylaws, vacancies and newly created directorships on the board of directors may be filled only by a majority of the directors then serving on the board of directors. Under our amended and restated certificate of incorporation and amended and restated bylaws, directors may be removed by the stockholders only for cause.
Special Stockholder Meetings. Under our amended and restated certificate of incorporation and amended and restated bylaws, only the chairman of the board of directors, our chief executive officer and our board of directors may call special meetings of stockholders.
Requirements for Advance Notification of Stockholder Nominations and Proposals. Our amended and restated bylaws establish advance notice procedures with respect to stockholder proposals and the nomination of candidates for election as directors, other than nominations made by or at the direction of the board of directors or a committee of the board of directors.
Delaware Anti-Takeover Law. We are subject to Section 203 of the Delaware General Corporation Law, which is an anti-takeover law. In general, Section 203 prohibits a publicly-held Delaware corporation from engaging in a business combination with an interested stockholder for a period of three years following the date that the person became an interested stockholder, unless the business combination or the transaction in which the person became an interested stockholder is approved in a prescribed manner. Generally, a business combination includes a merger, asset or stock sale, or another transaction resulting in a financial benefit to the interested stockholder. Generally, an interested stockholder is a person who, together with affiliates and associates, owns, or within three years prior to the date of determination of interested stockholder status did own, 15% or more of the corporation’s voting stock. The existence of this provision may have an anti-takeover effect with respect to transactions that are not approved in advance by our board of directors, including discouraging attempts that might result in a premium over the market price for the shares of common stock held by stockholders.
Elimination of Stockholder Action by Written Consent. Our amended and restated certificate of incorporation and amended and restated bylaws eliminate the right of stockholders to act by written consent without a meeting after this offering.
No Cumulative Voting. Our amended and restated certificate of incorporation and amended and restated bylaws do not provide for cumulative voting in the election of directors. Cumulative voting allows a minority stockholder to vote a portion or all of its shares for one or more candidates for seats on the board of directors. Without cumulative voting, a minority stockholder will not be able to gain as many seats on our board of directors based on the number of shares of our stock the stockholder holds as the stockholder would be able to gain if cumulative voting were permitted. The absence of cumulative voting makes it more difficult for a minority stockholder to gain a seat on our board of directors to influence our board’s decision regarding a takeover.
Undesignated Preferred Stock. The authorization of undesignated preferred stock makes it possible for our board of directors to issue preferred stock with voting or other rights or preferences that could impede the success of any attempt to change control of our company.
Amendment of Charter Provisions. The amendment of certain of the above provisions in our amended and restated certificate of incorporation requires approval by holders of at least two-thirds of our outstanding common stock.
These and other provisions may have the effect of deferring hostile takeovers or delaying changes in control or management.
108
Table of Contents
Transfer Agent and Registrar
The transfer agent and registrar for our common stock will be American Stock Transfer & Trust Company, LLC.
Nasdaq Global Market Listing
We have applied to have our common stock listed on the Nasdaq Global Market under the symbol “PSMI.”
109
Table of Contents
SHARES ELIGIBLE FOR FUTURE SALE
Prior to this offering, there has been no market for our common stock. Future sales of substantial amounts of our common stock in the public market could adversely affect market prices prevailing from time to time. Furthermore, because only a limited number of shares will be available for sale shortly after this offering due to existing contractual and legal restrictions on resale as described below, there may be sales of substantial amounts of our common stock in the public market after the restrictions lapse. This may adversely affect the prevailing market price and our ability to raise equity capital in the future.
Upon completion of this offering, we will have shares of common stock outstanding assuming no exercise of the underwriters’ over-allotment option, the conversion of all outstanding shares of preferred stock and no exercise of outstanding options or warrants after June 30, 2012. Of these shares, the shares ( shares if the underwriters exercise their over-allotment option in full) sold in this offering will be freely transferable without restriction or registration under the Securities Act, except for any shares purchased by one of our existing “affiliates,” as that term is defined in Rule 144 under the Securities Act. The remaining shares of common stock existing are “restricted shares” as defined in Rule 144. Restricted shares may be sold in the public market only if registered or if they qualify for an exemption from registration under Rules 144 or 701 of the Securities Act. As a result of the contractual 180-day lock-up period described below and the provisions of Rules 144 and 701, these shares will be available for sale in the public market as follows:
| • | no restricted shares will be eligible for sale in the public market immediately upon completion of this offering; and |
| • | 25,229,301 shares will be eligible for sale in the public market beginning 180 days from the date of this prospectus (subject, in some cases, to volume limitations), upon the expiration of the 180-day lock-up and/or market standoff agreements entered into prior to our initial public offering and the lapse of our right of repurchase with respect to any unvested shares, if applicable. |
Lock-up Agreements
Our officers and directors and substantially all of the holders of our equity securities have agreed that, without the prior written consent of each of Deutsche Bank Securities Inc. and J.P. Morgan Securities LLC, they will not, directly or indirectly, (1) offer, sell, pledge, contract to sell (including any short sale), grant any option to purchase or otherwise dispose of any shares of our common stock (including, without limitation, shares of our common stock which may be deemed to be beneficially owned by such officers, directors and holders of equity securities in accordance with the rules and regulations of the SEC, shares of our common stock which may be issued upon exercise of a stock option or warrant and any other security convertible into or exchangeable for our common stock), or (2) enter into any short sale (whether or not against the box) or any purchase, sale or grant of any right (including, without limitation, any put or call option) with respect to any security (other than a broad-based market basket or index) that includes, relates to or derives any significant part of its value from our common stock. The foregoing restrictions do not apply to sales of our common stock by the selling stockholders in the offering. Notwithstanding the foregoing, if (1) during the last 17 days of the 180-day restricted period, we release earnings results or material news or a material event relating to our company occurs, or (2) prior to the expiration of the 180-day restricted period, we announce that we will release earnings results during the 16-day period following the last day of the 180-day period, then the restrictions described above shall continue to apply until the expiration of the 18-day period beginning on the date of the release of the earnings results or the occurrence of the material news or material event relating to our company, as the case may be, unless each of Deutsche Bank Securities Inc. and J.P. Morgan Securities LLC waive, in writing, such extension. See “Underwriting.”
110
Table of Contents
Rule 144
In general, a person who has beneficially owned our restricted common shares for at least six months would be entitled to sell their securities provided that (1) such person is not deemed to have been one of our affiliates at the time of, or at any time during the 90 days preceding, a sale, and (2) we are subject to the Securities Exchange Act of 1934 periodic reporting requirements for at least 90 days before the sale. In addition, under Rule 144, any person who is not an affiliate of ours and has held their shares for at least one year, including the holding period of any prior owner other than one of our affiliates, would be entitled to sell an unlimited number of shares immediately upon the closing of this offering without regard to whether current public information about us is available. Persons who have beneficially owned restricted common shares for at least six months but who are our affiliates at the time of, or any time during the 90 days preceding, a sale, would be subject to additional restrictions, by which such person would be entitled to sell within any three-month period only a number of securities that does not exceed the greater of either of the following:
| • | 1% of the number of common shares then outstanding, which will equal approximately shares immediately after this offering assuming no exercise of the underwriters’ option to purchase additional shares, based on the number of common shares outstanding as of June 30, 2012, or |
| • | the average weekly trading volume of our common shares during the four calendar weeks preceding the filing of a notice on Form 144 with respect to the sale; |
provided, in each case, that we are subject to the Securities Exchange Act of 1934 periodic reporting requirements for at least 90 days before the sale. Such sales both by affiliates and by non-affiliates must also comply with the manner of sale, current public information and notice provisions of Rule 144.
Rule 701
Rule 701, as currently in effect, permits resales of shares in reliance upon Rule 144 but without compliance with certain restrictions, including the holding period requirement, of Rule 144. Any employee, officer or director of or consultant to us who purchased shares under a written compensatory plan or contract may be entitled to rely on the resale provisions of Rule 701. Rule 701 permits affiliates to sell their Rule 701 shares under Rule 144 without complying with the holding period requirements of Rule 144. Rule 701 further provides that non-affiliates may sell such shares in reliance on Rule 144 without having to comply with the holding period, public information, volume limitation or notice provisions of Rule 144. All holders of Rule 701 shares are required to wait until 90 days after the date of this prospectus before selling such shares. All Rule 701 shares are, however, subject to lock-up agreements and will only become eligible for sale upon the expiration of these lock-up agreements.
Registration Rights
Upon completion of this offering, the holders of 23,070,406 shares of our common stock and the holders of warrants to purchase up to 196,090 shares of our common stock have the right to have their shares registered under the Securities Act. See the “Description of Capital Stock – Registration Rights” section of this prospectus. All such shares are covered by lock-up agreements. Following the expiration of the lock-up period, registration of these shares under the Securities Act would result in the shares becoming freely tradable without restriction under the Securities Act immediately upon the effectiveness of the registration, except for shares purchased by our affiliates.
Form S-8 Registration Statements
Prior to the expiration of the lock-up period, we intend to file one or more registration statements on Form S-8 under the Securities Act to register the shares of our common stock that are issuable pursuant to our 2004 Stock Plan, 2012 Equity Incentive Plan, and 2012 Employee Stock Purchase Plan. See the “Management – Stock-based Compensation Plans” section of this prospectus. Subject to the lock-up agreements described above and any applicable vesting restrictions, shares registered under these registration statements will be available for resale in the public market immediately upon the effectiveness of these registration statements, except with respect to Rule 144 volume limitations that apply to our affiliates.
111
Table of Contents
MATERIAL U.S. FEDERAL TAX CONSIDERATIONS FOR NON-U.S. HOLDERS
The following discussion is a summary of the material U.S. federal income tax consequences to non-U.S. holders (as defined below) of the acquisition, ownership and disposition of shares of our common stock issued pursuant to this offering. This discussion is not a complete analysis of all the potential U.S. federal income tax consequences relating thereto, nor does it address any tax consequences arising under any state, local or non-U.S. tax laws, the U.S. federal estate tax or gift tax rules or any other U.S. federal tax laws. This discussion is based on the Internal Revenue Code of 1986, as amended, or the Code, Treasury Regulations promulgated thereunder, judicial decisions, and published rulings and administrative pronouncements of the Internal Revenue Service, or the IRS, all as in effect as of the date of this offering. These authorities may change, possibly retroactively, resulting in U.S. federal income tax consequences different from those discussed below. No ruling has been or will be sought from the IRS with respect to the matters discussed below, and there can be no assurance that the IRS will not take a contrary position regarding the tax consequences of the acquisition, ownership or disposition of shares of our common stock, or that any such contrary position would not be sustained by a court.
This discussion is limited to non-U.S. holders who purchase shares of our common stock issued pursuant to this offering and who hold shares of our common stock as a capital asset within the meaning of Section 1221 of the Code (generally, property held for investment). This discussion does not address all U.S. federal income tax considerations that may be relevant to a particular holder in light of that holder’s particular circumstances. This discussion also does not consider any specific facts or circumstances that may be relevant to holders subject to special rules under the U.S. federal income tax laws, including, without limitation:
| • | banks, thrifts and other financial institutions; |
| • | insurance companies; |
| • | partnerships, S corporations and other pass-through entities; |
| • | real estate investment trusts; |
| • | regulated investment companies; |
| • | “controlled foreign corporations;” |
| • | “passive foreign investment companies;” |
| • | corporations that accumulate earnings to avoid U.S. federal income tax; |
| • | brokers, dealers or traders in securities, commodities or currencies; |
| • | tax-exempt organizations; |
| • | tax-qualified retirement plans; |
| • | certain former citizens or permanent residents of the U.S.; |
| • | U.S. expatriates; |
| • | persons subject to the alternative minimum tax; |
| • | persons that hold or receive shares of our common stock pursuant to the exercise of any employee stock option or otherwise as compensation; |
| • | persons that own, or are deemed to own, more than 5% of our outstanding common stock (except to the extent specifically set forth below); |
| • | persons holding shares of our common stock as part of a hedge, straddle or other risk reduction strategy or as part of a conversion transaction or other integrated investment; or |
| • | persons deemed to sell shares of our common stock under the constructive sale provisions of the Code. |
112
Table of Contents
If a partnership (or other entity taxed as a partnership for U.S. federal income tax purposes) holds shares of our common stock, the tax treatment of a partner in the partnership generally will depend on the status of the partner and upon the activities of the partnership. Accordingly, partnerships that hold shares of our common stock and partners in such partnerships are urged to consult their tax advisors regarding the specific U.S. federal income tax consequences to them of acquiring, owning or disposing of shares of our common stock.
PROSPECTIVE INVESTORS ARE URGED TO CONSULT THEIR TAX ADVISORS REGARDING THE PARTICULAR U.S. FEDERAL INCOME TAX CONSEQUENCES TO THEM OF ACQUIRING, OWNING AND DISPOSING OF SHARES OF OUR COMMON STOCK, AS WELL AS ANY TAX CONSEQUENCES ARISING UNDER ANY STATE, LOCAL OR NON-U.S. TAX LAWS, THE U.S. FEDERAL ESTATE OR GIFT TAX RULES, ANY OTHER U.S. FEDERAL TAX LAWS AND ANY APPLICABLE TAX TREATY.
Definition of Non-U.S. Holder
For purposes of this discussion, a non-U.S. holder is any beneficial owner of shares of our common stock that is not a “U.S. person” or a partnership for U.S. federal income tax purposes. A U.S. person is any of the following:
| • | an individual citizen or resident of the U.S.; |
| • | a corporation (or other entity treated as a corporation for U.S. federal income tax purposes) created or organized under the laws of the U.S., any state thereof or the District of Columbia; |
| • | an estate the income of which is subject to U.S. federal income taxation regardless of its source; or |
| • | a trust (1) if a court within the U.S. is able to exercise primary supervision over the administration of such trust and one or more U.S. persons have the authority to control all substantial decisions of such trust, or (2) that has a valid election in effect to be treated as a U.S. person for U.S. federal income tax purposes. |
Distributions on Our Common Stock
As described above in the section titled “Dividend Policy,” we do not anticipate paying cash dividends on shares of our common stock. If, however, we do make distributions of cash or property on shares of our common stock, such distributions will constitute dividends for U.S. federal income tax purposes to the extent paid from our current or accumulated earnings and profits, as determined under U.S. federal income tax principles. Amounts not treated as dividends for U.S. federal income tax purposes will constitute a return of capital and first be applied against and reduce a non-U.S. holder’s adjusted tax basis in its shares of our common stock, but not below zero. Any excess will be treated as capital gain and will be treated as described below under “– Gain on Sale or Disposition of Shares of Our Common Stock.”
Dividends paid to a non-U.S. holder of shares of our common stock that are not effectively connected with a U.S. trade or business conducted by such non-U.S. holder generally will be subject to U.S. federal withholding tax at a rate of 30% of the gross amount of the dividends, or such lower rate as is specified by an applicable tax treaty. To receive the benefit of a reduced treaty rate, a non-U.S. holder must furnish to us or our paying agent a valid IRS Form W-8BEN (or applicable successor form) certifying such non-U.S. holder’s qualification for the reduced rate. This certification must be provided to us or our paying agent prior to the payment of dividends and must be updated periodically. If the non-U.S. holder holds the stock through a financial institution or other agent acting on the non-U.S. holder’s behalf, the non-U.S. holder will be required to provide appropriate documentation to the agent, who then will be required to provide certification to us or our paying agent, either directly or through other intermediaries. Non-U.S. holders that do not timely provide us or our paying agent with the required certification, but which qualify for a reduced treaty rate, may obtain a refund of any excess amounts withheld by timely filing an appropriate claim for refund with the IRS. Non-U.S. holders should consult their tax advisors regarding possible entitlement to benefits under a tax treaty.
113
Table of Contents
If a non-U.S. holder holds shares of our common stock in connection with the conduct of a trade or business in the U.S., and dividends paid on the shares of our common stock are effectively connected with such non-U.S. holder’s U.S. trade or business (and, if required by an applicable tax treaty, attributable to a permanent establishment maintained by the non-U.S. holder in the U.S.), the non-U.S. holder will be exempt from U.S. federal withholding tax. To claim the exemption, the non-U.S. holder must furnish to us or our paying agent a valid IRS Form W-8ECI (or applicable successor form), certifying that the dividends are effectively connected with the non-U.S. holder’s conduct of a trade or business within the U.S.
Any dividends paid on shares of our common stock that are effectively connected with a non-U.S. holder’s U.S. trade or business (and, if required by an applicable tax treaty, attributable to a permanent establishment maintained by the non-U.S. holder in the U.S.) generally will be subject to U.S. federal income tax on a net income basis in the same manner as if such non-U.S. holder were a U.S. person and, for a non-U.S. holder that is a corporation, also may be subject to a branch profits tax at a rate of 30% (or such lower rate as is specified by an applicable tax treaty). Non-U.S. holders should consult their tax advisors regarding any applicable tax treaties that may provide for different rules.
Gain on Sale or Disposition of Shares of Our Common Stock
Subject to the discussion below regarding backup withholding, a non-U.S. holder generally will not be subject to U.S. federal income tax on any gain realized upon the sale or disposition of shares of our common stock unless:
| • | the gain is effectively connected with the non-U.S. holder’s conduct of a trade or business in the U.S. and, if required by an applicable tax treaty, attributable to a permanent establishment maintained by the non-U.S. holder in the U.S.; |
| • | the non-U.S. holder is a nonresident alien individual present in the U.S. for 183 days or more during the taxable year of the sale or disposition and certain other requirements are met; or |
| • | shares of our common stock constitute a U.S. real property interest by reason of our status as a U.S. real property holding corporation, or a USRPHC, for U.S. federal income tax purposes at any time within the shorter of (1) the five-year period ending on the date of the sale or disposition of shares of our common stock, or (2) the non-U.S. holder’s holding period for shares of our common stock. |
Unless an applicable tax treaty provides otherwise, the gain described in the first bullet point above generally will be subject to U.S. federal income tax on a net income basis in the same manner as if such non-U.S. holder were a U.S. person. A non-U.S. holder that is a corporation also may be subject to a branch profits tax at a rate of 30% (or such lower rate as is specified by an applicable tax treaty). Non-U.S. holders should consult their tax advisors regarding any applicable tax treaties that may provide for different rules.
Gain described in the second bullet point above generally will be subject to U.S. federal income tax at a flat 30% rate (or such lower rate as is specified by an applicable income tax treaty), but may be offset by U.S. source capital losses of the non-U.S. holder (even though the individual is not considered a resident of the U.S.), provided that the non-U.S. holder has timely filed U.S. federal income tax returns with respect to such losses.
With respect to the third bullet point above, we would be a USRPHC if interests in U.S. real property comprised (by fair market value) at least half of our business assets. We believe that we currently are not, and we do not anticipate becoming, a USRPHC. Because the determination of whether we are a USRPHC depends on the fair market value of our U.S. real property interests relative to the fair market value of our other business assets, however, there can be no assurance that we will not become a USRPHC in the future. In the event we do become a USRPHC, as long as shares of our common stock are regularly traded on an established securities market, shares of our common stock will be treated as a U.S. real property interest only with respect to a non-U.S. holder that actually or constructively held more than 5% of shares of our common stock at any time during the shorter of (1) the five-year period ending on the date of the sale or disposition of shares of our common stock, or (2) the non-U.S. holder’s holding period for shares of our common stock.
114
Table of Contents
Information Reporting and Backup Withholding
Generally, we must report annually to the IRS and to each non-U.S. holder the amount of dividends paid to such non-U.S. holder and the amount, if any, of tax withheld with respect to those dividends. This information also may be made available under a specific treaty or agreement with the tax authorities of the country in which the non-U.S. holder resides or is established. Under certain circumstances, the Code imposes backup withholding on certain reportable payments including dividends and stock disposition proceeds. Backup withholding generally will not, however, apply to payments of dividends to a non-U.S. holder of shares of our common stock, and backup withholding and information reporting will not apply to proceeds of a disposition of our common stock, provided that the non-U.S. holder furnishes to us or our paying agent the required certification as to its non-U.S. status, such as by providing a valid IRS Form W-8BEN or W-8ECI, or otherwise establishes an exemption.
Backup withholding is not an additional tax. Any amounts withheld under the backup withholding rules may be allowed as a refund or a credit against a non-U.S. holder’s U.S. federal income tax liability, provided that the required information is timely furnished to the IRS.
New Legislation Relating to Foreign Accounts
Newly enacted legislation may impose withholding taxes on certain types of payments made to “foreign financial institutions” (as specially defined under those rules) and certain other non-U.S. entities. Under this legislation, the failure to comply with additional certification, information reporting and other specified requirements could result in a withholding tax being imposed on payments of dividends and sales proceeds to foreign intermediaries and certain non-U.S. holders. The legislation imposes a 30% withholding tax on dividends on, or gross proceeds from the sale or other disposition of, shares of our common stock paid to a foreign financial institution or to a foreign non-financial entity, unless (1) the foreign financial institution undertakes certain diligence and reporting obligations, or (2) the foreign non-financial entity either certifies it does not have any substantial U.S. owners or furnishes identifying information regarding each substantial U.S. owner. If the payee is a foreign financial institution, it must enter into an agreement with the U.S. Treasury requiring, among other things, that it undertake to identify accounts held by certain U.S. persons or U.S.-owned foreign entities, annually report certain information about such accounts, and withhold 30% on payments to account holders whose actions prevent it from complying with these reporting and other requirements. The legislation would apply to payments made after December 31, 2012. Prospective investors should consult their tax advisors regarding this legislation.
115
Table of Contents
We and the selling stockholders are offering the shares of common stock described in this prospectus through a number of underwriters. Deutsche Bank Securities Inc. and J.P. Morgan Securities LLC are acting as representatives of the underwriters. We and the selling stockholders have entered into an underwriting agreement with the representatives on behalf of the underwriters. Subject to the terms and conditions of the underwriting agreement, we and the selling stockholders have agreed to sell to the underwriters, and each underwriter has severally agreed to purchase, at the public offering price less the underwriting discounts set forth on the cover page of this prospectus, the number of shares of common stock listed next to its name in the following table:
| Name |
Number of Shares | |
| Deutsche Bank Securities Inc. |
||
| J.P. Morgan Securities LLC |
||
| Needham & Company, LLC |
||
| Oppenheimer & Co. Inc. |
||
| Pacific Crest Securities LLC |
||
| RBC Capital Markets, LLC |
||
|
| ||
| Total |
The underwriters are committed to purchase all the common shares offered by us and the selling stockholders if they purchase any shares. The underwriting agreement also provides that if an underwriter defaults, the purchase commitments of non-defaulting underwriters may also be increased or the offering may be terminated.
The underwriters propose to offer the common shares directly to the public at the initial public offering price set forth on the cover page of this prospectus and to certain dealers at that price less a concession not in excess of $ per share. Any such dealers may resell shares to certain other brokers or dealers at a discount of up to $ per share from the initial public offering price. After the initial public offering of the shares, the offering price and other selling terms may be changed by the underwriters. Sales of shares made outside of the U.S. may be made by affiliates of the underwriters. The representatives have advised us that the underwriters do not intend to confirm discretionary sales in excess of 5% of the common shares offered in this offering.
To the extent that the underwriters sell more than shares of common stock, the underwriters have the option to purchase up to an additional shares from us at the initial public offering price less the underwriting discount. The underwriters have 30 days from the date of this prospectus to exercise this over-allotment option. If any shares are purchased with this over-allotment option, the underwriters will purchase shares in approximately the same proportion as shown in the table above. If any additional shares of common stock are purchased, the underwriters will offer the additional shares on the same terms as those on which the shares are being offered.
The underwriting discount is equal to the public offering price per share of common stock less the amount paid by the underwriters to us and the selling stockholders per share of common stock. The underwriting discount is $ per share. The following table shows the per share and total underwriting discounts to be paid to the underwriters assuming both no exercise and full exercise of the underwriters’ option to purchase additional shares.
| Paid by Us | Paid by
Selling Stockholders |
Total | ||||||||||||||||||||||
| No Exercise | Full Exercise | No Exercise | Full Exercise | No Exercise | Full Exercise | |||||||||||||||||||
| Per Share |
$ | $ | $ | $ | $ | $ | ||||||||||||||||||
| Total |
||||||||||||||||||||||||
116
Table of Contents
We estimate that the total expenses to us of this offering, including registration, filing and listing fees, printing fees and legal and accounting expenses, but excluding the underwriting discounts, will be approximately $ .
A prospectus in electronic format may be made available on the websites maintained by one or more underwriters, or selling group members, if any, participating in the offering. The underwriters may agree to allocate a number of shares to underwriters and selling group members for sale to their online brokerage account holders. Internet distributions will be allocated by the representatives to underwriters and selling group members that may make Internet distributions on the same basis as other allocations.
We and our officers, directors and substantially all of the holders of our equity securities have agreed that, subject to exceptions, without the prior written consent of the representatives, for a period of 180 days after the date of this prospectus, we and they will not, directly or indirectly, (1) offer, sell, pledge, contract to sell (including any short sale), grant any option to purchase or otherwise dispose of any shares of our common stock (including, without limitation, shares of our common stock which may be deemed to be beneficially owned by such officers, directors and holders of equity securities in accordance with the rules and regulations of the SEC, shares of our common stock which may be issued upon exercise of a stock option or warrant and any other security convertible into or exchangeable for our common stock), or (2) enter into any short sale (whether or not against the box) or any purchase, sale or grant of any right (including, without limitation, any put or call option) with respect to any security (other than a broad-based market basket or index) that includes, relates to or derives any significant part of its value from our common stock. The foregoing restrictions do not apply to sales of our common stock by the selling stockholders in the offering.
Notwithstanding the foregoing, if (1) during the last 17 days of the 180-day restricted period, we release earnings results or material news or a material event relating to our company occurs, or (2) prior to the expiration of the 180-day restricted period, we announce that we will release earnings results during the 16-day period following the last day of the 180-day period, then the restrictions described above shall continue to apply until the expiration of the 18-day period beginning on the date of the release of the earnings results or the occurrence of the material news or material event relating to our company, as the case may be, unless the representatives waive, in writing, such extension.
We and the selling stockholders have agreed to indemnify the underwriters against certain liabilities, including liabilities under the Securities Act.
We have applied to have our common stock listed on the Nasdaq Global Market under the symbol “PSMI.”
In connection with this offering, the underwriters may engage in stabilizing transactions, which involves making bids for, purchasing and selling shares of common stock in the open market for the purpose of preventing or retarding a decline in the market price of the common stock while this offering is in progress. These stabilizing transactions may include making short sales of the common stock, which involves the sale by the underwriters of a greater number of shares of common stock than they are required to purchase in this offering, and purchasing shares of common stock on the open market to cover positions created by short sales. Short sales may be “covered” shorts, which are short positions in an amount not greater than the underwriters’ over-allotment option referred to above, or may be “naked” shorts, which are short positions in excess of that amount. The underwriters may close out any covered short position either by exercising their over-allotment option, in whole or in part, or by purchasing shares in the open market. In making this determination, the underwriters will consider, among other things, the price of shares available for purchase in the open market compared to the price at which the underwriters may purchase shares through the over-allotment option. A naked short position is more likely to be created if the underwriters are concerned that there may be downward pressure on the price of the common stock in the open market that could adversely affect investors who purchase in this offering. To the extent that the underwriters create a naked short position, they will purchase shares in the open market to cover the position.
The underwriters have advised us that, pursuant to Regulation M of the Securities Act, they may also engage in other activities that stabilize, maintain or otherwise affect the price of the common stock, including the
117
Table of Contents
imposition of penalty bids. This means that if the representatives of the underwriters purchase common stock in the open market in stabilizing transactions or to cover short sales, the representatives can require the underwriters that sold those shares as part of this offering to repay the underwriting discount received by them.
These activities may have the effect of raising or maintaining the market price of the common stock or preventing or retarding a decline in the market price of the common stock, and, as a result, the price of the common stock may be higher than the price that otherwise might exist in the open market. If the underwriters commence these activities, they may discontinue them at any time. The underwriters may carry out these transactions on Nasdaq, in the over-the-counter market, or otherwise.
Prior to this offering, there has been no public market for our common stock. The initial public offering price will be determined by negotiations between us and the representatives of the underwriters. In determining the initial public offering price, we and the representatives of the underwriters expect to consider a number of factors including:
| • | the information set forth in this prospectus and otherwise available to the representatives; |
| • | our prospects and the history and prospects for the industry in which we compete; |
| • | an assessment of our management; |
| • | our prospects for future earnings; |
| • | the general condition of the securities markets at the time of this offering; |
| • | the recent market prices of, and demand for, publicly traded common stock of generally comparable companies; and |
| • | other factors deemed relevant by the underwriters and us. |
Neither we nor the underwriters can assure investors that an active trading market will develop for our common shares, or that the shares will trade in the public market at or above the initial public offering price.
Other than in the U.S., no action has been taken by us or the underwriters or the selling stockholders that would permit a public offering of the securities offered by this prospectus in any jurisdiction where action for that purpose is required. The securities offered by this prospectus may not be offered or sold, directly or indirectly, nor may this prospectus or any other offering material or advertisements in connection with the offer and sale of any such securities be distributed or published in any jurisdiction, except under circumstances that will result in compliance with the applicable rules and regulations of that jurisdiction. Persons into whose possession this prospectus comes are advised to inform themselves about and to observe any restrictions relating to the offering and the distribution of this prospectus. This prospectus does not constitute an offer to sell or a solicitation of an offer to buy any securities offered by this prospectus in any jurisdiction in which such an offer or a solicitation is unlawful.
This document is only being distributed to and is only directed at (i) persons who are outside the United Kingdom or (ii) to investment professionals falling within Article 19(5) of the Financial Services and Markets Act 2000 (Financial Promotion) Order 2005, or the Order, or (iii) high net worth entities, and other persons to whom it may lawfully be communicated, falling with Article 49(2)(a) to (d) of the Order (all such persons together being referred to as “relevant persons”). The securities are only available to, and any invitation, offer, or agreement to subscribe, purchase or otherwise acquire such securities will be engaged in only with, relevant persons. Any person who is not a relevant person should not act or rely on this document or any of its contents.
In relation to each Member State of the European Economic Area which has implemented the Prospectus Directive, or each a Relevant Member State, from and including the date on which the European Union Prospectus Directive, or the EU Prospectus Directive, is implemented in that Relevant Member State (the “Relevant Implementation Date”) an offer of securities described in this prospectus may not be made to the public in that Relevant Member State prior to the publication of a prospectus in relation to the shares which has
118
Table of Contents
been approved by the competent authority in that Relevant Member State or, where appropriate, approved in another Relevant Member State and notified to the competent authority in that Relevant Member State, all in accordance with the EU Prospectus Directive, except that it may, with effect from and including the Relevant Implementation Date, make an offer of shares to the public in that Relevant Member State at any time:
| • | to legal entities which are authorized or regulated to operate in the financial markets or, if not so authorized or regulated, whose corporate purpose is solely to invest in securities; |
| • | to any legal entity which has two or more of (1) an average of at least 250 employees during the last financial year; (2) a total balance sheet of more than €43,000,000; and (3) an annual net turnover of more than €50,000,000, as shown in its last annual or consolidated accounts; |
| • | to fewer than 100 natural or legal persons (other than qualified investors as defined in the EU Prospectus Directive) subject to obtaining the prior consent of the representatives for any such offer; or |
| • | in any other circumstances which do not require the publication by the Issuer of a prospectus pursuant to Article 3 of the Prospectus Directive. |
For the purposes of this provision, the expression an “offer of securities to the public” in relation to any securities in any Relevant Member State means the communication in any form and by any means of sufficient information on the terms of the offer and the securities to be offered so as to enable an investor to decide to purchase or subscribe for the securities, as the same may be varied in that Member State by any measure implementing the EU Prospectus Directive in that Member State and the expression EU Prospectus Directive means Directive 2003/71/EC and includes any relevant implementing measure in each Relevant Member State.
Certain of the underwriters and their affiliates may provide to us and our affiliates from time to time in the future certain commercial banking, financial advisory, investment banking, and other services for us and such affiliates in the ordinary course of their business, for which they may receive customary fees and commissions. In addition, from time to time, certain of the underwriters and their affiliates may effect transactions for their own account or the account of customers, and hold on behalf of themselves or their customers, long or short positions in our debt or equity securities or loans, and may do so in the future. As of the date of this prospectus, an investment fund affiliated with Deutsche Bank Securities Inc. beneficially owned less than one percent of the outstanding shares of our common stock. In addition, an employee and certain investment funds associated with Needham & Company, LLC beneficially owned less than one percent of the outstanding shares of our common stock.
119
Table of Contents
We obtained the industry, market, and competitive position data throughout this prospectus from our own internal estimates and research, as well as from industry and general publications, in addition to research, surveys, and studies conducted by third parties. Industry publications, studies, and surveys generally state that they have been obtained from sources believed to be reliable, although they do not guarantee the accuracy or completeness of such information. While we believe that each of these studies and publications is reliable, we have not independently verified market and industry data from third-party sources. While we believe our internal company research is reliable and the market definitions are appropriate, neither such research nor these definitions have been verified by any independent source.
The validity of the common stock being offered will be passed upon for the company by Gunderson Dettmer Stough Villeneuve Franklin & Hachigian, LLP, San Diego, California. Certain legal matters in connection with the offering will be passed upon for the underwriters by Cooley LLP, San Diego, California. As of the date of this prospectus, certain partners and employees of Gunderson Dettmer Stough Villeneuve Franklin & Hachigian, LLP beneficially owned less than one percent of the outstanding shares of our common stock. In addition, as of the date of this prospectus, certain investment funds affiliated with Cooley LLP beneficially owned less than one percent of the outstanding shares of our common stock.
Ernst & Young LLP, independent registered public accounting firm, has audited our consolidated financial statements at December 25, 2010 and December 31, 2011, and for each of the two years in the period ended December 31, 2011, as set forth in their report. We’ve included our consolidated financial statements in the prospectus and elsewhere in the registration statement in reliance on Ernst & Young LLP’s report, given on their authority as experts in accounting and auditing.
WHERE YOU CAN FIND MORE INFORMATION
We have filed with the SEC a registration statement on Form S-1 under the Securities Act with respect to the shares of common stock we are offering. This prospectus contains all information about us and our common stock that may be material to an investor in this offering. The registration statement includes exhibits to which you should refer for additional information about us.
You may inspect a copy of the registration statement and the exhibits and schedules to the registration statement without charge at the offices of the SEC at 100 F Street, N.E., Washington, D.C. 20549. You may obtain copies of all or any part of the registration statement from the Public Reference Section of the SEC, 100 F Street, N.E., Washington, D.C. 20549 upon the payment of the prescribed fees. You may obtain information on the operation of the Public Reference Room by calling the SEC at 1-800-SEC-0330. The SEC maintains a website at www.sec.gov that contains reports, proxy and information statements and other information regarding registrants like us that file electronically with the SEC. You can also inspect our registration statement on this Web site.
Upon the completion of this offering, we will be subject to the information reporting requirements of the Securities Act and we will file reports, proxy statements and other information with the SEC. These reports, proxy statements and other information will be available for inspection and copying at the public reference room and website of the SEC referred to above. We also maintain a website at www.psemi.com, at which you may access these materials free of charge as soon as reasonably practicable after they are electronically filed with, or furnished to, the SEC. Information contained on our website is not incorporated by reference into this prospectus, and you should not consider information contained on our website to be part of this prospectus or in deciding whether to purchase shares of our common stock.
120
Table of Contents
INDEX TO CONSOLIDATED FINANCIAL STATEMENTS
| F-2 | ||||
| F-3 | ||||
| F-4 | ||||
| F-5 | ||||
| Consolidated Statements of Convertible Preferred Stock and Stockholders’ Deficit |
F-6 | |||
| F-7 | ||||
| F-8 | ||||
F-1
Table of Contents
REPORT OF INDEPENDENT REGISTERED PUBLIC ACCOUNTING FIRM
The Board of Directors and Stockholders
Peregrine Semiconductor Corporation
We have audited the accompanying consolidated balance sheets of Peregrine Semiconductor Corporation as of December 25, 2010 and December 31, 2011, and the related consolidated statements of operations, comprehensive income (loss), convertible preferred stock and stockholders’ deficit and cash flows for each of the two years in the period ended December 31, 2011. These financial statements are the responsibility of the Company’s management. Our responsibility is to express an opinion on these financial statements based on our audits.
We conducted our audits in accordance with the standards of the Public Company Accounting Oversight Board (United States). Those standards require that we plan and perform the audit to obtain reasonable assurance about whether the financial statements are free of material misstatement. We were not engaged to perform an audit of the Company’s internal control over financial reporting. Our audits included consideration of internal control over financial reporting as a basis for designing audit procedures that are appropriate in the circumstances, but not for the purpose of expressing an opinion on the effectiveness of the Company’s internal control over financial reporting. Accordingly, we express no such opinion. An audit also includes examining, on a test basis, evidence supporting the amounts and disclosures in the financial statements, assessing the accounting principles used and significant estimates made by management, and evaluating the overall financial statement presentation. We believe that our audits provide a reasonable basis for our opinion.
In our opinion, the financial statements referred to above present fairly, in all material respects, the consolidated financial position of Peregrine Semiconductor Corporation at December 25, 2010 and December 31, 2011, and the consolidated results of its operations and its cash flows for each of the two years in the period ended December 31, 2011, in conformity with U.S. generally accepted accounting principles.
/s/ ERNST & YOUNG LLP
San Diego, California
March 30, 2012,
except for the retrospective adoption of amendments to the accounting standards relating to the reporting and display of comprehensive income (loss) and Note 11, as to which the date is July 22, 2012
F-2
Table of Contents
Peregrine Semiconductor Corporation
CONSOLIDATED BALANCE SHEETS
(in thousands, except par values)
| December 25, 2010 |
December 31, 2011 |
June 30, 2012 |
Pro Forma June 30, 2012 |
|||||||||||||
| (unaudited) | ||||||||||||||||
| Assets |
||||||||||||||||
| Current assets: |
||||||||||||||||
| Cash and cash equivalents |
$ | 15,226 | $ | 12,119 | $ | 42,918 | ||||||||||
| Accounts receivable, net |
11,755 | 13,082 | 18,117 | |||||||||||||
| Inventories |
22,360 | 29,822 | 42,479 | |||||||||||||
| Prepaids and other current assets |
1,289 | 2,644 | 7,962 | |||||||||||||
|
|
|
|
|
|
|
|||||||||||
| Total current assets |
50,630 | 57,667 | 111,476 | |||||||||||||
| Property and equipment, net |
9,726 | 10,272 | 14,451 | |||||||||||||
| Other assets |
1,993 | 2,919 | 5,577 | |||||||||||||
|
|
|
|
|
|
|
|||||||||||
| Total assets |
$ | 62,349 | $ | 70,858 | $ | 131,504 | ||||||||||
|
|
|
|
|
|
|
|||||||||||
| Liabilities and stockholders’ equity (deficit) |
||||||||||||||||
| Current liabilities: |
||||||||||||||||
| Accounts payable |
$ | 4,199 | $ | 9,390 | $ | 25,636 | ||||||||||
| Accrued liabilities |
4,742 | 11,477 | 9,888 | |||||||||||||
| Accrued compensation |
3,544 | 3,458 | 3,973 | |||||||||||||
| Customer deposits |
— | — | 39,058 | |||||||||||||
| Deferred net revenue |
5,033 | 5,298 | 5,868 | |||||||||||||
| Line of credit |
3,249 | 7,749 | 10,749 | |||||||||||||
| Current portion of notes payable |
815 | 861 | 882 | |||||||||||||
| Current portion of obligations under capital leases |
658 | 520 | 322 | |||||||||||||
|
|
|
|
|
|
|
|||||||||||
| Total current liabilities |
22,240 | 38,753 | 96,376 | |||||||||||||
| Obligations under capital leases, less current portion |
529 | 189 | 114 | |||||||||||||
| Notes payable, less current portion |
1,623 | 757 | 310 | |||||||||||||
| Other long-term liabilities |
1,699 | 1,329 | 5,391 | $ | 4,583 | |||||||||||
| Commitments and contingencies |
||||||||||||||||
| Convertible preferred stock, $0.001 par value: |
||||||||||||||||
| Series A1 convertible preferred stock, 5,968 shares authorized, 5,763 shares issued and outstanding at December 25, 2010, December 31, 2011, and June 30, 2012 (unaudited), liquidation preference of $29,324 at December 31, 2011 and June 30, 2012 (unaudited); no shares issued and outstanding pro forma (unaudited) |
31,837 | 31,837 | 31,837 | — | ||||||||||||
| Series B1 convertible preferred stock, 1,642 shares authorized, 1,629 shares issued and outstanding at December 25, 2010, December 31, 2011, and June 30, 2012 (unaudited), liquidation preference of $11,000 at December 31, 2011 and June 30, 2012 (unaudited); no shares issued and outstanding pro forma (unaudited) |
11,298 | 11,298 | 11,298 | — | ||||||||||||
| Series C1 convertible preferred stock, 6,114 shares authorized, 6,108 shares issued and outstanding at December 25, 2010, December 31, 2011, and June 30, 2012 (unaudited), liquidation preference of $35,134 at December 31, 2011 and June 30, 2012 (unaudited); no shares issued and outstanding pro forma (unaudited) |
35,469 | 35,469 | 35,469 | — | ||||||||||||
| Series D1 convertible preferred stock, 9,148 shares authorized, 8,865, 8,865, and 8,884 shares issued and outstanding at December 25, 2010, December 31, 2011, and June 30, 2012 (unaudited), respectively; liquidation preference of $96,732 and $96,937 at December 31, 2011 and June 30, 2012 (unaudited), respectively; no shares issued and outstanding pro forma (unaudited) |
93,826 | 93,826 | 94,303 | — | ||||||||||||
| Stockholders’ equity (deficit): |
||||||||||||||||
| Common stock, $0.001 par value, 33,058, 33,058, and 35,102 shares authorized at December 25, 2010, December 31, 2011, and June 30, 2012 (unaudited), respectively; 2,674, 2,776, and 2,845 shares issued and outstanding at December 25, 2010, December 31, 2011, and June 30, 2012 (unaudited), respectively; 35,102 shares authorized and 25,229 shares issued and outstanding pro forma (unaudited) |
3 | 3 | 3 | 25 | ||||||||||||
| Additional paid-in capital |
82,554 | 85,828 | 87,900 | 261,593 | ||||||||||||
| Accumulated deficit |
(218,525 | ) | (228,207 | ) | (231,275 | ) | (231,275 | ) | ||||||||
| Accumulated other comprehensive loss |
(204 | ) | (224 | ) | (222 | ) | (222 | ) | ||||||||
|
|
|
|
|
|
|
|
|
|||||||||
| Total stockholders’ equity (deficit) |
(136,172 | ) | (142,600 | ) | (143,594 | ) | $ | 30,121 | ||||||||
|
|
|
|
|
|
|
|
|
|||||||||
| Total liabilities and stockholders’ equity (deficit) |
$ | 62,349 | $ | 70,858 | $ | 131,504 | ||||||||||
|
|
|
|
|
|
|
|||||||||||
See accompanying notes.
F-3
Table of Contents
Peregrine Semiconductor Corporation
CONSOLIDATED STATEMENTS OF OPERATIONS
(in thousands, except per share data)
| Year Ended | Six Months Ended | |||||||||||||||
| December 25, 2010 |
December 31, 2011 |
June
25, 2011 |
June
30, 2012 |
|||||||||||||
| (unaudited) | ||||||||||||||||
| Net revenue |
$ | 91,071 | $ | 107,771 | $ | 45,729 | $ | 80,334 | ||||||||
| Cost of net revenue |
49,520 | 70,955 | 26,720 | 52,858 | ||||||||||||
|
|
|
|
|
|
|
|
|
|||||||||
| Gross profit |
41,551 | 36,816 | 19,009 | 27,476 | ||||||||||||
| Operating expense: |
||||||||||||||||
| Research and development |
18,040 | 22,730 | 10,248 | 14,163 | ||||||||||||
| Selling, general and administrative |
18,889 | 23,252 | 10,812 | 15,193 | ||||||||||||
|
|
|
|
|
|
|
|
|
|||||||||
| Total operating expense |
36,929 | 45,982 | 21,060 | 29,356 | ||||||||||||
|
|
|
|
|
|
|
|
|
|||||||||
| Income (loss) from operations |
4,622 | (9,166 | ) | (2,051 | ) | (1,880 | ) | |||||||||
| Interest income |
13 | 7 | 5 | 42 | ||||||||||||
| Interest expense |
(610 | ) | (318 | ) | (185 | ) | (1,076 | ) | ||||||||
| Other income (expense), net |
(118 | ) | (9 | ) | 61 | (80 | ) | |||||||||
|
|
|
|
|
|
|
|
|
|||||||||
| Income (loss) before income taxes |
3,907 | (9,486 | ) | (2,170 | ) | (2,994 | ) | |||||||||
| Provision for income taxes |
147 | 196 | 125 | 74 | ||||||||||||
|
|
|
|
|
|
|
|
|
|||||||||
| Net income (loss) |
3,760 | (9,682 | ) | (2,295 | ) | (3,068 | ) | |||||||||
| Net income allocable to preferred stockholders |
(3,760 | ) | — | — | — | |||||||||||
|
|
|
|
|
|
|
|
|
|||||||||
| Net income (loss) attributable to common stockholders |
$ | — | $ | (9,682 | ) | $ | (2,295 | ) | $ | (3,068 | ) | |||||
|
|
|
|
|
|
|
|
|
|||||||||
| Basic and diluted net income (loss) per share attributable to common stockholders |
$ | — | $ | (3.57 | ) | $ | (0.85 | ) | $ | (1.10 | ) | |||||
|
|
|
|
|
|
|
|
|
|||||||||
| Shares used to compute basic and diluted net income (loss) per share attributable to common stockholders |
2,504 | 2,715 | 2,693 | 2,790 | ||||||||||||
|
|
|
|
|
|
|
|
|
|||||||||
| Pro forma net loss per share attributable to common stockholders (unaudited): |
||||||||||||||||
| Basic |
$ | (0.39 | ) | $ | (0.12 | ) | ||||||||||
|
|
|
|
|
|||||||||||||
| Diluted |
$ | (0.39 | ) | $ | (0.12 | ) | ||||||||||
|
|
|
|
|
|||||||||||||
| Shares used to compute pro forma net loss per share attributable to common stockholders (unaudited): |
||||||||||||||||
| Basic |
25,080 | 25,157 | ||||||||||||||
|
|
|
|
|
|||||||||||||
| Diluted |
25,080 | 25,157 | ||||||||||||||
|
|
|
|
|
|||||||||||||
See accompanying notes.
F-4
Table of Contents
Peregrine Semiconductor Corporation
CONSOLIDATED STATEMENTS OF COMPREHENSIVE INCOME (LOSS)
(in thousands)
| Year Ended | Six Months Ended | |||||||||||||||
| December 25, 2010 |
December 31, 2011 |
June 25, 2011 |
June 30, 2012 |
|||||||||||||
| (unaudited) | ||||||||||||||||
| Net income (loss) |
$ | 3,760 | $ | (9,682 | ) | $ | (2,295 | ) | $ | (3,068 | ) | |||||
| Foreign currency translation adjustments |
(38 | ) | (20 | ) | 23 | 2 | ||||||||||
|
|
|
|
|
|
|
|
|
|||||||||
| Comprehensive income (loss) |
3,722 | (9,702 | ) | (2,272 | ) | (3,066 | ) | |||||||||
| Comprehensive income allocable to preferred stockholders |
(3,722 | ) | — | — | — | |||||||||||
|
|
|
|
|
|
|
|
|
|||||||||
| Comprehensive income (loss) attributable to common stockholders |
$ | — | $ | (9,702 | ) | $ | (2,272 | ) | $ | (3,066 | ) | |||||
|
|
|
|
|
|
|
|
|
|||||||||
See accompanying notes.
F-5
Table of Contents
Peregrine Semiconductor Corporation
CONSOLIDATED STATEMENTS OF CONVERTIBLE PREFERRED STOCK AND STOCKHOLDERS’ DEFICIT
(in thousands)
| Convertible Preferred Stock | Common Stock | Additional Paid-in Capital |
Accumulated Deficit |
Accumulated Other Comprehensive Income (Loss) |
Total Stockholders’ Deficit |
|||||||||||||||||||||||||||||||||||||||||||||||||||||
| Series A1 | Series B1 | Series C1 | Series D1 | |||||||||||||||||||||||||||||||||||||||||||||||||||||||
| Shares | Amount | Shares | Amount | Shares | Amount | Shares | Amount | Shares | Amount | |||||||||||||||||||||||||||||||||||||||||||||||||
| Balance at December 26, 2009 |
5,763 | $ | 31,837 | 1,629 | $ | 11,298 | 6,103 | $ | 35,420 | 8,865 | $ | 93,826 | 2,267 | $ | 2 | $ | 78,748 | $ | (222,285 | ) | $ | (166 | ) | $ | (143,701 | ) | ||||||||||||||||||||||||||||||||
| Exercise of stock options, net of repurchase liability and including vesting of early exercises |
— | — | — | — | — | — | — | — | 407 | 1 | 649 | — | — | 650 | ||||||||||||||||||||||||||||||||||||||||||||
| Stock-based compensation expense |
— | — | — | — | — | — | — | — | — | — | 2,517 | — | — | 2,517 | ||||||||||||||||||||||||||||||||||||||||||||
| Reclassification of common stock warrant to stockholders’ deficit upon modification |
— | — | — | — | — | — | — | — | — | — | 640 | — | — | 640 | ||||||||||||||||||||||||||||||||||||||||||||
| Net settlement of Series C1 preferred stock warrants |
— | — | — | — | 5 | 49 | — | — | — | — | — | — | — | — | ||||||||||||||||||||||||||||||||||||||||||||
| Net income |
— | — | — | — | — | — | — | — | — | — | — | 3,760 | — | 3,760 | ||||||||||||||||||||||||||||||||||||||||||||
| Other comprehensive loss |
— | — | — | — | — | — | — | — | — | — | — | — | (38 | ) | (38 | ) | ||||||||||||||||||||||||||||||||||||||||||
|
|
|
|
|
|
|
|
|
|
|
|
|
|
|
|
|
|
|
|
|
|
|
|
|
|
|
|
|
|||||||||||||||||||||||||||||||
| Balance at December 25, 2010 |
5,763 | 31,837 | 1,629 | 11,298 | 6,108 | 35,469 | 8,865 | 93,826 | 2,674 | 3 | 82,554 | (218,525 | ) | (204 | ) | (136,172 | ) | |||||||||||||||||||||||||||||||||||||||||
| Exercise of stock options, net of repurchase liability and including vesting of early exercises |
— | — | — | — | — | — | — | — | 102 | — | 190 | — | — | 190 | ||||||||||||||||||||||||||||||||||||||||||||
| Stock-based compensation expense |
— | — | — | — | — | — | — | — | — | — | 3,084 | — | — | 3,084 | ||||||||||||||||||||||||||||||||||||||||||||
| Net loss |
— | — | — | — | — | — | — | — | — | — | — | (9,682 | ) | — | (9,682 | ) | ||||||||||||||||||||||||||||||||||||||||||
| Other comprehensive loss |
— | — | — | — | — | — | — | — | — | — | — | — | (20 | ) | (20 | ) | ||||||||||||||||||||||||||||||||||||||||||
|
|
|
|
|
|
|
|
|
|
|
|
|
|
|
|
|
|
|
|
|
|
|
|
|
|
|
|
|
|||||||||||||||||||||||||||||||
| Balance at December 31, 2011 |
5,763 | 31,837 | 1,629 | 11,298 | 6,108 | 35,469 | 8,865 | 93,826 | 2,776 | 3 | 85,828 | (228,207 | ) | (224 | ) | (142,600 | ) | |||||||||||||||||||||||||||||||||||||||||
| Exercise of stock options, net of repurchase liability and including vesting of early exercises (unaudited) |
— | — | — | — | — | — | — | — | 69 | — | 108 | — | — | 108 | ||||||||||||||||||||||||||||||||||||||||||||
| Stock-based compensation expense (unaudited) |
— | — | — | — | — | — | — | — | — | — | 1,964 | — | — | 1,964 | ||||||||||||||||||||||||||||||||||||||||||||
| Net settlement of Series D1 preferred stock warrants |
— | — | — | — | — | — | 19 | 477 | — | — | — | — | — | — | ||||||||||||||||||||||||||||||||||||||||||||
| Net loss (unaudited) |
— | — | — | — | — | — | — | — | — | — | — | (3,068 | ) | — | (3,068 | ) | ||||||||||||||||||||||||||||||||||||||||||
| Other comprehensive income (unaudited) |
— | — | — | — | — | — | — | — | — | — | — | — | 2 | 2 | ||||||||||||||||||||||||||||||||||||||||||||
|
|
|
|
|
|
|
|
|
|
|
|
|
|
|
|
|
|
|
|
|
|
|
|
|
|
|
|
|
|||||||||||||||||||||||||||||||
| Balance at June 30, 2012 (unaudited) |
5,763 | $ | 31,837 | 1,629 | $ | 11,298 | 6,108 | $ | 35,469 | 8,884 | $ | 94,303 | 2,845 | $ | 3 | $ | 87,900 | $ | (231,275 | ) | $ | (222 | ) | $ | (143,594 | ) | ||||||||||||||||||||||||||||||||
|
|
|
|
|
|
|
|
|
|
|
|
|
|
|
|
|
|
|
|
|
|
|
|
|
|
|
|
|
|||||||||||||||||||||||||||||||
See accompanying notes.
F-6
Table of Contents
Peregrine Semiconductor Corporation
CONSOLIDATED STATEMENTS OF CASH FLOWS
(in thousands)
| Year Ended | Six Months Ended | |||||||||||||||
| December 25, 2010 |
December 31, 2011 |
June 25, 2011 |
June 30, 2012 |
|||||||||||||
| Operating activities | unaudited | |||||||||||||||
| Net income (loss) |
$ | 3,760 | $ | (9,682 | ) | $ | (2,295 | ) | $ | (3,068 | ) | |||||
| Adjustments to reconcile net income (loss) to net cash provided by (used in) operating activities: |
||||||||||||||||
| Depreciation and amortization |
3,628 | 3,980 | 1,963 | 1,949 | ||||||||||||
| Loss (gain) on disposal of property and equipment |
(17 | ) | 8 | 8 | — | |||||||||||
| Amortization of loan discount |
11 | — | — | — | ||||||||||||
| Stock-based compensation |
2,517 | 3,084 | 1,483 | 1,964 | ||||||||||||
| Revaluation of warrants to fair value |
(53 | ) | (36 | ) | 16 | 633 | ||||||||||
| Imputed interest related to customer deposit financing arrangements |
— | — | — | 144 | ||||||||||||
| Cash received for lease incentive |
— | 348 | 327 | — | ||||||||||||
| Changes in operating assets and liabilities: |
||||||||||||||||
| Accounts receivable |
201 | (1,303 | ) | (3,462 | ) | (5,048 | ) | |||||||||
| Inventories |
(3,129 | ) | (7,522 | ) | (197 | ) | (12,652 | ) | ||||||||
| Prepaids and other current and noncurrent assets |
(318 | ) | (2,271 | ) | (694 | ) | (8,359 | ) | ||||||||
| Accounts payable and accrued liabilities |
(219 | ) | 13,032 | 4,317 | 15,928 | |||||||||||
| Customer deposits |
— | — | — | 31,058 | ||||||||||||
| Deferred net revenue |
1,370 | 265 | 1,630 | 385 | ||||||||||||
|
|
|
|
|
|
|
|
|
|||||||||
| Net cash provided by (used in) operating activities |
7,751 | (97 | ) | 3,096 | 22,934 | |||||||||||
| Investing activities |
||||||||||||||||
| Purchase of property and equipment |
(3,473 | ) | (4,354 | ) | (2,039 | ) | (6,126 | ) | ||||||||
| Proceeds from sale of equipment |
28 | 24 | 24 | — | ||||||||||||
|
|
|
|
|
|
|
|
|
|||||||||
| Net cash used in investing activities |
(3,445 | ) | (4,330 | ) | (2,015 | ) | (6,126 | ) | ||||||||
| Financing activities |
||||||||||||||||
| Payments on obligations under capital leases |
(745 | ) | (681 | ) | (368 | ) | (261 | ) | ||||||||
| Proceeds from notes payable |
2,567 | — | — | — | ||||||||||||
| Payments on notes payable |
(2,128 | ) | (820 | ) | (405 | ) | (425 | ) | ||||||||
| Payments on product financing arrangement |
(3,198 | ) | — | — | — | |||||||||||
| Proceeds from line of credit |
— | 4,500 | 1,000 | 3,000 | ||||||||||||
| Proceeds from exercise of stock options |
618 | 148 | 91 | 99 | ||||||||||||
| Proceeds from customer deposit financing arrangement |
— | — | — | 12,000 | ||||||||||||
| Costs paid in connection with initial public offering |
(838 | ) | (1,845 | ) | (1,568 | ) | (425 | ) | ||||||||
|
|
|
|
|
|
|
|
|
|||||||||
| Net cash provided by (used in) financing activities |
(3,724 | ) | 1,302 | (1,250 | ) | 13,988 | ||||||||||
| Effect of exchange rate changes on cash and cash equivalents |
(73 | ) | 18 | 71 | 3 | |||||||||||
|
|
|
|
|
|
|
|
|
|||||||||
| Net change in cash and cash equivalents |
509 | (3,107 | ) | (98 | ) | 30,799 | ||||||||||
| Cash and cash equivalents at beginning of period |
14,717 | 15,226 | 15,226 | 12,119 | ||||||||||||
|
|
|
|
|
|
|
|
|
|||||||||
| Cash and cash equivalents at end of period |
$ | 15,226 | $ | 12,119 | $ | 15,128 | $ | 42,918 | ||||||||
|
|
|
|
|
|
|
|
|
|||||||||
| Supplemental disclosure of cash flow information |
||||||||||||||||
| Interest paid |
$ | 603 | $ | 345 | $ | 169 | $ | 249 | ||||||||
|
|
|
|
|
|
|
|
|
|||||||||
| Income taxes paid |
$ | 86 | $ | 82 | $ | 77 | $ | 64 | ||||||||
|
|
|
|
|
|
|
|
|
|||||||||
| Supplemental disclosure of non cash investing and financing activities |
||||||||||||||||
| Loan and capital lease obligation for capital equipment and software |
$ | 1,924 | $ | 207 | $ | — | $ | — | ||||||||
|
|
|
|
|
|
|
|
|
|||||||||
| Reclassification of restricted stock to equity upon vesting of early exercised options |
$ | 32 | $ | 42 | $ | 22 | 8 | |||||||||
|
|
|
|
|
|
|
|
|
|||||||||
See accompanying notes.
F-7
Table of Contents
Peregrine Semiconductor Corporation
NOTES TO CONSOLIDATED FINANCIAL STATEMENTS
(in thousands, except per share amounts. Information as of June 30, 2012
and for the six months ended June 25, 2011 and June 30, 2012 is unaudited)
1. Summary of Significant Accounting Policies
The Company
Peregrine Semiconductor Corporation (the Company) is a fabless provider of high performance RFICs. The Company’s solutions leverage its proprietary UltraCMOS technology which enables the design, manufacture, and integration of multiple RF, mixed signal, and digital functions on a single chip. The Company’s solutions target a broad range of applications in the aerospace and defense, broadband, industrial, mobile wireless device, test and measurement equipment, and wireless infrastructure markets.
As of June 30, 2012, the Company has an accumulated deficit of $231,275. The Company has financed its historical operations primarily through the sale of convertible preferred stock, debt financing, and through cash generated from operations. The Company believes its cash and cash equivalents, together with cash generated from operations, customer deposits, and its access to existing debt facility will be sufficient to meet its liquidity requirements through June 30, 2013.
Principles of Consolidation
The consolidated financial statements include the accounts of the Company and its subsidiaries. All significant intercompany transactions have been eliminated upon consolidation.
Unaudited Interim Consolidated Financial Statements
The accompanying interim consolidated balance sheet as of June 30, 2012, the consolidated statements of operations, comprehensive income (loss), and cash flows for the six months ended June 25, 2011 and June 30, 2012 and consolidated statement of convertible preferred stock and stockholders’ deficit for the six months ended June 30, 2012, and the related information contained in the notes to the consolidated financial statements are unaudited. These unaudited interim consolidated financial statements and notes have been prepared on the same basis as the audited consolidated financial statements and, in the opinion of management, reflect all adjustments, which include only normal recurring adjustments, necessary to present fairly the Company’s consolidated financial position as of June 30, 2012 and its consolidated results of operations and cash flows for the six months ended June 25, 2011 and June 30, 2012. The results of operations for the six months ended June 30, 2012 are not necessarily indicative of the results to be expected for the year ending December 29, 2012 or for any other interim period or for any other future year.
Unaudited Pro Forma Stockholders’ Equity
The unaudited pro forma stockholders’ equity information in the accompanying consolidated balance sheet assumes the conversion of the outstanding shares of convertible preferred stock into 22,384 shares of common stock, and the conversion of the Company’s remaining warrants to purchase convertible preferred stock, into warrants to purchase common stock and the related reclassification of $808 of other long-term liabilities into stockholders’ equity (deficit), as though the completion of an initial public offering contemplated by the Company had occurred on June 30, 2012. Common shares potentially issued in such initial public offering and any related estimated net proceeds are excluded from such pro forma information.
Accounting Periods
The Company uses a 52- or 53-week fiscal year ending on the last Saturday in December. Fiscal year 2010 was a 52-week year ending on December 25, 2010. Fiscal year 2011 was a 53-week year ending on December 31, 2011. The Company’s first six months for fiscal year 2011 and 2012 was a 26-week period ending on June 25, 2011 and June 30, 2012, respectively.
F-8
Table of Contents
Peregrine Semiconductor Corporation
NOTES TO CONSOLIDATED FINANCIAL STATEMENTS—(Continued)
(in thousands, except per share amounts. Information as of June 30, 2012
and for the six months ended June 25, 2011 and June 30, 2012 is unaudited)
Use of Estimates
The preparation of financial statements in conformity with generally accepted accounting principles requires management to make estimates and assumptions that affect the reported amount of assets and liabilities and disclosures of contingent assets and liabilities at the date of the financial statements, and the reported amounts of net revenue and expense during the reporting period. Actual results could differ from those estimates.
Cash and Cash Equivalents
Cash equivalents consist of United States (U.S.) Treasuries money market funds with maturities of 90 days or less on the date acquired. Cash equivalents are stated at cost, which approximates fair market value.
Inventories
Inventories are stated at the lower of cost (first-in, first-out) or market. Inventory reserves or lower of cost or market allowances are established on a part specific basis for estimated obsolescence or unmarketable inventory equal to the difference between the cost of inventory and the estimated realizable value based upon assumptions about future demand and market conditions and reduce the carrying value of the related inventory. Such reductions establish a new cost basis for the specific parts. Shipping and handling costs are classified as a component of cost of net revenue in the consolidated statements of operations.
Property and Equipment
Property and equipment is carried at cost and is depreciated using the straight-line method over the useful lives of the assets ranging from three to seven years. Leasehold improvements are amortized over the estimated life of the asset or term of the lease, whichever is shorter.
Costs incurred to develop internal-use software during the application development stage are capitalized and recorded at cost. Application development stage costs generally include costs associated with internal-use software configuration, coding, installation and testing. Costs of significant upgrades and enhancements that result in additional functionality also are capitalized, whereas costs incurred for maintenance and minor upgrades and enhancements are expensed as incurred. Capitalized costs are amortized using the straight-line method over three to five years once the software is ready for its intended use. During the year ended December 25, 2010, the Company capitalized costs of $2,412 associated with the implementation of a new ERP system. Capitalized software costs were not material for any other period presented.
Impairment of Long-Lived Assets
The Company regularly reviews the carrying amount of its long-lived assets, as well as their useful lives, to determine whether indicators of impairment may exist which warrant adjustments to carrying values or estimated useful lives. An impairment loss would be recognized when the sum of the expected future undiscounted net cash flows is less than the carrying amount of the asset. Should impairment exist, the impairment loss would be measured based on the excess of the carrying amount of the asset over the asset’s fair value. The Company has not recognized any impairment losses through June 30, 2012.
Fair Value of Financial Instruments
Financial instruments, including cash equivalents, accounts receivable, accounts payable, accrued liabilities, notes payable and the Company’s line of credit, are carried at cost, which management believes approximates
F-9
Table of Contents
Peregrine Semiconductor Corporation
NOTES TO CONSOLIDATED FINANCIAL STATEMENTS—(Continued)
(in thousands, except per share amounts. Information as of June 30, 2012
and for the six months ended June 25, 2011 and June 30, 2012 is unaudited)
fair value due to the maturity and respective duration of these instruments. The fair value of lease obligations and notes payable is estimated using a discounted cash flow analysis, based on the Company’s incremental borrowing rates for similar types of borrowing arrangements.
Concentration of Credit Risk
Financial instruments, which potentially subject the Company to concentrations of credit risk, consist primarily of cash equivalents and accounts receivable. The Company limits its exposure to credit loss by placing its cash with high credit quality financial institutions. At times, such deposits may be in excess of insured limits. The Company has not experienced any losses on its cash equivalents.
Research and Development
Research and development costs are expensed as incurred.
Advertising Expense
The cost of advertising is expensed as incurred. The Company recognized advertising expense of $239 and $185 for the years ended December 25, 2010 and December 31, 2011, respectively, and $91 and $113 for the six months ended June 25, 2011 and June 30, 2012, respectively.
Revenue Recognition
The Company recognizes revenue when each of the following have occurred: (1) there is persuasive evidence that an arrangement with the customer exists, which is generally a customer purchase order; (2) the products are delivered, which generally occurs when the products are shipped and risk of loss has been transferred to the customer; (3) the selling price is fixed or determinable; and (4) collection of the customer receivable is deemed reasonably assured.
The Company records revenue based on facts available at the time of sale. Amounts that are not probable of collection once the product has shipped and title has transferred to the customer are deferred until the amount that is probable of collection can be determined. Items that are considered when determining the amounts that will be ultimately collected are the customer’s overall creditworthiness and payment history.
For distributors with rights of return, revenue is not recognized until product is shipped to the end customer of the distributor and the amount that will ultimately be collected is determinable. On shipments where net revenue is not recognized, the Company records an accounts receivable and deferred revenue for the selling price as there is a legally enforceable right to payment. Inventory at distributors remains on the Company’s books at carrying value until sold by the distributor at which time the Company recognizes the net revenue and cost of net revenue.
The Company records reductions of revenue for estimated product returns in the same period that the related revenue is recorded. The amount of these reductions is based on historical sales returns, analysis of credit memo data, and other factors known at the time. Additional reductions of revenue would result if actual product returns exceed the Company’s estimates. To date, product returns have not been significant.
F-10
Table of Contents
Peregrine Semiconductor Corporation
NOTES TO CONSOLIDATED FINANCIAL STATEMENTS—(Continued)
(in thousands, except per share amounts. Information as of June 30, 2012
and for the six months ended June 25, 2011 and June 30, 2012 is unaudited)
The Company offers its distributors rights of return, price protection, and in some situations, credits on pricing depending on their end customer (ship and debit credits). For these distributors revenue is not recognized until product is shipped to the end customer of the distributor and the amount that will ultimately be collected is determinable. On shipments where net revenue is not recognized, the Company records an accounts receivable and deferred net revenue for the selling price as there is a legally enforceable right to payment. Inventory at distributors remains on the Company’s books at carrying value until sold by the distributor at which time the Company recognizes the net revenue and cost of net revenue. Revenues to these distributors are recorded net of any pricing adjustments for price protection or ship and debit credits in the same period as the sale of goods to their customers. The amount of any pricing adjustment is based on the difference between the price at which the distributor originally purchased the Company’s inventory and either: (1) a lower distribution price then being offered on those products for price protection; or (2) a special price offered to the distributor in order to meet competitive pressures in the marketplace for ship and debit credits. The Company does not currently offer rebates or other pricing incentives, except for volume purchase pricing at the time of sale, to direct customers or distributors.
The Company also maintains an allowance for doubtful accounts for estimated losses resulting from the inability of customers to make required payments. If the financial condition of any customer were to deteriorate, resulting in an impairment of its ability to make payments, additional allowances could be required.
The Company records revenue for cost reimbursable service contracts as the services are performed. On a limited basis, certain of the Company’s net revenue arrangements include additional elements, such as future product deliveries or services. Judgment is required to properly identify the accounting units of the multiple deliverable transactions and to determine the manner in which revenue should be allocated among the accounting units. When the Company enters into an arrangement that includes multiple elements, the allocation of value to each element is derived based on management’s best estimate of selling price when vendor specific evidence or third party evidence is unavailable.
Vendor Consideration Received
In certain situations the Company enters into license agreements related to its UltraCMOS technology simultaneously with foundry agreements with outsourced manufacturers. When the Company receives consideration for the license and it cannot sufficiently separate the identifiable benefit attributable to the license or reasonably estimate the fair value of the license provided from the inventory purchases, it classifies the consideration received as a reduction to cost of net revenues over the period that the consideration is earned.
Warranty Accrual
The Company generally provides a product warranty for a period of one year; however, it may be longer for certain customers. Accordingly, the Company establishes provisions for estimated product warranty costs at the time net revenue is recognized based upon historical activity and, additionally, for any known product warranty issues. Warranty provisions are recorded as a cost of net revenue. The determination of such provisions requires the Company to make estimates of product return rates and expected costs to replace or rework the products under warranty. When the actual product failure rates, cost of replacements and rework costs differ from the original estimates, revisions to the estimated warranty accrual are made. Actual claims are charged against the warranty reserve.
F-11
Table of Contents
Peregrine Semiconductor Corporation
NOTES TO CONSOLIDATED FINANCIAL STATEMENTS—(Continued)
(in thousands, except per share amounts. Information as of June 30, 2012
and for the six months ended June 25, 2011 and June 30, 2012 is unaudited)
Stock-Based Compensation
The Company has stock incentive plans under which options to purchase common stock have been granted to employees, consultants and directors. The stock options have been granted to employees with exercise prices equal to or above the fair value of the underlying stock, as determined by the board of directors on the date the equity award was granted. The board of directors determined the value of the underlying stock by considering a number of factors, including historical and projected financial results, the risks the Company faced at the time, the preferences of the Company’s preferred stock, and the lack of liquidity of the Company’s common stock.
Foreign Currency Translation
Foreign subsidiaries operating in a local currency environment use the local currency as the functional currency. Resulting translation gains or losses are recognized as a component of other comprehensive income (loss). Transaction gains or losses related to balances denominated in a different currency than the functional currency are recognized in the statement of operations.
Other Income (Expense), net
Other income (expense), net consists primarily of foreign currency exchange gains and losses.
Comprehensive Income (Loss)
Comprehensive income (loss) is defined as the change in equity during a period from transactions and other events and circumstances from non-owner sources. Net income (loss) and other comprehensive income (loss), consists of foreign currency translation adjustments and unrealized gains and losses on investments, are reported, net of their related tax effect, to arrive at comprehensive income (loss).
Income Taxes
The Company accounts for income taxes using the asset and liability approach, the objective of which is to establish deferred tax assets and liabilities for the temporary differences between the financial reporting basis and the tax basis of our assets and liabilities, as measured by applying currently enacted tax laws. A valuation allowance is established for deferred tax assets if, based on the weight of available evidence, it is more likely than not that some portion or all of the deferred tax assets will not be realized. Future realization of the deferred tax asset is dependent on the reversal of existing taxable temporary differences, carryback potential, tax-planning strategies and on us generating sufficient taxable income in future years as the deferred income tax charges become currently deductible for tax reporting purposes. For the years ended December 25, 2010 and December 31, 2011, and the six months ended June 30, 2012, the Company has recorded a full valuation allowance against its domestic net deferred tax assets due to uncertainty of future realization.
Net Income (Loss) per Share
The Company follows the authoritative guidance which establishes standards regarding the computation of earnings per share (EPS), by companies that have issued securities other than common stock that contractually entitle the holder to participate in dividends and earnings of the company. The guidance requires earnings available to common stockholders for the period, after deduction of preferred stock dividends, to be allocated between common and preferred stockholders based on their respective rights to receive dividends, whether or not declared. Basic net income (loss) per share is then calculated by dividing income allocable to common
F-12
Table of Contents
Peregrine Semiconductor Corporation
NOTES TO CONSOLIDATED FINANCIAL STATEMENTS—(Continued)
(in thousands, except per share amounts. Information as of June 30, 2012
and for the six months ended June 25, 2011 and June 30, 2012 is unaudited)
stockholders (after the reduction for any preferred stock dividends assuming current income for the period had been distributed) by the weighted average number of shares of common stock outstanding, net of shares subject to repurchase by the Company, during the period. The guidance does not require the presentation of basic and diluted net income (loss) per share for securities other than common stock; therefore, the net income (loss) per share amounts only pertain to the Company’s common stock. The Company calculates diluted net income (loss) per share under the as-if-converted method unless the conversion of the preferred stock is anti-dilutive to basic net income (loss) per share. To the extent preferred stock is anti-dilutive, the Company calculates diluted net income (loss) per share under the two-class method.
| Year Ended | Six Months Ended | |||||||||||||||
| December 25, 2010 |
December 31, 2011 |
June 25, 2011 |
June 30, 2012 |
|||||||||||||
| Numerator: |
||||||||||||||||
| Net income (loss) |
$ | 3,760 | $ | (9,682 | ) | $ | (2,295 | ) | $ | (3,068 | ) | |||||
| Net income allocable to preferred stockholders |
(3,760 | ) | — | — | — | |||||||||||
|
|
|
|
|
|
|
|
|
|||||||||
| Net income (loss) attributable to common stockholders |
$ | — | $ | (9,682 | ) | $ | (2,295 | ) | $ | (3,068 | ) | |||||
|
|
|
|
|
|
|
|
|
|||||||||
| Denominator: |
||||||||||||||||
| Weighted average common shares outstanding |
2,523 | 2,737 | 2,718 | 2,803 | ||||||||||||
| Less: weighted average unvested shares of common stock subject to repurchase |
19 | 22 | 25 | 13 | ||||||||||||
|
|
|
|
|
|
|
|
|
|||||||||
| Weighted average common stock outstanding |
2,504 | 2,715 | 2,693 | 2,790 | ||||||||||||
|
|
|
|
|
|
|
|
|
|||||||||
| Basic and diluted net income (loss) per share attributable to common stockholders |
$ | — | $ | (3.57 | ) | $ | (0.85 | ) | $ | (1.10 | ) | |||||
|
|
|
|
|
|
|
|
|
|||||||||
| Historical outstanding anti-dilutive securities not included in diluted net income (loss) per share calculation: |
||||||||||||||||
| Preferred stock (as converted) |
22,365 | 22,365 | 22,365 | 22,384 | ||||||||||||
| Common stock options |
6,135 | 7,240 | 6,160 | 7,406 | ||||||||||||
| Common stock warrants |
72 | 72 | 72 | 72 | ||||||||||||
| Preferred stock warrants |
205 | 205 | 205 | 124 | ||||||||||||
|
|
|
|
|
|
|
|
|
|||||||||
| 28,777 | 29,882 | 28,802 | 29,986 | |||||||||||||
|
|
|
|
|
|
|
|
|
|||||||||
F-13
Table of Contents
Peregrine Semiconductor Corporation
NOTES TO CONSOLIDATED FINANCIAL STATEMENTS—(Continued)
(in thousands, except per share amounts. Information as of June 30, 2012
and for the six months ended June 25, 2011 and June 30, 2012 is unaudited)
The unaudited pro forma basic and diluted net loss per share is calculated by dividing the pro forma net loss by the weighted average number of common shares outstanding for the period plus the weighted average number of common shares resulting from the assumed conversion of the outstanding shares of convertible preferred stock. The assumed conversion is calculated using the as-if-converted method, as if such conversion had occurred as of the beginning of each period presented or the original issuance date, if later.
| Year Ended December 31, 2011 |
Six Months Ended June 30, 2012 |
|||||||
| Pro Forma |
||||||||
| Net loss |
$ | (9,682 | ) | $ | (3,068 | ) | ||
| Weighted average common stock outstanding |
2,715 | 2,790 | ||||||
| Pro forma adjustments to reflect assumed weighted average effect of conversion of preferred stock |
22,365 |
|
22,367 |
| ||||
|
|
|
|
|
|||||
| Pro forma shares used to compute basic net loss per share attributable to common stockholders |
25,080 |
|
25,157 |
| ||||
| Pro forma common equivalent shares from options to purchase common stock |
— |
|
— |
| ||||
|
|
|
|
|
|||||
| Pro forma shares used to compute diluted net loss per share attributable to common stockholders |
25,080 | |
25,157 |
| ||||
|
|
|
|
|
|||||
| Pro forma net loss per share attributable to common stockholders: |
||||||||
| Basic |
$ | (0.39 | ) | $ | (0.12 | ) | ||
|
|
|
|
|
|||||
| Diluted |
$ | (0.39 | ) | $ | (0.12 | ) | ||
|
|
|
|
|
|||||
Recent Accounting Pronouncements
In September 2009 the FASB reached a consensus on Accounting Standards Update (ASU), 2009-13, Revenue Recognition (Topic 605) — Multiple-Deliverable Revenue Arrangements, or ASU 2009-13, and ASU 2009-14, Software (Topic 985) — Certain Revenue Arrangements That Include Software Elements, or ASU 2009-14. ASU 2009-13 modifies the requirements that must be met for an entity to recognize revenue from the sale of a delivered item that is part of a multiple-element arrangement when other items have not yet been delivered. ASU 2009-13 eliminates the requirement that all undelivered elements must have either: i) vendor specific objective evidence (VSOE), or ii) third-party evidence (TPE), before an entity can recognize the portion of overall arrangement consideration that is attributable to items that already have been delivered. In the absence of VSOE or TPE of the standalone selling price for one or more delivered or undelivered elements in a multiple-element arrangement, entities will be required to estimate the selling prices of those elements. Overall arrangement consideration will be allocated to each element (both delivered and undelivered items) based on their relative selling prices, regardless of whether those selling prices are evidenced by VSOE or TPE or are based on the entity’s estimated selling price. The residual method of allocating arrangement consideration has been eliminated. ASU 2009-14 modifies the software revenue recognition guidance to exclude from its scope tangible products that contain both software and non-software components that function together to deliver a product’s essential functionality. These new updates are effective for revenue arrangements entered into or materially modified in fiscal years beginning on or after June 15, 2010. Early adoption was permitted. The adoption of these ASUs as of December 26, 2010 did not have a material impact on the Company’s consolidated financial statements.
F-14
Table of Contents
Peregrine Semiconductor Corporation
NOTES TO CONSOLIDATED FINANCIAL STATEMENTS—(Continued)
(in thousands, except per share amounts. Information as of June 30, 2012
and for the six months ended June 25, 2011 and June 30, 2012 is unaudited)
In March 2010, the FASB ratified the final consensus that offers an alternative method of revenue recognition for milestone payments. The guidance states that an entity can make an accounting policy election to recognize a payment that is contingent upon the achievement of a substantive milestone in its entirety in the period in which the milestone is achieved. The guidance will be effective for fiscal years, and interim periods within those years, beginning on or after June 15, 2010 with early adoption permitted, provided that the revised guidance is applied retrospectively to the beginning of the year of adoption. The guidance may be applied retrospectively or prospectively for milestones achieved after the adoption date. The adoption of this guidance as of December 26, 2010 did not have a material impact on the Company’s consolidated financial statements.
In 2011, the FASB issued amended standards to increase the prominence of items reported in other comprehensive income. These amendments eliminate the option to present components of other comprehensive income as part of the statement of changes in stockholders’ equity and require that all changes in stockholders’ equity—except investments by, and distributions to, owners—be presented either in a single continuous statement of comprehensive income or in two separate but consecutive statements. These new standards are effective for the Company beginning in the first quarter of 2012 and are to be applied retrospectively. These amended standards will impact the presentation of other comprehensive income (loss) but will not impact the Company’s consolidated financial position or consolidated results of operations.
2. Certain Financial Statement Information
Inventories consisted of the following:
| December 25, 2010 |
December 31, 2011 |
June 30, 2012 |
||||||||||
| Raw materials |
$ | 5,049 | $ | 5,567 | $ | 5,425 | ||||||
| Work in progress |
8,391 | 16,200 | 22,035 | |||||||||
| Finished goods |
8,920 | 8,055 | 15,019 | |||||||||
|
|
|
|
|
|
|
|||||||
| $ | 22,360 | $ | 29,822 | $ | 42,479 | |||||||
|
|
|
|
|
|
|
|||||||
During the year ended December 31, 2011, the Company recorded reductions to the carrying value of inventory of $3,355 as a result of a lower of cost or market valuation. These write downs were the result of lower than anticipated yields of certain wafers in new manufacturing processes and were recorded in cost of net revenue.
Included in the table above are inventories held by others, which includes distributors and third-parties in the Company’s supply chain of $3,236, $4,999, and $7,032 at December 25, 2010, December 31, 2011, and June 30, 2012, respectively.
F-15
Table of Contents
Peregrine Semiconductor Corporation
NOTES TO CONSOLIDATED FINANCIAL STATEMENTS—(Continued)
(in thousands, except per share amounts. Information as of June 30, 2012
and for the six months ended June 25, 2011 and June 30, 2012 is unaudited)
Property and equipment consisted of the following:
| Useful Life (Years) |
December 25, 2010 |
December 31, 2011 |
June 30, 2012 |
|||||||||||
| Computer equipment and software |
3 - 5 | $ | 3,835 | $ | 4,374 | $ | 4,902 | |||||||
| Machinery and equipment |
5 | 19,480 | 22,740 | 24,156 | ||||||||||
| Office furniture and equipment |
7 | 91 | 324 | 324 | ||||||||||
| Leasehold improvements |
Life of lease | 1,888 | 2,608 | 2,860 | ||||||||||
| Construction in progress |
1,102 | 856 | 4,784 | |||||||||||
|
|
|
|
|
|
|
|||||||||
| 26,396 | 30,902 | 37,026 | ||||||||||||
| Less accumulated depreciation and amortization |
(16,670 | ) | (20,630 | ) | (22,575 | ) | ||||||||
|
|
|
|
|
|
|
|||||||||
| $ | 9,726 | $ | 10,272 | $ | 14,451 | |||||||||
|
|
|
|
|
|
|
|||||||||
Depreciation and amortization expense was $3,628 and $3,980 for the years ended December 25, 2010 and December 31, 2011, and $1,963 and $1,949 for the six months ended June 25, 2011 and June 30, 2012, respectively.
Accrued liabilities consisted of the following:
| December 25, 2010 |
December 31, 2011 |
June 30, 2012 |
||||||||||
| Accrued inventory purchases |
$ | 1,620 | $ | 4,869 | $ | 1,574 | ||||||
| Accrued inventory repurchase obligation |
824 | 3,725 | 4,130 | |||||||||
| Accrued loss on firm purchase commitment |
163 | — | — | |||||||||
| Accrued other |
2,135 | 2,883 | 4,184 | |||||||||
|
|
|
|
|
|
|
|||||||
| $ | 4,742 | $ | 11,477 | $ | 9,888 | |||||||
|
|
|
|
|
|
|
|||||||
Other long-term liabilities consisted of the following:
| December 25, 2010 |
December 31, 2011 |
June 30, 2012 |
||||||||||
| Preferred stock warrant liability |
$ | 687 | $ | 651 | $ | 808 | ||||||
| Customer deposits |
— | — | 4,000 | |||||||||
| Other long-term liabilities |
1,012 | 678 | |
583 |
| |||||||
|
|
|
|
|
|
|
|||||||
| $ | 1,699 | $ | 1,329 | $ | 5,391 | |||||||
|
|
|
|
|
|
|
|||||||
Warranty
Warranty costs, which include labor and material, incurred and related reserves (included in accrued liabilities) were as follows:
| Year Ended | Six Months ended | |||||||||||
| December 25, 2010 |
December 31, 2011 |
June 30, 2012 |
||||||||||
| Balance at beginning of period |
$ | 202 | $ | 139 | $ | 27 | ||||||
| Provision (benefit), net |
1 | (5 | ) | 35 | ||||||||
| Costs incurred |
(64 | ) | (107 | ) | (36 | ) | ||||||
|
|
|
|
|
|
|
|||||||
| Balance at end of period |
$ | 139 | $ | 27 | $ | 26 | ||||||
|
|
|
|
|
|
|
|||||||
F-16
Table of Contents
Peregrine Semiconductor Corporation
NOTES TO CONSOLIDATED FINANCIAL STATEMENTS—(Continued)
(in thousands, except per share amounts. Information as of June 30, 2012
and for the six months ended June 25, 2011 and June 30, 2012 is unaudited)
3. Assets/Liabilities Measured and Recorded at Fair Value on a Recurring Basis
Fair value measurements are classified and disclosed in one of the following three categories:
Level 1: Quoted prices (unadjusted) in active markets that are accessible at the measurement date for assets or liabilities.
Level 2: Observable prices that are based on inputs not quoted on active markets, but corroborated by market data.
Level 3: Unobservable inputs are used when little or no market data is available.
| Fair Value Measurement at December 25, 2010 | ||||||||||||||||
| Total | Level 1 | Level 2 | Level 3 | |||||||||||||
| Assets |
||||||||||||||||
| Cash equivalents |
$ | 9,740 | $ | 9,740 | $ | — | $ | — | ||||||||
|
|
|
|
|
|
|
|
|
|||||||||
| Total assets |
$ | 9,740 | $ | 9,740 | $ | — | $ | — | ||||||||
|
|
|
|
|
|
|
|
|
|||||||||
| Liabilities |
||||||||||||||||
| Preferred stock warrant liability |
$ | 687 | $ | — | $ | — | $ | 687 | ||||||||
|
|
|
|
|
|
|
|
|
|||||||||
| Total liabilities |
$ | 687 | $ | — | $ | — | $ | 687 | ||||||||
|
|
|
|
|
|
|
|
|
|||||||||
| Fair Value Measurement at December 31, 2011 | ||||||||||||||||
| Total | Level 1 | Level 2 | Level 3 | |||||||||||||
| Assets |
||||||||||||||||
| Cash equivalents |
$ | 8,741 | $ | 8,741 | $ | — | $ | — | ||||||||
|
|
|
|
|
|
|
|
|
|||||||||
| Total assets |
$ | 8,741 | $ | 8,741 | $ | — | $ | — | ||||||||
|
|
|
|
|
|
|
|
|
|||||||||
| Liabilities |
||||||||||||||||
| Preferred stock warrant liability |
$ | 651 | $ | — | $ | — | $ | 651 | ||||||||
|
|
|
|
|
|
|
|
|
|||||||||
| Total liabilities |
$ | 651 | $ | — | $ | — | $ | 651 | ||||||||
|
|
|
|
|
|
|
|
|
|||||||||
| Fair Value Measurement at June 30, 2012 | ||||||||||||||||
| Total | Level 1 | Level 2 | Level 3 | |||||||||||||
| Assets |
||||||||||||||||
| Cash equivalents |
$ | 8,742 | $ | 8,742 | $ | — | $ | — | ||||||||
|
|
|
|
|
|
|
|
|
|||||||||
| Total assets |
$ | 8,742 | $ | 8,742 | $ | — | $ | — | ||||||||
|
|
|
|
|
|
|
|
|
|||||||||
| Liabilities |
||||||||||||||||
| Preferred stock warrant liability |
$ | 808 | $ | — | $ | — | $ | 808 | ||||||||
|
|
|
|
|
|
|
|
|
|||||||||
| Total liabilities |
$ | 808 | $ | — | $ | — | $ | 808 | ||||||||
|
|
|
|
|
|
|
|
|
|||||||||
F-17
Table of Contents
Peregrine Semiconductor Corporation
NOTES TO CONSOLIDATED FINANCIAL STATEMENTS—(Continued)
(in thousands, except per share amounts. Information as of June 30, 2012
and for the six months ended June 25, 2011 and June 30, 2012 is unaudited)
The following table presents the changes in Level 3 instruments that are measured at fair value on a recurring basis:
| Preferred Stock Warrant Liability |
Common Stock Warrant Liability |
Total | ||||||||||
| Ending balance at December 26, 2009 |
$ | 692 | $ | 737 | $ | 1,429 | ||||||
| Total change in value: |
||||||||||||
| Included in interest expense |
44 | (97 | ) | (53 | ) | |||||||
| Included in additional paid-in capital |
— | (640 | ) | (640 | ) | |||||||
| Included in convertible preferred stock |
(49 | ) | — | (49 | ) | |||||||
|
|
|
|
|
|
|
|||||||
| Ending balance at December 25, 2010 |
687 | — | 687 | |||||||||
| Total change in value: |
||||||||||||
| Included in interest expense |
(36 | ) | — | (36 | ) | |||||||
|
|
|
|
|
|
|
|||||||
| Ending balance at December 31, 2011 |
651 | — | 651 | |||||||||
| Total change in value: |
||||||||||||
| Included in interest expense |
634 | — | 634 | |||||||||
| Included in convertible preferred stock |
(477 | ) | — | (477 | ) | |||||||
|
|
|
|
|
|
|
|||||||
| Ending balance at June 30, 2012 |
$ | 808 | $ | — | $ | 808 | ||||||
|
|
|
|
|
|
|
|||||||
4. Stockholders’ Equity
Common Stock
In November 2010, the Company amended its certificate of incorporation to increase the authorized shares of common stock to 33,058. In December 2011, the Company effected a reverse (1-for-800) and forward (800-for-1) split of the Company’s common stock. This did not effect the number of outstanding shares for any period, however, reduced the number of common stock shareholders.
Preferred Stock
The Company initially recorded each series of convertible preferred stock at their fair values on the dates of issuance, net of issuance costs. A redemption event will only occur upon the liquidation or winding up of the Company, a greater than 50% change of control or sale of substantially all of the assets of the Company. As the redemption event is outside the control of the Company, all shares of convertible preferred stock have been presented outside of permanent equity in accordance with accounting guidance for redeemable securities. Further, the Company is not adjusting the carrying values of the convertible preferred stock to the redemption value of such shares as it is uncertain whether or when a redemption event will occur. Subsequent adjustments to increase the carrying values will be made when it becomes probable that such redemption will occur.
The following table summarizes the rights associated with the outstanding convertible preferred stock as of December 25, 2010, December 31, 2011, and June 30, 2012 (per share):
| Noncumulative Dividends |
Liquidation Preference |
Conversion Ratio to Common Stock |
||||||||||
| Series A1 |
$ | 0.0555 | $ | 5.0888 | 1 to 1 | |||||||
| Series B1 |
$ | 0.0736 | $ | 6.7528 | 1 to 1 | |||||||
| Series C1 |
$ | 0.0627 | $ | 5.7524 | 1 to 1 | |||||||
| Series D1 |
$ | 0.1189 | $ | 10.9109 | 1 to 1 | |||||||
F-18
Table of Contents
Peregrine Semiconductor Corporation
NOTES TO CONSOLIDATED FINANCIAL STATEMENTS—(Continued)
(in thousands, except per share amounts. Information as of June 30, 2012
and for the six months ended June 25, 2011 and June 30, 2012 is unaudited)
The holders of Series D1 convertible preferred stock have liquidation preference over the holders of Series A1, Series B1 and Series C1 convertible preferred stock and common stock. After the payment of the Series D1 liquidation preference, the holders of Series C1 convertible preferred stock have liquidation preference over the holders of Series A1 and Series B1 convertible preferred stock and common stock. After the payment of the Series D1 and Series C1 liquidation preferences, holders of Series A1 and Series B1 convertible preferred stock have an equal liquidation preference over the holders of common stock.
All outstanding shares of the convertible preferred stock shall be automatically converted into common stock upon either the consummation of a firm commitment underwritten public offering where the aggregate sales price of such securities is not less than $25,000 and the per share sales price is not less than two and a half times the original Series D1 issuance price, or a vote of a majority of the outstanding shares of convertible preferred stock, voting as a class.
Warrants
In conjunction with establishing a loan with a venture debt firm in July 2006 (see Note 7), the Company issued a warrant for the purchase of shares of common stock that was to be determined at a future date and based on the Company’s valuation upon a public offering or merger. At December 26, 2009, the Company had estimated that 129 shares would be issuable pursuant to the warrant, based on the estimated fair value of its common stock. As of December 26, 2009 the Company had recorded a warrant liability of $737, which represented the fair value of the warrant. Changes to the fair value are recorded through the statement of operations until the number of shares to be issued becomes fixed. On November 18, 2010 the Company amended the warrant agreement to set the number of shares to be purchased under the agreement to 72. The Company revalued the warrant on the modification date and the fair value of $640 was reclassified from other long-term liabilities to additional paid-in capital upon amendment. The exercise price is $0.001 per share of common stock. The warrant was originally valued using the Black-Scholes pricing model with the following assumptions: (a) risk-free interest rate of 2.00%, (b) expected dividend yield of 0%, (c) three and a half-year life, (d) 65% volatility, (e) fair value of $0.78, and (f) exercise price of $0.01. The Company recorded changes to the fair value of the warrant liability of $97 and $0 for the years ending December 25, 2010 and December 31, 2011, respectively, and $0 for the six months ended June 25, 2011 and June 30, 2012. The changes in the warrant liability are recorded in interest expense.
In conjunction with the issuance of Series D1 convertible preferred stock in fiscal year 2008, the Company issued warrants to purchase 122 shares of Series D1 convertible preferred stock to an investment firm. The warrants have a five-year life and are exercisable for $10.9109 per share. The warrants were valued at $917 using the Black-Scholes pricing model with the following assumptions: (a) risk-free interest rate of 1.89%, (b) expected dividend yield of 0%, (c) seven-year life, (d) 73% volatility, (e) fair value and exercise price of $10.9109. The value was recorded as part of the financing offering costs.
In December 2010, holders of Series C1 convertible preferred stock warrants net settled 10 of their warrants for 5 shares of Series C1 convertible preferred stock. On the date of the settlement, the Company de-recognized the fair value of the preferred stock warrant liability of $49 against convertible preferred stock.
In May 2012, holders of Series D1 convertible preferred stock warrants net settled 80 of their warrants for 19 shares of Series D1 convertible preferred stock. On the date of the settlement, the Company de-recognized the fair value of the preferred stock warrant liability of $477 against convertible preferred stock.
F-19
Table of Contents
Peregrine Semiconductor Corporation
NOTES TO CONSOLIDATED FINANCIAL STATEMENTS—(Continued)
(in thousands, except per share amounts. Information as of June 30, 2012
and for the six months ended June 25, 2011 and June 30, 2012 is unaudited)
The Company’s certificate of incorporation includes provisions which, based on approval of the board of directors and a majority of the stockholders of the Company, allow for a sale of the assets of the business whereby the Company could be required to pay the liquidation preference on outstanding convertible preferred stock. As a result of these provisions, warrants to purchase convertible preferred stock are accounted for as liabilities. The Company adjusts the carrying value of such warrants to their estimated fair value at each reporting date and increases or decreases in the fair value of such warrants are recorded as interest expense in the consolidated statements of operations.
At December 25, 2010, December 31, 2011, and June 30, 2012, the fair value of Series A1, Series C1, and Series D1 convertible preferred stock warrants totaled $687, $651, and $808, respectively. The Company recorded changes to the fair value of the warrant liability of ($44) and $36 for the years ended December 25, 2010 and December 31, 2011, respectively, and ($16) and ($634) for the six months ending June 25, 2011 and June 30, 2012, respectively. The changes in the warrant liability are recorded in interest expense.
Stock-based Compensation Plans
2004 Plan: The Company is authorized to issue 6,495 shares upon the exercise of options to purchase common shares to employees, directors and consultants under a stock option plan adopted in 2004, as amended (the 2004 Plan). The 2004 Plan provides for the issuance of both incentive stock options (ISOs) and nonstatutory stock options (NSOs). NSOs may be granted to employees, directors or consultants, while ISOs may be granted only to employees. Options granted vest over a maximum period of four years and expire ten years from the date of grant. Options generally vest over four years, 25% on the first anniversary of the date of grant and monthly thereafter for the remaining three years. Stock options are not participating in any dividends declared by the Company.
2012 Plan: In April 2012, the Company’s board of directors adopted the 2012 Equity Incentive Plan (the 2012 Plan) and the stockholders approved it in May 2012. The 2012 Plan became effective on the adoption although no awards may be made under it until the completion of the offering, at which time the 2012 Plan will replace the 2004 Plan. The 2012 Plan authorizes the grant of ISOs, NSOs, stock appreciation rights, restricted stock, stock units, and performance cash awards.
2012 ESPP: In April 2012, the Company’s board of directors adopted the 2012 Employee Stock Purchase Plan (the 2012 ESPP) and the stockholders approved it in May 2012. The 2012 ESPP will be effective upon the completion of the offering. A total of 1,000 shares of common stock will be made available for sale under the 2012 ESPP. The 2012 ESPP permits participants to purchase common stock at a discount through contributions of up to 15% of their eligible compensation. The 2012 ESPP will be implemented through offering periods of approximately six months in duration. The purchase price of shares will be 85% of the lower of the fair market value of the Company’s common stock on the first trading day of each offering period or on the purchase date.
F-20
Table of Contents
Peregrine Semiconductor Corporation
NOTES TO CONSOLIDATED FINANCIAL STATEMENTS—(Continued)
(in thousands, except per share amounts. Information as of June 30, 2012
and for the six months ended June 25, 2011 and June 30, 2012 is unaudited)
The Company uses the Black-Scholes valuation model to calculate the fair value of stock options. The fair value of stock options was estimated at the grant date using the following:
| Year Ended | Six Months Ended | |||||||||||||||
| December 25, 2010 |
December 31, 2011 |
June 25, 2011 |
June 30, 2012 |
|||||||||||||
| Weighted-average expected term (years) |
6.08 | 5.24 | 6.08 | 5.00 | ||||||||||||
| Risk-free interest rate |
2.07 | % | 1.26 | % | 2.37 | % | 0.84 | % | ||||||||
| Dividend rate |
— | — | — | — | ||||||||||||
| Volatility |
60 | % | 61 | % | 59 | % | 62 | % | ||||||||
| Forfeiture rate |
2 | % | 3 | % | 2 | % | 3 | % | ||||||||
| Estimated weighted-average fair value per stock option |
$ | 4.11 | $ | 4.47 | $ | 5.06 | $ | 7.01 | ||||||||
The risk-free interest rate assumption was based on the U.S. Treasury’s rates for U.S. Treasury constant maturities similar to those of the expected term of the award being valued. The assumed dividend yield was based on the Company’s expectation of not paying dividends in the foreseeable future. The weighted average expected life of options was calculated using the simplified method as prescribed by guidance provided by the Securities and Exchange Commission. In October 2011, the Company revised its estimates to utilize data of peer companies to determine the weighted average life. This decision to use peer companies was based on a change in estimate to better align the estimated term of the Company’s options with the term experienced by the Company’s peers. In addition, due to the Company’s limited historical data, the estimated volatility incorporates the historical volatility of comparable companies whose share prices are publicly available.
The following summarizes activity related to the Company’s stock options and includes 1,743 options issued outside of the 2004 Plan at June 30, 2012:
| Options Outstanding |
Weighted-Average Exercise Price |
Aggregate Intrinsic Value |
Weighted-Average Remaining Contractual Term (Years) |
|||||||||||||
| Outstanding at December 26, 2009 |
5,113 | $ | 1.54 | $ | 7,299 | 6.84 | ||||||||||
| Granted |
1,513 | 7.12 | ||||||||||||||
| Exercised |
(404 | ) | 1.54 | |||||||||||||
| Forfeited |
(87 | ) | 2.72 | |||||||||||||
|
|
|
|||||||||||||||
| Outstanding at December 25, 2010 |
6,135 | $ | 2.86 | $ | 37,360 | 7.04 | ||||||||||
|
|
|
|||||||||||||||
| Granted |
1,349 | 9.69 | ||||||||||||||
| Exercised |
(105 | ) | 1.84 | |||||||||||||
| Forfeited |
(139 | ) | 5.94 | |||||||||||||
|
|
|
|||||||||||||||
| Outstanding at December 31, 2011 |
7,240 | $ | 4.11 | $ | 34,493 | 6.68 | ||||||||||
|
|
|
|||||||||||||||
| Granted |
285 | 13.36 | ||||||||||||||
| Exercised |
(70 | ) | 1.32 | |||||||||||||
| Forfeited |
(49 | ) | 8.29 | |||||||||||||
|
|
|
|||||||||||||||
| Outstanding at June 30, 2012 |
7,406 | $ | 4.48 | $ | 70,914 | 6.32 | ||||||||||
|
|
|
|||||||||||||||
| Vested and expected to vest at December 31, 2011 |
7,091 | $ | 4.04 | $ | 34,313 | 6.63 | ||||||||||
|
|
|
|
|
|
|
|
|
|||||||||
| Exercisable at December 31, 2011 |
4,018 | $ | 1.98 | $ | 27,029 | 5.07 | ||||||||||
|
|
|
|
|
|
|
|
|
|||||||||
F-21
Table of Contents
Peregrine Semiconductor Corporation
NOTES TO CONSOLIDATED FINANCIAL STATEMENTS—(Continued)
(in thousands, except per share amounts. Information as of June 30, 2012
and for the six months ended June 25, 2011 and June 30, 2012 is unaudited)
In February 2009, the Company’s board of directors approved a stock option modification reducing employees’ and directors’ stock option exercise prices to $1.76. No other terms were modified. Stock options to purchase a total of 1,049 shares of common stock were modified. The modification to the existing stock options resulted in approximately $450 incremental increase in the value of the stock options. The incremental value associated with the modification will be recognized over the life of the options.
As of December 25, 2010, December 31, 2011, and June 30, 2012 there were 12, 9 and 5 common shares outstanding of early stock option exercises subject to repurchase at the original exercise price, respectively. The related liability recorded was $41, $18, and $19 at December 25, 2010, December 31, 2011, and June 30, 2012, respectively, and is recorded as other long-term liabilities in the accompanying consolidated balance sheets.
The Company recognized stock-based compensation in the consolidated statements of operations as follows:
| Year Ended | Six Months Ended | |||||||||||||||
| December 25, 2010 |
December 31, 2011 |
June 25, 2011 |
June 30, 2012 |
|||||||||||||
| Cost of net revenue |
$ | 407 | $ | 431 | $ | 208 | $ | 271 | ||||||||
| Research and development |
556 | 762 | 332 | 567 | ||||||||||||
| Selling, general and administrative |
1,554 | 1,891 | 943 | 1,126 | ||||||||||||
|
|
|
|
|
|
|
|
|
|||||||||
| Total |
$ | 2,517 | $ | 3,084 | $ | 1,483 | $ | 1,964 | ||||||||
|
|
|
|
|
|
|
|
|
|||||||||
The total intrinsic value of stock options exercised was $1,836 and $757 for the years ended December 25, 2010 and December 31, 2011, and $451 and $698 for the six months ended June 25, 2011 and June 30, 2012, respectively. Upon exercise, the Company issues new shares of stock. As of December 31, 2011, the unrecognized estimated stock-based compensation related to nonvested stock options granted as of that date was $8,882, which is expected to be recognized over a weighted-average period of approximately 2.28 years. If there are any modifications or cancellations of the underlying unvested securities, the Company may be required to accelerate, increase or cancel any remaining unearned stock-based compensation expense. Future stock-based compensation expense and unearned stock-based compensation will increase to the extent that the Company grants additional equity awards or assumes unvested equity awards in connection with acquisitions.
The Company records equity instruments issued to non-employees as expense at their fair value over the related service period and periodically revalues the equity instruments as they vest. The amount was not material for any period presented.
F-22
Table of Contents
Peregrine Semiconductor Corporation
NOTES TO CONSOLIDATED FINANCIAL STATEMENTS—(Continued)
(in thousands, except per share amounts. Information as of June 30, 2012
and for the six months ended June 25, 2011 and June 30, 2012 is unaudited)
Shares Reserved for Future Issuance
The following common stock is reserved for future issuance at December 25, 2010, December 31, 2011, and June 30, 2012:
| December 25, 2010 |
December 31, 2011 |
June 30, 2012 |
||||||||||
| Conversion of preferred stock |
22,365 | 22,365 | 22,384 | |||||||||
| Preferred stock warrants |
205 | 205 | 124 | |||||||||
| Common stock warrants |
72 | 72 | 72 | |||||||||
| Stock awards issued and outstanding |
6,135 | 7,240 | 7,406 | |||||||||
| Authorized for grants under the 2004 Plan |
400 | 457 | 1,551 | |||||||||
|
|
|
|
|
|
|
|||||||
| 29,177 | 30,339 | 31,537 | ||||||||||
|
|
|
|
|
|
|
|||||||
5. Foundry Agreement
In June 2008, the Company completed the disposal of its subsidiary, Peregrine Semiconductor Australia (PSA), through a stock acquisition agreement (Stock Agreement) whereby the Company sold 100% of the stock of PSA to Silanna Foundries Pty. Ltd. (Silanna Foundries and its wafer manufacturing subsidiary are referred to together as Silanna Semiconductor). In conjunction with the Stock Agreement, the Company entered into a foundry services agreement (Foundry Agreement) with Silanna Semiconductor in June 2008. Along with the Foundry Agreement, a license agreement was entered into to allow for PSA to continue to produce UltraCMOS wafers through the term of the Foundry Agreement. The Company agreed to purchase a minimum of 7,200 production wafers and other services from Silanna Semiconductor totaling AUD $13,200 over a two-year period. The Foundry Agreement contained a purchase price greater than the fair market value of the production wafers. As a result, the Company accrued a loss on the inventory firm commitment totaling $5,975, which was included in cost of net revenue (product sales) during the year ended December 27, 2008. As of December 25, 2010, the remaining inventory firm commitment liability totaled $163. There was no remaining inventory firm commitment liability as of December 31, 2011 and June 30, 2012.
6. Income Taxes
For the six-month period ended June 30, 2012, the Company recorded income tax expense of $74. The income tax expense consists primarily of current foreign taxes.
Income (loss) before income tax consisted of the following for the years ended:
| December 25, 2010 |
December 31, 2011 |
|||||||
| Domestic |
$ | 3,797 | $ | (9,849 | ) | |||
| Foreign |
110 | 363 | ||||||
|
|
|
|
|
|||||
| Income (loss) before income taxes |
$ | 3,907 | $ | (9,486 | ) | |||
|
|
|
|
|
|||||
F-23
Table of Contents
Peregrine Semiconductor Corporation
NOTES TO CONSOLIDATED FINANCIAL STATEMENTS—(Continued)
(in thousands, except per share amounts. Information as of June 30, 2012
and for the six months ended June 25, 2011 and June 30, 2012 is unaudited)
The provision for income taxes is as follows for the years ended:
| December 25, 2010 |
December 31, 2011 |
|||||||
| Current (benefit) provision: |
||||||||
| Federal |
$ | 24 | $ | 20 | ||||
| State |
— | — | ||||||
| Foreign |
115 | 175 | ||||||
|
|
|
|
|
|||||
| Total current |
139 | 195 | ||||||
| Deferred (benefit) provision: |
||||||||
| Federal |
— | — | ||||||
| State |
— | — | ||||||
| Foreign |
8 | 1 | ||||||
|
|
|
|
|
|||||
| Total deferred |
8 | 1 | ||||||
|
|
|
|
|
|||||
| Total income tax provision |
$ | 147 | $ | 196 | ||||
|
|
|
|
|
|||||
A reconciliation of the federal statutory rate to the effective rate is as follows:
| December 25, 2010 |
December 31, 2011 |
|||||||
| Income tax provision (benefit) on earnings at federal statutory rate |
35.0 | % | (35.0 | )% | ||||
| State tax provision (benefit), net of federal benefit |
5.5 | (2.3 | ) | |||||
| Tax credits |
(21.4 | ) | (15.8 | ) | ||||
| Change in valuation allowance |
(21.5 | ) | 55.2 | |||||
| Stock-based compensation |
12.0 | 4.2 | ||||||
| Valuation of warrants |
(0.5 | ) | (0.1 | ) | ||||
| Nondeductible expenses and other permanent differences, net |
(5.2 | ) | (4.1 | ) | ||||
|
|
|
|
|
|||||
| Income tax provision |
3.9 | % | 2.1 | % | ||||
|
|
|
|
|
|||||
F-24
Table of Contents
Peregrine Semiconductor Corporation
NOTES TO CONSOLIDATED FINANCIAL STATEMENTS—(Continued)
(in thousands, except per share amounts. Information as of June 30, 2012
and for the six months ended June 25, 2011 and June 30, 2012 is unaudited)
The components of the Company’s deferred tax assets are summarized as follows:
| December 25, 2010 |
December 31, 2011 |
|||||||
| Deferred tax assets: |
||||||||
| Net operating loss carryforwards |
$ | 56,225 | $ | 60,180 | ||||
| Research tax credit carryforwards |
5,152 | 6,583 | ||||||
| Accrued expenses and reserves |
3,531 | 4,366 | ||||||
| Foreign deferred tax assets (liabilities) |
35 | 34 | ||||||
|
|
|
|
|
|||||
| Total deferred tax assets |
64,943 | 71,163 | ||||||
|
|
|
|
|
|||||
| Deferred tax liabilities: |
||||||||
| Depreciation |
(189 | ) | (1,237 | ) | ||||
|
|
|
|
|
|||||
| Total deferred tax liabilities |
(189 | ) | (1,237 | ) | ||||
|
|
|
|
|
|||||
| Less valuation allowance |
(64,719 | ) | (69,892 | ) | ||||
|
|
|
|
|
|||||
| Net deferred tax asset |
$ | 35 | $ | 34 | ||||
|
|
|
|
|
|||||
The valuation allowance has been established to offset domestic deferred tax assets, as realization of such assets is not considered to be more likely than not due to the Company’s accumulated loss history.
At December 31, 2011, the Company had U.S. federal and state net operating loss (NOL) carryforwards of approximately $156,610 and $105,632, respectively, after taking into consideration the impact of Internal Revenue Code section 382 as discussed below. The federal net loss carryforwards will expire between 2021 and 2029, unless previously utilized. The state net loss carryforwards will expire between 2015 and 2029, unless previously utilized.
The Company generated excess tax benefits of approximately $486 from the settlement of certain stock awards. The tax benefit will be recorded as a credit to additional paid-in capital in the year the deduction reduces income tax payable.
The Company had tax credit carryforwards of approximately $3,944 for federal and $5,736 for state purposes at December 31, 2011. The federal credits will begin to expire in 2024. The state research and development tax credit does not expire.
Pursuant to Sections 382 and 383 of the Internal Revenue Code (the Code), annual use of the Company’s NOL and research credit carryforwards may be limited in the event a cumulative change in ownership of 50% of certain stockholders occurs within a three year period. An ownership change may limit the amount of NOL and research credit carryforwards that can be utilized annually to offset future taxable income and tax, respectively. In general, an “ownership change” as defined by Section 382 of the Code results from a transaction or series of transactions over a three-year period resulting in an ownership change of more than 50 percentage points of the outstanding stock of a company by certain stockholders.
The Company completed a study to assess whether an ownership change has occurred since the Company’s formation through December 25, 2010. The Company incurred ownership changes on September 29, 2000, August 2, 2002, and on October 20, 2004. As a result of these changes, the Company expects the following tax attributes to expire: approximately $52,200 in federal NOL carryforwards, approximately $17,500 of state NOL carryforwards and approximately $3,000 of federal research tax credit carryforwards. These tax attributes have
F-25
Table of Contents
Peregrine Semiconductor Corporation
NOTES TO CONSOLIDATED FINANCIAL STATEMENTS—(Continued)
(in thousands, except per share amounts. Information as of June 30, 2012
and for the six months ended June 25, 2011 and June 30, 2012 is unaudited)
been excluded from deferred tax assets with a corresponding reduction of the valuation allowance. Future ownership changes may further limit the Company’s ability to utilize its remaining tax attributes.
The Company considers any operating earnings of foreign subsidiaries to be indefinitely invested outside of the U.S. No provision has been made for U.S. federal and state, or foreign taxes that may result from future remittances of undistributed earnings of foreign subsidiaries. Should the Company repatriate foreign earnings, it would adjust the income tax provision in the period in which the decision to repatriate earnings is made.
The following table summarizes the activity related to the Company’s unrecognized tax benefits:
| December 25, 2010 |
December 31, 2011 |
|||||||
| Balance at beginning of year |
$ | 1,689 | $ | 1,863 | ||||
| Increases (decreases) related to prior year tax positions |
87 | (5 | ) | |||||
| Increases related to current year tax positions |
87 | 177 | ||||||
| Expirations of the statute of limitations for the |
||||||||
| assessment of taxes |
— | — | ||||||
| Settlements |
— | — | ||||||
|
|
|
|
|
|||||
| Balance at end of year |
$ | 1,863 | $ | 2,035 | ||||
|
|
|
|
|
|||||
Approximately $261 of the total unrecognized tax benefits at December 25, 2010 and December 31, 2011 would reduce the Company’s annual effective tax rate if recognized, and the remainder would have no effect as long as the Company’s deferred tax assets remain subject to a valuation allowance.
It is reasonably possible that a decrease in the unrecognized tax benefits of approximately $200 will occur over the next 12 months.
Due to the NOL and credit carryforwards, the U.S. federal and state returns are open to examination by the Internal Revenue Service and state jurisdictions for years 1997 through 2011. The foreign income tax returns are open to examination for the years 2009 through 2011.
The Company’s policy is to recognize interest expense and penalties related to income tax matters as a component of income tax expense. There was approximately $77 and $97 accrued interest and penalties associated with uncertain tax positions as of December 25, 2010 and December 31, 2011, respectively.
7. Commitments and Contingencies
Leases
The Company leases operating facilities under operating lease agreements which expire in fiscal years 2014 and 2015. In July 2010, the Company amended the existing operating lease agreement for the facility in San Diego, California. The amendment included a lease term extension of the Company’s existing facility from August 1, 2012 until December 31, 2015. In addition, the Company leased additional office space in San Diego, CA from January 1, 2011 through December 31, 2015. Future minimum annual payments under the operating lease for fiscal 2012, 2013, 2014, and 2015 are approximately $921, $728, $771, and $813, respectively. In addition, the Company leases certain equipment and software under operating lease agreements which expire between 2012 and 2016. Total operating lease expense was $3,158 and $3,154 for the years ended December 25,
F-26
Table of Contents
Peregrine Semiconductor Corporation
NOTES TO CONSOLIDATED FINANCIAL STATEMENTS—(Continued)
(in thousands, except per share amounts. Information as of June 30, 2012
and for the six months ended June 25, 2011 and June 30, 2012 is unaudited)
2010 and December 31, 2011, respectively, and $1,587 and $1,701 for the six months ended June 25, 2011 and June 30, 2012, respectively.
The Company leases certain equipment under capital lease obligations. The Company entered into a software capital lease in November 2009 for a term of three years. The Company received the licenses and the lease began in January 2010. Future minimum annual payments under the capital lease is approximately $244 for fiscal 2012. Cost of assets under capital leases totaled $2,578 and $2,640 for fiscal years 2010 and 2011, respectively. Accumulated amortization on assets under capital leases totaled $862 and $1,309 for fiscal years 2010 and 2011, respectively. Amortization of assets recorded under capital leases is included with depreciation and amortization expense.
Annual future minimum obligations under operating leases and capital leases as of December 31, 2011, are as follows:
| Operating Leases | Capital Leases | |||||||
| Fiscal years: |
||||||||
| 2012 |
$ | 1,928 | $ | 555 | ||||
| 2013 |
1,130 | 138 | ||||||
| 2014 |
964 | 55 | ||||||
| 2015 |
973 | 12 | ||||||
|
|
|
|
|
|||||
| Total minimum lease payments |
$ | 4,995 | $ | 760 | ||||
|
|
|
|
|
|||||
| Less amount representing interest |
(51 | ) | ||||||
|
|
|
|||||||
| Present value of obligations under capital lease |
709 | |||||||
| Less current portion |
(520 | ) | ||||||
|
|
|
|||||||
| Long-term obligations under capital lease |
$ | 189 | ||||||
|
|
|
|||||||
In May 2012, the Company amended the existing operating lease agreement to lease additional office space in San Diego, CA. Additional future minimum annual payments under the operating lease for fiscal 2013, 2014, and 2015 are approximately $270, $282, and $294, respectively.
Long-term debt obligations
Long term debt obligations consisted of the following:
| December 25, 2010 |
December 31, 2011 |
June 30, 2012 |
||||||||||
| Line of credit |
$ | 3,249 | $ | 7,749 | $ | 10,749 | ||||||
| Notes payable |
2,438 | 1,618 | 1,192 | |||||||||
|
|
|
|
|
|
|
|||||||
| 5,687 | 9,367 | 11,941 | ||||||||||
| Less: Current portion of notes payable, including line of credit and inventory repurchase obligation |
(4,064 | ) | (8,610 | ) |
|
(11,631 |
) | |||||
|
|
|
|
|
|
|
|||||||
| Long-term portion of notes payable |
$ | 1,623 | $ | 757 | $ | 310 | ||||||
|
|
|
|
|
|
|
|||||||
In June 2010, the Company amended its existing loan and security agreement with a bank, which increased the line of credit availability to $10,000 in accounts receivable financing and to $3,000 in equipment financing available until December 31, 2010. The Company was obligated to pay interest at the rate of prime plus 0.50%,
F-27
Table of Contents
Peregrine Semiconductor Corporation
NOTES TO CONSOLIDATED FINANCIAL STATEMENTS—(Continued)
(in thousands, except per share amounts. Information as of June 30, 2012
and for the six months ended June 25, 2011 and June 30, 2012 is unaudited)
subject to an interest rate floor and ceiling of 3.75% and 7.50%, respectively, for the accounts receivable financing (3.75% at December 31, 2011). The interest is payable monthly, with the principal due at the maturity date, June 23, 2013. The Company was obligated to pay interest at a fixed rate of 5.75% for the equipment financing through March 31, 2011. The Company is obligated to pay interest at a fixed rate of 4.75% for the equipment financing from April 1, 2011 through the maturity date. Principal and interest is due in 36 equal monthly payments from the date of each draw. The agreement contains certain financial covenants, including a liquidity ratio and minimum tangible net worth, as well as restrictions on mergers, acquisitions, recapitalization, funded debt, dividends, loans to others, and the pledge of assets or corporate guarantees. The Company was in compliance with all covenants at December 25, 2010 and December 31, 2011.
In January 2012, the Company amended its existing loan and security agreement, which increased the maximum line of credit availability up to $20,000 in accounts receivable financing and to $4,000 in equipment financing available until December 31, 2012. In February 2012, the Company drew an additional $3,000 from the line of credit. The Company is obligated to pay interest at the rate of prime plus 0.50%, subject to an interest rate floor and ceiling of 3.75% and 7.50%, respectively, for the accounts receivable financing (4.50% at June 30, 2012). Interest is payable monthly with the principal due at the maturity date, December 30, 2014. The Company is obligated to pay interest at a fixed rate of 4.75% for the equipment financing. Principal and interest is due in 36 equal monthly payments from the date of each draw. At December 25, 2010, December 31, 2011, and June 30, 2012, the outstanding balance under the line of credit was $3,249, $7,749, and $10,749, respectively, and there was $6,321, $1,821, and $7,061 available, respectively. At December 25, 2010, December 31, 2011, and June 30, 2012, the outstanding balance under the equipment financing line was $2,438, $1,618, and $1,192, respectively, and there was $0 available as of December 25, 2010 and December 31, 2011. There was $4,000 available to the Company under the new equipment financing line as of June 30, 2012. The agreement contains certain financial covenants, including covenants relating to our required liquidity ratio, minimum tangible net worth, and minimum EBITDA. The Company was in compliance with all covenants at June 30, 2012.
In July 2006, the Company entered into a loan and security agreement with a venture debt firm to provide up to $10,000 in financing. The loan matured on May 31, 2010, and carried an interest rate of 12%. Interest only was payable for the first 12 months. Upon signing of the agreement, the Company drew down $5,000 and the remaining balance later during 2006. At December 26, 2009, there were no amounts available under the agreement. Amounts outstanding under the agreement were $1,423 at December 26, 2009. The Company repaid the entire remaining outstanding balance during the year ended December 25, 2010. At December 26, 2009, the Company was in compliance with all covenants. Additionally, in conjunction with establishing the loan, the Company issued a warrant for the purchase of shares of common stock (see Note 4).
In October 2007, the Company entered into a loan agreement with a supplier to fund manufacturing test equipment totaling $1,250. Principal and interest are payable in 36 monthly installments and carries an interest rate of 9.45%. In December 2008, the Company amended the loan agreement, which lowered the monthly installments and extended the expiration date to May 2013. In October 2009, the Company amended the loan agreement, which increased the monthly installments and decreased the expiration date to December 2010. Amounts outstanding under the agreement was $565 at December 26, 2009. The Company repaid the entire remaining outstanding balance during the year ended December 25, 2010.
In October 2009, the Company entered into an inventory financing agreement totaling $3,198 whereby the Company financed inventory on hand with a customer and has an obligation to repurchase the inventory over the term of the arrangement. The agreement expired in October 2010 at which time the outstanding balance was repaid. The effective interest rate was 9.50% and the outstanding amount due was $3,198 and $0 at December 26, 2009 and December 25, 2010, respectively.
F-28
Table of Contents
Peregrine Semiconductor Corporation
NOTES TO CONSOLIDATED FINANCIAL STATEMENTS—(Continued)
(in thousands, except per share amounts. Information as of June 30, 2012
and for the six months ended June 25, 2011 and June 30, 2012 is unaudited)
Principal maturities of notes payable as of June 30, 2012 are as follows:
| Six months ending December 29, 2012 |
$ | 435 | ||
| Year ending December 28, 2013 |
757 | |||
|
|
|
|||
| $ | 1,192 | |||
|
|
|
As of December 31, 2011, the Company maintained outstanding standby letters of credit totaling $380 as collateral to a software lease agreement. The total amount has been collateralized by the Company’s line of credit.
Commitments
In June 2010, the Company signed a new foundry agreement with Silanna Semiconductor. This new foundry agreement obligates the Company to purchase $5,400 of wafer services over a period of 24 months beginning July 1, 2010. As of December 31, 2011, the Company’s future purchase obligation to Silanna Semiconductor is $522. The Company does not have any future purchase obligation under the foundry agreement with Silanna Semiconductor as of June 30, 2012. In addition, the Company has other open non-cancelable inventory purchase commitments of $21,473 as of December 31, 2011. Inventory purchase obligations represent purchase commitments for fixed prices and quantities of wafers, assembly, and test services. We expect to receive and pay for the majority of these materials and services during the next twelve months.
Contingencies
In September 2008, the Company received a Commodity Jurisdiction, or CJ, ruling from the U.S. Department of State that determined certain of the Company’s products sold in the aerospace and defense markets are subject to The International Traffic in Arms Regulations, or ITAR, rather than the Export Administration Regulations, or EAR. Given this ruling, a number of past product shipments that the Company believed were subject to the EAR were exported without the required State Department ITAR license. The Company also transferred ITAR technical data to one foreign person employee with the belief such data was subject to the EAR rather than the ITAR. In December 2008, the Company submitted a voluntary disclosure to the U.S. Department of State to report the unlicensed exports. The U.S. Department of State encourages voluntary disclosures and generally affords parties mitigating credit under such circumstances. The Company has not received a response from the U.S. Department of State. The Company could be subject to continued investigation and potential regulatory consequences related to these violations ranging from a no-action letter, government oversight of facilities and export transactions, monetary penalties, and in certain cases, debarment from government contracting, denial of export privileges, and criminal penalties. No claims have been asserted and no amounts have been accrued for this contingency in the consolidated financial statements.
From time to time, the Company is subject to various claims and suits arising in the ordinary course of business, including commercial, employment and environmental matters. The Company does not expect that the resolution of these matters, or the matter described in the preceding paragraph, will have a material adverse effect on its consolidated financial position or results of operations.
F-29
Table of Contents
Peregrine Semiconductor Corporation
NOTES TO CONSOLIDATED FINANCIAL STATEMENTS—(Continued)
(in thousands, except per share amounts. Information as of June 30, 2012
and for the six months ended June 25, 2011 and June 30, 2012 is unaudited)
8. Employee Benefits
The Company has a defined contribution 401(k) plan for employees who are at least 21 years of age. Under the terms of the plan, employees may make voluntary contributions as a percent of compensation, but not in excess of the maximum amounts allowed under the Internal Revenue Code. The Company’s contributions to the plan are discretionary and no contributions were made by the Company for any of the periods presented.
9. Concentrations and Geographic Information
The Company sells a majority of its products throughout North America, Asia and Europe. The Company makes periodic evaluations of the credit worthiness of its customers and does not require collateral for credit sales. The Company recognizes an allowance for doubtful accounts relating to accounts receivable for amounts deemed uncollectible. The Company considers customer specific issues, such as financial stability and ability to pay, when determining collectability of accounts receivable and appropriate allowances to record. The Company’s allowance for doubtful accounts was $100 as of December 25, 2010, December 31, 2011, and June 30, 2012.
Customers that exceeded 10% of total net revenue were as follows:
| Year Ended | Six Months Ended | |||||||||||||||
| December 25, 2010 |
December 31, 2011 |
June 25, 2011 |
June 30, 2012 |
|||||||||||||
| Macnica |
33 | % | 48 | % | 35 | % | 66 | % | ||||||||
| Richardson |
17 | % | 16 | % | 19 | % | 14 | % | ||||||||
Customers whose balance represented greater than 10% of accounts receivable were as follows:
| December 25, 2010 |
December 31, 2011 |
June 30, 2012 |
||||||||||
| Macnica |
26 | % | 59 | % | 57 | % | ||||||
| Richardson |
22 | % | * | * | ||||||||
| Mini-Circuits |
10 | % | * | * | ||||||||
| * | Less than 10% of accounts receivable for the respective period end |
Net revenue is allocated to the geographic region where the customer, or its business unit that makes the purchase is geographically based, or where the services were provided. Net revenue by geographic region was as follows:
| Year Ended | Six Months Ended | |||||||||||||||||||||||||||||||
| December 25, 2010 | December 31, 2011 | June 25, 2011 | June 30, 2012 | |||||||||||||||||||||||||||||
| United States |
$ | 41,794 | 46 | % | $ | 31,921 | 30 | % | $ | 17,998 | 39 | % | $ | 16,403 | 20 | % | ||||||||||||||||
| Japan |
29,917 | 33 | % | 52,062 | 48 | % | 15,769 | 34 | % | 52,630 | 66 | % | ||||||||||||||||||||
| Germany |
5,954 | 7 | % | 3,510 | 3 | % | 1,582 | 3 | % | 1,414 | 2 | % | ||||||||||||||||||||
| All others |
13,406 | 14 | % | 20,278 | 19 | % | 10,380 | 24 | % | 9,887 | 12 | % | ||||||||||||||||||||
|
|
|
|
|
|
|
|
|
|
|
|
|
|
|
|
|
|||||||||||||||||
| $ | 91,071 | 100 | % | $ | 107,771 | 100 | % | $ | 45,729 | 100 | % | $ | 80,334 | 100 | % | |||||||||||||||||
|
|
|
|
|
|
|
|
|
|
|
|
|
|
|
|
|
|||||||||||||||||
F-30
Table of Contents
Peregrine Semiconductor Corporation
NOTES TO CONSOLIDATED FINANCIAL STATEMENTS—(Continued)
(in thousands, except per share amounts. Information as of June 30, 2012
and for the six months ended June 25, 2011 and June 30, 2012 is unaudited)
As of December 25, 2010, December 31, 2011, and June 30, 2012, substantially all of the Company’s long-lived tangible assets are located in the U.S.
In addition, four vendors supplied 97% and 99% of the Company’s raw material for the years ended December 25, 2010 and December 31, 2011, respectively, and 98% and 99% for the six months ended June 25, 2011 and June 30, 2012, respectively.
10. Segment Information
The Company operates in one segment related to the design, manufacturing and marketing of high performance RFICs for the aerospace and defense, broadband, industrial, mobile wireless device, test and measurement equipment, and wireless infrastructure markets. The Company’s chief operating decision-maker is its chief executive officer, who reviews operating results on an aggregate basis and manages the Company’s resources and operations as a single operating segment.
11. Subsequent Events
In February 2012, the Company filed a complaint and lawsuit alleging the infringement of certain patents relating to RFICs and switching technology by RF Micro Devices, Inc. and Motorola Mobility, Inc. The Company amended these actions in May 2012 to add HTC Corporation. The Company is seeking, among other remedies, an exclusion order preventing the importation and sales of infringing products in the U.S., damages, and to permanently enjoin the defendants from further infringement. The lawsuit is subject to uncertainties inherent in the litigation process. Based on the information available to the Company, management is not able to estimate the potential effect of this litigation on the Company’s consolidated financial statements.
In March 2012, the Company amended its certificate of incorporation to increase the authorized shares of common stock to 35,102.
In March 2012, the Company entered into a supply and prepayment agreement with Murata Manufacturing Company, Ltd. (Murata). The agreement is for an initial term of 18 months. Under the terms of the agreement, Murata agreed to prepay on its purchase orders placed through a third party distributor and to pay the Company a total deposit of $14,000 between March to July 2012. The Company will repay the deposit at a rate based on the number of RFICs purchased by Murata over the four quarters starting from the fourth quarter of fiscal 2012 of up to $14,000. As of June 30, 2012 the Company had received $12,000 in deposits under the supply and prepayment agreement with Murata, of which $8,000 is included in customer deposits and $4,000 in other long-term liabilities. In addition, the Company received prepayments on purchase orders from a third party distributor of $31,058 as of June 30, 2012, which is included in customer deposits. During the six months ended June 30, 2012, the Company paid $4,000 in deposits to suppliers to support production levels. $2,825 and $1,175 is included in prepaids and other current assets and other assets, respectively.
In April 2012, the Company’s Board of Directors approved a 1-for-7.34 reverse stock split of the Company’s issued and outstanding shares of common stock and preferred stock. The accompanying consolidated financial statements and notes to the consolidated financial statements give retrospective effect to the reverse stock split for all periods presented.
F-31
Table of Contents

Table of Contents
shares
Common Stock
| Deutsche Bank Securities | J.P. Morgan |
| RBC Capital Markets | Needham & Company | Oppenheimer & Co. | Pacific Crest Securities |
, 2012
Until , , U.S. federal securities laws may require all dealers that effect transactions in our common stock, whether or not participating in this offering, to deliver a prospectus. This is in addition to the dealers’ obligation to deliver a prospectus when acting as underwriters and with respect to their unsold allotments or subscriptions.
Table of Contents
PART II
INFORMATION NOT REQUIRED IN PROSPECTUS.
| Item 13. | Other Expenses of Issuance and Distribution. |
The following table presents the costs and expenses, other than underwriting discounts and commissions, payable in connection with the sale of common stock being registered. All amounts are estimates except the SEC registration fee, the FINRA filing fee, and the Nasdaq listing fee. Except as otherwise noted, all the expenses below will be paid by us.
| SEC registration fee |
$ | 7,268 | ||
| FINRA filing fee |
10,500 | |||
| Listing fee |
150,000 | |||
| Printing and engraving expenses |
520,000 | |||
| Legal fees and expenses |
1,750,000 | |||
| Accounting fees and expenses |
1,640,000 | |||
| Blue sky fees and expenses |
15,000 | |||
| Custodian and transfer agent fees |
4,850 | |||
| Miscellaneous fees and expenses |
125,000 | |||
|
|
|
|||
| Total |
$ | 4,222,618 | ||
|
|
|
| Item 14. | Indemnification of Directors and Officers. |
Our amended and restated certificate of incorporation and amended and restated bylaws contain provisions relating to the limitation of liability and indemnification of directors and officers. The amended and restated certificate of incorporation provides that our directors will not be personally liable to us or our stockholders for monetary damages for any breach of fiduciary duty as a director, except for liability:
| • | for any breach of the director’s duty of loyalty to us or our stockholders; |
| • | for acts or omissions not in good faith or that involve intentional misconduct or a knowing violation of law; |
| • | in respect of unlawful payments of dividends or unlawful stock repurchases or redemptions as provided in Section 174 of the Delaware General Corporation Law; or |
| • | for any transaction from which the director derives any improper personal benefit. |
Our amended and restated certificate of incorporation also provides that if Delaware law is amended after the approval by our stockholders of the certificate of incorporation to authorize corporate action further eliminating or limiting the personal liability of directors, then the liability of our directors will be eliminated or limited to the fullest extent permitted by Delaware law.
Our amended and restated bylaws provide that we will indemnify our directors and officers to the fullest extent permitted by Delaware law, as it now exists or may in the future be amended, against all expenses and liabilities reasonably incurred in connection with their service for or on our behalf. Our amended and restated bylaws provide that we shall advance the expenses incurred by a director or officer in advance of the final disposition of an action or proceeding, and permit us to secure insurance on behalf of any director, officer, employee, or other enterprise agent for any liability arising out of his or her action in that capacity, whether or not Delaware law would otherwise permit indemnification.
We have entered into indemnification agreements with each of our directors and executive officers, and certain other key employees, a form of which is attached as Exhibit 10.1. The form of agreement provides that
II-1
Table of Contents
we will indemnify each of our directors, executive officers, and such other key employees against any and all expenses incurred by that director, executive officer, or other key employee because of his or her status as one of our directors, executive officers, or other key employees, to the fullest extent permitted by Delaware law, our amended and restated certificate of incorporation, and our amended and restated bylaws. In addition, the form agreement provides that, to the fullest extent permitted by Delaware law, we will advance all expenses incurred by our directors, executive officers, and other key employees in connection with a legal proceeding.
Reference is made to Section 8 of the underwriting agreement contained in Exhibit 1.1 to this registration statement, indemnifying our directors and officers against limited liabilities. In addition, Section 1.10 of our amended and restated investors’ rights agreement contained in Exhibit 4.3 to this registration statement provides for indemnification of certain of our stockholders against liabilities described in our amended and restated investors’ rights agreement.
| Item 15. | Recent Sales of Unregistered Securities. |
In the three years preceding the filing of this registration statement, we have issued the following securities that were not registered under the Securities Act (all share amounts reflect a 1-for-7.34 reverse stock split of our outstanding capital stock prior to the completion of this offering):
(1) Between January 1, 2009 and June 30, 2012, we sold and issued to our employees and service providers an aggregate of 618,820 shares of our common stock pursuant to option exercises under our 1996 Stock Plan or our 2004 Stock Plan at prices ranging from $0.73 to $9.76 per share for an aggregate purchase price of $954,042.
(2) Between January 1, 2009 and June 30, 2012, we granted to our employees and service providers options to purchase an aggregate of 4,982,605 shares of our common stock under our 2004 Stock Plan at prices ranging from $1.76 to $14.02 per share for an aggregate purchase price of $30,893,504.
(3) Between September 2009 and October 2009, we issued 70,612 shares of Series C1 convertible preferred stock to five accredited institutional investors pursuant to the exercise of warrants with an aggregate exercise price of $406,189.
(4) On December 24, 2010, we issued 4,762 shares of Series C-1 Preferred Stock to one institutional investor solely in exchange for the cancellation of a warrant to purchase 10,479 shares of Series C-1 Preferred Stock issued to such investor in 2005.
(5) On May 2, 2012, we issued 18,836 shares of Series D-1 Preferred Stock to one institutional investor solely in exchange for the exercise of a warrant to purchase 80,194 shares of Series D-1 Preferred Stock issued to such investor in 2007.
The sale of securities described in Items 15(1) and (2) were deemed to be exempt from registration under the Securities Act in reliance upon Section 4(2) of the Securities Act or Rule 701 promulgated under the Securities Act. The sale of securities described in Items 15(3)-(4) were deemed to be exempt from registration under the Securities Act in reliance upon Section 4(2) of the Securities Act or Regulation D promulgated thereunder as transactions by an issuer not involving any public offering. The recipients of securities in each transaction represented their intentions to acquire the securities for investment only and not with a view to or for sale in connection with any distribution and appropriate legends were affixed to the share certificates issued in these transactions. All recipients had adequate access, through their relationships with us, to information about us.
II-2
Table of Contents
| Item 16. | Exhibits and Financial Statement Schedules. |
(a) Exhibits
| Exhibit No. |
Description | |
| 1.1(*) | Form of Underwriting Agreement. | |
| 3.1(1) | Restated Certificate of Incorporation, as amended. | |
| 3.2(1) | Form of Amended and Restated Certificate of Incorporation to be effective upon completion of this offering. | |
| 3.3(1) | Bylaws. | |
| 3.4(1) | Form of Amended and Restated Bylaws to be effective upon completion of this offering. | |
| 3.5(1) | Certificate of Amendment to the Restated Certificate of Incorporation, as amended. | |
| 4.1 | Reference is made to Exhibits 3.1, 3.2, 3.3, and 3.4. | |
| 4.3(1) | Seventh Amended and Restated Investor Rights Agreement, dated August 17, 2006, by and among the Registrant, certain stockholders, and the investors listed on the signature pages thereto. | |
| 4.4(1) | Amended and Restated Warrant to Purchase Stock originally issued July 6, 2006 to Escalate Capital I, L.P. | |
| 4.5(1) | Warrant to Purchase Stock issued June 18, 2003 to Silicon Valley Bank. | |
| 4.6(1) | Amendment to Warrant Agreement, dated April 2008, between SVB Financial Group and the Registrant. | |
| 5.1(*) | Opinion of Gunderson Dettmer Stough Villeneuve Franklin & Hachigian, LLP. | |
| 10.1†(1) | Form of Indemnification Agreement between the Registrant and each of its directors and executive officers. | |
| 10.2†(1) | Peregrine Semiconductor Corporation 1996 Stock Plan. | |
| 10.3†(1) | Form of 1996 Stock Plan Stock Option Agreement. | |
| 10.4†(1) | Peregrine Semiconductor Corporation 2004 Stock Plan. | |
| 10.5†(1) | Form of 2004 Stock Plan Stock Option Agreement. | |
| 10.6†(1) | 2012 Equity Incentive Plan and forms of agreements thereunder. | |
| 10.7†(1) | 2012 Employee Stock Purchase Plan. | |
| 10.8†(1) | 2012 Executive Incentive Bonus Plan. | |
| 10.9(1) | Industrial Lease, dated April 20, 2000, between The Irvine Company and Continuous Computing Corporation. | |
| 10.10(1) | Consent to Assignment and Amendment to Lease dated March 19, 2007. | |
| 10.11(1) | First Amendment to Lease, dated August 23, 2005, between The Irvine Company and Continuous Computing Corporation. | |
| 10.12(1) | Second Amendment to Lease dated June 27, 2007. | |
| 10.13(1) | Mutual Assignment of Lease Agreement, dated March 1, 2007, between Continuous Computing Corporation and the Registrant. | |
| 10.14(1) | Third Amendment to Lease, dated August 6, 2010, between The Irvine Company and the Registrant. | |
II-3
Table of Contents
| Exhibit No. |
Description | |
| 10.15(1) | Distributor Agreement, dated December 23, 2010, between Richardson Electronics, Ltd. and the Registrant. | |
| 10.16(1) | Distribution Agreement, dated June 30, 2008, between Clavis (a division of Macnica, Inc.) and the Registrant. | |
| 10.17(1) | Addendum I to Distributor Agreement, dated June 30, 2010, between Clavis (a division of Macnica, Inc.) and the Registrant. | |
| 10.18(1) | Second Amended and Restated Loan and Security Agreement, dated June 23, 2010, between Silicon Valley Bank and the Registrant. | |
| 10.19†(1) | Management Retention Agreement, dated February 19, 2004, between James S. Cable, Ph.D. and the Registrant, as amended. | |
| 10.20†(1) | Letter Agreement, dated January 22, 2009, between Jay C. Biskupski and the Registrant. | |
| 10.21†(1) | Management Retention and Severance Agreement, dated February 9, 2009, between Jay C. Biskupski and the Registrant, as amended. | |
| 10.22†(1) | Consultant Agreement, dated January 15, 2009, between Jeffrey K. Belk and the Registrant, as amended. | |
| 10.23†(1) | Letter Agreement, dated April 26, 2010, between David R. Shepard and the Registrant. | |
| 10.24†(1) | Letter Agreement, dated April 26, 2012, between James S. Cable, Ph.D and the Registrant. | |
| 10.25†(1) | Letter Agreement dated April 26, 2012 between Jay C. Biskupski and the Registrant. | |
| 10.26(1) | First Amendment to Second Amended and Restated Loan and Security Agreement, dated April 22, 2011, between Silicon Valley Bank and the Registrant. | |
| 10.27(1) | Second Amendment to Second Amended and Restated Loan and Security Agreement, dated December 30, 2011, between Silicon Valley Bank and the Registrant. | |
| 10.28#(1) | Supply and Prepayment Agreement, dated March 23, 2012, between the Registrant and Murata Manufacturing Company, Ltd. | |
| 21.1(1) | List of subsidiaries. | |
| 23.1 | Consent of Independent Registered Public Accounting Firm. | |
| 23.2(*) | Consent of Gunderson Dettmer Stough Villeneuve Franklin & Hachigian, LLP (contained in Exhibit 5.1). | |
| 23.3 | Consent of Frost & Sullivan. | |
| 24.1(1) | Power of Attorney (contained in the signature page to this registration statement). | |
| (*) | To be filed by amendment. |
| † | Indicates a management contract or compensatory plan. |
| (1) | Previously filed. |
| # | Registrant has omitted portions of the referenced exhibit pursuant to a request for confidential treatment under Rule 406 promulgated under the Securities Act. |
(b) Financial Statement Schedules
All schedules have been omitted because the information required to be presented in them is not applicable or is shown in the consolidated financial statements or related notes.
II-4
Table of Contents
| Item 17. | Undertakings. |
The undersigned registrant hereby undertakes to provide to the underwriter at the closing specified in the underwriting agreements certificates in such denominations and registered in such names as required by the underwriter to permit prompt delivery to each purchaser.
Insofar as indemnification for liabilities arising under the Securities Act of 1933 may be permitted to directors, officers and controlling persons of the registrant pursuant to the foregoing provisions, or otherwise, the registrant has been advised that in the opinion of the Securities and Exchange Commission such indemnification is against public policy as expressed in the Act and is, therefore, unenforceable. In the event that a claim for indemnification against such liabilities (other than the payment by the registrant of expenses incurred or paid by a director, officer or controlling person of the registrant in the successful defense of any action, suit or proceeding) is asserted by such director, officer or controlling person in connection with the securities being registered, the registrant will, unless in the opinion of its counsel the matter has been settled by controlling precedent, submit to a court of appropriate jurisdiction the question whether such indemnification by it is against public policy as expressed in the Act and will be governed by the final adjudication of such issue.
The undersigned registrant hereby undertakes that:
| 1. | For purposes of determining any liability under the Securities Act of 1933, the information omitted from the form of prospectus filed as part of this registration statement in reliance upon Rule 430A and contained in a form of prospectus filed by the registrant pursuant to Rule 424(b)(1) or (4) or 497(h) under the Securities Act shall be deemed to be part of this registration statement as of the time it was declared effective. |
| 2. | For the purpose of determining any liability under the Securities Act of 1933, each post-effective amendment that contains a form of prospectus shall be deemed to be a new registration statement relating to the securities offered therein, and the offering of such securities at that time shall be deemed to be the initial bona fide offering thereof. |
II-5
Table of Contents
SIGNATURES
Pursuant to the requirements of the Securities Act of 1933, the registrant has duly caused this Amendment No. 8 to the Registration Statement to be signed on its behalf by the undersigned, thereunto duly authorized, in the City of San Diego, State of California, on this 23rd day of July, 2012.
| PEREGRINE SEMICONDUCTOR CORPORATION | ||
| By: | /s/ JAY BISKUPSKI | |
| Jay Biskupski Chief Financial Officer | ||
II-6
Table of Contents
Pursuant to the requirements of the Securities Act of 1933, as amended, this Amendment No. 8 to the Registration Statement has been signed by the following persons in the capacities and on the dates indicated:
| Signature |
Title |
Date | ||
| * James S. Cable, Ph.D. |
Chief Executive Officer, President, acting Chief Technology Officer and Chairman (Principal Executive Officer) | July 23, 2012 | ||
| /s/ JAY BISKUPSKI Jay Biskupski |
Chief Financial Officer (Principal Financial and Accounting Officer) |
July 23, 2012 | ||
|
* Paul D’Addario |
Director |
July 23, 2012 | ||
|
* John H. Allen |
Director |
July 23, 2012 | ||
|
* Jeffrey K. Belk |
Director |
July 23, 2012 | ||
|
* Gary A. Monetti |
Director |
July 23, 2012 | ||
|
* Robert Pavey |
Director |
July 23, 2012 | ||
|
* Carl Schlachte |
Director |
July 23, 2012 | ||
|
* Elton B. Sherwin |
Director |
July 23, 2012 | ||
|
* Anthony S. Thornley |
Director |
July 23, 2012 | ||
| *By: | /S/ JAY BISKUPSKI | |
| Jay Biskupski | ||
| Attorney-in-fact | ||
II-7
Table of Contents
INDEX TO EXHIBITS
| Exhibit No. |
Description | |
| 1.1(*) | Form of Underwriting Agreement. | |
| 3.1(1) | Restated Certificate of Incorporation, as amended. | |
| 3.2(1) | Form of Amended and Restated Certificate of Incorporation to be effective upon completion of this offering. | |
| 3.3(1) | Bylaws. | |
| 3.4(1) | Form of Amended and Restated Bylaws to be effective upon completion of this offering. | |
| 3.5(1) | Certificate of Amendment to the Restated Certificate of Incorporation, as amended. | |
| 4.1 | Reference is made to Exhibits 3.1, 3.2, 3.3, and 3.4. | |
| 4.3(1) | Seventh Amended and Restated Investor Rights Agreement, dated August 17, 2006, by and among the Registrant, certain stockholders, and the investors listed on the signature pages thereto. | |
| 4.4(1) | Amended and Restated Warrant to Purchase Stock originally issued July 6, 2006 to Escalate Capital I, L.P. | |
| 4.5(1) | Warrant to Purchase Stock issued June 18, 2003 to Silicon Valley Bank. | |
| 4.6(1) | Amendment to Warrant Agreement, dated April 2008, between SVB Financial Group and the Registrant. | |
| 5.1(*) | Opinion of Gunderson Dettmer Stough Villeneuve Franklin & Hachigian, LLP. | |
| 10.1†(1) | Form of Indemnification Agreement between the Registrant and each of its directors and executive officers. | |
| 10.2†(1) | Peregrine Semiconductor Corporation 1996 Stock Plan. | |
| 10.3†(1) | Form of 1996 Stock Plan Stock Option Agreement. | |
| 10.4†(1) | Peregrine Semiconductor Corporation 2004 Stock Plan. | |
| 10.5†(1) | Form of 2004 Stock Plan Stock Option Agreement. | |
| 10.9(1) | Industrial Lease, dated April 20, 2000, between The Irvine Company and Continuous Computing Corporation. | |
| 10.10(1) | Consent to Assignment and Amendment to Lease dated March 19, 2007. | |
| 10.11(1) | First Amendment to Lease, dated August 23, 2005, between The Irvine Company and Continuous Computing Corporation. | |
| 10.12(1) | Second Amendment to Lease dated June 27, 2007. | |
| 10.13(1) | Mutual Assignment of Lease Agreement, dated March 1, 2007, between Continuous Computing Corporation and the Registrant. | |
| 10.14(1) | Third Amendment to Lease, dated August 6, 2010, between The Irvine Company and the Registrant. | |
Table of Contents
| Exhibit No. |
Description | |
| 10.15(1) | Distributor Agreement, dated December 23, 2010, between Richardson Electronics, Ltd. and the Registrant. | |
| 10.16(1) | Distribution Agreement, dated June 30, 2008, between Clavis (a division of Macnica, Inc.) and the Registrant. | |
| 10.17(1) | Addendum I to Distribution Agreement, dated June 30, 2010, between Clavis (a division of Macnica, Inc.) and the Registrant. | |
| 10.18(1) | Second Amended and Restated Loan and Security Agreement, dated June 23, 2010, between Silicon Valley Bank and the Registrant. | |
| 10.19†(1) | Management Retention Agreement, dated February 19, 2004, between James S. Cable, Ph.D. and the Registrant, as amended. | |
| 10.20†(1) | Letter Agreement, dated January 22, 2009, between Jay C. Biskupski and the Registrant. | |
| 10.21†(1) | Management Retention and Severance Agreement, dated February 9, 2009, between Jay C. Biskupski and the Registrant, as amended. | |
| 10.22†(1) | Consultant Agreement, dated January 15, 2009, between Jeffrey K. Belk and the Registrant, as amended. | |
| 10.23†(1) | Letter Agreement, dated April 26, 2010, between David R. Shepard and the Registrant. | |
| 10.24†(1) | Letter Agreement, dated April 26, 2012, between James S. Cable, Ph.D. and the Registrant. | |
| 10.25†(1) | Letter Agreement, dated April 26, 2012, between Jay C. Biskupski and the Registrant. | |
| 10.26(1) | First Amendment to Second Amended and Restated Loan and Security Agreement, dated April 22, 2011, between Silicon Valley Bank and the Registrant. | |
| 10.27(1) | Second Amendment to Second Amended and Restated Loan and Security Agreement, dated December 30, 2011, between Silicon Valley Bank and the Registrant. | |
| 10.28#(1) | Supply and Prepayment Agreement, dated March 23, 2012, between the Registrant and Murata Manufacturing Company, Ltd. | |
| 21.1(1) | List of subsidiaries. | |
| 23.1 | Consent of Independent Registered Public Accounting Firm. | |
| 23.2(*) | Consent of Gunderson Dettmer Stough Villeneuve Franklin & Hachigian, LLP (contained in Exhibit 5.1). | |
| 23.3 | Consent of Frost & Sullivan. | |
| 24.1(1) | Power of Attorney (contained in the signature page to this registration statement). | |
| (*) | To be filed by amendment. |
| † | Indicates a management contract or compensatory plan. |
| (1) | Previously filed. |
| # | Registrant has omitted portions of the referenced exhibit pursuant to a request for confidential treatment under Rule 406 promulgated under the Securities Act. |