Attached files
| file | filename |
|---|---|
| EX-2.1 - EX-2.1 - NRG ENERGY, INC. | a12-16819_1ex2d1.htm |
| EX-99.1 - EX-99.1 - NRG ENERGY, INC. | a12-16819_1ex99d1.htm |
| 8-K - 8-K - NRG ENERGY, INC. | a12-16819_18k.htm |
Exhibit 99.2
|
|
Creating the Foundation for the Leading 21st Century Competitive Energy Provider NRG Energy |
|
|
Forward Looking Statements In addition to historical information, the information presented in this communication includes forward-looking statements within the meaning of Section 27A of the Securities Act of 1933 and Section 21E of the Exchange Act. These statements involve estimates, expectations, projections, goals, assumptions, known and unknown risks and uncertainties and can typically be identified by terminology such as “may,” “will,” “should,” “could,” “objective,” “projection,” “forecast,” “goal,” “guidance,” “outlook,” “expect,” “intend,” “seek,” “plan,” “think,” “anticipate,” “estimate,” “predict,” “target,” “potential” or “continue” or the negative of these terms or other comparable terminology. Such forward-looking statements include, but are not limited to, statements about the anticipated benefits of the proposed transaction between NRG and GenOn, each party’s and the combined company’s future revenues, income, indebtedness, capital structure, plans, expectations, objectives, projected financial performance and/or business results and other future events, each party’s views of economic and market conditions, and the expected timing of the completion of the proposed transaction. Forward-looking statements are not a guarantee of future performance and actual events or results may differ materially from any forward-looking statement as result of various risks and uncertainties, including, but not limited to, those relating to: the ability to satisfy the conditions to the proposed transaction between NRG and GenOn, the ability to successfully complete the proposed transaction (including any financing arrangements in connection therewith) in accordance with its terms and in accordance with expected schedule, the ability to obtain stockholder, antitrust, regulatory or other approvals for the proposed transaction, or an inability to obtain them on the terms proposed or on the anticipated schedule, diversion of management attention on transaction-related issues, impact of the transaction on relationships with customers, suppliers and employees, the ability to finance the combined business post-closing and the terms on which such financing may be available, the financial performance of the combined company following completion of the proposed transaction, the ability to successfully integrate the businesses of NRG and GenOn, the ability to realize anticipated benefits of the proposed transaction (including expected cost savings and other synergies) or the risk that anticipated benefits may take longer to realize than expected, legislative, regulatory and/or market developments, the outcome of pending or threatened lawsuits, regulatory or tax proceedings or investigations, the effects of competition or regulatory intervention, financial and economic market conditions, access to capital, the timing and extent of changes in law and regulation (including environmental), commodity prices, prevailing demand and market prices for electricity, capacity, fuel and emissions allowances, weather conditions, operational constraints or outages, fuel supply or transmission issues, hedging ineffectiveness. Additional information concerning other risk factors is contained in NRG's and GenOn's most recently filed Annual Reports on Form 10-K, subsequent Quarterly Reports on Form 10-Q, recent Current Reports on Form 8-K, and other SEC filings. Many of these risks, uncertainties and assumptions are beyond NRG's or GenOn's ability to control or predict. Because of these risks, uncertainties and assumptions, you should not place undue reliance on these forward-looking statements. Furthermore, forward-looking statements speak only as of the date they are made, and neither NRG nor GenOn undertakes any obligation to update publicly or revise any forward-looking statements to reflect events or circumstances that may arise after the date of this communication. All subsequent written and oral forward-looking statements concerning NRG, GenOn, the proposed transaction, the combined company or other matters and attributable to NRG or GenOn or any person acting on their behalf are expressly qualified in their entirety by the cautionary statements above. Safe Harbor |
|
|
Additional Information And Where To Find It This communication does not constitute an offer to sell or the solicitation of an offer to buy any securities or a solicitation of any vote or approval, nor shall there be any sale of securities in any jurisdiction in which such offer, solicitation or sale would be unlawful prior to registration or qualification under the securities laws of any such jurisdiction. The proposed business combination transaction between NRG and GenOn will be submitted to the respective stockholders of NRG and GenOn for their consideration. NRG will file with the Securities and Exchange Commission (“SEC”) a registration statement on Form S-4 that will include a joint proxy statement of NRG and GenOn that also constitutes a prospectus of NRG. NRG and GenOn will mail the joint proxy statement/prospectus to their respective stockholders. NRG and GenOn also plan to file other documents with the SEC regarding the proposed transaction. This communication is not a substitute for any prospectus, proxy statement or any other document which NRG or GenOn may file with the SEC in connection with the proposed transaction. INVESTORS AND SECURITY HOLDERS OF GENON AND NRG ARE URGED TO READ THE JOINT PROXY STATEMENT/PROSPECTUS AND ANY OTHER RELEVANT DOCUMENTS THAT WILL BE FILED WITH THE SEC CAREFULLY AND IN THEIR ENTIRETY WHEN THEY BECOME AVAILABLE BECAUSE THEY WILL CONTAIN IMPORTANT INFORMATION ABOUT THE PROPOSED TRANSACTION. Investors and stockholders will be able to obtain free copies of the joint proxy statement/prospectus and other documents containing important information about NRG and GenOn, once such documents are filed with the SEC, through the website maintained by the SEC at www.sec.gov. NRG and GenOn make available free of charge at www.nrgenergy.com and www.genon.com, respectively (in the “Investor Relations” section), copies of materials they file with, or furnish to, the SEC. attributable to NRG or GenOn or any person acting on their behalf are expressly qualified in their entirety by the cautionary statements above. Participants In the Merger Solicitation NRG, GenOn, and certain of their respective directors and executive officers may be deemed to be participants in the solicitation of proxies from the stockholders of GenOn and NRG in connection with the proposed transaction. Information about the directors and executive officers of NRG is set forth in its proxy statement for its 2012 annual meeting of stockholders, which was filed with the SEC on March 12, 2012. Information about the directors and executive officers of GenOn is set forth in its proxy statement for its 2012 annual meeting of stockholders, which was filed with the SEC on March 30, 2012. These documents can be obtained free of charge from the sources indicated above. Other information regarding the participants in the proxy solicitation and a description of their direct and indirect interests, by security holdings or otherwise, will be contained in the joint proxy statement/prospectus and other relevant materials to be filed with the SEC when they become available. Safe Harbor Continued |
|
|
Agenda Transaction Overview and NRG Strategic Update D. Crane Transaction Rationale and GenOn Update E. Muller Transaction Benefits A. Cleary Financial Summary K. Andrews Closing Remarks and Q&A D. Crane, E. Muller |
|
|
Executive Summary $300 MM Annual Free Cash Flow Benefits from the Combination $200 MM Annual EBITDA From Cost and Operational Efficiency Synergies Significant EBITDA and Free Cash Flow per Share Accretion by 20141: Initiating Pro Forma Guidance2: A Value Creating Event for All Stakeholders 2013 2014 Consolidated Adjusted EBITDA: ~$2,535-2,735 ~$2,630-2,830 FCF, before growth investments: ~$825-1,025 ~$845-1,045 1Per share figures based on midpoint of NRG and Pro Forma guidance ranges. Assumes 227.8 MM shares currently outstanding and 321.7 MM pro forma shares outstanding 2Assumes transaction closing on January 2, 2013, $150 MM of synergies in 2013, and $200 MM in 2014 ($MM) |

|
|
Key Transaction Terms Consideration 100% Stock, fixed exchange ratio GenOn shareholders will receive 0.1216 shares of NRG in exchange for each share of GenOn 20.6% premium based on closing prices at close of business on July 20, 2012 Pro Forma Ownership 71% NRG shareholders 29% GenOn shareholders Governance Directors – 12 from NRG, 4 from GenOn Howard Cosgrove (Chairman) Edward R. Muller (Vice-Chairman) Timing & Approvals Expected to close by Q1 2013 Shareholder approvals for NRG and GenOn expected Q4 2012 Regulatory approvals include FERC, antitrust, New York and Texas Public Utilities Commission No debt holder consents or amendments required Dual Headquarters Commercial/Financial: Princeton, NJ Operational: Houston, TX Company Name NRG Energy NRG Reliant Green Mountain Retail Brands: Management David Crane – President and Chief Executive Officer Kirk Andrews – Chief Financial Officer Mauricio Gutierrez – Chief Operating Officer Anne Cleary – Chief Integration Officer |
|
|
Expanding and Strengthening the Base Enables NRG to Grow Across Its Competitive Energy Business Model The Strategic Benefits of the Combination – Wholesale – Multi-market, multi-fuel, economic generation across the merit order, scale conventional power generation company - Retail - Multi-market, multi-brand competitive retail energy providers with distinct value propositions - Clean -Energy EV Charging Smart Metering Distributed Solar – Wholesale – - Retail - - Clean -Energy |

|
|
Enabling NRG’s Retail Growth Platform Eastern Markets (TWh) ERCOT Market (TWh) NRG Generation GenOn A Foundation to Duplicate NRG’s Successful Texas-based Integrated Model NRG Plants GenOn Plants States Served by NRG retail1 NRG Plants GenOn Plants States served by NRG retail Pro Forma Gulf Coast 16 GW capacity 55 TWh 2011 competitive retail load in ERCOT; contract and co-op loads Pro Forma East 23 GW capacity 3 TWh 2011 competitive retail load2 Source: Company filings; NRG and GEN capacity as of June 30, 2012, generation based on 2011 TWhs 1Includes co-op and contracted loads 2Includes full year Energy Plus volumes 3Potential generation based on nameplate capacity at 85% availability factor NRG potential generation in TX w/ existing capacity3 Potential load assuming 20% net length (TWh basis) NRG Retail Load Pro Forma potential generation in East w/ existing capacity3 TX OK AR LA MS MA MD NY MI NH CT VA WV OH IN IL WI VT NJ DE RI MA MD PA Potential load assuming 20% net length (TWh basis) Potential load assuming 20% net length (TWh basis) |

|
|
The Combined Company Expects to Build on NRG’s Leadership in the Clean Energy Economy on the Strength of its Greening Conventional Portfolio Greening Conventional; Clean Renewables Clean Energy Leadership 772 MW2 (utility scale) by 2014 ~80% reduction in SO2 emissions Alpine Avenal Blythe CVSR Ivanpah Agua Caliente Avra Valley Roadrunner California Arizona New Mexico Utility Scale Solar Distributed Solar NRG Wind: 450 MW Continuous Improvement in Environmental Performance1 Source: EPA and companies’ estimates. Includes domestic units reporting through the EPA Acid Rain program 1Excludes NRG International and Thermal assets. 2015 emissions estimates based on 2011 unit emissions adjusted for controls and retirements 2Net MWs AC ~70% reduction in NOx emissions NRG GEN ~35% reduction in CO2 emissions ~$3 BN invested through 2011: |

|
|
2012 On Track NRG Update Delivering on Financial Performance Q2 2012 EBITDA ~$530 million (YTD ~$830 million) Reaffirming 2012 Full Year Guidance: Consolidated Adjusted EBITDA: $1,825-$2,000 million FCF before growth investments: $800-$1,000 million Delivering on Capital Allocation Objectives First ever quarterly dividend payment of $0.09/share ($0.36/share annually) Record Date: August 1, 2012 Payable Date: August 15, 2012 Implied dividend yield of ~2.0%1 Payout ratio: ~9% of FCF before growth investments2 Sale of Schkopau resulting in $174 million in net proceeds and expansion of the RP basket 2nd Quarter Results Announcing full results on August 8, 2012 1Based on NRG stock price as of July 20, 2012 2Payout ratio based on the midpoint of 2012 FCF before growth investments guidance |
|
|
Transaction Rationale and GenOn Updates |
|
|
Transaction Rationale Combination efficiencies are a key driver of shareholder value in our sector A multi-region, multi-fuel portfolio that will be better positioned to compete throughout the commodity cycle Real, measurable, and actionable cost synergies of $175 million per year plus $25 million in annual operational efficiency synergies achievable within first full year of combined operations Total transaction free cash flow benefits of $300 million per year to be realized from cost and operational efficiency synergies as well as balance sheet efficiencies Greater scale enhances combined company’s ability to revitalize its generation fleet and optimize portfolio value |
|
|
Top U.S. Companies By Competitive Generation Capacity (GW) Source: SNL, company filings as of YE 2011 filings; NRG and GEN capacity as of June 30, 2012. Excludes NRG International, NRG Thermal, and NRG and GEN projects under construction Largest Owner of Competitive Generation The Largest Competitive Power Generation Company in the US |
|
|
Enhanced Generation, Fuel and Revenue Diversity The Combined Company Becomes a Truly Diversified Competitive Power Generation Company West Total (Pro Forma) East Gulf Coast Pro Forma Pro Forma 16 GW; 64 TWh 23 GW; 40 TWh Pro Forma 8 GW; 0.8 TWh 47 GW; 105 TWh Note: Totals may not sum to 100 due to rounding Source: Company filings; NRG and GEN capacity as of June 30, 2012, generation based on 2011 TWhs Excludes NRG International, NRG Thermal, and NRG and GEN projects under construction GWs by Region GWs by Fuel Type Power Plants NRG GenOn |

|
|
Substantial Transaction Benefits Total Annual Free Cash Flow Benefits of $300 MM, Including $200 MM of EBITDA Significant Opportunities Across the Combined Company Cost Create an integrated “best in class” organization by aligning key cost functions, including: Personnel Synergies IT Systems Facilities Fees / Services Insurance Other Operational Create a more efficient pro forma capital structure, including: Reduce leverage Lower cash balance and liquidity requirements Improve cost of capital through prudent cash management and stronger pro forma balance sheet Collateral benefits $175 MM/year $25 MM/year $100 MM/year Synergies Balance Sheet Efficiencies Operational improvement and efficiencies across the combined fleet, driven by the application of: |
|
|
GenOn Update 2012 Raising Adjusted EBITDA Guidance1 to $467 million from $446 million 2013 and 2014 Raising 2013 Adjusted EBITDA Guidance1 to $687 million from $669 million Providing 2014 Adjusted EBITDA Guidance1 of $730 million 2nd Quarter Results Announcing Q2 2012 results on August 9, 2012 1Guidance numbers are based on forward curves as of July 9, 2012 2012 On Track |
|
|
Transaction Benefits |
|
|
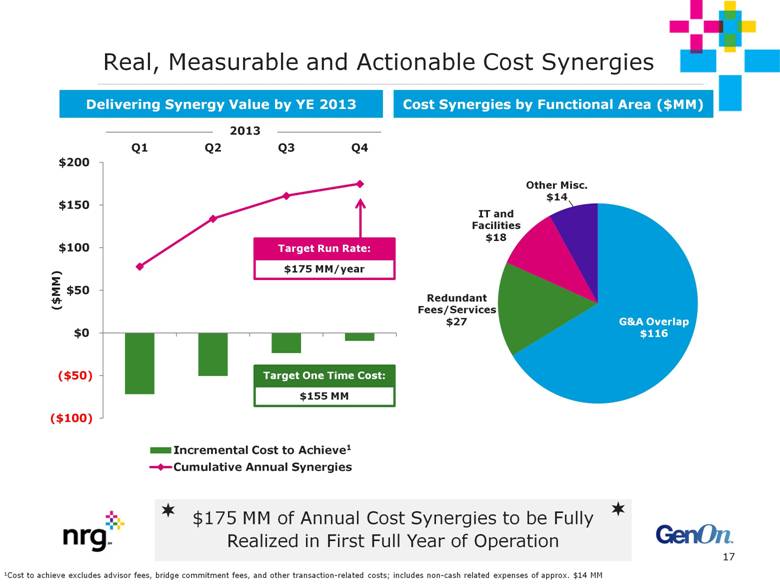
Real, Measurable and Actionable Cost Synergies $175 MM of Annual Cost Synergies to be Fully Realized in First Full Year of Operation 2013 $175 MM/year Target Run Rate: 1Cost to achieve excludes advisor fees, bridge commitment fees, and other transaction-related costs; includes non-cash related expenses of approx. $14 MM Delivering Synergy Value by YE 2013 Cost Synergies by Functional Area ($MM) $155 MM Target One Time Cost: 1 |
|
|
Operational Efficiency Synergies $25 MM/year by 2014 – a 25% Improvement to NRG’s Existing Plan Leveraging the Program Reliability, capacity and efficiency improvements Procurement savings Asset optimization ($MM) Incremental $25 MM operational efficiency synergies: |
|
|
Transaction Benefit Summary Cost Synergies Operational Efficiency Synergies Balance Sheet Efficiencies $175 MM $25 MM $100 MM The Pro Forma Combination Will Drive $300 MM in Annual Transaction Benefits |
|
|
Financial Summary |
|
|
Transaction Structure Description of Structure GenOn will combine with and, upon closing, become an excluded project subsidiary of NRG (non-guarantor) A shared services agreement between both companies will enable the value of synergies to be captured by the parent Structure permitted under indentures, with no bondholder approvals required from either NRG or GenOn bondholders Structure triggers a change of control put right by holders of GenOn’s HoldCo debt Cash on hand and $1.6 billion bridge in place to fund if exercised NRG Energy, Inc. GenOn (Excluded Project Sub) NRG Operating Subs NRG Excluded Project Subs GenOn Operating Subs GenOn Excluded Project Subs Shared Services Agreement Transaction Structure Provides Maximum Flexibility |
|
|
2013 2014 NRG $650-$850 $500-$700 GenOn1 (75) 43 Synergies 150 200 Balance Sheet Efficiencies 100 100 Pro Forma ~$825-$1,025 ~$845-$1,045 (141) - Significant Accretion to Key Metrics EBITDA ($MM) Free Cash Flow Before Growth1 ($MM) EBITDA per Share4 FCF Before Growth per Share4 2013 2014 2013 2014 1Assumes transaction closes on Jan 1 2013 and synergies are fully realized by 2014; 2Based on forward curves as of July 9, 2012 3Excludes $14 MM non-cash related expenses. Also excludes advisor fees, bridge commitment fees, and other transaction-related costs 4Per share figures based on midpoint of NRG and Pro Forma guidance ranges. Assumes 227.8 MM shares currently outstanding and 321.7 MM pro forma shares outstanding 12% Accretion 7% Accretion 2013 2014 NRG $1,700-$1,900 $1,700-$1,900 GenOn2 687 730 Synergies 150 200 Balance Sheet Efficiencies N/A N/A Pro Forma ~$2,535-$2,735 ~$2,630-$2,830 One-time Costs3 $7.90 $8.49 $2.63 $2.94 Transition Year $7.90 $8.19 $3.29 $2.88 Transition Year Including one-time costs Significantly Accretive to EBITDA and Free Cash Flow before Growth in First Full Year of Operations |

|
|
As of March 31, 2012 Exchange and Debt Paydown2 March 31, 2012 $ in millions NRG1 GEN1 ProForma Cash and cash equivalents $1,014 $1,693 ($1,000) $1,707 Restricted cash 217 12 - 229 Total cash: 1,231 1,705 (1,000) 1,936 Recourse debt: Term loan facility 1,588 - - 1,588 Unsecured Notes 6,090 - - 6,090 Tax Exempt Bonds 273 - - 273 Recourse subtotal 7,951 - - 7,951 Non-Recourse debt: Solar non-recourse debt 1,561 - - 1,561 Term Loan Facility - 690 (690) - Unsecured Notes3 - 2,525 - 2,525 GenOn Americas Generation Notes - 850 - 850 Conventional non-recourse debt 636 170 - 806 GMA/REMA Operating Leases4 - - - - Non-Recourse subtotal 2,197 4,235 (690) 5,742 To Be Determined (310) (310) Total Debt $10,148 $4,235 ($1,000) $13,383 Balance Sheet Efficiencies Reduced Leverage of At Least $1 Billion and Other Collateral Synergies Drives Approximately $100 MM of Annual Incremental Cash Flow Benefits 1Debt excludes discounts/premiums from balances 2Assumes that no debt is put and $1.6 Bn bridge is not utilized 3Debt subject to change of control puts, that if exercised will be repurchased 4Present value of remaining lease payments is $903 million and $458 million, respectively |

|
|
Immediately Accretive to Target Credit Metrics Transaction Structure Meaningfully Improves Target Prudent Balance Sheet Management Metrics 1NRG results assume the midpoint of guidance 2Net debt assumed for GenOn is based on balances as of March 31, 2012. Pro Forma metrics reflects impact of transaction benefits Credit Ratings NRG GenOn S&P Moody's S&P Moody's First Lien Debt BB+ Baa3 B+ B1 Unsecured Debt BB- B1 B- B3 Corporate (Outlook) BB- Negative Ba3 Negative B- Stable B2 Negative Credit Statistics NRG Stand Alone1 Long Term NRG Pro Forma2 2013 2014 Target 2013 2014 Net Debt/Total Capital 54.1% 53.1% 45% - 60% 55.1% 54.4% Corporate Debt/ Corporate EBITDA 4.8x 4.6x < 4.25x 4.4x 4.1x Corporate FFO/ Corporate Debt 13.3% 13.9% > 18% 15.2% 16.4% |

|
|
Liquidity Surplus Balance Sheet Efficiency and Liquidity Surplus Delivers Annual Free Cash Flow Uplift of $100 million Currently, the available combined liquidity meaningfully surpasses needs Surplus liquidity permits: At least $1 billion debt reduction Elimination of GenOn credit facility ($788 million) Combined with other collateral efficiencies, $100 million annual free cash flow benefits $2.8 billion pro forma liquidity more than sufficient to support the combined business Minimum cash balance will be maintained at $900 million Liquidity Improvement As of March 31, 2012 $ in millions NRG GEN Debt Pay down / Retirement Pro Forma Cash and Cash Equivalents $1,014 $1,693 ($1,000) $1,707 Restricted/Reserved Cash 217 12 - 229 Total Cash 1,231 1,705 (1,000) 1,936 Revolver Availability 1,141 5321 (788) 885 Total Current Liquidity $2,372 $2,237 ($1,788) $2,821 1Excludes availability under Marsh Landing credit facility |
|
|
Closing Remarks and Q&A |
|
|
Transaction Benefit Summary Cost Synergies Operational Efficiency Synergies Balance Sheet Efficiencies $175 MM $25 MM $100 MM The Pro Forma Combination Will Drive $300 MM in Annual Transaction Benefits |

|
|
Appendix |
|
|
Expected Transaction Timeline 3Q2012 4Q2012 1Q2013 File Registration Statement / Proxy Statement Announcement Shareholder Meetings Transaction Close Regulatory Approval Process (Antitrust, FERC, State Agencies) NRG Dividend NRG Dividend NRG Dividend Expect to Close the Transaction by the First Quarter of 2013 |

|
|
Manageable Proforma Debt Maturity Profile 1Based on preliminary analysis 2Debt maturity schedule as of 3/31/12: Excludes Marsh Landing Project Financings 3Does not include $310 MM of debt repayment as the company will apply the payment to the best available option 4Includes $850 MM of GenOn Americas Generation notes in 2021 and beyond Debt Maturity Profile (2013–2021)1,2,3 ($MM) 4 |

|
|
Combined Federal NOL Tax Attributes (assuming transaction is consummated) As a result of the combination: GenOn will experience an ownership change under Section 382 which further limits the utilization of its $2.6 billion in NOLs GenOn is expected to be in a Net Unrealized Built in Loss position (NUBIL) which further restricts the utilization of immediate tax deductions during the 5 year observable period 2013 – 2017 NRG anticipates that it will not be subject to a Section 382 limitation for its $600 million NOL balance as a result of the combination NRG expects to pay Alternative Minimum Tax and some state tax on taxable income over the next four years Any incremental NOLs generated post closing of the combination will be unrestricted |
|
|
Transaction Detail1 Sources and Uses Sources ($MM) Uses ($MM) NRG Equity Issuance $1,694 Equity Purchase Price $1,694 Debt Assumed 3,235 Debt Assumed 3,235 Cash 1,060 Repayment of GenOn TLB 690 Repayment of Debt – TBD 310 Transaction Costs2 60 Total Sources Of Funds $5,989 Total Uses Of Funds $5,989 Pro Forma Ownership Exchange Ratio 0.1216 Implied Premium 20.6% Shares Owned: NRG 227.8 GenOn 93.8 Total Shares 321.67 % of Combined Company Owned: NRG 71% GenOn 29% Total 100% 1Pro Forma based on 7/18/2012 share balances and share prices as of 7/20/2012 2Expected transaction costs at closing |