Attached files
| file | filename |
|---|---|
| 8-K - FORM 8-K - Philip Morris International Inc. | d384627d8k.htm |
| EX-99.2 - CONFERENCE CALL TRANSCRIPT DATED JULY 19, 2012 - Philip Morris International Inc. | d384627dex992.htm |
| EX-99.1 - PHILIP MORRIS INTERNATIONAL INC. PRESS RELEASE DATED JULY 19, 2012 - Philip Morris International Inc. | d384627dex991.htm |
 Exhibit 99.3
2012 Second-Quarter Results
July 19, 2012 |
 2
Introduction
Unless otherwise stated, we will be talking about results for the second-
quarter 2012 and comparing them with the same period in 2011
References to PMI volumes refer to PMI shipment data, unless
otherwise stated
Industry volume and market shares are the latest data available from a
number of internal and external sources
Organic volume refers to volume excluding acquisitions
Net revenues exclude excise taxes
OCI stands for Operating Companies Income, which is defined as
operating income before general corporate expenses and the
amortization
of
intangibles.
OCI
growth
rates
are
on
an
adjusted
basis,
which excludes asset impairment, exit and other costs
Data tables showing adjustments to net revenues and OCI for currency,
acquisitions, asset impairment, exit and other costs, free cash flow
calculations, adjustments to EPS, and reconciliations to U.S. GAAP
measures are at the end of today’s webcast slides and are posted on
our web site |
 3
Forward-Looking and Cautionary Statements
This presentation and related discussion contain forward-looking statements.
Achievement of projected results is subject to risks, uncertainties and
inaccurate assumptions, and PMI is identifying important factors that,
individually or in the aggregate, could cause actual results to differ materially
from those contained in any forward-looking statements made by PMI
PMI’s business risks include: significant increases in cigarette-related
taxes; the imposition of discriminatory excise tax structures; fluctuations
in customer inventory levels due to increases in product taxes and prices;
increasing marketing and regulatory restrictions, often with the goal of
preventing
the
use
of
tobacco
products;
health
concerns
relating
to
the
use
of
tobacco
products and
exposure to environmental tobacco smoke; litigation related to tobacco use; intense
competition; the effects of global and individual country economic,
regulatory and political developments; changes in adult smoker
behavior;
lost
revenues
as
a
result
of
counterfeiting, contraband and cross-border
purchases; governmental investigations; unfavorable currency exchange rates and
currency devaluations; adverse changes in applicable corporate tax laws;
adverse changes in the cost and quality of tobacco and other agricultural
products and raw materials; and the integrity of its information systems.
PMI’s future profitability may also be adversely affected should it be
unsuccessful in its attempts to produce products with the potential to reduce the
risk of smoking- related diseases; if it is unable to successfully
introduce new products, promote brand equity, enter new markets
or
improve
its
margins
through
increased prices and productivity gains; if it is unable to
expand its brand portfolio internally or through acquisitions and the development
of strategic business relationships; or if it is unable to attract and
retain the best global talent
PMI is further
subject
to
other
risks
detailed
from
time
to
time
in
its
publicly
filed
documents, including
the Form 10-Q for the quarter ended March 31, 2012. PMI cautions that the
foregoing list of important factors is not a complete discussion of all
potential risks and uncertainties. PMI does not undertake to update any
forward-looking statement that it may make from time to time, except in the normal
course of its public disclosure obligations |
 4
Strong Underlying Business Results in Q2, 2012
Organic cigarette volume down by 1.2%
Organic cigarette volume, excluding Japan hurdle, up by
1.4%
Organic OTP volume up by 11.8%
Note: OTP stands for other tobacco products, including cigars, cigarillos, fine
cut, pipe tobacco and snus. Fine cut converted to cigarette equivalents
based on conversion ratio of 1 unit = 0.75g
Source: PMI Financials |
 5
Strong Underlying Business Results in Q2, 2012
Organic cigarette volume down by 1.2%
Organic cigarette volume, excluding Japan hurdle, up
by 1.4%
Organic OTP volume up by 11.8%
Net revenues, excluding currency and acquisitions, up
by 2.9%
Adjusted OCI, excluding currency and acquisitions, up
by 3.5%
Note: OTP stands for other tobacco products, including cigars, cigarillos, fine
cut, pipe tobacco and snus. Fine cut converted to cigarette equivalents
based on conversion ratio of 1 unit = 0.75g
Source: PMI Financials |
 6
Strong Underlying Business Results in Q2, 2012
Organic cigarette volume down by 1.2%
Organic cigarette volume, excluding Japan hurdle, up by
1.4%
Organic OTP volume up by 11.8%
Net revenues, excluding currency and acquisitions,
up by 2.9%
Adjusted OCI, excluding currency and acquisitions,
up by 3.5%
Adjusted diluted EPS, excluding currency, up by 9.0%
Adjusted diluted EPS, excluding currency and Japan
hurdle, up by 17.7%
Note: OTP stands for other tobacco products, including cigars, cigarillos, fine
cut, pipe tobacco and snus. Fine cut converted to cigarette equivalents
based on conversion ratio of 1 unit = 0.75g
Source: PMI Financials |
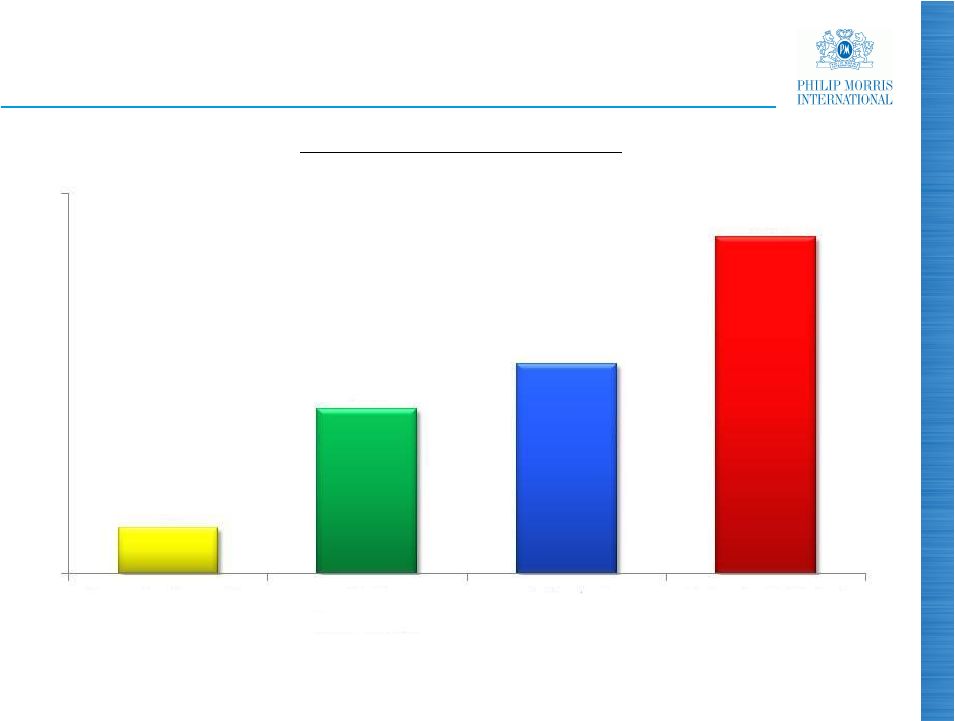 Excellent First-Half 2012 Results
(a)
Excluding currency and acquisitions
(b)
Excluding currency
Source: PMI Financials
(a)
(a)
7
(%)
Growth H1, 2012 vs. H1, 2011
(b)
1.8
6.5
8.3
13.3
0
15
Organic Cigarette
Volume
Net
Revenues
Adjusted
OCI
Adjusted Diluted
EPS |
 8
2012 EPS Guidance
These results confirm our expectation of solid organic
cigarette volume growth in 2012
Continued strong pricing and a favorable product mix only
partially offset by an unfavorable geographic mix
At current prevailing exchange rates, forecast currency
headwind slightly above the 25 cents per share predicted in
June for full year
Strong underlying business momentum expected to offset
the additional unfavorable currency impact of 2 cents per
share
Source: PMI forecasts |
 9
2012 EPS Guidance
Reported diluted 2012 EPS guidance range reaffirmed at
$5.10 to $5.20, compared to $4.85 in 2011
On a currency-neutral basis, our guidance implies a
forecast growth rate of approximately 10% to 12%,
compared to adjusted diluted EPS of $4.88 in 2011
Source: PMI forecasts |
 EU
Region: Cigarette Industry Volume Under Considerable Pressure
% Change
Q2, 2012
H1, 2012
Greece
(16.8)
(18.9)
Hungary
(16.0)
(10.9)
Spain
(18.0)
(10.0)
Italy
(10.5)
(8.5)
Netherlands
(5.7)
(6.0)
EU Region
(9.7)
(5.8)
France
(5.9)
(4.0)
Poland
(7.7)
(3.7)
Czech Republic
(4.2)
(3.6)
UK
(6.0)
(3.1)
Germany
(5.1)
(1.3)
10
Source: PMI estimates |
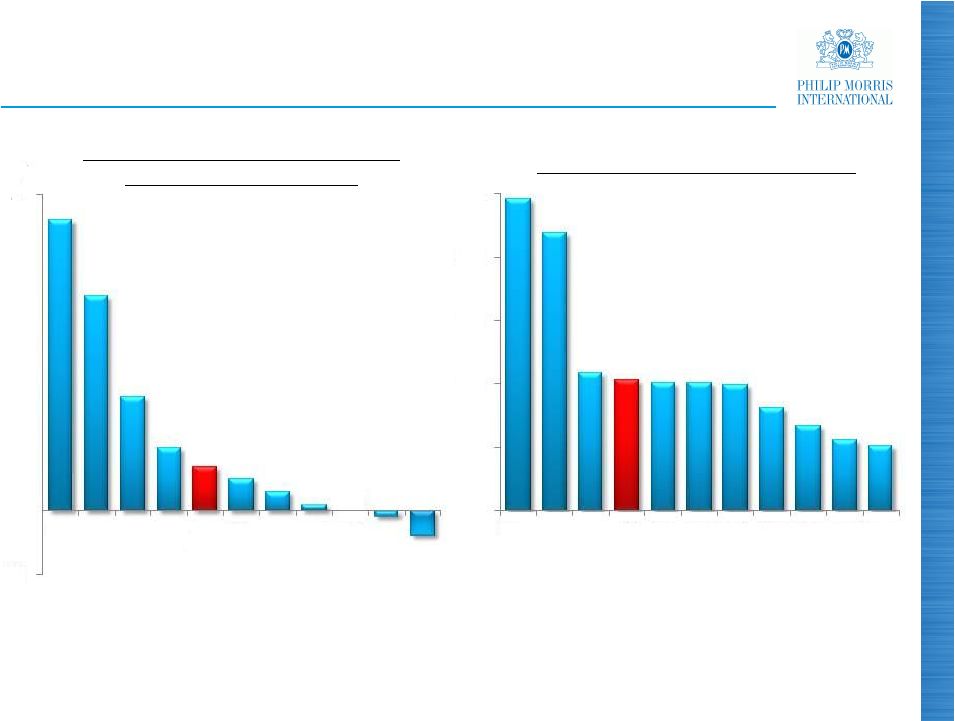 EU
Region: Deteriorating Job Market 11
(a) March 2012 vs. June 2011
(b) March
2012
Note:
Gre.
is
Greece,
Spa.
is
Spain,
Ita.
is
Italy,
Neth.
is
Netherlands,
EU
Avg.
is
EU
average,
Fra.
is
France,
Pol.
is
Poland,
Hun.
is
Hungary,
Cze.
is
Czech Republic and Ger. is Germany
Source: Eurostat
(pp)
Avg.
(a)
(a)
Variance in Unemployment Rates
May 2012 vs. June 2011
0
(%)
Unemployment Rates (May 2012)
Avg.
Cze.
Ger.
(b)
(b)
0.7
5
Gre.
Spa.
Ita.
Neth.
EU
Fra.
Pol.
UK
Hun.
10.3
0
5
10
15
20
25
Spa.
Gre.
Hun.
EU
Ita.
Fra.
Pol.
UK
Cze.
Ger.
Neth.
(1) |
 EU
Region: Resilient Cigarette Market Shares Variance vs. PY
Q2, 2012
H1, 2012
Q2, 2012
H1, 2012
Total PMI
38.5%
37.9%
(0.2)pp
(0.4)pp
Marlboro
18.4
18.0
()
()pp
L&M
6.6
6.6
(0.2)
(-
)pp Chesterfield
3.5
3.4
()
(p
12
Source: PMI estimates
0.3
0.1
0.3
0.4 |
 EU
Region: PMI Gaining Share in Expanding Fine Cut Category
Variance vs. PY
Q2, 2012
H1, 2012
Q2, 2012
H1, 2012
Industry Volume (units billion)
30.9
59.3
(
PMI Share (%)
14.1
14.0
(
(
13
Note: Fine cut converted to cigarette equivalents based on conversion ratio of 1
unit = 0.75g Source: PMI estimates
7.7%
7.9%
1.4pp
1.7pp |
 Cigarette industry volume
declined by 10.5% in Q2,
2012:
-
Reduced consumer
purchasing power
-
Impact of price increases
-
Substitution by fine cut
-
Increase in illicit trade
Marlboro
performing strongly
with share up in Q2, 2012
PMI overall share down
despite
launch
of
Philip
Morris
Selection
in low-price segment
Fine cut leadership
14
Italy: Increased Pressure due to Weak Economy
Note: Totals may not add up due to rounding
Source: PMI estimates
Cigarettes
Marlboro
23.0%
22.6%
(
(
-)pp
Chesterfield
3.5%
3.5%
(0.2)pp
(0.2)p
Diana
12.4 %
12.6 %
(0.8)pp
(0.7)pp
Other
14.0 %
14.1 %
(
()pp
Total PMI
52.9 %
52.8 %
(0.5)pp
(0.6)pp
Fine Cut
Total PMI
31.0 %
29.8 %
24.5pp
26.0
Q2
2012
H1
2012
Q2
H1
Market Shares
Variance
vs. PY
0.3
pp
0.2
0.2 |
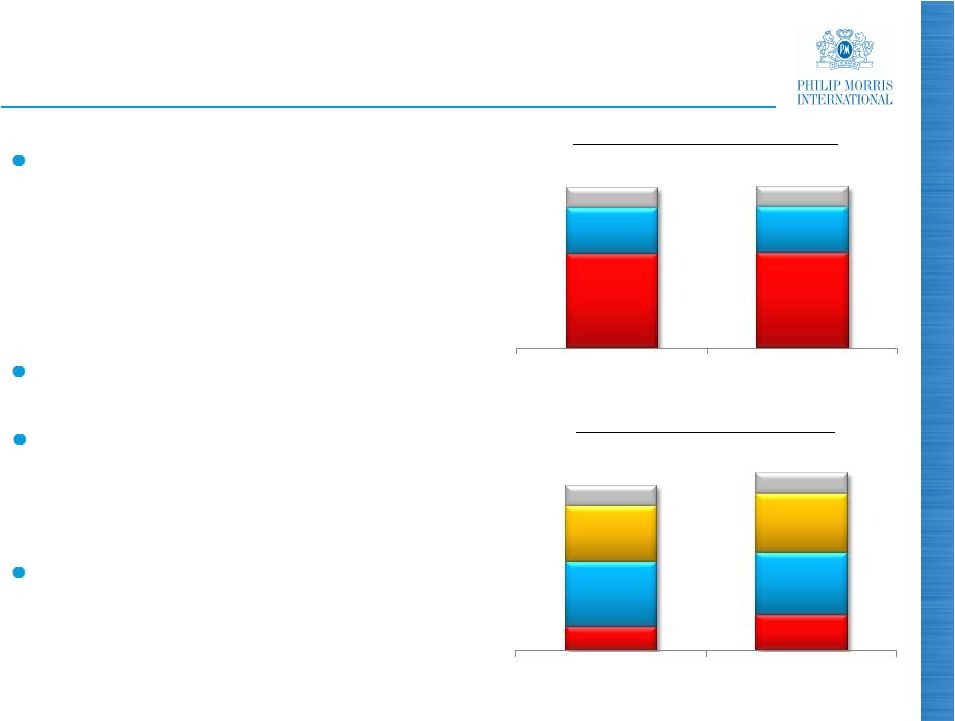 15
Germany: Positive PMI Share Momentum
Cigarette industry volume declined
by 5.1% in Q2, 2012:
-
Recent price increases
-
Lower consumer confidence
-
Difficult comparison with 2011
-
Some timing issues
PMI achieved modest share gains
in cigarette category and
continued strong momentum in
fine cut
Marlboro
gained share in both
cigarettes and fine cut in Q2, 2012
Source: PMI estimates
PMI Fine Cut Market Share (%)
PMI Cigarette Market Share (%)
Total PMI
Other
Chesterfield
Marlboro
L&M
Total PMI
Other
Marlboro
L&M
2.0
3.2
5.9
5.6
5.0
5.3
14.8
16.0
Q2
2011
Q2
2012
21.1
21.4
10.4
10.5
36.1
36.4
Q2
2011
Q2
2012
Cigarette industry volume down
by 1.3% YTD June, 2012 |
 EU
Region: Weaker Results in Q2, 2012 Variance vs. PY
Q2, 2012
H1, 2012
Q2, 2012
H1, 2012
Cigarette Volume (units billion)
51.8
99.6
(9.4)%
(5.8)%
OTP Volume (units billion)
4.7
9.1
()%
()%
Net Revenues ($ billion)
2.3
4.3
(0.7)%
()%
Adjusted OCI ($ billion)
1.1
2.1
(2.7)%
()%
16
(a) Excluding currency and acquisitions
Note: OTP stands for other tobacco products, including cigars, cigarillos, fine
cut, pipe tobacco and snus. Fine cut converted to cigarette equivalents
based on conversion ratio of 1 unit = 0.75g
Source: PMI Financials
(a)
(a)
(a)
(a)
18.2
23.1
2.0
0.2 |
 EEMA
Region: Another Very Strong Quarter 17
(a) Excluding acquisitions
(b) Excluding currency and acquisitions
Source: PMI Financials
Variance vs. PY
Q2, 2012
H1, 2012
Q2, 2012
H1, 2012
Cigarette Volume (units billion)
79.2
145.1
(
Net Revenues ($ billion)
2.2
4.0
Adjusted OCI ($ billion)
0.9
1.8
4.9%
(a)
12.7
(b)
22.9
(b)
4.2%
(a)
12.6
(b)
20.6
(b) |
 18
EEMA Region: Positive Pricing and Volume/Mix
Note: Variances at OCI level
Source: PMI Financials
0
125
($ million)
Q2, 2012
114
104
Pricing
Variance
Volume/Mix
Variance |
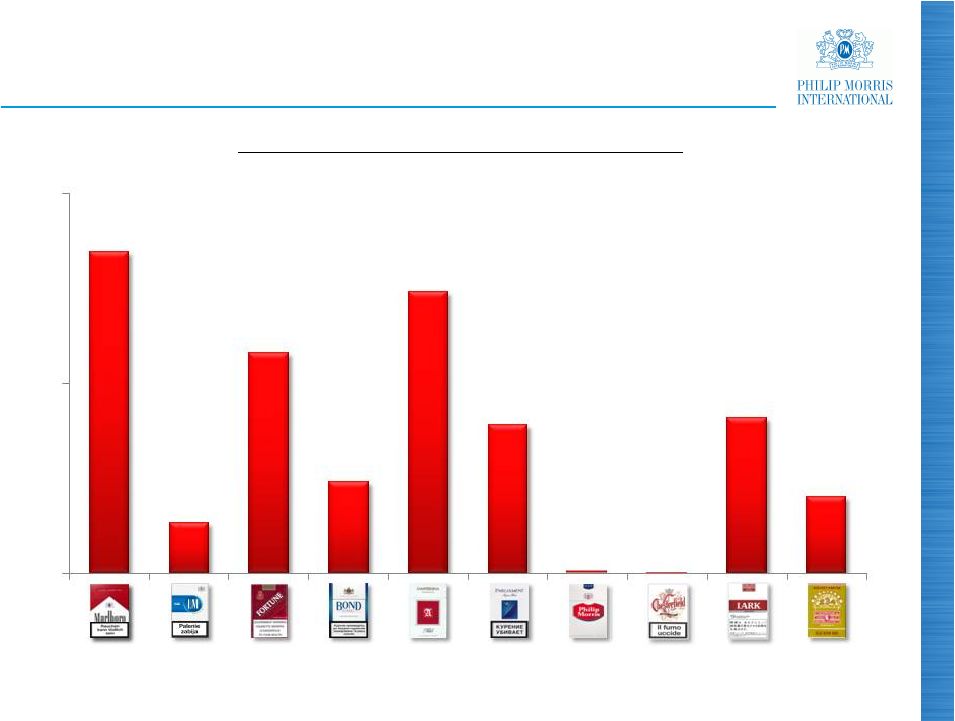
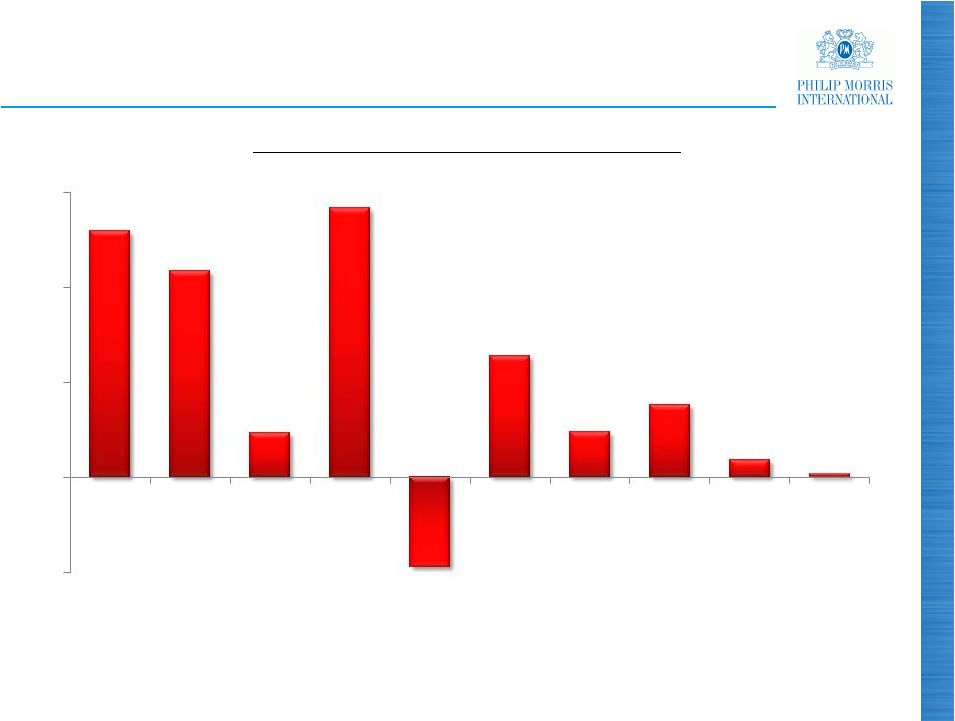 EEMA
Region: Growth of Key Brands (units million)
19
Chest.
Note:
Marlb.
is
Marlboro,
Parl.
is
Parliament
and
Chest.
is Chesterfield
Source: PMI Financials
Street
Soyuz
Volume Growth (Q2, 2012 vs. Q2, 2011)
(400)
0
400
800
1,200
Marlb.
Bond
L&M
Parl.
Lark
Optima
Next
Muratti
Apollo
- |
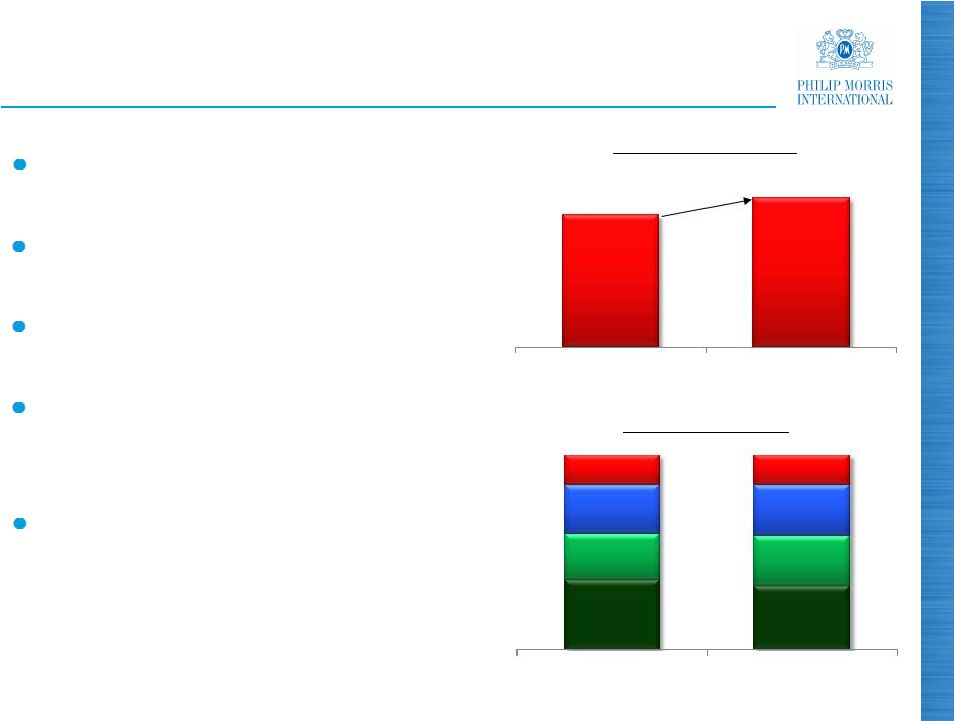 Total market grew slightly
during first half of 2012
PMI volume increased by
8.7% in Q2, 2012
Adult smokers continue to
uptrade gradually
PMI market share gains QTD
May thanks to Parliament,
L&M, Bond Street
and Next
Price increase of RUB 3/pack
in July 2012
Price Segments (%)
Russia: Market and Share Growth
20
PMI Market Share (%)
Premium
Mid
Low
Super-
Low
(a) Q2 and H1 data through end May
Source: PMI estimates, PMI Financials and Nielsen
+0.7pp
(a)
(a)
(a)
(a)
25.4
26.1
Q2
2011
Q2
2012
35.7
32.5
23.7
26.0
24.9
25.7
15.7
15.8
H1
2011
H1
2012 |
 21
Russia: Marlboro ClearTaste Launched |
 Asia
Region: Japan Hurdle Masks Another Very Strong Quarter
Variance vs. PY
Q2, 2012
H1, 2012
Q2, 2012
H1, 2012
Cigarette Volume (units billion)
83.5
164.5
(0.7)%
(5.4
)%
Cigarette Volume
ex. Japan Hurdle
(7.4
)% (9.8)%
Adjusted OCI ($ billion)
1.4
2.8
(2.6)%
(8.9
)% 22
(a) Excluding currency and acquisitions
Source: PMI Financials
(a)
(a) |
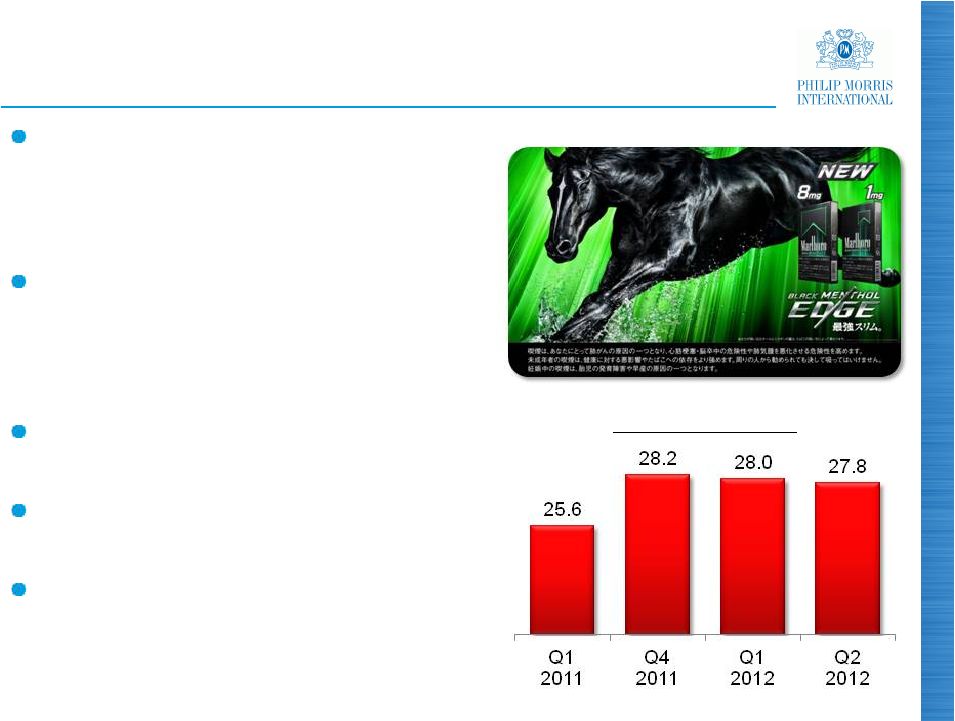 Japan: Resilient Share Performance
23
Industry volume should be
stable in 2012 and underlying
trend remains a moderate
decline of 1-2% per year
PMI Q2, 2012 market share
slightly down due to
acceleration in new launches
by Japan Tobacco
Marlboro Black Menthol Edge
launched in Q2, 2012
Marlboro
Ice
Blast
5mg
/
1mg
launched this July
Increase of Consumption Tax
from 5% to 8% in 2014 and
10% in 2015 approved
Source: PMI estimates and Tobacco Institute of Japan
PMI Market Share (%) |
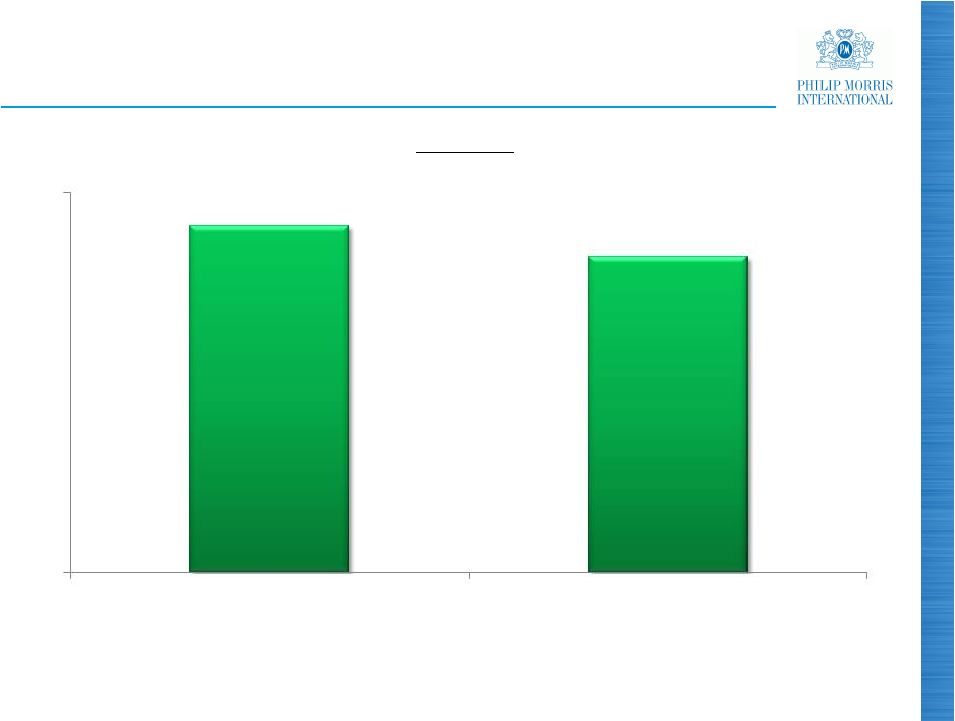
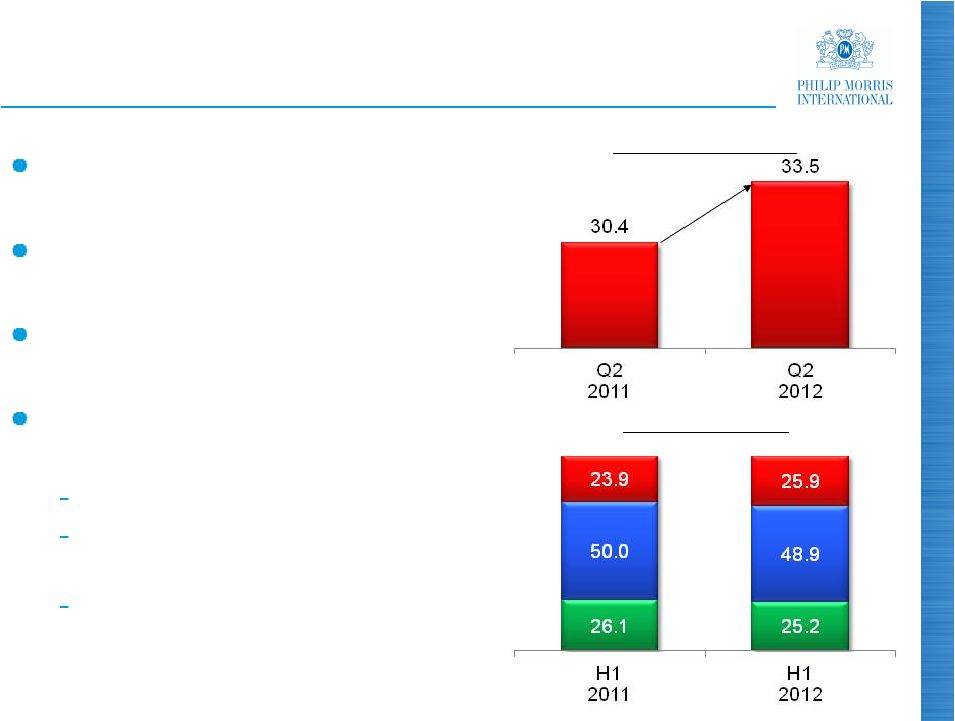 Indonesia: PMI Momentum Continues
24
Industry volume growth of
6.9% in Q2, 2012
PMI volume increased by
17.8% in second quarter
Adult smokers uptrading in
strong economy
PMI share up 3.1 points to
33.5% in Q2, 2012:
Strongest and broadest portfolio
Sampoerna
A
fastest-growing
brand
Rounded price points
Premium
(a)
Mid
Low
(a) Includes above premium
Source: PMI estimates and PMI Financials
+3.1pp
Price Segments (%)
PMI Market Share (%) |
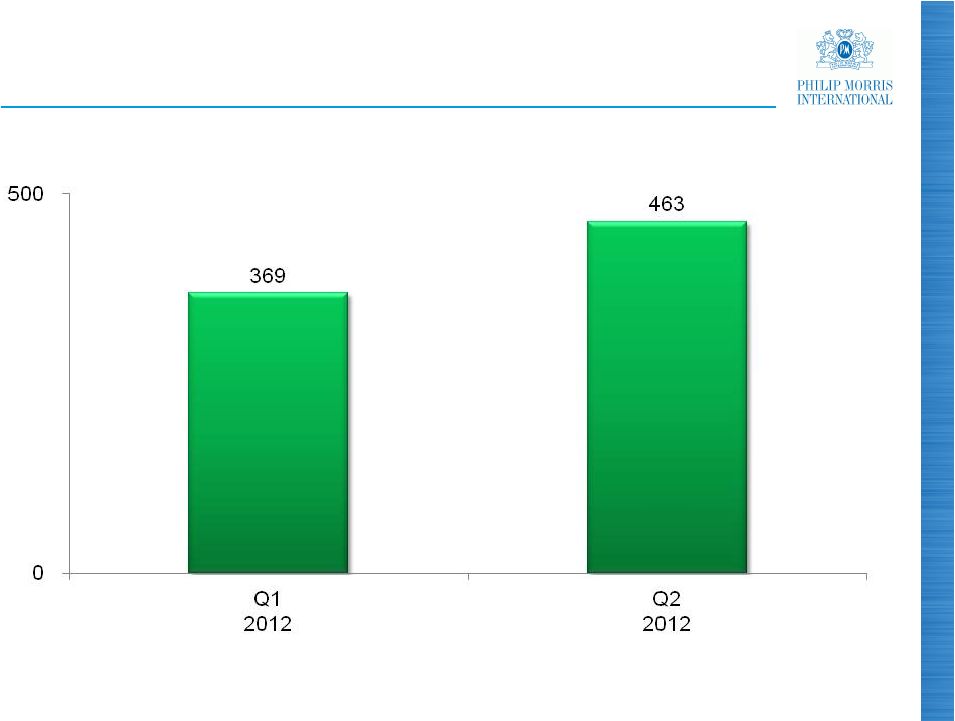 25
Favorable Pricing Continued in Q2, 2012
Note: Variances at OCI level
Source: PMI Financials
($ million) |
 Strong Brand Performance Continues
Volume Growth (H1, 2012 vs. H1, 2011)
(a)
26
(a) Excluding Japan hurdle
Source: PMI Financials
(units billion)
0
2.5
5.0 |
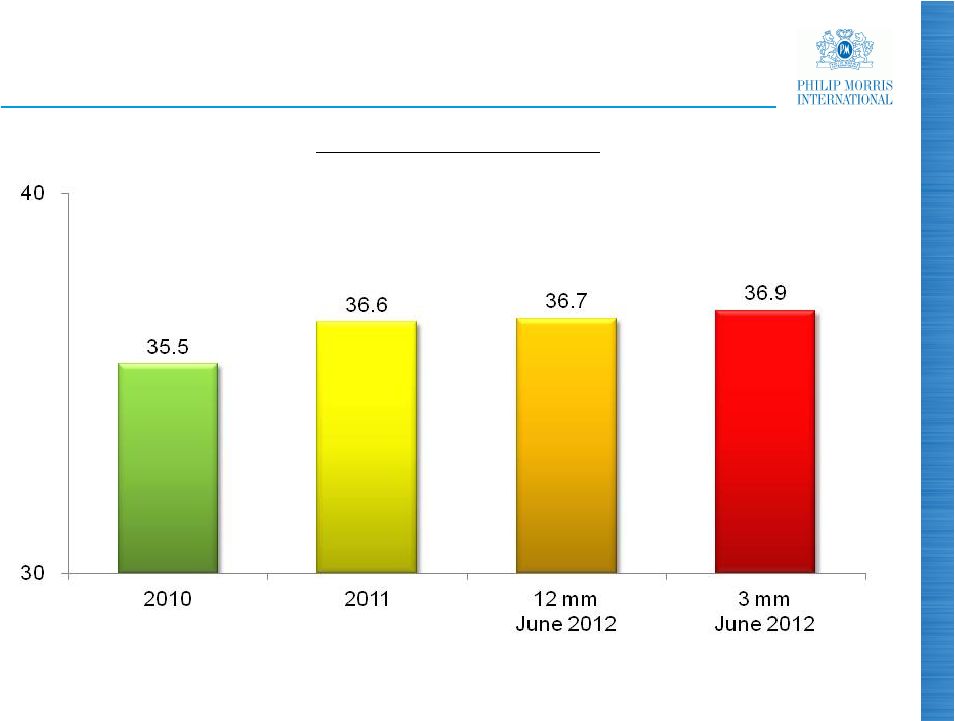 PMI
Expanding its Market Share 27
Top 30 PMI OCI Markets
(a)
(%)
(a) Excluding duty free
Note: Historical data adjusted for pro forma inclusion of business combination with
Fortune Tobacco Corporation in the Philippines and Jordan acquisition
Source: PMI Financials and PMI estimates |
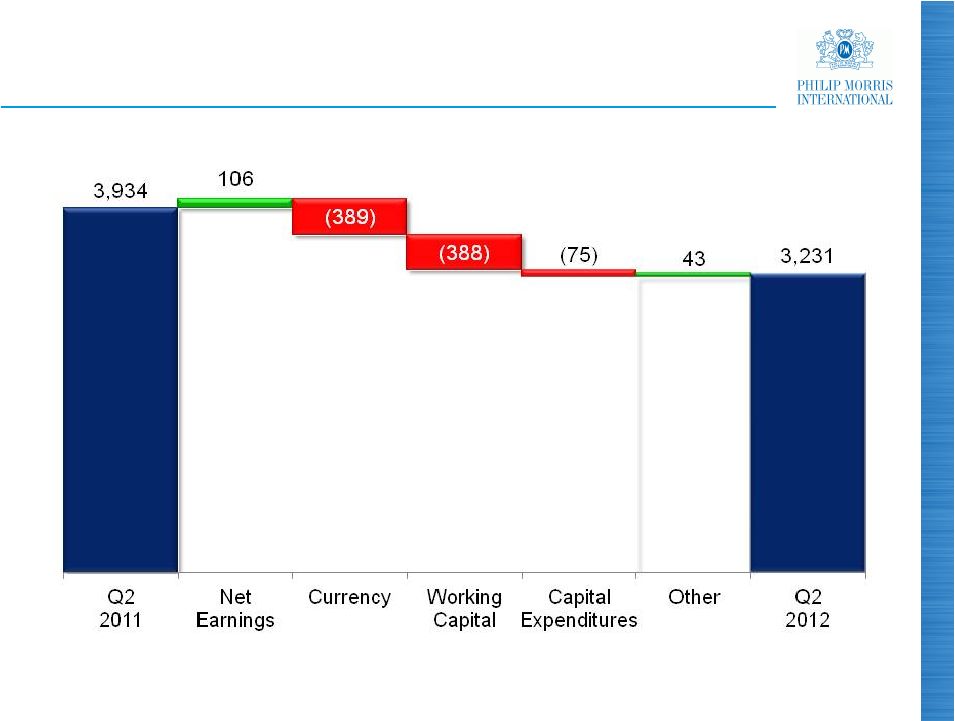 28
Free Cash Flow
(a)
Impacted by Currency and
Working Capital Requirements
(a)
Free cash flow equals net cash provided by operating activities less capital
expenditures Source: PMI Financials
($ million) |
 29
Share Repurchase Program Further Extended
In Q2, 2012, PMI spent $1.5 billion to repurchase
17.8 million shares
New three-year $18 billion share repurchase program to
start in August when funds from previous authorization fully
utilized
Target for 2012 remains $6 billion in share repurchases
Since spin, $24.4 billion spent to repurchase 21.3% of
shares outstanding at the time
Source: PMI Financials |
 Underlying business momentum remains strong
Very strong results in EEMA and Asia Regions offset unusually
weak industry volume in EU Region and the Japan hurdle
Breadth of footprint, superior brand portfolio and continued
strong pricing environment driving growth
Net revenues and adjusted OCI increased in Q2, 2012,
excluding currency and acquisitions
Adjusted diluted EPS, excluding currency, up 9.0% in Q2, 2012
Reaffirmed guidance range of $5.10 to $5.20 for reported diluted
EPS in 2012, despite slightly greater currency unfavorability
This represents a growth rate of approximately 10% to 12% on a
currency-neutral basis, compared to adjusted diluted EPS of
$4.88 in 2011
30
Conclusion
Source: PMI Financials |
 2012
Second-Quarter Results Questions & Answers
|
 PHILIP MORRIS INTERNATIONAL INC. and Subsidiaries
Reconciliation of Non-GAAP Measures
Adjustments for the Impact of Currency and Acquisitions
For the Quarters Ended June 30,
($ in millions)
(Unaudited)
32
Reported Net
Revenues
Less
Excise
Taxes
Reported Net
Revenues
excluding
Excise Taxes
Less
Currency
Reported Net
Revenues
excluding
Excise Taxes &
Currency
Less
Acquisi-
tions
Reported Net
Revenues
excluding
Excise Taxes,
Currency &
Acquisitions
Reported
Net
Revenues
Less
Excise
Taxes
Reported Net
Revenues
excluding
Excise Taxes
Reported
Reported
excluding
Currency
Reported
excluding
Currency &
Acquisitions
7,280
$
4,995
$
2,285
$
(195)
$
2,480
$
-
$
2,480
$
European Union
8,080
$
5,583
$
2,497
$
(8.5)%
(0.7)%
(0.7)%
5,062
2,911
2,151
(127)
2,278
11
2,267
EEMA
4,603
2,591
2,012
6.9%
13.2%
12.7%
5,317
2,462
2,855
(29)
2,884
-
2,884
Asia
5,146
2,210
2,936
(2.8)%
(1.8)%
(1.8)%
2,378
1,549
829
(51)
880
-
880
Latin America & Canada
2,405
1,577
828
0.1%
6.3%
6.3%
20,037
$
11,917
$
8,120
$
(402)
$
8,522
$
11
$
8,511
$
PMI Total
20,234
$
11,961
$
8,273
$
(1.8)%
3.0%
2.9%
Reported
Operating
Companies
Income
Less
Currency
Reported
Operating
Companies
Income
excluding
Currency
Less
Acquisi-
tions
Reported
Operating
Companies
Income
excluding
Currency &
Acquisitions
Reported
Operating
Companies
Income
Reported
Reported
excluding
Currency
Reported
excluding
Currency &
Acquisitions
1,117
$
(130)
$
1,247
$
-
$
1,247
$
1,280
$
(12.7)%
(2.6)%
(2.6)%
948
(80)
1,028
2
1,026
835
13.5%
23.1%
22.9%
1,364
3
1,361
-
1,361
1,398
(2.4)%
(2.6)%
(2.6)%
249
(25)
274
-
274
268
(7.1)%
2.2%
2.2%
3,678
$
(232)
$
3,910
$
2
$
3,908
$
3,781
$
(2.7)%
3.4%
3.4%
2012
2011
% Change in Reported Operating
Companies Income
2012
2011
% Change in Reported Net Revenues
excluding Excise Taxes |
 PHILIP MORRIS INTERNATIONAL INC. and Subsidiaries
Reconciliation of Non-GAAP Measures
Reconciliation of Reported Operating Companies Income to Adjusted Operating
Companies Income & Reconciliation of Adjusted Operating Companies Income
Margin, excluding Currency and Acquisitions For the Quarters Ended June
30, ($ in millions)
(Unaudited)
33
Reported
Operating
Companies
Income
Less
Asset
Impairment &
Exit Costs
Adjusted
Operating
Companies
Income
Less
Currency
Adjusted
Operating
Companies
Income
excluding
Currency
Less
Acquisi-
tions
Adjusted
Operating
Companies
Income
excluding
Currency &
Acquisitions
Reported
Operating
Companies
Income
Less
Asset Impairment &
Exit Costs
Adjusted
Operating
Companies
Income
Adjusted
Adjusted
excluding
Currency
Adjusted
excluding
Currency &
Acquisitions
1,117
$
-
$
1,117
$
(130)
$
1,247
$
-
$
1,247
$
European Union
1,280
$
(1)
$
1,281
$
(12.8)%
(2.7)%
(2.7)%
948
-
948
(80)
1,028
2
1,026
EEMA
835
-
835
13.5%
23.1%
22.9%
1,364
-
1,364
3
1,361
-
1,361
Asia
1,398
-
1,398
(2.4)%
(2.6)%
(2.6)%
249
(8)
257
(25)
282
-
282
Latin America & Canada
268
-
268
(4.1)%
5.2%
5.2%
3,678
$
(8)
$
3,686
$
(232)
$
3,918
$
2
$
3,916
$
PMI Total
3,781
$
(1)
$
3,782
$
(2.5)%
3.6%
3.5%
% Points Change
Adjusted
Operating
Companies
Income
excluding
Currency
Net Revenues
excluding
Excise Taxes &
Currency
(a)
Adjusted
Operating
Companies
Income
Margin
excluding
Currency
Adjusted
Operating
Companies
Income
excluding
Currency &
Acquisitions
Net Revenues
excluding
Excise Taxes,
Currency &
Acquisitions
(a)
Adjusted
Operating
Companies
Income
Margin
excluding
Currency &
Acquisitions
Adjusted
Operating
Companies
Income
Net Revenues
excluding Excise
Taxes
(a)
Adjusted
Operating
Companies
Income
Margin
Adjusted
Operating
Companies
Income
Margin
excluding
Currency
Adjusted
Operating
Companies
Income Margin
excluding
Currency &
Acquisitions
1,247
$
2,480
$
50.3%
1,247
$
2,480
$
50.3%
European Union
1,281
$
2,497
$
51.3%
(1.0)
(1.0)
1,028
2,278
45.1%
1,026
2,267
45.3%
EEMA
835
2,012
41.5%
3.6
3.8
1,361
2,884
47.2%
1,361
2,884
47.2%
Asia
1,398
2,936
47.6%
(0.4)
(0.4)
282
880
32.0%
282
880
32.0%
Latin America & Canada
268
828
32.4%
(0.4)
(0.4)
3,918
$
8,522
$
46.0%
3,916
$
8,511
$
46.0%
PMI Total
3,782
$
8,273
$
45.7%
0.3
0.3
% Change in Adjusted Operating
Companies Income
2011
2012
2011
2012
(a) For the calculation of net revenues excluding excise taxes, currency and acquisitions, refer
to previous slide |
 PHILIP MORRIS INTERNATIONAL INC. and Subsidiaries
Reconciliation of Non-GAAP Measures
Reconciliation of Reported Diluted EPS to Adjusted Diluted EPS and Adjusted
Diluted EPS, excluding Currency For the Quarters Ended June 30,
(Unaudited)
34
2012
2011
% Change
Reported Diluted EPS
1.36
$
1.35
$
0.7%
Adjustments:
Asset impairment and exit costs
-
-
Tax items
-
(0.01)
Adjusted Diluted EPS
1.36
$
1.34
$
1.5%
Less:
Currency impact
(0.10)
Adjusted Diluted EPS, excluding Currency
1.46
$
1.34
$
9.0% |
 PHILIP MORRIS INTERNATIONAL INC. and Subsidiaries
Reconciliation of Non-GAAP Measures
Reconciliation of Reported Diluted EPS to Reported Diluted EPS, excluding
Currency For the Quarters Ended June 30,
(Unaudited)
35
2012
2011
% Change
Reported Diluted EPS
1.36
$
1.35
$
0.7%
Less:
Currency impact
(0.10)
Reported Diluted EPS, excluding Currency
1.46
$
1.35
$
8.1% |
 PHILIP MORRIS INTERNATIONAL INC. and Subsidiaries
Reconciliation of Non-GAAP Measures
Adjustments for the Impact of Currency and Acquisitions
For the Six Months Ended June 30,
($ in millions)
(Unaudited)
36
Reported Net
Revenues
Less
Excise
Taxes
Reported Net
Revenues
excluding
Excise Taxes
Less
Currency
Reported Net
Revenues
excluding
Excise Taxes &
Currency
Less
Acquisi-
tions
Reported Net
Revenues
excluding
Excise Taxes,
Currency &
Acquisitions
Reported
Net
Revenues
Less
Excise
Taxes
Reported Net
Revenues
excluding
Excise Taxes
Reported
Reported
excluding
Currency
Reported
excluding
Currency &
Acquisitions
13,750
$
9,412
$
4,338
$
(249)
$
4,587
$
-
$
4,587
$
European Union
14,495
$
9,997
$
4,498
$
(3.6)%
2.0%
2.0%
9,131
5,145
3,986
(200)
4,186
20
4,166
EEMA
8,274
4,575
3,699
7.8%
13.2%
12.6%
10,494
4,862
5,632
45
5,587
1
5,586
Asia
9,434
4,175
5,259
7.1%
6.2%
6.2%
4,684
3,072
1,612
(90)
1,702
-
1,702
Latin America & Canada
4,561
2,953
1,608
0.2%
5.8%
5.8%
38,059
$
22,491
$
15,568
$
(494)
$
16,062
$
21
$
16,041
$
PMI Total
36,764
$
21,700
$
15,064
$
3.3%
6.6%
6.5%
Reported
Operating
Companies
Income
Less
Currency
Reported
Operating
Companies
Income
excluding
Currency
Less
Acquisi-
tions
Reported
Operating
Companies
Income
excluding
Currency &
Acquisitions
Reported
Operating
Companies
Income
Reported
Reported
excluding
Currency
Reported
excluding
Currency &
Acquisitions
2,147
$
(155)
$
2,302
$
-
$
2,302
$
European Union
2,286
$
(6.1)%
0.7%
0.7%
1,758
(124)
1,882
2
1,880
EEMA
1,557
12.9%
20.9%
20.7%
2,771
56
2,715
-
2,715
Asia
2,491
11.2%
9.0%
9.0%
486
(42)
528
-
528
Latin America & Canada
519
(6.4)%
1.7%
1.7%
7,162
$
(265)
$
7,427
$
2
$
7,425
$
PMI Total
6,853
$
4.5%
8.4%
8.3%
2012
2011
% Change in Reported Operating
Companies Income
2012
2011
% Change in Reported Net Revenues
excluding Excise Taxes |
 PHILIP MORRIS INTERNATIONAL INC. and Subsidiaries
Reconciliation of Non-GAAP Measures
37
Reconciliation of Reported Operating Companies Income to Adjusted Operating
Companies Income & Reconciliation of Adjusted Operating Companies Income
Margin, excluding Currency and Acquisitions For the Six Months Ended June
30, ($ in millions)
(Unaudited)
Reported
Operating
Companies
Income
Less
Asset
Impairment &
Exit Costs
Adjusted
Operating
Companies
Income
Less
Currency
Adjusted
Operating
Companies
Income
excluding
Currency
Less
Acquisi-
tions
Adjusted
Operating
Companies
Income
excluding
Currency &
Acquisitions
Reported
Operating
Companies
Income
Less
Asset Impairment &
Exit Costs
Adjusted
Operating
Companies
Income
Adjusted
Adjusted
excluding
Currency
Adjusted
excluding
Currency &
Acquisitions
2,147
$
-
$
2,147
$
(155)
$
2,302
$
-
$
2,302
$
European Union
2,286
$
(12)
$
2,298
$
(6.6)%
0.2%
0.2%
1,758
-
1,758
(124)
1,882
2
1,880
EEMA
1,557
(2)
1,559
12.8%
20.7%
20.6%
2,771
-
2,771
56
2,715
-
2,715
Asia
2,491
(2)
2,493
11.2%
8.9%
8.9%
486
(16)
502
(42)
544
-
544
Latin America & Canada
519
(1)
520
(3.5)%
4.6%
4.6%
7,162
$
(16)
$
7,178
$
(265)
$
7,443
$
2
$
7,441
$
PMI Total
6,853
$
(17)
$
6,870
$
4.5%
8.3%
8.3%
% Points Change
Adjusted
Operating
Companies
Income
excluding
Currency
Net Revenues
excluding
Excise Taxes &
Currency
(a)
Adjusted
Operating
Companies
Income
Margin
excluding
Currency
Adjusted
Operating
Companies
Income
excluding
Currency &
Acquisitions
Net Revenues
excluding
Excise Taxes,
Currency &
Acquisitions
(a)
Adjusted
Operating
Companies
Income
Margin
excluding
Currency &
Acquisitions
Adjusted
Operating
Companies
Income
Net Revenues
excluding Excise
Taxes
(a)
Adjusted
Operating
Companies
Income
Margin
Adjusted
Operating
Companies
Income
Margin
excluding
Currency
Adjusted
Operating
Companies
Income Margin
excluding
Currency &
Acquisitions
2,302
$
4,587
$
50.2%
2,302
$
4,587
$
50.2%
European Union
2,298
$
4,498
$
51.1%
(0.9)
(0.9)
1,882
4,186
45.0%
1,880
4,166
45.1%
EEMA
1,559
3,699
42.1%
2.9
3.0
2,715
5,587
48.6%
2,715
5,586
48.6%
Asia
2,493
5,259
47.4%
1.2
1.2
544
1,702
32.0%
544
1,702
32.0%
Latin America & Canada
520
1,608
32.3%
(0.3)
(0.3)
7,443
$
16,062
$
46.3%
7,441
$
16,041
$
46.4%
PMI Total
6,870
$
15,064
$
45.6%
0.7
0.8
2012
2011
2012
2011
% Change in Adjusted Operating
Companies Income
(a) For the calculation of net revenues excluding excise taxes, currency and acquisitions, refer
to previous slide |
 PHILIP MORRIS INTERNATIONAL INC. and Subsidiaries
Reconciliation of Non-GAAP Measures
Reconciliation of Reported Diluted EPS to Adjusted Diluted EPS and Adjusted
Diluted EPS, excluding Currency For the Six Months Ended June 30,
(Unaudited)
38
2012
2011
% Change
Reported Diluted EPS
2.60
$
2.42
$
7.4%
Adjustments:
Asset impairment and exit costs
0.01
0.01
Tax items
-
(0.02)
Adjusted Diluted EPS
2.61
$
2.41
$
8.3%
Less:
Currency impact
(0.12)
Adjusted Diluted EPS, excluding Currency
2.73
$
2.41
$
13.3% |
 PHILIP MORRIS INTERNATIONAL INC. and Subsidiaries
Reconciliation of Non-GAAP Measures
Reconciliation of Reported Diluted EPS to Reported Diluted EPS, excluding
Currency For the Six Months Ended June 30,
(Unaudited)
39
2012
2011
% Change
Reported Diluted EPS
2.60
$
2.42
$
7.4%
Less:
Currency impact
(0.12)
Reported Diluted EPS, excluding Currency
2.72
$
2.42
$
12.4% |
 PHILIP MORRIS INTERNATIONAL INC. and Subsidiaries
Reconciliation of Non-GAAP Measures
Reconciliation of Reported Diluted EPS to Adjusted Diluted EPS
For the Year Ended December 31,
(Unaudited)
40
2011
Reported Diluted EPS
4.85
$
Adjustments:
Asset impairment and exit costs
0.05
Tax items
(0.02)
Adjusted Diluted EPS
4.88
$
|
 PHILIP MORRIS INTERNATIONAL INC. and Subsidiaries
Reconciliation of Non-GAAP Measures
Reconciliation
of
Operating
Cash
Flow
to
Free
Cash
Flow
and
Free
Cash
Flow,
excluding
Currency
For the Quarters and Six Months Ended June 30,
($ in millions)
(Unaudited)
(a) Operating Cash Flow
41
For the Quarters Ended
For the Six Months Ended
June 30,
June 30,
2012
2011
% Change
2012
2011
% Change
Net
cash
provided
by
operating
activities
(a)
3,480
$
4,120
$
(15.5)%
5,378
$
6,515
$
(17.5)%
Less:
Capital expenditures
249
186
476
345
Free cash flow
3,231
$
3,934
$
(17.9)%
4,902
$
6,170
$
(20.6)%
Less:
Currency impact
(389)
(439)
Free cash flow, excluding currency
3,620
$
3,934
$
(8.0)%
5,341
$
6,170
$
(13.4)% |
 2012
Second-Quarter Results July 19, 2012 |