Attached files
| file | filename |
|---|---|
| 8-K - FORM 8-K - Blackstone Group Inc | d380800d8k.htm |
| EX-99.1 - PRESS RELEASE OF THE BLACKSTONE GROUP L.P. - Blackstone Group Inc | d380800dex991.htm |
 Second Quarter 2012 Earnings
July 19, 2012
Exhibit 99.2 |
 Blackstone
1
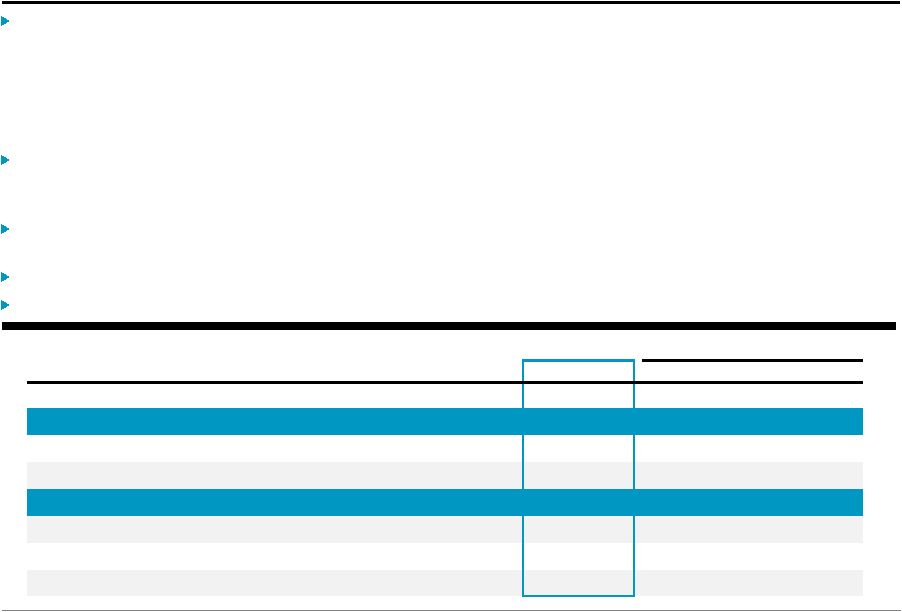
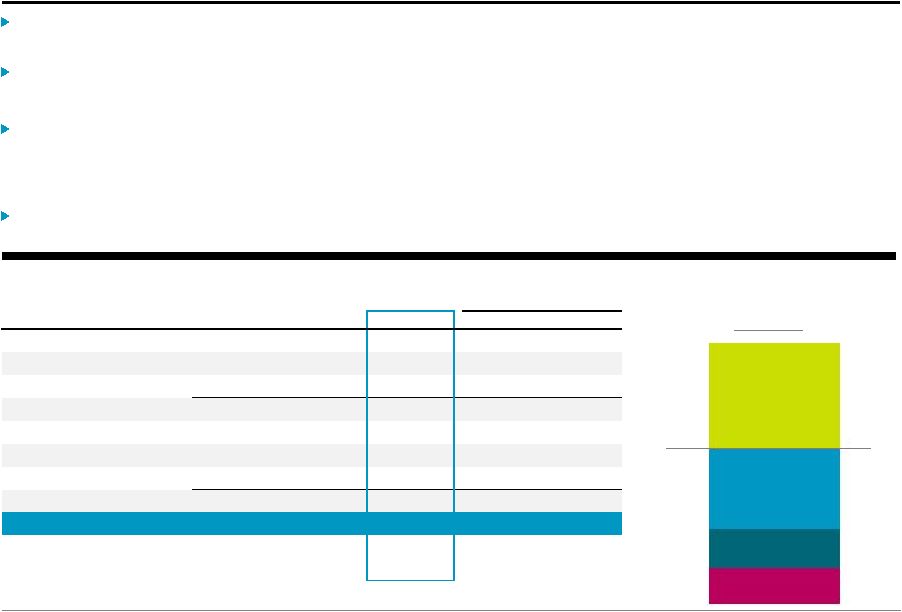
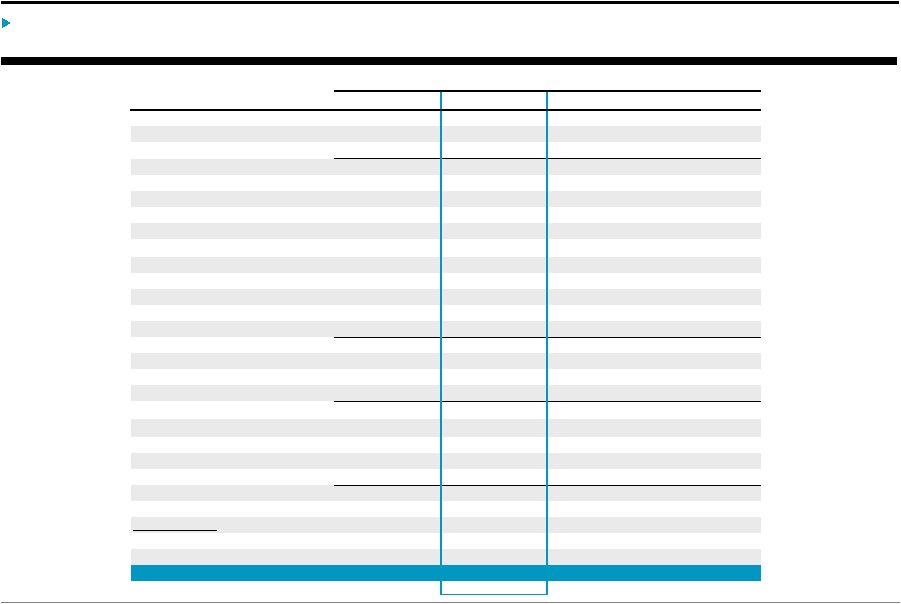
Blackstone’s Second Quarter 2012 Earnings
Economic Net Income (“ENI”) was $212 million for the second quarter,
down from $804 million in the same period a year ago, as difficult public
markets impacted Performance Fees and Investment Income particularly in our
public and non-dollar denominated investments. •
Blackstone earned $704 million of ENI year-to-date in challenging markets
which reflects the continued strong growth in AUM and Fee Related
Earnings, the resiliency of our highly diversified earnings streams and the
positive year-to-date contributions across our businesses.
Fee-Earning
AUM
reached
a
record
$158
billion
in
the
second
quarter,
up
22%
over
the
same
period
last
year,
as
$44 billion of gross inflows (including $10 billion from the Harbourmaster
acquisition) more than offset $13 billion of capital returned to investors
over the same period. Gross fee-earning inflows for the quarter were
$5.8 billion, including fundraising for our latest global real estate
fund, new private equity energy fund (“BEP”) and strong inflows in
Credit Businesses and Hedge Fund Solutions. Distributable Earnings for the
second quarter of $188 million were roughly flat from the year ago period.
GAAP Revenues of $627 million led to a Net Loss of $75 million after IPO and
acquisition-related charges. Note: Prior periods amounts on all pages have been
adjusted to conform to the current period presentation and definitions. (1)
Economic Net Income has been redefined as Economic Income after current taxes
(“Taxes”); it no longer deducts the implied provision for income taxes.
(2)
ENI per Unit is based on the Weighted-Average ENI Adjusted Units.
(3)
DE per Common Unit equals Pre-Tax DE allocated to Common Unitholders less Other Payables
to Common Unitholders divided by Total GAAP Common Units Outstanding. % Change
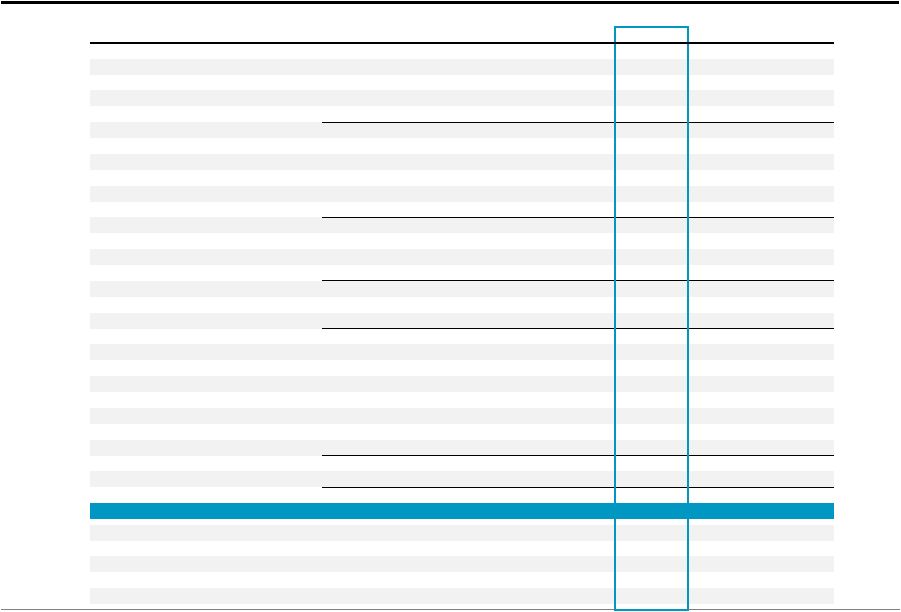
(Dollars in Thousands, Except per Unit Data)
2Q'11
1Q'12
2Q'12
vs. 2Q'11
vs. 1Q'12
GAAP Net Income (Loss)
86,237
$
58,325
$
(74,964)
$
n/m
n/m
Economic Net Income ("ENI")
(1)
804,181
$
491,217
$
212,349
$
(74)%
(57)%
ENI per Unit
(2)
0.73
$
0.44
$
0.19
$
(74)%
(57)%
Fee Related Earnings ("FRE")
156,297
146,928
145,729
(7)%
(1)%
Distributable Earnings ("DE")
190,878
$
162,121
$
188,404
$
(1)%
16%
DE per Common Unit
(3)
0.16
$
0.15
$
0.16
$
0%
7%
Total Assets Under Management
158,703,173
190,074,167
190,267,831
20%
0%
Fee-Earning Assets Under Management
129,001,206
156,261,446
157,646,521
22%
1% |
 Blackstone
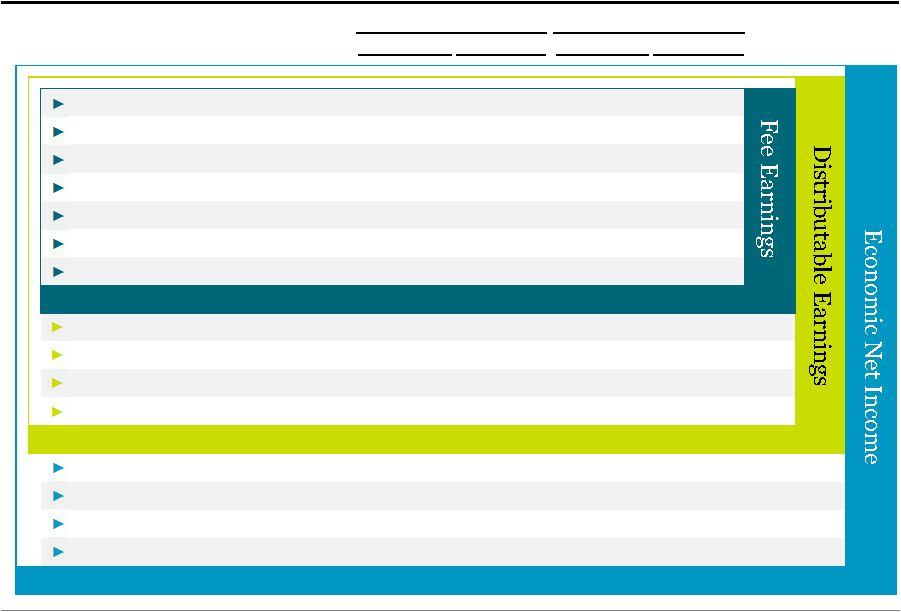
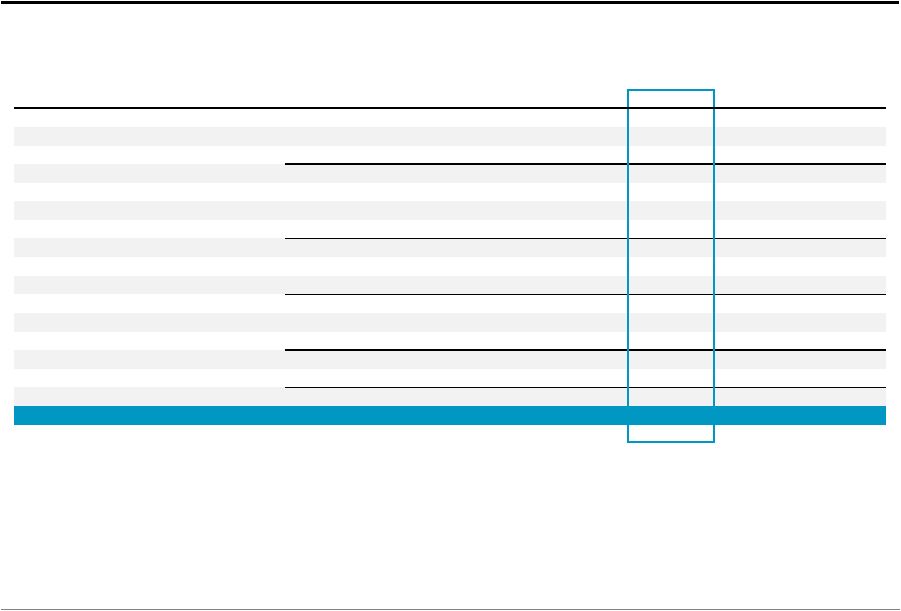
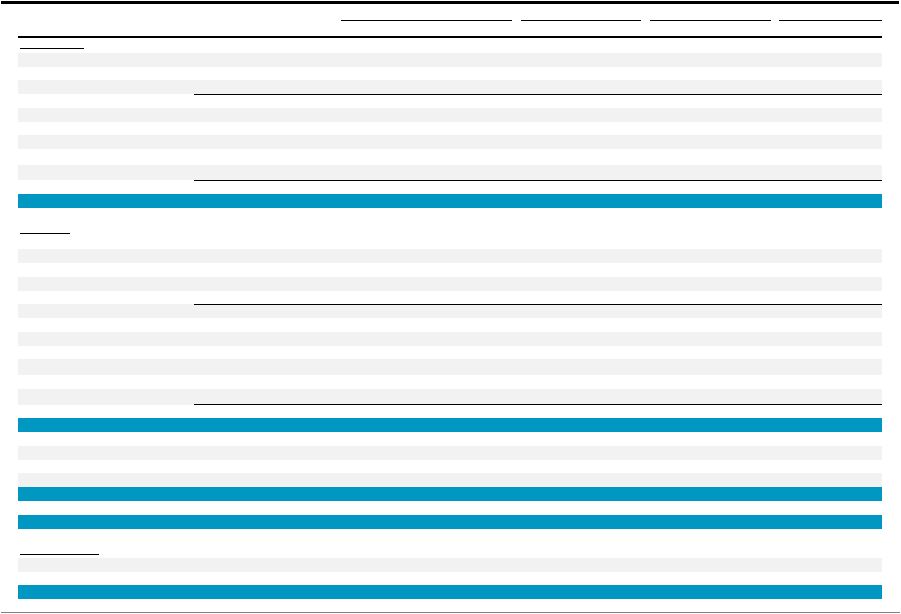
Walkdown of Financial Metrics
2Q'12
Year-to-Date
(Dollars in Thousands, Except per Unit Data)
Results
Per Unit
(1)
Results
Per Unit
(1)
Base Management Fees
381,344
$
776,850
$
Transaction and Other Fees, Net
49,453
87,924
Advisory Fees
93,372
169,218
Management Fee Offsets
(7,973)
(21,023)
Interest Income and Other Revenue
11,455
25,903
Compensation
(268,884)
(523,656)
Other Operating Expenses
(113,038)
(222,559)
Fee Related Earnings
145,729
$
0.13
$
292,657
$
0.26
$
Net Realized Incentive Fees
6,117
7,144
Net Realized Carried Interest
48,030
53,652
Realized Investment Income
8,080
25,675
Taxes and Related Payables
(19,552)
(28,603)
Distributable Earnings
188,404
$
0.16
$
350,525
$
0.31
$
Net Unrealized Incentive Fees
(7,478)
47,864
Net Unrealized Carried Interest
47,475
261,728
Unrealized Investment Income
(26,236)
33,265
Add Back: Related Payables
10,184
10,184
Economic Net Income
212,349
$
0.19
$
703,566
$
0.63
$
2
See Appendix - Calculation of Certain Non-GAAP Financial Metric Components for the
calculation of the amounts presented herein which are not the respective captions from the Total
Segment information.
(1)
Fee Related Earnings per Unit is based on DE Units Outstanding; DE per Unit equals DE per
Common Unit; and ENI per Unit is based on Weighted-Average ENI Adjusted Units (See
Appendix - Unit Rollforward). |
 Blackstone
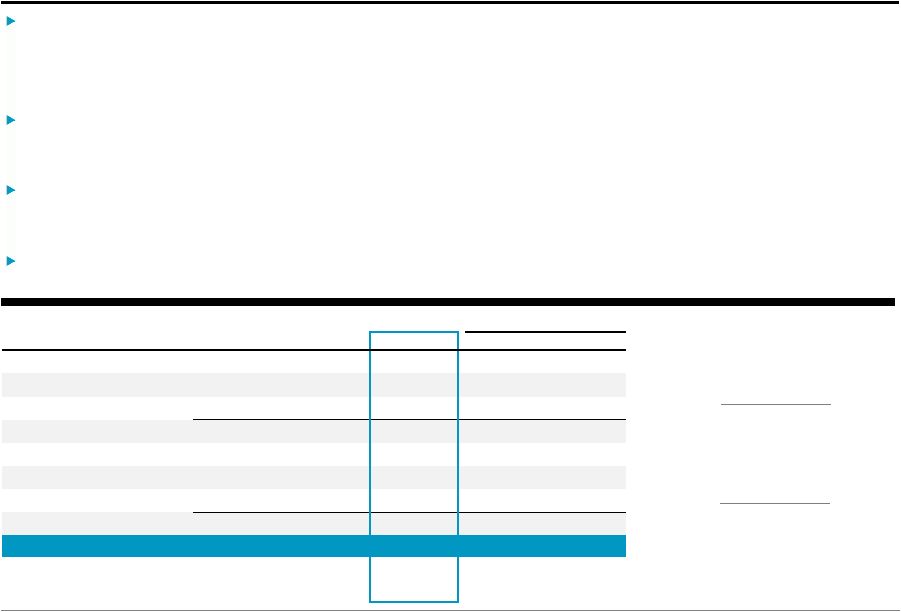
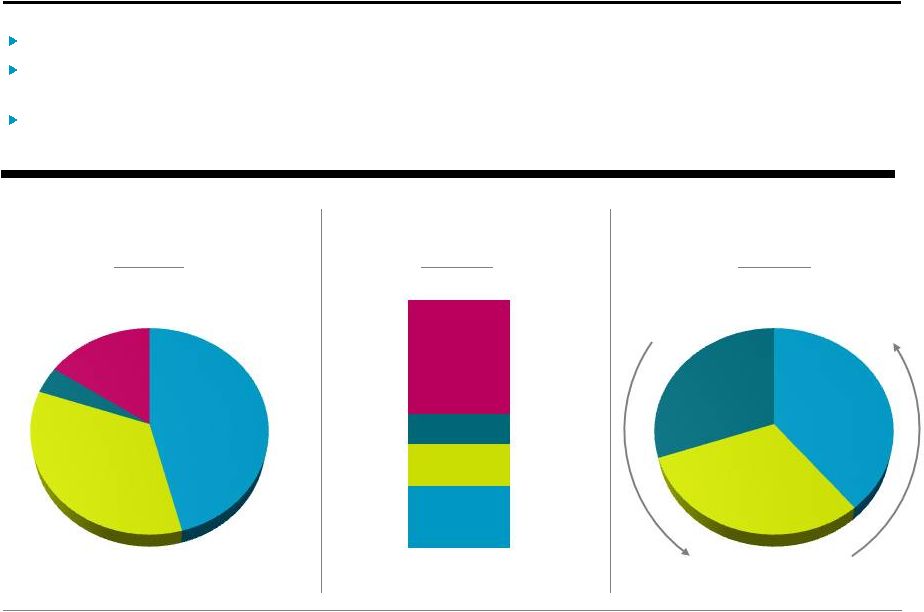
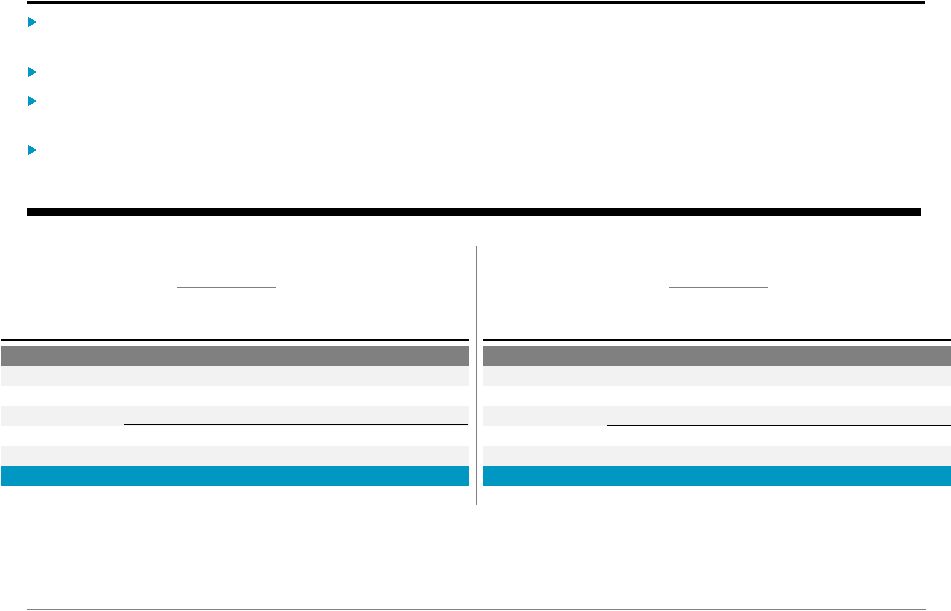
Private Equity
Revenues were impacted by a sharp decline in Performance Fees and Investment
Income as the carrying value of assets overall was down 4.2% for the
quarter. •
Negative markets particularly impacted the segment’s public holdings and
non-dollar denominated investments while private holdings remained
largely flat for the quarter. The overall portfolio is up slightly year-to-date.
Private Equity had $533 million of net accrued Performance Fees at the end of the
quarter substantially related to BCP IV, which is in full cash carry at a
37% net IRR. During the quarter, BCP IV contributed $28 million in net
realized performance fees.
Returned
$403
million
of
capital
to
investors
during
the
quarter
at
an
average
2.1x
Multiple
of
Invested
Capital
(“MOIC”) and invested $109 million of total capital with an additional
$1.2 billion committed but not yet deployed, bringing year-to-date
total capital deployed and committed to $2.0 billion. Fundraising
continues for our new energy fund (“BEP”) with an additional $500 million of new commitments
bringing the total fund size to over $2 billion to date.
(1)
Economic Income is pre-tax Economic Net Income.
(4.2)%
2Q’12 Decrease in Fund Carrying Value
$533 million
Net Accrued Performance Fees at 2Q’12
4%
Increase in Fee-Earning AUM since 2Q’11
(Dollars in Thousands)
2Q'11
1Q'12
2Q'12
vs. 2Q'11
vs. 1Q'12
Fee Revenues
130,883
$
102,309
$
105,430
$
(19)%
3%
Performance Fees
188,552
37,984
(59,112)
n/m
n/m
Investment Income (Loss)
79,968
30,380
(34,532)
n/m
n/m
Total Revenues
399,403
170,673
11,786
(97)%
(93)%
Compensation
64,633
52,547
53,775
(17)%
2%
Performance Fee Compensation
29,358
(732)
(7,455)
n/m
n/m
Other Operating Expenses
30,124
28,881
30,521
1%
6%
Total Expenses
124,115
80,696
76,841
(38)%
(5)%
Economic Income (Loss) ("EI")
(1)
275,288
$
89,977
$
(65,055)
$
n/m
n/m
Total AUM
46,728,301
47,624,013
46,633,552
(0)%
(2)%
Fee-Earning AUM
35,778,240
37,323,635
37,159,452
4%
(0)%
% Change
3 |
 Blackstone
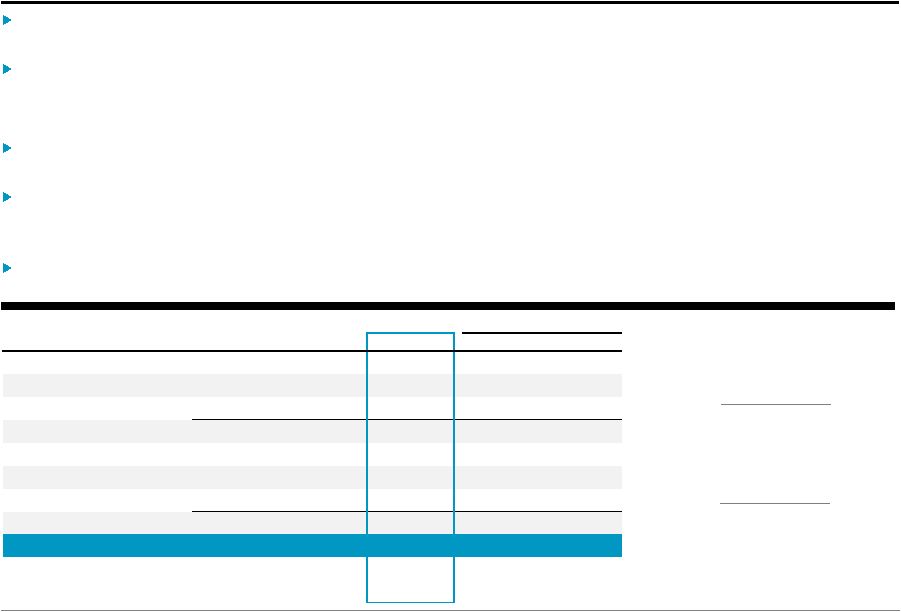
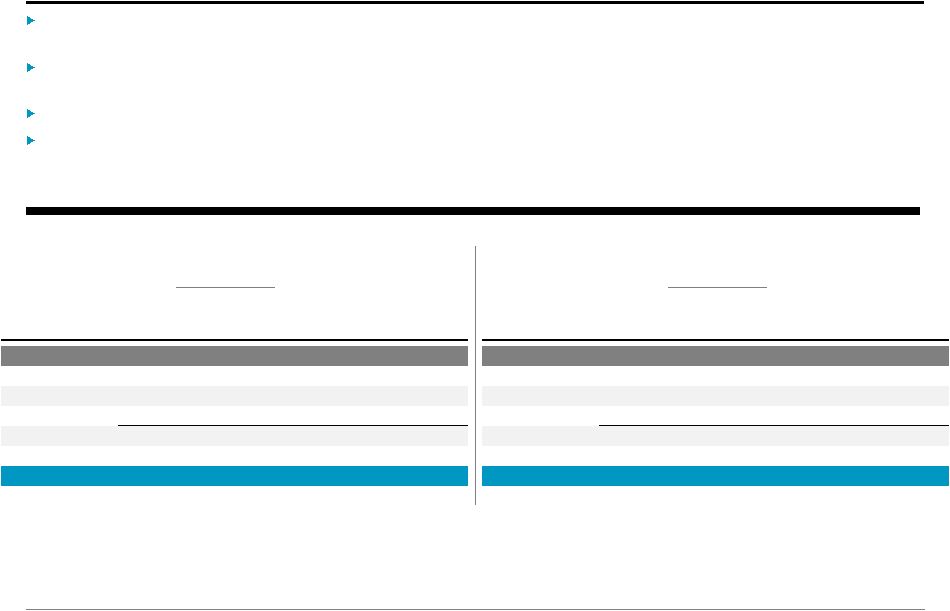
Real Estate
Revenues
were
down
from
the
prior
year
due
to
smaller
appreciation
gains
in
the
funds
and
the
“catch-up”
of
Performance Fees in the year-earlier period which negatively impacted
year-over-year comparisons. Carrying
value
of
assets
overall
was
up
2.9%
for
the
quarter
and
up
6.7%
year-to-date.
•
Portfolio appreciation was driven by continued strengthening of operating
fundamentals, particularly in our hospitality, office and retail holdings
where occupancy rose during the quarter and over the last year.
During
the
quarter,
Real
Estate
distributed
$800
million
of
cash
to
investors,
which
includes
$422
million
of
sale
proceeds from dispositions of BREP investments at an average 2.0x MOIC.
Investment activity remained robust with $2.0 billion of total capital invested
and an additional $1.6 billion committed but not yet deployed during the
quarter, bringing year-to-date total capital deployed and committed to
$4.7 billion.
Fundraising continues for our most recent global real estate fund, with $2
billion in additional commitments in the second quarter bringing the total
fund size to over $12 billion. 2.9%
2Q’12 Increase in Fund Carrying Value
$1 billion
Net Accrued Performance Fees at 2Q’12
(1)
Base Management Fees up 31% over the same quarter last year; transaction fees down over the
same period due to a significant transaction fee related to the Centro acquisition in
2Q’11. (See Appendix for segment detail.) 38 %
Increase in Fee-Earning AUM since 2Q’11
(Dollars in Thousands)
2Q'11
1Q'12
2Q'12
vs. 2Q'11
vs. 1Q'12
Fee Revenues
(1)
149,514
$
155,430
$
150,298
$
1%
(3)%
Performance Fees
450,290
238,030
164,289
(64)%
(31)%
Investment Income
48,726
33,724
24,011
(51)%
(29)%
Total Revenues
648,530
427,184
338,598
(48)%
(21)%
Compensation
70,651
68,889
76,576
8%
11%
Performance Fee Compensation
100,403
62,122
38,320
(62)%
(38)%
Other Operating Expenses
22,971
28,924
26,560
16%
(8)%
Total Expenses
194,025
159,935
141,456
(27)%
(12)%
Economic Income
454,505
$
267,249
$
197,142
$
(57)%
(26)%
Total AUM
37,605,560
48,322,760
50,225,950
34%
4%
Fee-Earning AUM
27,919,000
36,647,462
38,476,123
38%
5%
% Change
4 |
 Blackstone
5
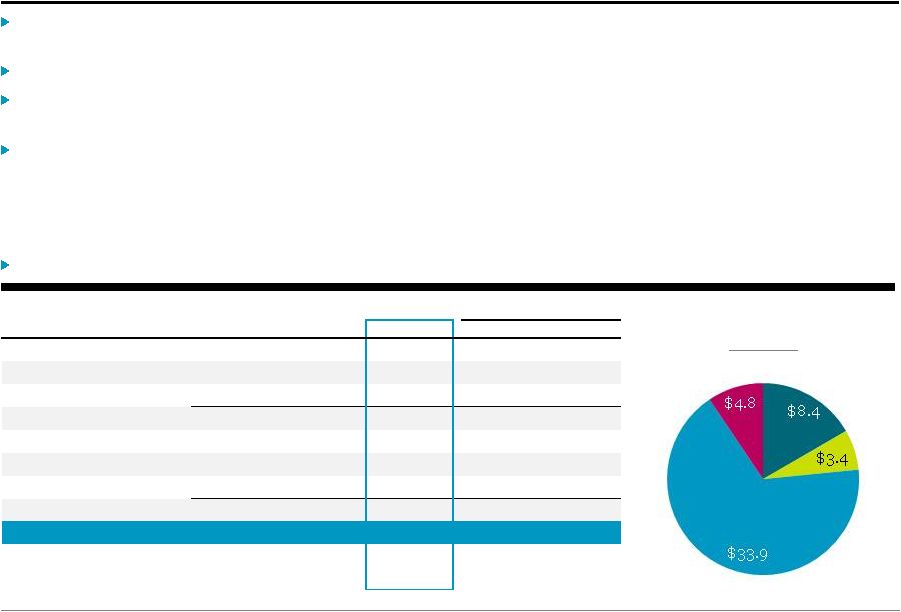
Hedge Fund Solutions
Total Revenues
were
down
15%
year-over-year
despite
AUM
growth,
reflecting
negative
Performance
Fees
in
the
quarter, which more than offset Fee Revenue growth of 5% over the year ago
period. Composite
returns
were
down
1.2%
net
for
the
quarter
and
up
2.7%
net
year-to-date.
•
The composite return outperformed the MSCI
(1)
, which was down 5.8% for the quarter.
Fee-Earning AUM for the segment grew 8% to $40.2 billion over the last twelve
months. •
$4.2 billion of fee-earning net inflows primarily in customized and
commingled investment products. •
July 1
st
subscriptions of $921 million are not included in the quarter-end
Fee-Earning AUM. $9 billion or 41% of Incentive Fee-Earning AUM
were estimated above their respective High Water Mark and/or Hurdle
as
of
June
30,
2012
and
another
$7
billion
of
assets
were
within
2%
of
earning
Performance
Fees.
$22 billion
2Q’12
Incentive
Fee-Earning
AUM
(2)
Above
HWM /
Hurdle
0-2%
Below
> 5%
Below
2-5%
Below
(Dollars in Thousands)
2Q'11
1Q'12
2Q'12
vs. 2Q'11
vs. 1Q'12
Fee Revenues
80,389
$
81,837
$
84,490
$
5%
3%
Performance Fees
4,108
26,485
(9,806)
n/m
n/m
Investment Loss
(9)
8,874
(2,707)
n/m
n/m
Total Revenues
84,488
117,196
71,977
(15)%
(39)%
Compensation
31,674
28,233
34,559
9%
22%
Performance Fee Compensation
3,208
8,672
(3,165)
n/m
n/m
Other Operating Expenses
16,075
13,934
14,506
(10)%
4%
Total Expenses
50,957
50,839
45,900
(10)%
(10)%
Economic Income
33,531
$
66,357
$
26,077
$
(22)%
(61)%
Total AUM
40,578,219
43,351,275
42,888,946
6%
(1)%
Fee-Earning AUM
37,244,509
40,543,772
40,161,179
8%
(1)%
% Change
$3B / 14%
$3B / 15%
$7B / 31%
$9B / 41%
(1)
The MSCI World Index is a world stock market index with over 1,600 world stocks.
(2)
Represents incentive fee eligible AUM above or below High Water Mark or Relevant Benchmark. Totals may
not add due to rounding. |
 Blackstone
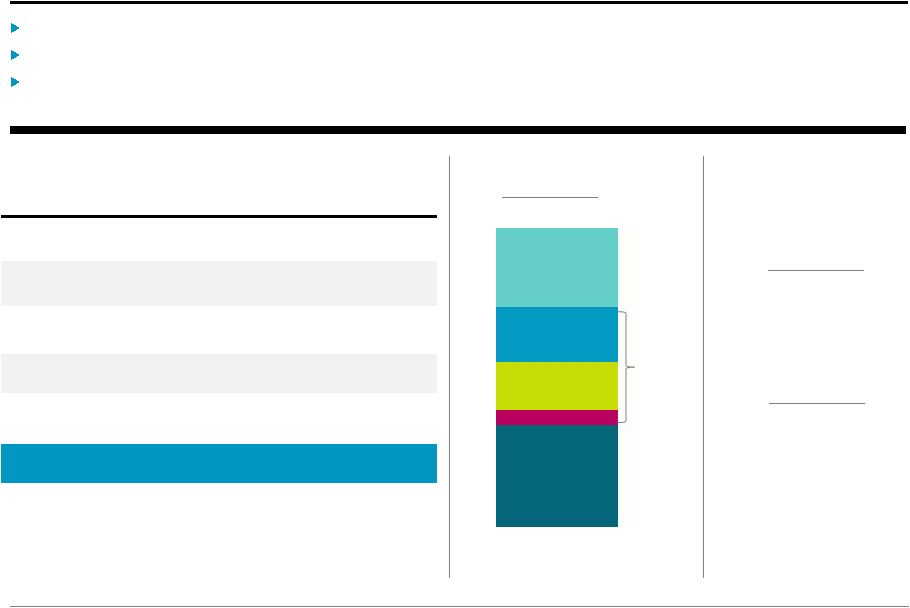
Credit Businesses
Fee Revenues grew 53% from the prior year driven by continued growth in AUM,
strong fund performance and the impact of the Harbourmaster
acquisition. Net accrued Performance Fees grew to $176 million at the end of
2Q’12 with strong performance in the quarter. Fee-Earning AUM was
essentially flat from 1Q’12 as $1.8 billion of inflows were largely offset by foreign currency
translation from our euro denominated CLOs, as well as the deleveraging of
certain CLO vehicles. Fund returns remained solid despite volatile
markets: •
Hedge Funds
(1)
were down 0.8% net for the quarter and up 2.8% net year-to-date.
•
Mezzanine Funds
(1)
were up 4.2% net for the quarter and up 9.5% net year-to-date.
•
Rescue Lending Funds
(1)
were up 2.3% net for the quarter and up 7.3% net year-to-date.
Deployed $260 million of LP capital in our Mezzanine Funds and $177 million in
our Rescue Lending Funds. $51 billion
2Q’12 Total AUM
Customized Credit
Strategies
(3)
Rescue
Lending
Mezzanine
Funds
Hedge Fund
Strategies
(1)
Represents weighted average returns for the respective flagship funds.
(2)
2Q’12 includes $9.6 billion of Total AUM and $9.4 billion of Fee-Earning AUM from the
January 5, 2012 acquisition of Harbourmaster. (3)
Includes CLOs, permanent capital vehicles, commingled funds and separately managed accounts.
(Dollars in Thousands)
2Q'11
1Q'12
2Q'12
vs. 2Q'11
vs. 1Q'12
Fee Revenues
59,019
$
87,700
$
90,354
$
53%
3%
Performance Fees
30,108
83,257
39,466
31%
(53)%
Investment Income (Loss)
8,673
9,894
(3,518)
n/m
n/m
Total Revenues
97,800
180,851
126,302
29%
(30)%
Compensation
33,071
37,143
42,845
30%
15%
Performance Fee Compensation
12,839
39,450
12,993
1%
(67)%
Other Operating Expenses
10,226
17,096
15,749
54%
(8)%
Total Expenses
56,136
93,689
71,587
28%
(24)%
Economic Income
41,664
$
87,162
$
54,715
$
31%
(37)%
Total AUM
(2)
33,791,093
50,776,119
50,519,383
50%
(1)%
Fee-Earning AUM
(2)
28,059,457
41,746,577
41,849,767
49%
0%
% Change
6 |
 Blackstone
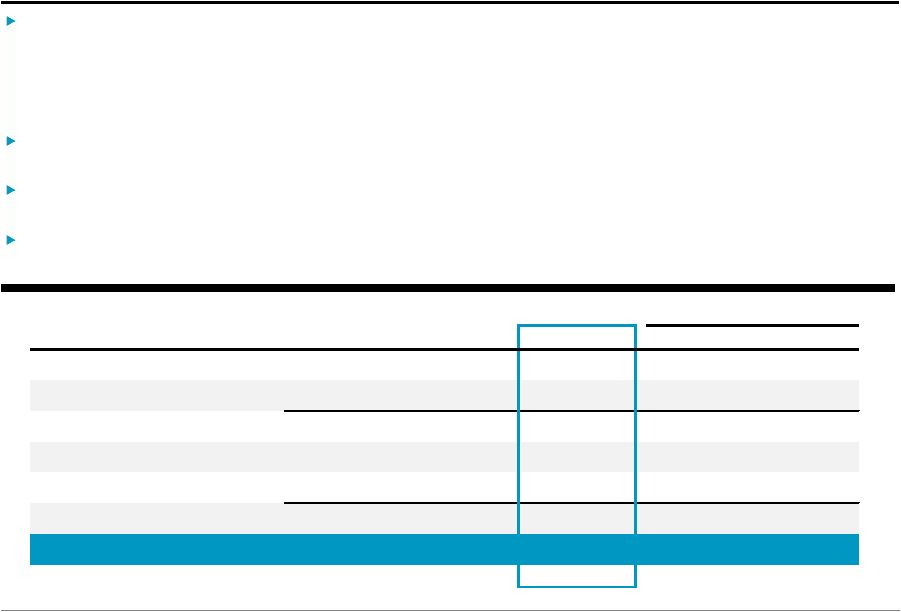
Financial Advisory
Fee Revenues of $95 million were up 23% from the first quarter of this year as
both our strategic advisory and restructuring businesses experienced
increases in closed deals in contrast to the markets in general and a relative
slow first quarter of this year.
•
Revenues
were
down
year-over-year
largely
due
to
a
very
strong
quarter
for
strategic
advisory
in
the
second
quarter of 2011.
The Restructuring group has had a strong 2012 as evidenced by its #1 ranking for
worldwide completed restructurings in the Thomson Reuters league tables
for the first half of 2012. While the M&A environment generally
remains weak, Blackstone’s 2012 backlog is healthy, with deal activity in
line with the same period last year.
Park Hill’s pipeline is robust as fundraising market conditions are
challenged and placement services are in high demand; the softness this
quarter reflected more timing than recurring activity levels. (Dollars in
Thousands) 2Q'11
1Q'12
2Q'12
vs. 2Q'11
vs. 1Q'12
Fee Revenues
104,209
$
77,635
$
95,187
$
(9)%
23%
Investment Income
211
534
482
n/m
(10)%
Total Revenues
104,420
78,169
95,669
(8)%
22%
Compensation
72,363
67,960
61,129
(16)%
(10)%
Other Operating Expenses
19,967
20,686
25,702
29%
24%
Total Expenses
92,330
88,646
86,831
(6)%
(2)%
Economic Income (Loss)
12,090
$
(10,477)
$
8,838
$
(27)%
n/m
% Change
7 |
 Blackstone
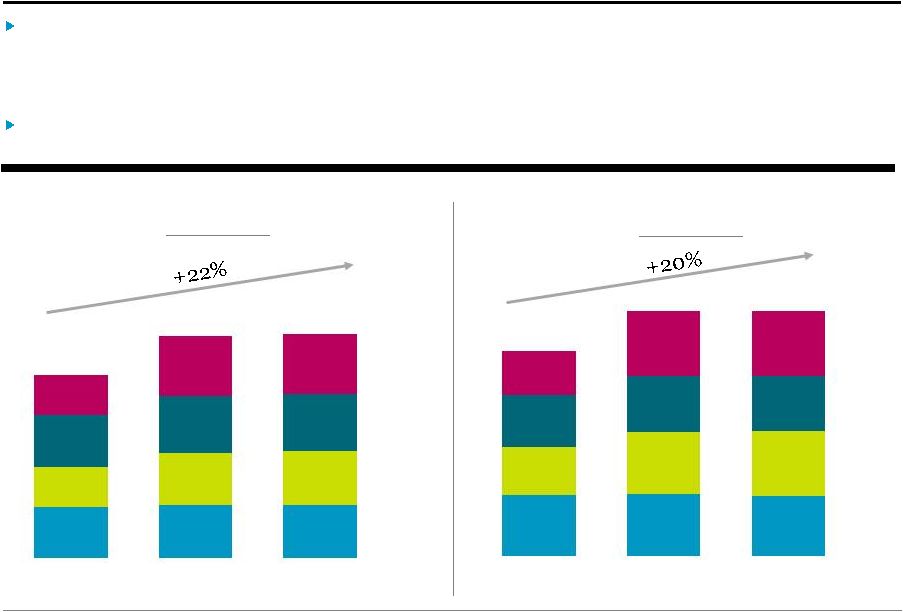
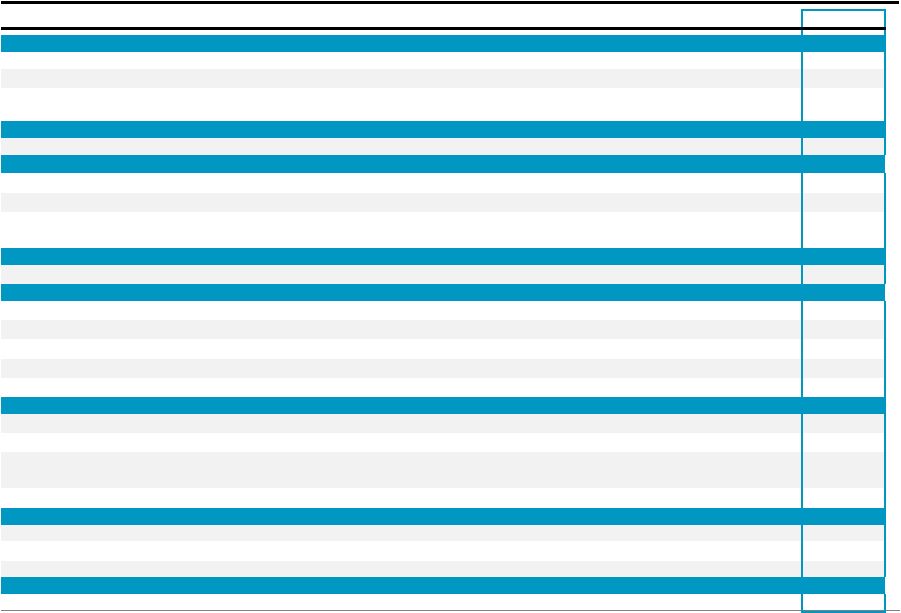
Assets Under Management
Fee-Earning
AUM
reached
a
record
$158
billion
in
the
second
quarter,
up 22% over the same period last year, as
$44 billion of gross inflows (including $10 billion from the Harbourmaster
acquisition) more than offset $13 billion of capital returned to investors
over the same period. •
Including commitments, not yet earning fees, Blackstone’s Fee-Earning
AUM would have been $169 billion. Total Assets Under Management increased
20% year-over-year to $190 billion up slightly from last quarter.
Fee-Earning AUM by Segment
(Dollars in Billions)
$129.0
$156.3
$157.6
Total AUM by Segment
(Dollars in Billions)
$158.7
$190.1
$190.3
Credit
Businesses
Hedge Fund
Solutions
Real
Estate
Private
Equity
Credit
Businesses
Hedge Fund
Solutions
Real
Estate
Private
Equity
Totals may not add due to rounding.
$35.8
$37.3
$37.2
$27.9
$36.6
$38.5
$37.2
$40.5
$40.2
$28.1
$41.7
$41.8
2Q'11
1Q'12
2Q'12
$46.7
$47.6
$46.6
$37.6
$48.3
$50.2
$40.6
$43.4
$42.9
$33.8
$50.8
$50.5
2Q'11
1Q'12
2Q'12
8 |
 Blackstone
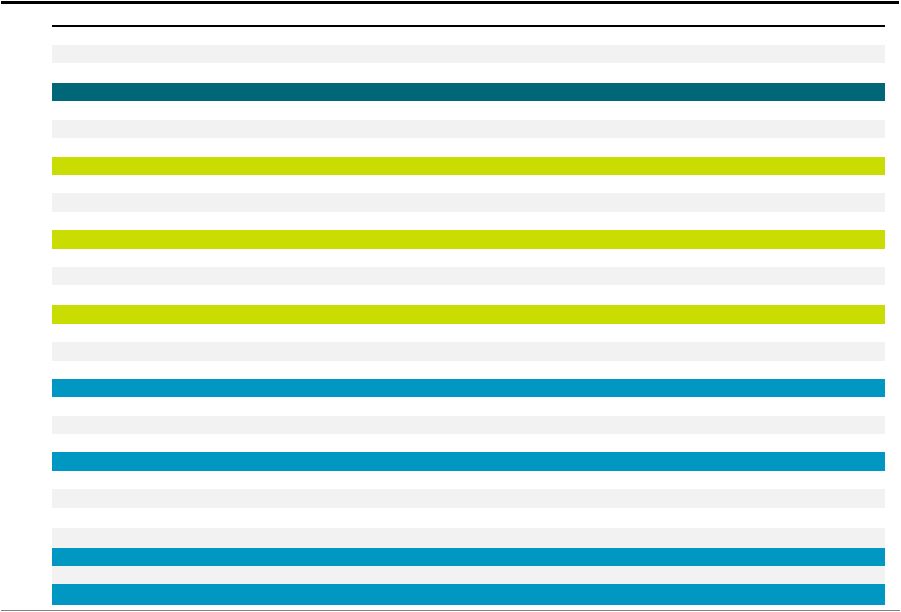
2Q’12 Available Capital Summary
$36 billion Dry Powder
(1)
Credit
Businesses
Hedge Fund
Solutions
Private
Equity
Real
Estate
Currently Earning
Performance Fees
Invested/Committed Not Yet
Earning Performance Fees
To Be Invested
(3)
$12 billion Not Yet Earning
Base Management Fees
(2)
$121 billion Performance
Fee Eligible AUM
Substantial levels of Dry Powder with $36 billion at the end of the second
quarter. $12 billion of Total AUM was not yet earning base management fees
at the end of the quarter due largely to fund structures where fees are
triggered by the deployment of capital. $121 billion of Performance Fee
Eligible AUM, including $49 billion currently earning Performance Fees. (1)
Represents illiquid drawdown funds only; excludes marketable vehicles; includes both
Fee-Earning (third party) capital and GP/employee commitments which do not earn fees. Amounts reduced by outstanding
commitments to invest, but for which capital has not been called.
(2)
Represents
(i)
committed
uninvested
capital
of
our
Private
Equity
and
Real
Estate
drawdown
funds
with
closed
investment
periods,
and (ii) committed uninvested capital for our Real Estate debt strategies
drawdown funds, our Credit Businesses Mezzanine and Rescue Lending funds and our Hedge Fund
Solutions Strategic Alliance Fund. (3)
Represents performance fee eligible Dry Powder.
Credit
Businesses
Hedge Fund
Solutions
Real
Estate
Private
Equity
$16.4
$12.3
$1.5
$5.6
$2.9
$2.0
$1.4
$5.4
$49.1
$37.7
$34.0
9 |
 Blackstone
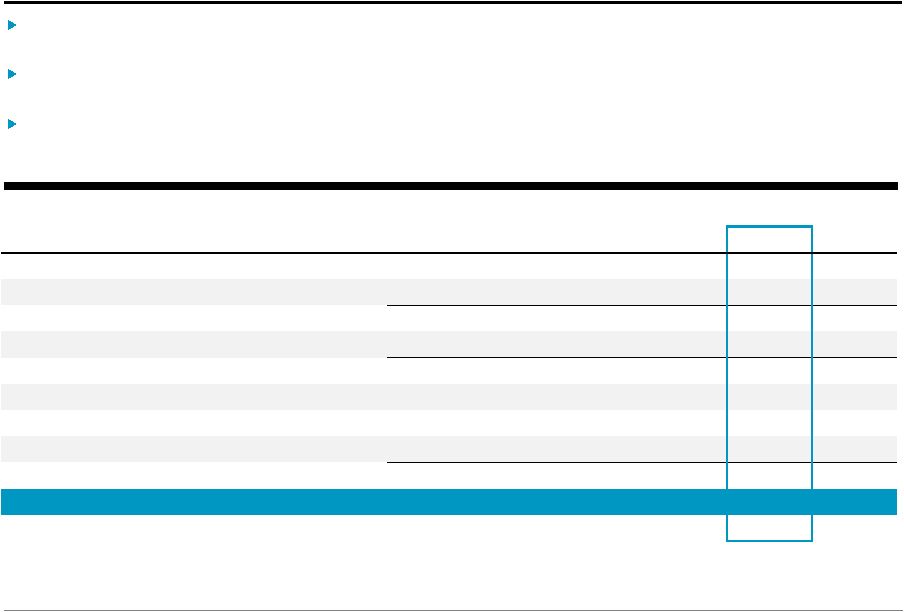
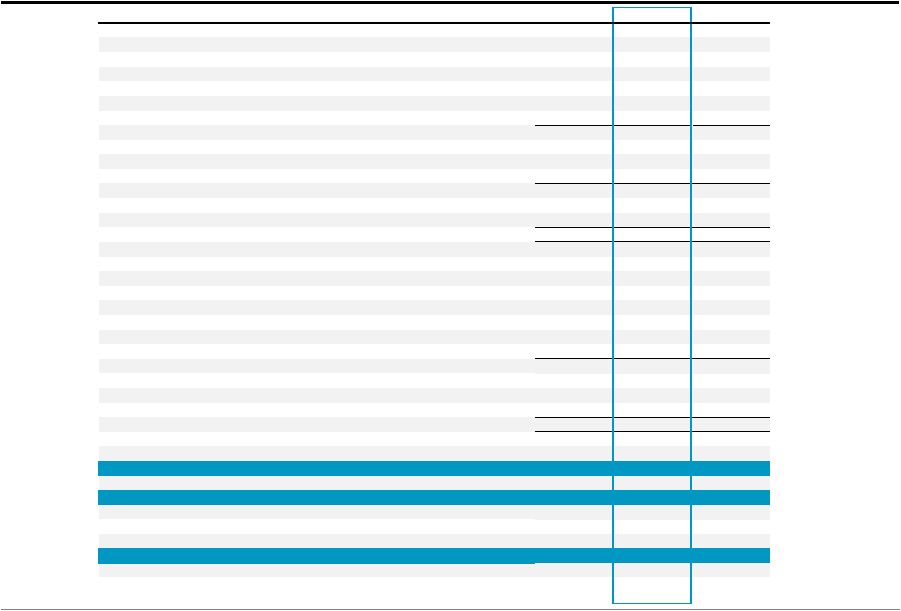
Distribution Calculation
Declared a quarterly distribution of $0.10 per common unit to record holders at
the close of business on August 15, 2012; payable on August 31, 2012.
Generated $0.26 per common unit in the first two quarters of 2012 after retained
capital relating to gains on Blackstone’s own balance sheet
investments. Blackstone currently pays $0.10 per unit for the first three
quarters of the year and any excess net of retained capital for the fourth
quarter. 10
(1)
Pre-Tax DE represents Distributable Earnings before the deduction for Payable under the
Tax Receivable Agreement and tax expense (benefit) of wholly-owned subsidiaries.
(2)
Per Unit calculations are based Total Common Units Outstanding (see Appendix – Unit
Rollforward); actual distributions are paid to applicable unitholders as of the record date.
(Dollars in Thousands, Except per Unit Data)
2Q'11
3Q'11
4Q'11
1Q'12
2Q'12
YTD
Distributable Earnings ("DE")
190,878
$
125,745
$
178,186
$
162,121
$
188,404
$
350,525
$
Add: Other Payables Attributable to Common Unitholders
13,564
10,581
5,859
100
10,284
10,384
Pre-Tax DE
(1)
204,442
136,326
184,045
162,221
198,688
360,909
Less: Retained Capital
(29,321)
(29,129)
(15,501)
(29,833)
(26,691)
(56,524)
Pre-Tax DE Available for Distribution
175,121
107,197
168,544
132,388
171,997
304,385
% to Common Unitholders
44%
44%
45%
46%
47%
47%
Pre-Tax DE Available for Distribution to Common Unitholders
76,838
47,430
75,640
61,017
81,365
142,382
Less: Other Payables Attributable to Common Unitholders
(13,564)
(10,581)
(5,859)
(100)
(10,284)
(10,384)
Net Cash Available for Distribution to Common Unitholders
63,274
$
36,849
$
69,781
$
60,917
$
71,081
$
131,998
$
Per Common Unit
(2)
0.13
$
0.08
$
0.14
$
0.12
$
0.14
$
0.26
$
Actual Distribution per Common Unit
0.10
$
0.10
$
0.22
$
0.10
$
0.10
$
0.20
$ |
 Blackstone
11
Balance Sheet Highlights
(1)
At June 30, 2012, Blackstone had $1.2 billion in cash and treasury cash management
strategies. Long-term debt of $1.0 billion from the 2009 and 2010 bond
issuances. On July 13, 2012, Blackstone amended its credit facility to
extend the maturity to July 2017 and increase the facility size to $1.1
billion from $1.02 billion; there are currently no borrowings outstanding against the facility.
(Dollars in Millions)
2Q’12
Cash and Cash Equivalents
$
413
Treasury Cash Management Strategies
807
Liquid Investments
(2)
132
Illiquid Investments
(3)
2,013
Net Performance Fees
1,756
Total Net Value
$
5,121
Outstanding Bonds (at par)
(4)
$
1,000
A/A+
rated by S&P / Fitch
$1.02 billion
undrawn credit revolver
$1.4 billion
total cash and liquid investments
$4.61
Net Performance
Fees
Treasury Cash
and Liquids
Private Equity
Real Estate
Other
Cash and Investments per Unit
$1.81
Illiquids
$5.1 billion
total net value
$1.22
$0.85
$0.74
$0.22
$1.58
(1) Preliminary.
(2) Primarily Blackstone investments in Hedge Fund Solutions and non-drawdown Credit Businesses. (3) Illiquids include Blackstone investments in all drawdown funds in
Private Equity, Real Estate and Credit Businesses. (4) $600M Bond issued
in August 2009 maturing on August 15, 2019 (6.625% coupon) and $400M Bond issued in September 2010 maturing on March 15, 2021 (5.875% coupon). |
 Blackstone
12
GAAP Statement of Operations
(Dollars in Thousands, Except per Unit Data) (Unaudited)
2Q'11
2Q'12
% Change
Revenues
Management and Advisory Fees, Net
498,040
$
488,048
$
(2)%
Performance Fees
Realized Carried Interest
42,750
55,929
31%
Realized Incentive Fees
19,012
11,631
(39)%
Unrealized Carried Interest
611,159
84,290
(86)%
Unrealized Incentive Fees
(670)
(16,436)
n/m
Total Performance Fees
672,251
135,414
(80)%
Investment Income (Loss)
Realized
19,303
5,758
(70)%
Unrealized
108,711
(10,519)
n/m
Total Investment Income (Loss)
128,014
(4,761)
n/m
Interest and Dividend Revenue
8,848
9,267
5%
Other
1,128
(765)
n/m
Total Revenues
1,308,281
627,203
(52)%
Expenses
Compensation and Benefits
Compensation
699,432
533,367
(24)%
Performance Fee Compensation
Realized Carried Interest
18,676
7,898
(58)%
Realized Incentive Fees
9,036
5,576
(38)%
Unrealized Carried Interest
123,714
36,815
(70)%
Unrealized Incentive Fees
(5,616)
(9,595)
(71)%
Total Compensation and Benefits
845,242
574,061
(32)%
General, Administrative and Other
126,118
135,737
8%
Interest Expense
14,185
13,773
(3)%
Fund Expenses
(714)
16,248
n/m
Total Expenses
984,831
739,819
(25)%
Other Income
Net Gains from Fund Investment Activities
(74,654)
248,230
n/m
Income Before Provision for Taxes
248,796
$
135,614
$
(45)%
Provision for Taxes
64,199
41,337
(36)%
Net Income
184,597
$
94,277
$
(49)%
Net Loss Attributable to Redeemable Non-Controlling Interests in Consolidated
Entities (140)
(21,071)
n/m
Net Income (Loss) Attributable to Non-Controlling Interests in Consolidated Entities
(92,408)
243,339
n/m
Net Income (Loss) Attributable to Non-Controlling Interests in Blackstone Holdings
190,908
(53,027)
n/m
Net Income (Loss) Attributable to The Blackstone Group L.P.
86,237
$
(74,964)
$
n/m
Net Income (Loss) per Common Unit, Basic and Diluted
0.18
$
(0.14)
$
n/m |
 Appendix |
 Blackstone
14
Total Segments
(1)
Transaction and Other Fees, Net, are net of amounts, if any, shared with limited partners
including, for Private Equity, broken deal expenses. (2)
Primarily placement fees.
2Q'12 vs. 2Q'11
(Dollars in Thousands)
2Q'11
3Q'11
4Q'11
1Q'12
2Q'12
$
%
Revenues
Management and Advisory Fees, Net
Base Management Fees
316,474
$
322,371
$
336,753
$
395,506
$
381,344
$
64,870
$
20%
Advisory Fees
102,243
86,178
123,567
75,846
93,372
(8,871)
(9)%
Transaction and Other Fees, Net
(1)
103,561
41,793
43,796
38,471
49,453
(54,108)
(52)%
Management Fee Offsets
(2)
(8,675)
(7,703)
(8,479)
(13,050)
(7,973)
702
8%
Total Management and Advisory Fees, Net
513,603
442,639
495,637
496,773
516,196
2,593
1%
Performance Fees
Realized Carried Interest
42,752
(9,633)
12,387
13,560
55,929
13,177
31%
Realized Incentive Fees
17,463
17,530
51,837
5,279
11,692
(5,771)
(33)%
Unrealized Carried Interest
611,157
(382,949)
311,162
298,796
84,290
(526,867)
(86)%
Unrealized Incentive Fees
1,686
(82,227)
(17,436)
68,121
(17,074)
(18,760)
n/m
Total Performance Fees
673,058
(457,279)
357,950
385,756
134,837
(538,221)
(80)%
Investment Income (Loss)
Realized
30,732
31,647
16,697
23,492
9,360
(21,372)
(70)%
Unrealized
106,837
(165,753)
39,028
59,914
(25,624)
(132,461)
n/m
Total Investment Income (Loss)
137,569
(134,106)
55,725
83,406
(16,264)
(153,833)
n/m
Interest Income and Dividend Revenue
9,283
10,110
10,003
9,345
10,391
1,108
12%
Other
1,128
(1,667)
5,695
(1,207)
(828)
(1,956)
n/m
Total Revenues
1,334,641
(140,303)
925,010
974,073
644,332
(690,309)
(52)%
Expenses
Compensation
272,392
238,207
225,438
254,772
268,884
(3,508)
(1)%
Performance Fee Compensation
Realized Carried Interest
18,675
(1,835)
13,206
7,938
7,899
(10,776)
(58)%
Realized Incentive Fees
9,036
12,378
33,524
4,252
5,575
(3,461)
(38)%
Unrealized Carried Interest
123,713
(74,123)
62,399
84,543
36,815
(86,898)
(70)%
Unrealized Incentive Fees
(5,616)
(37,312)
(14,401)
12,779
(9,596)
(3,980)
(71)%
Total Compensation and Benefits
418,200
137,315
320,166
364,284
309,577
(108,623)
(26)%
Other Operating Expenses
99,363
96,932
122,072
109,521
113,038
13,675
14%
Total Expenses
517,563
234,247
442,238
473,805
422,615
(94,948)
(18)%
Economic Income (Loss)
817,078
$
(374,550)
$
482,772
$
500,268
$
221,717
$
(595,361)
$
(73)%
Economic Net Income
804,181
$
(379,999)
$
468,154
$
491,217
$
212,349
$
(591,832)
$
(74)%
Fee Related Earnings
156,297
$
112,932
$
166,096
$
146,928
$
145,729
$
(10,568)
$
(7)%
Distributable Earnings
190,878
$
125,745
$
178,186
$
162,121
$
188,404
$
(2,474)
$
(1)%
Total Assets Under Management
158,703,173
157,698,448
166,228,504
190,074,167
190,267,831
31,564,658
20%
Fee-Earning Assets Under Management
129,001,206
132,934,377
136,756,753
156,261,446
157,646,521
28,645,315
22%
Weighted Average Fee-Earning AUM
126,636,310
131,458,996
136,876,758
154,354,070
156,426,744
29,790,434
24%
LP Capital Invested
3,654,820
4,753,161
3,406,264
2,719,433
2,403,624
(1,251,196)
(34)%
Total Capital Invested
3,856,171
5,012,262
3,992,488
2,806,886
2,525,648
(1,330,523)
(35)% |
 Blackstone
15
Private Equity
(1)
Transaction and Other Fees, Net, are net of amounts, if any, shared with limited partners
including, for Private Equity, broken deal expenses. (2)
Primarily placement fees.
2Q'12 vs. 2Q'11
(Dollars in Thousands)
2Q'11
3Q'11
4Q'11
1Q'12
2Q'12
$
%
Revenues
Management Fees, Net
Base Management Fees
82,297
$
85,534
$
84,231
$
85,789
$
87,475
$
5,178
$
6%
Transaction
and
Other
Fees,
Net
(1)
52,353
21,430
23,879
18,097
14,951
(37,402)
(71)%
(7,629)
(6,498)
(5,057)
(3,782)
(672)
6,957
91%
Total Management Fees, Net
127,021
100,466
103,053
100,104
101,754
(25,267)
(20)%
Performance Fees
Realized Carried Interest
1,362
(17,966)
(28,392)
3,933
28,781
27,419
n/m
Unrealized Carried Interest
187,190
(270,014)
83,777
34,051
(87,893)
(275,083)
n/m
Total Performance Fees
188,552
(287,980)
55,385
37,984
(59,112)
(247,664)
n/m
Investment Income (Loss)
Realized
3,021
20,548
3,512
13,911
(6,195)
(9,216)
n/m
Unrealized
76,947
(121,688)
25,091
16,469
(28,337)
(105,284)
n/m
Total Investment Income (Loss)
79,968
(101,140)
28,603
30,380
(34,532)
(114,500)
n/m
Interest Income and Dividend Revenue
3,197
3,396
3,651
2,420
3,114
(83)
(3)%
Other
665
141
193
(215)
562
(103)
(15)%
Total Revenues
399,403
(285,117)
190,885
170,673
11,786
(387,617)
(97)%
Expenses
Compensation
64,633
52,388
45,611
52,547
53,775
(10,858)
(17)%
Performance Fee Compensation
Realized Carried Interest
49
(2,443)
(3,859)
320
804
755
n/m
Unrealized Carried Interest
29,309
(44,955)
7,953
(1,052)
(8,259)
(37,568)
n/m
Total Compensation and Benefits
93,991
4,990
49,705
51,815
46,320
(47,671)
(51)%
Other Operating Expenses
30,124
27,588
34,493
28,881
30,521
397
1%
Total Expenses
124,115
32,578
84,198
80,696
76,841
(47,274)
(38)%
Economic Income (Loss)
275,288
$
(317,695)
$
106,687
$
89,977
$
(65,055)
$
(340,343)
$
n/m
Total Assets Under Management
46,728,301
42,967,159
45,863,673
47,624,013
46,633,552
(94,749)
(0)%
Fee-Earning Assets Under Management
35,778,240
37,006,024
37,237,791
37,323,635
37,159,452
1,381,212
4%
Weighted Average Fee-Earning AUM
35,734,164
36,670,087
37,147,118
37,491,735
37,434,520
1,700,356
5%
LP Capital Invested
667,341
1,377,715
1,093,745
643,044
102,899
(564,442)
(85)%
Total Capital Invested
697,543
1,458,103
1,563,912
680,035
108,977
(588,566)
(84)%
Management
Fee
Offsets
(2) |
 Blackstone
16
Real Estate
(1)
Transaction and Other Fees, Net, are net of amounts, if any, shared with limited
partners. (2)
Primarily placement fees.
2Q'12 vs. 2Q'11
(Dollars in Thousands)
2Q'11
3Q'11
4Q'11
1Q'12
2Q'12
$
%
Revenues
Management Fees, Net
Base Management Fees
97,467
$
97,925
$
103,947
$
147,802
$
127,817
$
30,350
$
31%
49,288
19,551
19,128
14,412
25,151
(24,137)
(49)%
(745)
(880)
(2,820)
(8,627)
(5,357)
(4,612)
n/m
Total Management Fees, Net
146,010
116,596
120,255
153,587
147,611
1,601
1%
Performance Fees
Realized Carried Interest
11,798
5,137
3,538
8,617
13,539
1,741
15%
Realized Incentive Fees
9,034
171
202
(1)
7,766
(1,268)
(14)%
Unrealized Carried Interest
433,280
(119,192)
237,884
221,500
144,510
(288,770)
(67)%
Unrealized Incentive Fees
(3,822)
(984)
1,806
7,914
(1,526)
2,296
60%
Total Performance Fees
450,290
(114,868)
243,430
238,030
164,289
(286,001)
(64)%
Investment Income (Loss)
Realized
11,394
7,313
6,346
7,812
9,067
(2,327)
(20)%
Unrealized
37,332
(26,060)
19,970
25,912
14,944
(22,388)
(60)%
Total Investment Income (Loss)
48,726
(18,747)
26,316
33,724
24,011
(24,715)
(51)%
Interest Income and Dividend Revenue
2,989
3,195
3,430
2,552
3,277
288
10%
Other
515
(1,390)
(1,046)
(709)
(590)
(1,105)
n/m
Total Revenues
648,530
(15,214)
392,385
427,184
338,598
(309,932)
(48)%
Expenses
Compensation
70,651
54,986
53,507
68,889
76,576
5,925
8%
Performance Fee Compensation
Realized Carried Interest
5,095
2,169
1,713
4,077
3,401
(1,694)
(33)%
Realized Incentive Fees
4,287
82
91
2
3,871
(416)
(10)%
Unrealized Carried Interest
92,392
(30,076)
57,866
54,275
31,677
(60,715)
(66)%
Unrealized Incentive Fees
(1,371)
(434)
(632)
3,768
(629)
742
54%
Total Compensation and Benefits
171,054
26,727
112,545
131,011
114,896
(56,158)
(33)%
Other Operating Expenses
22,971
23,495
29,027
28,924
26,560
3,589
16%
Total Expenses
194,025
50,222
141,572
159,935
141,456
(52,569)
(27)%
Economic Income (Loss)
454,505
$
(65,436)
$
250,813
$
267,249
$
197,142
$
(257,363)
$
(57)%
Total Assets Under Management
37,605,560
40,709,500
42,852,669
48,322,760
50,225,950
12,620,390
34%
Fee-Earning Assets Under Management
27,919,000
29,981,920
31,236,540
36,647,462
38,476,123
10,557,123
38%
Weighted Average Fee-Earning AUM
26,747,354
28,701,420
31,474,333
35,983,336
36,882,087
10,134,733
38%
LP Capital Invested
2,785,188
1,706,157
995,643
1,143,555
1,855,109
(930,079)
(33)%
Total Capital Invested
2,938,859
1,805,654
1,064,690
1,172,883
1,954,731
(984,128)
(33)%
Transaction
and
Other
Fees,
Net
(1)
Management
Fee
Offsets
(2) |
 Blackstone
17
Hedge Fund Solutions
2Q'12 vs. 2Q'11
(Dollars in Thousands)
2Q'11
3Q'11
4Q'11
1Q'12
2Q'12
$
%
Revenues
Management Fees, Net
Base Management Fees
79,290
$
79,355
$
81,606
$
81,821
$
84,278
$
4,988
$
6%
Transaction and Other Fees, Net
(1)
861
740
470
92
65
(796)
(92)%
Management Fee Offsets
(2)
(196)
(258)
(402)
(335)
(375)
(179)
(91)%
Total Management Fees, Net
79,955
79,837
81,674
81,578
83,968
4,013
5%
Performance Fees
Realized Incentive Fees
667
5,764
4,148
3,298
1,175
508
76%
Unrealized Incentive Fees
3,441
(19,861)
(2,059)
23,187
(10,981)
(14,422)
n/m
Total Performance Fees
4,108
(14,097)
2,089
26,485
(9,806)
(13,914)
n/m
Investment Income (Loss)
Realized
12,855
1,023
2,503
503
929
(11,926)
(93)%
Unrealized
(12,864)
(10,034)
(3,253)
8,371
(3,636)
9,228
72%
Total Investment Income (Loss)
(9)
(9,011)
(750)
8,874
(2,707)
(2,698)
n/m
Interest Income and Dividend Revenue
472
500
537
386
495
23
5%
Other
(38)
18
7,818
(127)
27
65
n/m
Total Revenues
84,488
57,247
91,368
117,196
71,977
(12,511)
(15)%
Expenses
Compensation
31,674
30,667
38,525
28,233
34,559
2,885
9%
Performance Fee Compensation
Realized Incentive Fees
253
2,257
688
1,378
(345)
(598)
n/m
Unrealized Incentive Fees
2,955
(7,214)
(865)
7,294
(2,820)
(5,775)
n/m
Total Compensation and Benefits
34,882
25,710
38,348
36,905
31,394
(3,488)
(10)%
Other Operating Expenses
16,075
14,421
21,568
13,934
14,506
(1,569)
(10)%
Total Expenses
50,957
40,131
59,916
50,839
45,900
(5,057)
(10)%
Economic Income
33,531
$
17,116
$
31,452
$
66,357
$
26,077
$
(7,454)
$
(22)%
Total Assets Under Management
40,578,219
40,373,092
40,534,768
43,351,275
42,888,946
2,310,727
6%
Fee-Earning Assets Under Management
37,244,509
37,231,013
37,819,636
40,543,772
40,161,179
2,916,670
8%
Weighted Average Fee-Earning AUM
36,993,058
37,658,240
38,452,740
39,904,474
40,528,701
3,535,643
10%
LP Capital Invested
49,409
354,971
288,237
4,661
-
(49,409)
(100)%
Total Capital Invested
55,393
375,000
304,500
5,502
-
(55,393)
(100)%
(1)
(2)
Transaction and Other Fees, Net, are net of amounts, if any, shared with limited partners.
Primarily placement fees. |
 Blackstone
18
Credit Businesses
(1)
Transaction and Other Fees, Net, are net of amounts, if any, shared with limited
partners. (2)
Primarily placement fees.
2Q'12 vs. 2Q'11
(Dollars in Thousands)
2Q'11
3Q'11
4Q'11
1Q'12
2Q'12
$
%
Revenues
Management Fees, Net
Base Management Fees
57,420
$
59,557
$
66,969
$
80,094
$
81,774
$
24,354
$
42%
Transaction
and
Other
Fees,
Net
(1)
849
(26)
312
5,725
9,184
8,335
n/m
Management
Fee
Offsets
(2)
(105)
(67)
(200)
(306)
(1,569)
(1,464)
n/m
Total Management Fees, Net
58,164
59,464
67,081
85,513
89,389
31,225
54%
Performance Fees
Realized Carried Interest
29,592
3,196
37,241
1,010
13,609
(15,983)
(54)%
Realized Incentive Fees
7,762
11,595
47,487
1,982
2,751
(5,011)
(65)%
Unrealized Carried Interest
(9,313)
6,257
(10,499)
43,245
27,673
36,986
n/m
Unrealized Incentive Fees
2,067
(61,382)
(17,183)
37,020
(4,567)
(6,634)
n/m
Total Performance Fees
30,108
(40,334)
57,046
83,257
39,466
9,358
31%
Investment Income (Loss)
Realized
3,236
2,807
4,021
683
5,638
2,402
74%
Unrealized
5,437
(7,800)
(2,877)
9,211
(9,156)
(14,593)
n/m
Total Investment Income (Loss)
8,673
(4,993)
1,144
9,894
(3,518)
(12,191)
n/m
Interest Income and Dividend Revenue
902
1,404
610
2,425
1,752
850
94%
Other
(47)
(132)
(772)
(238)
(787)
(740)
n/m
Total Revenues
97,800
15,409
125,109
180,851
126,302
28,502
29%
Expenses
Compensation
33,071
40,533
25,435
37,143
42,845
9,774
30%
Performance Fee Compensation
Realized Carried Interest
13,531
(1,561)
15,352
3,541
3,694
(9,837)
(73)%
Realized Incentive Fees
4,496
10,039
32,745
2,872
2,049
(2,447)
(54)%
Unrealized Carried Interest
2,012
908
(3,420)
31,320
13,397
11,385
n/m
Unrealized Incentive Fees
(7,200)
(29,664)
(12,904)
1,717
(6,147)
1,053
15%
Total Compensation and Benefits
45,910
20,255
57,208
76,593
55,838
9,928
22%
Other Operating Expenses
10,226
11,210
13,162
17,096
15,749
5,523
54%
Total Expenses
56,136
31,465
70,370
93,689
71,587
15,451
28%
Economic Income (Loss)
41,664
$
(16,056)
$
54,739
$
87,162
$
54,715
$
13,051
$
31%
Total Assets Under Management
33,791,093
33,648,697
36,977,394
50,776,119
50,519,383
16,728,290
50%
Fee-Earning Assets Under Management
28,059,457
28,715,420
30,462,786
41,746,577
41,849,767
13,790,310
49%
Weighted Average Fee-Earning AUM
27,161,734
28,429,249
29,802,567
40,974,525
41,581,436
14,419,702
53%
LP Capital Invested
152,882
1,314,318
1,028,639
928,173
445,616
292,734
n/m
Total Capital Invested
164,376
1,373,505
1,059,386
948,466
461,940
297,564
n/m |
 Blackstone
19
Financial Advisory
2Q'12 vs. 2Q'11
(Dollars in Thousands)
2Q'11
3Q'11
4Q'11
1Q'12
2Q'12
$
%
Revenues
Advisory Fees
102,243
$
86,178
$
123,567
$
75,846
$
93,372
$
(8,871)
$
(9)%
Transaction and Other Fees, Net
210
98
7
145
102
(108)
(51)%
Total Advisory and Transaction Fees
102,453
86,276
123,574
75,991
93,474
(8,979)
(9)%
Investment Income (Loss)
Realized
226
(44)
315
583
(79)
(305)
n/m
Unrealized
(15)
(171)
97
(49)
561
576
n/m
Total Investment Income (Loss)
211
(215)
412
534
482
271
n/m
Interest Income and Dividend Revenue
1,723
1,615
1,775
1,562
1,753
30
2%
Other
33
(304)
(498)
82
(40)
(73)
n/m
Total Revenues
104,420
87,372
125,263
78,169
95,669
(8,751)
(8)%
Expenses
Compensation
72,363
59,633
62,360
67,960
61,129
(11,234)
(16)%
Total Compensation and Benefits
72,363
59,633
62,360
67,960
61,129
(11,234)
(16)%
Other Operating Expenses
19,967
20,218
23,822
20,686
25,702
5,735
29%
Total Expenses
92,330
79,851
86,182
88,646
86,831
(5,499)
(6)%
Economic Income (Loss)
12,090
$
7,521
$
39,081
$
(10,477)
$
8,838
$
(3,252)
$
(27)% |
 Blackstone
20
Fee-Earning AUM Net Flows
Fee-Earning AUM was up $1.4 billion from last quarter and up $28.6 billion or
22% from last year despite market losses and the negative impact of foreign
currency translation. Real Estate up 38% over the last year, including
capital committed to our latest global buyout fund. Hedge Fund Solutions
continued its solid growth with just under $8 billion of gross inflows over the last twelve
months.
Credit
Businesses’
strong
growth
continued,
up
49%
from
the
same
period
last
year,
including
$9.4
billion
related
to
the first quarter 2012 acquisition of Harbourmaster.
2Q’12 Fee-Earning AUM Rollforward
(Dollars in Millions)
LTM Fee-Earning AUM Rollforward
(Dollars in Millions)
(1)
Inflows: include contributions, capital raised, other increases in available
capital, purchases and acquisitions (2)
Outflows: represent redemptions, client withdrawals and decreases in available
capital (3)
Realizations: represent realizations from the disposition of assets
(4)
Market Activity: gains/(losses) on portfolio investments and impact of foreign
exchange rate fluctuations Private
Real
Hedge Fund
Credit
Private
Real
Hedge Fund
Credit
Equity
Estate
Solutions
Businesses
Total
Equity
Estate
Solutions
Businesses
Total
1Q'12
37,324
$
36,647
$
40,544
$
41,747
$
156,261
$
2Q'11
35,778
$
27,919
$
37,245
$
28,059
$
129,001
$
Inflows
(1)
299
2,499
1,219
1,760
5,777
Inflows
(1)
2,807
14,471
7,689
18,904
43,871
Outflows
(2)
-
(61)
(775)
(825)
(1,662)
Outflows
(2)
(320)
(1,895)
(3,466)
(3,495)
(9,175)
Realizations
(3)
(456)
(447)
n/a
(133)
(1,036)
Realizations
(3)
(1,069)
(1,532)
n/a
(1,092)
(3,693)
Net Inflows / (Outflows)
(157)
1,991
444
801
3,079
Net Inflows
1,418
11,044
4,223
14,318
31,003
Market
Activity
(4)
(7)
(162)
(826)
(698)
(1,694)
Market
Activity
(4)
(37)
(487)
(1,306)
(527)
(2,358)
2Q'12
37,159
$
38,476
$
40,161
$
41,850
$
157,647
$
2Q'12
37,159
$
38,476
$
40,161
$
41,850
$
157,647
$
QoQ Inc / (Dec)
(0)%
5%
(1)%
0%
1%
YoY Inc
4%
38%
8%
49%
22% |
 Blackstone
21
Total AUM Net Flows
Total AUM roughly flat from last quarter and up $31.6 billion or
20% from last year despite the negative impact of foreign
currency translation.
Private Equity market appreciation down $1.9 billion over the last year, driven by
negative performance of our public portfolio.
Real Estate market appreciation up $2.9 billion over the last year as
fundamentals continue to improve. Credit Businesses’
strong growth continued, up 50% from the same period last year including the
final closing of its latest $4 billion Mezzanine fund and $9.6 billion
related to the first quarter 2012 acquisition of Harbourmaster. (1)
Inflows: include contributions, capital raised, other increases in available
capital, purchases and acquisitions (2)
Outflows: represent redemptions, client withdrawals and decreases in available
capital (3)
Realizations: represent realizations from the disposition of assets
(4)
Market Activity: gains/(losses) on portfolio investments and impact of foreign
exchange rate fluctuations 2Q’12 Total AUM Rollforward
(Dollars in Millions)
LTM Total AUM Rollforward
(Dollars in Millions)
Private
Real
Hedge Fund
Credit
Private
Real
Hedge Fund
Credit
Equity
Estate
Solutions
Businesses
Total
Equity
Estate
Solutions
Businesses
Total
1Q'12
47,624
$
48,323
$
43,351
$
50,776
$
190,074
$
2Q'11
46,728
$
37,606
$
40,578
$
33,791
$
158,703
$
Inflows
860
1,946
1,231
1,621
5,658
Inflows
5,457
12,656
7,360
22,608
48,080
Outflows
(2)
(69)
(823)
(1,170)
(2,064)
Outflows
(15)
(269)
(3,720)
(4,290)
(8,294)
Realizations
(403)
(861)
n/a
(188)
(1,452)
Realizations
(3,589)
(2,626)
n/a
(1,394)
(7,609)
Net Inflows
455
1,016
407
264
2,142
Net Inflows
1,853
9,760
3,640
16,923
32,177
Market
Activity
(1,445)
887
(870)
(520)
(1,948)
(1,948)
2,860
(1,329)
(195)
(612)
2Q'12
46,634
$
50,226
$
42,889
$
50,519
$
190,268
$
2Q'12
46,634
$
50,226
$
42,889
$
50,519
$
190,268
$
QoQ Inc / (Dec)
(2)%
4%
(1)%
(1)%
0%
YoY Inc / (Dec)
(0)%
34%
6%
50%
20%
Market
Activity
(1)
(2)
(3)
(4)
(1)
(2)
(3)
(4) |
 Blackstone
22
Net Accrued Performance Fees
(1)
Blackstone had $1.8 billion of accrued performance fees, net of compensation, as
of the end of the second quarter. Net Accrued Performance Fees
(2) (3)
(Dollars in Millions, Except per Unit Data)
1Q'12
2Q'12
Per Unit
(4)
Change vs. 1Q'12
Private Equity
BCP IV Carried Interest
586
$
532
$
0.48
$
(54)
$
Other Carried
Interest -
1
0.00
1
Total Private Equity
586
533
0.48
(53)
Real
Estate BREP V Carried Interest
314
377
0.34
63
BREP VI Carried Interest
496
530
0.48
34
BREP VII Carried Interest
15
22
0.02
7
BREP Int'l I Carried Interest
9
7
0.01
(2)
BREP EU III Carried Interest
39
53
0.05
14
BREDS Carried Interest
17
15
0.01
(2)
BREDS Incentive Fees
4
4
0.00
-
Asia
Platform Incentive Fees 24
27
0.02
3
Total Real Estate
918
1,035
0.93
117
Hedge Fund
Solutions Incentive Fees
21
12
0.01
(9)
Total Hedge Fund Solutions
21
12
0.01
(9)
Credit Businesses
Carried Interest
95
106
0.10
11
Incentive Fees
74
70
0.06
(4)
Total Credit Businesses
169
176
0.16
7
Total Blackstone
Carried Interest
1,571
1,643
1.48
72
Incentive Fees
123
113
0.10
(10)
Performance Fees
1,694
$
1,756
$
1.58
$
62
$
(1)
Preliminary.
(2)
Net Accrued Performance Fees are presented net of compensation and do not include
clawback amounts, if any, which are disclosed in the 10-Q/K.
(3)
Private Equity and Real Estate include Co-Investments.
(4)
Per Unit calculations are based on quarter-end Distributable Earnings Units Outstanding
(see Appendix – Unit Rollforward). |
 Blackstone
23
Investment
Records
as
of
June
30,
2012
(1)
Notes on next page.
Committed
Available
Unrealized Investments
Realized Investments
Total Investments
Net IRRs
(4)
(Dollars in Thousands, Except Where Noted)
Capital
Capital
(2)
Value
MOIC
(3)
% Public
Value
MOIC
(3)
Value
MOIC
(3)
Realized
Total
Private Equity
BCP I (Oct 1987 / Oct 1993)
859,081
$
-
$
-
$
n/a
-
1,741,738
$
2.6x
1,741,738
$
2.6x
19%
19%
BCP II (Oct 1993 / Aug 1997)
1,361,100
-
-
n/a
-
3,256,351
2.5x
3,256,351
2.5x
32%
32%
BCP III (Aug 1997 / Nov 2002)
3,973,378
167,776
20,150
0.5x
100%
9,160,904
2.3x
9,181,054
2.3x
14%
14%
Non-Contributed Funds
6,193,559
167,776
20,150
0.5x
100%
14,158,993
2.4x
14,179,143
2.4x
19%
19%
BCOM (Jun 2000 / Jun 2006)
2,137,330
202,433
420,861
0.5x
49%
2,407,519
1.8x
2,828,380
1.3x
18%
6%
BCP IV (Nov 2002 / Dec 2005)
6,773,138
293,165
4,966,740
1.7x
62%
14,253,335
3.1x
19,220,075
2.6x
60%
37%
BCP V (Dec 2005 / Jan 2011)
20,995,132
1,249,114
17,791,758
1.0x
16%
3,481,145
1.7x
21,272,904
1.1x
31%
1%
BCP
VI
(Jan2011
/
Jan
2016)
(5)
15,219,872
12,273,206
1,738,542
1.0x
2%
n/a
n/a
1,738,542
1.0x
n/a
n/m
BEP (Aug 2011 / Aug 2017)
(5)
1,493,971
595,115
349,006
1.0x
-
n/a
n/a
349,006
1.0x
n/a
n/m
Contributed Funds
46,619,443
14,613,033
25,266,907
1.1x
24%
20,141,999
2.5x
45,408,907
1.4x
44%
10%
Total Private Equity
52,813,002
$
14,780,809
$
25,287,057
$
1.1x
24%
34,300,992
$
2.5x
59,588,050
$
1.6x
23%
14%
Real Estate
Dollar
Pre-BREP
140,714
$
-
$
-
$
n/m
-
345,190
$
2.5x
345,190
$
2.5x
33%
33%
BREP I (Sep 1994 / Oct 1996)
380,708
-
-
n/m
-
1,327,708
2.8x
1,327,708
2.8x
40%
40%
BREP II (Oct 1996 / Mar 1999)
1,198,339
-
-
n/m
-
2,524,866
2.1x
2,524,866
2.1x
19%
19%
BREP III (Apr 1999 / Apr 2003)
1,522,708
-
2,161
0.1x
-
3,323,362
2.4x
3,325,523
2.3x
22%
21%
Non-Contributed Funds
3,242,469
-
2,161
0.1x
7,521,126
2.3x
7,523,287
2.3x
25%
25%
BREP IV (Apr 2003 / Dec 2005)
2,198,694
-
1,336,058
0.8x
6%
2,856,053
2.5x
4,192,111
1.5x
82%
14%
BREP V (Dec 2005 / Feb 2007)
5,538,579
243,769
6,967,522
1.5x
-
2,013,265
1.8x
8,980,787
1.6x
90%
9%
BREP VI (Feb 2007 / Aug 2011)
11,055,826
863,812
14,483,754
1.4x
5%
839,657
2.0x
15,323,411
1.4x
42%
9%
BREP VII (Aug 2011 / Feb 2017)
(6)
11,095,933
9,024,471
2,510,074
1.1x
-
122,580
1.2x
2,632,654
1.1x
81%
33%
BREDS Drawdown (Various)
2,707,949
736,212
2,220,735
1.1x
-
807,258
1.3x
3,027,993
1.2x
23%
13%
BREP
Co-Investment
(Various)
(7)
-
-
3,782,359
1.4x
1%
424,343
1.3x
4,206,702
1.4x
10%
11%
Contributed Funds
32,596,981
10,868,264
31,300,502
1.3x
2%
7,063,156
1.9x
38,363,658
1.4x
34%
10%
Total Dollar
35,839,450
$
10,868,264
$
31,302,663
$
1.3x
2%
14,584,282
$
2.1x
45,886,945
$
1.5x
27%
15%
Euro
BREP Int'l (Jan 2001 / Sep 2005)
824,172
€
-
€
106,093
€
1.1x
-
1,223,776
€
2.2x
1,329,869
€
2.0x
26%
23%
BREP Int'l II (Sep 2005 / Jun 2008)
1,626,942
82,162
1,150,816
0.9x
-
172,038
1.5x
1,322,854
1.0x
16%
(3)%
BREP Europe III (Jun 2008 / Dec 2013)
3,194,504
2,165,390
1,620,362
1.5x
-
15,712
2.8x
1,636,074
1.5x
49%
22%
Total Euro
5,645,618
€
2,247,552
€
2,877,271
€
1.2x
-
1,411,526
€
2.1x
4,288,797
€
1.4x
25%
8%
Total Real Estate
42,958,303
$
13,720,124
$
34,924,920
$
1.3x
2%
16,325,236
$
2.1x
51,250,156
$
1.5x
27%
14%
Credit Businesses
Mezzanine (Jul 2007 / Jul 2012)
6,120,000
$
3,264,616
$
3,759,438
$
1.2x
-
1,433,168
$
1.6x
5,192,605
$
1.3x
n/a
17%
Rescue Lending (May 2009 / May 2013)
3,253,143
1,325,640
2,519,227
1.2x
-
1,079,902
1.1x
3,599,129
1.2x
n/a
13%
Total Credit Businesses
9,373,143
$
4,590,256
$
6,278,665
$
1.2x
-
2,513,070
$
1.4x
8,791,734
$
1.2x
n/a
n/a |
 Blackstone
Investment
Records
as
of
June
30,
2012
–
Notes
The returns presented herein represent those of the applicable Blackstone Funds and not those of
The Blackstone Group L.P. n/m
n/a
(1)
Preliminary.
(2)
Available Capital represents total investable capital commitments, including
side-by-side, adjusted for certain expenses and expired or recallable capital,
less invested capital. This amount is not reduced by outstanding commitments to investments.
Additionally, the Real Estate segment has $1.2 billion of Available Capital that has been
reserved for add-on investments in funds that are fully invested.
(3)
Multiple of Invested Capital (“MOIC”) represents carrying value, before management
fees, expenses and Carried Interest, divided by invested capital.
(4)
Net Internal Rate of Return (“IRR”) represents the annualized inception to June 30,
2012 IRR on total invested capital based on realized proceeds and unrealized value, as
applicable, after management fees, expenses and Carried Interest.
(5)
Returns for BCP VI and BEP are not meaningful as their initial investments occurred in May
2011 and August 2011, respectively.
(6)
BREP VII commenced its investment period in August 2011 and as of July 19, 2012 continues to
raise capital. (7)
BREP Co-Investment represents co-investment capital raised for various BREP
investments. The Net IRR reflected is calculated by aggregating each
co-investment’s realized proceeds and unrealized value, as applicable, after management fees, expenses
and Carried Interest.
24
Not applicable.
Not meaningful. |
 Blackstone
Reconciliation of GAAP to Non-GAAP Measures
Notes on next page.
(Dollars in Thousands)
2Q'11
3Q'11
4Q'11
1Q'12
2Q'12
Net Income (Loss) Attributable to The Blackstone Group L.P.
86,237
$
(274,567)
$
(22,677)
$
58,325
$
(74,964)
$
Net Income (Loss) Attributable to Non-Controlling Interests in Blackstone Holdings
190,908
(402,079)
21,220
107,405
(53,027)
Net Income (Loss) Attributable to Non-Controlling Interests in Consolidated Entities
(92,408)
(265,353)
466,452
212,293
243,339
Net Income Attributable to Redeemable Non-Controlling
Interests in Consolidated Entities
(140)
(44,776)
(9,634)
39,609
(21,071)
Net Income (Loss)
184,597
$
(986,775)
$
455,361
$
417,632
$
94,277
$
Provision for Taxes
64,199
(7,637)
250,299
38,753
41,337
Income (Loss) Before Provision (Benefit) for Taxes
248,796
$
(994,412)
$
705,660
$
456,385
$
135,614
$
IPO and Acquisition-Related Charges
(1)
430,829
264,068
147,808
244,897
268,936
Amortization of Intangibles
(2)
44,905
45,665
86,121
50,888
39,435
Income (Loss) Associated with Non-Controlling Interests in (Income) Loss of
Consolidated Entities
(3)
92,548
310,129
(456,817)
(251,902)
(222,268)
Economic Income (Loss)
817,078
$
(374,550)
$
482,772
$
500,268
$
221,717
$
Taxes
(4)
(12,897)
(5,449)
(14,618)
(9,051)
(9,368)
Economic Net Income (Loss)
804,181
$
(379,999)
$
468,154
$
491,217
$
212,349
$
Taxes
(4)
12,897
5,449
14,618
9,051
9,368
Performance Fee Adjustment
(5)
(673,058)
457,279
(357,950)
(385,756)
(134,837)
Investment Income (Loss) Adjustment
(6)
(137,569)
134,106
(55,725)
(83,406)
16,264
Investment Income (Loss) -
Blackstone's Treasury Cash Management Strategies
(7)
4,038
(3,011)
2,271
6,310
1,892
Performance Fee Compensation and Benefits Adjustment
(8)
145,808
(100,892)
94,728
109,512
40,693
Fee Related Earnings
156,297
$
112,932
$
166,096
$
146,928
$
145,729
$
Realized Performance Fees
(9)
32,504
(2,646)
17,494
6,649
54,147
Realized Investment Income
(10)
30,732
31,647
16,697
23,492
9,360
Adjustment Related to Realized Investment Income -
Blackstone's Treasury Cash Management Strategies
(11)
(2,343)
(309)
(2,395)
(5,897)
(1,280)
Taxes and Related Payables Including Payable Under Tax Receivable Agreement
(12)
(26,312)
(15,879)
(19,706)
(9,051)
(19,552)
Distributable Earnings
190,878
$
125,745
$
178,186
$
162,121
$
188,404
$
Interest
13,068
12,577
14,843
13,554
12,850
Taxes and Related Payables Including Payable Under Tax Receivable Agreement
(12)
26,312
15,879
19,706
9,051
19,552
Depreciation and Amortization
7,837
8,325
8,451
10,268
10,391
Adjusted EBITDA
238,095
$
162,526
$
221,186
$
194,994
$
231,197
$
25 |
 Blackstone
Reconciliation
of
GAAP
to
Non-GAAP
Measures
–
Notes
Note: Prior period amounts have been adjusted to conform to the current period presentation and
definitions. See also Appendix - Definitions.
(1) This adjustment adds back to Income (Loss) Before Provision (Benefit) for
Taxes amounts for Transaction-Related Charges which include principally
equity-based compensation charges associated with Blackstone’s initial public offering and long-term retention
programs outside of annual deferred compensation and other corporate actions.
(2)
This adjustment adds back to Income (Loss) Before Provision (Benefit) for Taxes amounts for
the Amortization of Intangibles which are associated with Blackstone’s initial
public offering and other corporate actions. (3)
This adjustment adds back to Income (Loss) Before Provision (Benefit) for Taxes the amount of
(Income) Loss Associated with Non- Controlling Interests in (Income) Loss of
Consolidated Entities and includes the amount of Management Fee Revenues associated
with Consolidated CLO Entities.
(4)
Taxes represent the current tax provision (benefit) calculated on Income (Loss) Before
Provision for Taxes. (5)
This adjustment removes from EI the total segment amount of Performance Fees.
(6)
This adjustment removes from EI the total segment amount of Investment Income (Loss).
(7)
This adjustment represents the realized and unrealized gain on Blackstone’s Treasury cash
management strategies which are a component of Investment Income (Loss) but included in
Fee Related Earnings. (8)
This adjustment removes from expenses the compensation and benefit amounts related to
Blackstone’s profit sharing plans related to Performance Fees.
(9)
Represents the adjustment for realized Performance Fees net of corresponding actual amounts
due under Blackstone’s profit sharing plans related thereto.
(10)
Represents the adjustment for Blackstone’s Investment Income (Loss) -
Realized.
(11)
Represents the elimination of Realized Investment Income attributable to Blackstone’s
Treasury cash management strategies which is a component of both Fee Related Earnings
from Operations and Realized Investment Income (Loss). (12)
Taxes and Related Payables Including Payable Under Tax Receivable Agreement represent the
current tax provision (benefit) calculated on Income (Loss) Before Provision for Taxes
and the payable under the Tax Receivable Agreement. 26
|
 Blackstone
27
Calculation of Certain Non-GAAP Financial Metric Components
Unless otherwise noted, all amounts are the respective captions from the Total Segment
information. (Dollars in Thousands)
2Q'12
Year-to-Date
Interest Income and Dividend Revenue
10,391
$
19,736
$
Other Revenue
(828)
(2,035)
Investment Income (Loss) - Blackstone's Treasury Cash Management Strategies
(1)
1,892
8,202
Interest Income and Other Revenue
11,455
$
25,903
$
Realized Incentive Fees
11,692
16,971
Less: Realized Incentive Fee Compensation
(5,575)
(9,827)
Net Realized Incentive Fees
6,117
$
7,144
$
Realized Carried Interest
55,929
69,489
Less: Realized Carried Interest Compensation
(7,899)
(15,837)
Net Realized Carried Interest
48,030
$
53,652
$
Realized Investment Income
9,360
32,852
Adjustment Related to Realized Investment Income - Blackstone's Treasury Cash Management
Strategies (1)
(1,280)
(7,177)
Realized Investment Income
8,080
$
25,675
$
Unrealized Incentive Fees
(17,074)
51,047
Less: Unrealized Incentive Fee Compensation
9,596
(3,183)
Net Unrealized Incentive Fees
(7,478)
$
47,864
$
Unrealized Carried Interest
84,290
383,086
Less: Unrealized Carried Interest Compensation
(36,815)
(121,358)
Net Unrealized Carried Interest
47,475
$
261,728
$
Unrealized Investment Income
(25,624)
34,290
Less: Investment Income (Loss) - Blackstone's Treasury Cash Management Strategies
(1)
(1,892)
(8,202)
Less: Adjustment Related to Realized Investment Income - Blackstone's Treasury Cash
Management Strategies (1)
1,280
7,177
Unrealized Investment Income
(26,236)
$
33,265
$
Related Payables
(2)
10,184
$
10,184
$
(1)
See Appendix - Reconciliation of GAAP to Non-GAAP Measures for this adjustment. (2)
Represents tax related payables including the payable under the tax receivable
agreement. |
 Blackstone
Unit Rollforward
2Q'11
3Q'11
4Q'11
1Q'12
2Q'12
YTD
Total
GAAP
Weighted-Average
Common
Units
Outstanding
-
Basic
476,289,647
487,189,657
490,511,637
506,985,529
528,778,977
517,882,253
Adjustments:
Weighted-Average Unvested Deferred Restricted Common Units
7,353,999
-
-
10,404,029
-
-
Total
GAAP
Weighted-Average
Common
Units
Outstanding -
Diluted
483,643,646
487,189,657
490,511,637
517,389,558
528,778,977
517,882,253
Adjustments:
Weighted-Average Blackstone Holdings Partnership Units
625,526,089
616,168,175
613,105,891
602,817,069
591,155,160
596,986,114
Weighted-Average Unvested Deferred Restricted Common Units
-
7,243,768
12,469,282
-
4,820,609
7,612,319
Weighted-Average Economic Net Income Adjusted Units
1,109,169,735
1,110,601,600
1,116,086,810
1,120,206,627
1,124,754,746
1,122,480,686
Economic Net Income Adjusted Units, End of Period
1,110,129,505
1,110,027,706
1,108,034,890
1,119,829,138
1,122,067,386
1,122,067,386
Total
Common
Units
Outstanding
(1)
483,765,891
488,178,170
495,599,976
510,868,415
525,464,110
525,464,110
Adjustments:
Blackstone Holdings Partnership Units
618,779,283
615,164,340
608,718,156
597,566,417
585,315,742
585,315,742
Distributable
Earnings
Units
Outstanding
(2)
1,102,545,174
1,103,342,510
1,104,318,132
1,108,434,832
1,110,779,852
1,110,779,852
28
(1)
Common Unitholders receive Tax Benefits from deductions taken by Blackstone’s corporate
tax paying subsidiaries and bear responsibility for the deduction from
Distributable Earnings of the Payable under the Tax Receivable Agreement and certain other
tax-related payables.
(2)
Excludes units which are not entitled to distributions. |
 Blackstone
Definitions
•
Blackstone uses Economic Income, or “EI”, as a key measure of value creation, a
benchmark of its performance and in making resource deployment and compensation
decisions across its five segments. EI represents segment net income before taxes excluding transaction-
related charges. Transaction-related charges arise from Blackstone’s initial
public offering (“IPO”) and long-term retention programs outside of
annual deferred compensation and other corporate actions, including acquisitions. Transaction-related charges include equity-based
compensation charges, the amortization of intangible assets and contingent consideration
associated with acquisitions. EI presents revenues and expenses on a basis that
deconsolidates the investment funds Blackstone manages.
•
Economic Net Income, or “ENI”, represents EI adjusted to include current period
taxes. Taxes represent the current tax provision (benefit) calculated on Income
(Loss) Before Provision for Taxes.
•
Blackstone uses Fee Related Earnings, or “FRE”, as a key measure to highlight
earnings from operations excluding: (a) the income related to performance fees
and related carry plan costs, (b) income earned from Blackstone’s investments in the Blackstone Funds, and (c) realized
and unrealized gains (losses) from other investments except for such gains (losses) from
Blackstone’s Treasury cash management strategies. Blackstone uses FRE as a
measure to assess whether recurring revenue from its businesses is sufficient to adequately cover all of its
operating expenses and generate profits. FRE equals contractual fee revenues, investment
income from Blackstone’s Treasury cash management strategies and interest income,
less (a) compensation expenses (which includes amortization of non-IPO and non-acquisition-
related equity-based awards, but excludes amortization of IPO and acquisition-related
equity-based awards, carried interest and incentive fee compensation), and (b)
other operating expenses.
•
Distributable Earnings, or “DE”, which is derived from Blackstone’s segment
reported results, is a supplemental measure to assess performance and amounts available
for distributions to Blackstone unitholders, including Blackstone personnel and others who are limited
partners of the Blackstone Holdings partnerships. DE is intended to show the amount of
net realized earnings without the effects of the consolidation of the Blackstone Funds. Blackstone discloses the following financial measures that are calculated and presented on the
basis of methodologies other than in accordance with generally accepted accounting
principles in the United States of America (“non-GAAP”) in this presentation:
•
Blackstone uses Adjusted Earnings Before Interest, Taxes and Depreciation and Amortization, or
“Adjusted EBITDA”, as a measure of segment performance and an indicator of
its ability to cover recurring operating expenses. Adjusted EBITDA equals DE before segment interest expense,
segment depreciation and amortization, and the taxes and related payables including the
payable under the tax receivable agreement.
DE, which is a component of ENI, is the sum across all segments of: (a) Total Management
and Advisory Fees, (b) Interest and Dividend Revenue, (c) Other Revenue, (d) Realized
Performance Fees, and (e) Realized Investment Income (Loss); less (a) Compensation, (b) Realized Performance
Fee Compensation, (c) Other Operating Expenses, and (d) Taxes and Related Payables Including
the Payable Under the Tax Receivable Agreement. DE is reconciled to
Blackstone’s Consolidated Statement of Operations. It is Blackstone’s current intention that on an annual basis
it will distribute to unitholders all of its DE, less realized investment gains and returns of
capital from investments and acquisitions, in excess of amounts determined by its
general partner to be necessary or appropriate to provide for the conduct of its business, to make appropriate
investments in its business and funds, to comply with applicable law, any of its debt
instruments or other agreements, or to provide for future distributions to its
unitholders for any ensuing quarter.
29 |
 Blackstone
Forward-Looking Statements
This presentation may contain forward-looking statements within the meaning of Section 27A
of the Securities Act of 1933 and Section 21E of the Securities Exchange Act of 1934
which reflect Blackstone’s current views with respect to, among other things,
Blackstone’s operations and financial performance. You can identify these
forward-looking statements by the use of words such as “outlook,”
“believes,”
“expects,”
“potential,”
“continues,”
“may,”
“will,”
“should,”
“seeks,”
“approximately,”
“predicts,”
“intends,”
“plans,”
“estimates,”
“anticipates”
or the negative version of these words or other comparable words. Such forward-looking
statements are subject to various risks and uncertainties. Accordingly, there are or
will be important factors that could cause actual outcomes
or
results
to
differ
materially
from
those
indicated
in
these
statements.
Blackstone
believes
these
factors
include
but
are
not limited to those described under the section entitled “Risk Factors”
in its Annual Report on Form 10-K for the fiscal year ended
December 31, 2011, as such factors may be updated from time to time in its periodic filings
with the Securities and Exchange Commission, which are accessible on the SEC’s
website at www.sec.gov. These factors should not be construed as exhaustive and should
be read in conjunction with the other cautionary statements that are included in this presentation and in the filings.
Blackstone undertakes no obligation to publicly update or review
any forward-looking statement, whether as a result of new
information, future developments or otherwise.
This presentation does not constitute an offer of any Blackstone
Fund.
30 |