Attached files
| file | filename |
|---|---|
| 8-K - FORM 8-K - ATHENAHEALTH INC | d382551d8k.htm |
| EX-99.1 - EX-99.1 - ATHENAHEALTH INC | d382551dex991.htm |
Exhibit 99.2
| Second Quarter Fiscal Year 2012 |

| |
| Prepared Remarks | July 19, 2012 |
Jonathan Bush, President, Chairman & Chief Executive Officer
Tim Adams, Senior Vice President, Chief Financial Officer
About These Remarks
The following commentary is provided by management in conjunction with the second quarter fiscal year 2012 earnings press release issued by athenahealth, Inc. (the “Company,” “we,” or “athenahealth”). These remarks represent management’s current views on the Company’s financial and operational performance and are provided to give investors and analysts more time to analyze and understand our performance in advance of the earnings conference call. These prepared remarks will not be read on the conference call. A complete reconciliation between GAAP and non-GAAP results as well as a summary of supplemental metrics and definitions is provided in the tables following these prepared remarks.
Earnings Conference Call Information
To participate in the Company’s live conference call and webcast, please dial 800-446-2782 (or 847-413-3235 for international calls) using conference code No. 32573331, or visit the Investors section of the Company’s web site at www.athenahealth.com. A replay will be available for one week following the conference call at 888-843-7419 (and 630-652-3042 for international calls) using conference code No. 32573331. A webcast replay will also be archived on the Company’s website.
Safe Harbor and Forward-Looking Statements
These remarks contain forward-looking statements, which are made pursuant to the safe harbor provisions of the Private Securities Litigation Reform Act of 1995, including statements reflecting management’s expectations for future financial and operational performance and operational expenditures, expected growth, and business outlook; statements regarding the Company’s research and development efforts and product offering and upgrade plans and timelines, the benefits of and anticipated operational results from the Company’s service offerings, the further integration of the Company’s services and the resulting benefits, changes in the Company’s contracting, changes in the types of providers and health care entities the Company serves and the range of tasks the Company performs for clients, the Company’s sales and marketing activities and plans, the Company’s hiring and training plans, the potential for cross-sales among service offerings and sales involving multiple services, the Company’s implementation pipeline, the expansion of the number of users of the Company’s care coordination services, the impact of the transition to the ANSI 5010 standard and the ICD-10 code set and the Company’s implementation thereof, the Company’s plans in regard to Stage 2 of Meaningful Use, and the creation of a sustainable market for health information exchange, a social network for health care, an ecosystem of developers and third-party service providers, and a national health IT network; statements made during the Company’s 4th Annual Investor Summit; and statements found under the Company’s “Reconciliation of Non-GAAP Financial Measures to Comparable GAAP Measures” section of these remarks. The forward-looking statements in these remarks do not constitute guarantees of future performance. These statements are neither promises nor guarantees, and are subject to a variety of risks and uncertainties, many of which are beyond the Company’s control, which could cause actual results to differ materially from those contemplated in these forward-looking statements. In particular, the risks and uncertainties include, among other things: the Company’s fluctuating operating results; the Company’s variable sales and implementation cycles, which may result in fluctuations in its quarterly results; risks associated with the acquisition and integration of companies and new technologies, including those related to the Company’s ability to successfully integrate the athenaCoordinator® service and successfully scale the Proxsys services and technologies to achieve expected synergies; risks associated with its expectations regarding its ability to maintain profitability; the impact of increased sales and marketing expenditures, including whether increased expansion in revenues is attained and whether impact on margins and profitability is longer term than expected; changes in tax rates or exposure to additional tax liabilities; the highly competitive industry in which the Company operates and the relative immaturity of the market for its service offerings; and the evolving and complex governmental and regulatory compliance environment in which the Company and its clients operate. Existing and prospective investors are cautioned not to place undue reliance on these forward-looking statements, which speak only as of the date hereof. The Company undertakes no obligation to update or revise the information contained in these remarks, whether as a result of new information, future events or circumstances, or otherwise. For additional disclosure regarding these and other risks
1
faced by the Company, see the disclosures contained in its public filings with the Securities and Exchange Commission, available on the Investors section of the Company’s website at http://www.athenahealth.com and on the SEC’s website at http://www.sec.gov.
Use of Non-GAAP Financial Measures
These remarks contain non-GAAP financial measures, as defined by SEC Regulation G. The GAAP financial measure most directly comparable to each non-GAAP financial measure used or discussed, and a reconciliation of the differences between each non-GAAP financial measure and the comparable GAAP financial measure, are included following these prepared remarks or can be found within the Company’s second quarter fiscal year 2012 earnings press release on the Investors section of the Company’s web site at http://www.athenahealth.com.
Opening Remarks
Q2 2012 was another productive quarter for athenahealth, as demonstrated by both our financial performance and the progress made in our mission to become medical care givers’ most trusted service. Year-to-date, our balanced scorecard results are 104% of goal. Four out of our five scorecard categories are ahead of goal year-to-date: stability 107%, performance 102%, satisfaction 105%, and financial 113%. The fifth category, growth, remains strong at 97%. A highlight of the scorecard was client satisfaction, which reached a record high of 89.8% this quarter, well above our goal of 85%. Consistent focus on the needs of our clients is paramount to our mission and has yielded high client satisfaction and customer retention. Our mission to become medical care givers’ most trusted service keeps everyone at athenahealth focused, even during turbulent times in health care. Government mandates aimed to improve the cost and quality of care are also increasing the complexity of practicing medicine and getting paid for care delivery. We view ourselves as playing a critical, and ever-expanding role, as advocates for medical care givers as we work to continually identify opportunities to improve our clients’ financial and operational performance. There are several initiatives underway to enhance the user experience and improve physician productivity both inside and outside the office, while at the same time preserving the sanctity of the physician-patient relationship. We have successfully gone mobile and already have approximately 1,800 athenaClinicals® physicians using our iPhone application. We plan to release the same out-of-office workflows on the iPad during Q3 2012. Over the next few quarters, we will be working on delivering an optimized iPad application for light-weight exam room workflows that will further reduce documentation cycle times. Finally, we have engaged IDEO, an innovation and design firm, to help us redesign the medical record experience. This is a great start to our journey to make athenaNet® more beautiful. Furthermore, we continue to demonstrate our unique capacity to manage industry change on behalf of our clients, most recently with the American National Standards Institute (ANSI) 5010 transition and Stage 1 Meaningful Use (MU). The team has now shifted focus to support our clients with the International Statistical Classification of Diseases and Related Health Problems, 10th Revision (ICD-10) code set transition and with the next stage of MU. We do all of this work on behalf of our clients at no additional cost to them. In addition to seamlessly managing government mandates, we are also searching for innovative, cloud-based companies to connect into our cloud-based platform in order to further drive value for our clients. To this end, we are expanding our More Disruption Please (MDP) program to include code-a-thons, hack-a-thons, webinars, conferences, meet-ups, and other exciting events. Our goal is to bring together entrepreneurs, innovators and venture capitalists to share innovative and disruptive ideas in the health care and health care IT space. We will then incubate and convert the most innovative companies identified through the MDP program into Ecosystem partners. We have a grand vision to transform the way health care information is exchanged and how health care is delivered. We believe that our cloud-based services approach will place us on the right side of history.
Results Overview
athenahealth’s top line results for the second quarter of fiscal year (FY) 2012 reflect strong revenue growth:
| • | Total revenue: |
| • | $103.5 million in Q2 2012, representing 33% growth over $77.9 million in Q2 2011 |
2
Our bottom line results for Q2 2012, consistent with our growth strategy, demonstrate strong sales, marketing, and research and development investments, and a focus on operating leverage:
| • | Non-GAAP Adjusted Gross Profit: |
| • | $64.8 million, or 62.6% of total revenue, in Q2 2012, an increase of 29% over $50.1 million, or 64.4% of total revenue, in Q2 2011 |
| • | GAAP selling and marketing expense: |
| • | $27.4 million, or 26.5% of total revenue, in Q2 2012, an increase of 46% over $18.8 million, or 24.2% of total revenue, in Q2 2011 |
| • | GAAP research and development expense: |
| • | $8.6 million, or 8.3% of total revenue, in Q2 2012, an increase of 67% over $5.2 million, or 6.6% of total revenue, in Q2 2011 |
| • | GAAP general and administrative expense: |
| • | $14.0 million, or 13.5% of total revenue, in Q2 2012, versus $11.7 million, or 15.0% of total revenue, in Q2 2011 |
| • | Non-GAAP Adjusted EBITDA: |
| • | $20.6 million, or 19.9% of total revenue, in Q2 2012, an increase of 18% from $17.5 million, or 22.5% of total revenue, in Q2 2011 |
| • | Non-GAAP Adjusted Net Income: |
| • | $9.0 million, or $0.24 per diluted share, in Q2 2012, an increase of 14% from $7.9 million, or $0.22 per diluted share, in Q2 2011 |
We measure our performance based on a balanced scorecard model. We believe that this framework is an excellent report card for our performance for the current year and that it measures the key performance indicators required for long-term success. The table below shows the scorecard results for Q1, Q2, and year-to-date 2012, as well as the full year 2012 targets. For certain scorecard metrics (i.e., Client DAR, DAR in Client Work Buckets, Provider Documentation Time, and Client Tickets per Provider), our goal is to improve our performance by effectively reducing the scorecard metrics results throughout the year. Therefore, the full year target is lower than the Q1 2012 and Q2 2012 actual results for these metrics.

Corporate Scorecard (unaudited)
Last Updated: March 31, 2012
| Weight | Q1 2012 Results |
Q2 2012 Results |
YTD 2012 Results |
Fiscal Year
2012 Targets |
||||||||||||||||
| Stability |
||||||||||||||||||||
| Voluntary Turnover |
10 | % | 2 | % | 3 | % | 4 | % | 10 | % | ||||||||||
| Corporate Compliance |
5 | % | 88 | % | 80 | % | 84 | % | 95 | % | ||||||||||
| Employee Engagement |
0 | % | 4.1 | 4.1 | 4.1 | 4.1 | ||||||||||||||
| Stability Results |
15 | % | 115 | % | 99 | % | 107 | % | 100 | % | ||||||||||
| Performance |
||||||||||||||||||||
| Client Days in Accounts Receivable (DAR) |
10 | % | 40.0 | 38.2 | 39.1 | 37.5 | ||||||||||||||
| DAR in Client Work Buckets |
10 | % | 8.3 | 7.6 | 8.0 | 7.9 | ||||||||||||||
| Client Collection Rate |
5 | % | 96 | % | 96 | % | 96 | % | 96 | % | ||||||||||
| Provider Documentation Time per Appointment |
5 | % | 5.4 | 5.2 | 5.3 | 5.0 | ||||||||||||||
| Performance Results |
30 | % | 101 | % | 103 | % | 102 | % | 100 | % | ||||||||||
| Satisfaction |
||||||||||||||||||||
| Client Touches per Claim |
5 | % | (a) | (a) | (a) | 10% improvement | ||||||||||||||
| Client Tickets per Provider (per month) |
5 | % | 0.34 | 0.33 | 0.33 | 0.35 | ||||||||||||||
| Client Satisfaction |
10 | % | 86 | % | 90 | % | 88 | % | 85 | % | ||||||||||
| Satisfaction Results |
20 | % | 103 | % | 107 | % | 105 | % | 100 | % | ||||||||||
| Financial |
||||||||||||||||||||
| Total Revenue |
10 | % | $ | 96.6M | $ | 103.5M | $ | 200.1M | $ | 430M | ||||||||||
| Non-GAAP Adjusted Operating Income |
5 | % | $ | 11.6M | $ | 14.8M | $ | 26.4M | $ | 60M | ||||||||||
| Financial Results |
15 | % | 123 | % | 107 | % | 113 | % | 100 | % | ||||||||||
| Growth |
||||||||||||||||||||
| Bookings |
20 | % | (a) | (a) | (a) | 30% growth | ||||||||||||||
| Growth Results |
20 | % | 97 | % | 98 | % | 97 | % | 100 | % | ||||||||||
|
|
|
|
|
|
|
|
|
|||||||||||||
| Total Results |
100 | % | 106 | % | 103 | % | 104 | % | 100 | % | ||||||||||
|
|
|
|
|
|
|
|
|
|||||||||||||
| (a) | Since the client touches per claim and bookings metrics contain highly sensitive data, we do not disclose all of the specific performance measures and targets, because we believe that such disclosure would result in serious competitive harm. |
3
We achieved a scorecard result of 103% of goal in Q2 2012 and believe that the Company’s underlying drivers of long-term success remain strong:
| • | Employee engagement at 4.1 out of 5.0 in Q2 2012 versus goal of 4.1 and Q2 2011 actual result of 4.0 |
| • | Client satisfaction of 89.8% in Q2 2012 versus goal of 85% and Q2 2011 actual result of 85.9% |
| • | Average client Days in Accounts Receivable (DAR) of 38.2 days in Q2 2012 versus goal of 38 days and Q2 2011 actual result of 39.1 |
| • | 7.6 average DAR in client work buckets in Q2 2012, favorable to our goal of 8.5 days |
| • | Client collection rate of 96.2% in Q2 2012, in line with our goal of 96% |
athenahealth’s client base continues to expand while client adoption of other services in the athenahealth service suite grows rapidly. As our client base expands outside the traditional ambulatory market, total active providers or nodes on our network will become a more appropriate metric used to measure of our market share. During Q2 2012:
| • | 83% of all new athenaCollector® deals included athenaClinicals, up from 75% in Q2 2011 |
| • | 67% of all new athenaCollector deals included both athenaClinicals and athenaCommunicator®, up from 35% in Q2 2011 |
| • | Net new physicians and providers added sequentially to the network were as follows: |
| athenaCollector | athenaClinicals | athenaCommunicator | ||||||||||||||||||||||
| Active physicians and providers: | Physicians | Providers | Physicians | Providers | Physicians | Providers | ||||||||||||||||||
| Beginning balance as of 3/31/12 |
24,101 | 33,923 | 5,331 | 7,402 | 4,820 | 6,800 | ||||||||||||||||||
| Net new additions |
900 | 1,486 | 820 | 1,156 | 1,486 | 1,842 | ||||||||||||||||||
| Ending balance as of 6/30/12 |
25,001 | 35,409 | 6,151 | 8,558 | 6,306 | 8,642 | ||||||||||||||||||
| Sequential growth % |
4 | % | 4 | % | 15 | % | 16 | % | 31 | % | 27 | % | ||||||||||||
| • | Net new physicians and providers added to the network since Q2 2011 were as follows: |
| athenaCollector | athenaClinicals | athenaCommunicator | ||||||||||||||||||||||
| Active physicians and providers: | Physicians | Providers | Physicians | Providers | Physicians | Providers | ||||||||||||||||||
| Beginning balance as of 6/30/11 |
20,824 | 29,482 | 3,444 | 4,848 | 1,198 | 1,936 | ||||||||||||||||||
| Net new additions |
4,177 | 5,927 | 2,707 | 3,710 | 5,108 | 6,706 | ||||||||||||||||||
| Ending balance as of 6/30/12 |
25,001 | 35,409 | 6,151 | 8,558 | 6,306 | 8,642 | ||||||||||||||||||
| Y/Y growth % |
20 | % | 20 | % | 79 | % | 77 | % | 426 | % | 346 | % | ||||||||||||
athenaCollector network performance metrics were as follows for Q2 2012:
| • | $2,259,202,690 posted in total client collections, up 25% from Q2 2011 |
| • | 17,467,447 total claims submitted, up 22% from Q2 2011 |
| • | 77.7% electronic remittance advice (ERA) rate, a one-point improvement over Q2 2011 |
| • | 92.9% first pass resolution (FPR) rate, up from 91.3% in Q1 2012 (impacted by ANSI 5010) but slightly down from 93.4% at Q2 2011 |
Product Development Discussion
Product development at athenahealth is organized around the goal of being the best in the world at getting medical care givers paid for doing the right thing. In order to fulfill this mission, we deliver services backed by cloud-based software, proprietary knowledge, and robust back-office services.
athenaCollector Service Offering
athenaCollector is our cloud-based medical billing and practice management solution. It is the foundation of our service portfolio and entered general availability in 2000.
Exiting Q2 2012, over 98% of our total electronic transactions and 100% of our eligibility transactions are in compliance with the new American National Standards Institute (ANSI) 5010 standard. The remaining 2% of the transactions are awaiting either payer or claims intermediary ANSI 5010 readiness. You can read more about how athenahealth managed the ANSI 5010 conversion in the following blog post “ANSI
4
5010 and Medical Billing: The Agony and the Ecstasy.” athenahealth’s success with ANSI 5010 has laid the necessary groundwork for the next significant change in the health care industry: the adoption of the ICD-10 code set for reporting diagnoses and procedures to payers. athenahealth is working hard to prepare for the ICD-10 conversion, including conducting research to determine what changes payers and clearinghouses will be making as well as arranging testing plans with them. athenahealth has an excellent track record of smoothly managing changes in the health care industry on behalf of our clients. These changes have included NPI, ANSI 5010 and MU and we perform this work at no additional cost to our clients. The Centers for Medicare and Medicaid Services (CMS) estimates that physician offices will spend approximately three percent of their annual revenue transitioning to ICD-101. These costs to transition to ICD-10 include training for staff and physicians, modification of business and clinical processes, and software upgrades. We believe that our clients will have lower transition costs as a result of athenahealth taking on all of the work required to update our cloud-based network and submit ICD-10 compliant claims. Our goal is to have the required software updates in place in advance of the October 1, 2014 deadline (currently in review) to allow ample time for payer testing and client training. You can learn more about how athenahealth is educating and supporting medical care givers by accessing the ICD-10 transition page on our website, which includes a webinar, a white paper, and many other educational materials.
athenahealth is successful at shifting the lines of comparative advantage by taking work away from our clients. We believe that this co-sourcing strategy is the best approach to gaining control over the revenue cycle and enabling our clients to profit more by doing the right thing. This allows our clients to focus on their patients and more value-added, revenue-generating activities. During Q2 2012, we have made significant progress on our expanded services. We launched our beta of provider credentialing during Q1 2012 and are now fully operational with several clients. Over the past six months, we have submitted almost 700 applications on behalf of our clients (a growing list representing at least 500 providers) currently enrolled in the credentialing program. We believe that we can successfully scale the credentialing work by making the process faster and more efficient, which will significantly increase the value to our client base. This quarter we also announced one of our largest service expansions, our management of eligibility-related denials. By taking over the responsibility for eligibility-related denials, we expect to reduce the volume of denials routed back to our clients by up to 7%. We are on track to roll out this expanded service to our entire client base by the end of 2012. We are measuring and reporting the success of these programs via two important metrics on our balanced scorecard: DAR in client work buckets and client touches per claim.
Finally, with ANSI 5010 behind us, client days in accounts receivable (DAR) dropped by almost two days from 40.0 in Q1 2012 to 38.2 in Q2 2012 and improved by approximately one day from Q2 2011 (39.1 days). Managing and reducing client DAR is critical to improving and maintaining our clients’ financial health. Mid-way through the year, we are on track to achieve our 2012 goal of 37.5 days. Taking on more work on behalf of our clients with services such as provider credentialing and successfully managing industry changes will help us achieve this goal.
athenaClinicals Service Offering
athenaClinicals is our cloud-based electronic health record (EHR) management service. It entered general availability in 2006 and was made available as a stand-alone service in 2010.
Our athenaNet intelligence team continues to monitor, in real time, our athenaClinicals clients’ performance against the MU stage 1 measures. The athenaClinicals providers who successfully attested and received Medicare incentive payments in year 1 are on track to successfully attest and qualify for Medicare incentive payments in year 2. Our cross-functional steering committees remain focused on solving any problems our clients may face in year 2 of MU, while also managing a seamless transition for
| 1 | Department of Health and Human Services, HIPPA Administrative Simplification: Modifications to Medical Data Code Set Standards To Adopt ICD-10-CM and ICD-10-PCS. 74 Fed. Reg. 3,328, 3,357 (2009). |
5
our clients from Stage 1 to Stage 2. Our ability to closely monitor and support our athenaClinicals clients as they navigate their way through the MU program highlights the value and advantage of our cloud-based services model. This platform has enabled us to take an active role in assisting our clients in achieving Stage 1 MU, and we will apply the same approach to all future stages of the MU program. You can view a client testimonial explaining how athenahealth supported his transition from paper charts to MU in six months in the following blog post “Solo, 66-Year-Old Doctors Can Do Meaningful Use.”
We are eagerly awaiting the final Stage 2 MU rules from the Office of the National Coordinator for Health IT (ONC) and the Centers for Medicare and Medicaid Services (CMS), which are expected to be released in late summer or early fall 2012. athenahealth remains dedicated to the idea of strong and effective MU standards, which we believe are necessary to effect real change in health care. athenahealth welcomed the opportunity to provide the ONC and CMS with comments regarding the two sets of proposed rules: The Meaningful Use Stage 2 Notice of Proposed Rule Making (Proposed Rule) and the 2014 Edition EHR Standards and Certification Criteria Proposed Rule (Proposed Rule). We submitted our requested comments to both the ONC and CMS on May 7, 2012, detailing athenahealth’s position on the Proposed Rules. In summary, we are highly encouraged by the inclusion and expansion in the Proposed Rules of objectives and measures related to the exchange of health information, patient engagement, and quality reporting. We believe that increased focus in these areas will lay the necessary foundation to begin the real work of evidence-based medicine, health information exchange, and care coordination. The athenahealth team also communicated that we do not support any further delays in the Stage 2 timeline. In addition, we requested that the ONC and CMS create enough flexibility in the Proposed Rules to foster continued innovation, particularly in the area of health information exchange. You can read more about athenahealth’s comments to the CMS and ONC in the following blog post “Our Take on the Meaningful Use Comments.”
We are already beginning our development work for Stage 2 MU and will refine our development efforts once the final Stage 2 MU rules are published. Our goal is to certify athenaClinicals on the Stage 2 MU rules by mid-2013. Once the certification process is completed, we will roll out the updated athenaClinicals software across our entire client base at no additional cost to our clients. The fact that all of our clients access our service on the same instance of continuously updated, cloud-based software simplifies the rollout of a Stage 2 certified version of athenaClinicals.
Finally, we have successfully gone mobile with the launch of our iPhone application and already have approximately 1,800 athenaClinicals physicians using this application. A dedicated team is now focused on our mobile platforms, making mobile development a core competency of the Company. Our mobile strategy is focused specifically on providing the physician with flexibility both inside and outside the office. Currently, the iPhone application supports out-of-office workflows to help physicians keep their tasks under control. These tasks include viewing and working on inbound tasks, creating and managing patient cases, viewing patient charts and flow sheets, ePrescribing and renewing medications, and viewing schedules. We plan to extend this same functionality to the iPad during Q3 2012. We will then turn our attention to enabling in-office clinical workflows on the iPad for anticipated release in 2013.
athenaCommunicator Service Offering
athenaCommunicator is our cloud-based patient communication management service. It entered general availability in 2010 and, at this time, requires adoption of athenaCollector or athenaClinicals.
The athenaCommunicator product team is focused on improving patient interactions outside of the physician’s office. The athenaCommunicator service offering reduces the administrative work required to manage patient relationships, improves self-pay collections, and increases schedule density. The demonstrated benefits of this service offering continue to drive increased adoption across the client base. As of Q2 2012, the adoption rate was 25%, as compared to 20% in Q1 2012. As we increase the penetration of athenaCommunicator across our athenaCollector client base, the volume of work performed on behalf of our clients continues to grow dramatically. athenaCommunicator delivered over
6
11.5 million automated messages during Q2 2012 across our active patient base (over 4.2 million patients). Increased adoption of the patient portal will allow our clients to fully maximize the benefits of this service offering. Usage of the patient portal significantly reduces administrative tasks and improves the patient experience both inside and outside the physician’s office. In order to enjoy these benefits, our clients are driving patient portal adoption, as demonstrated by a 34% increase in the number of patients registered on the patient portal, from 464,000 patients as of Q1 2012 to 620,000 as of Q2 2012. Finally, managing self-pay collections, which is critical to our clients’ financial health, continues to grow significantly. athenaCommunicator assisted our clients by collecting over $3.0 million in self-pay collections via the patient portal and our live operator service during Q2 2012. This compares to $3.0 million collected on behalf of our clients in self-pay collections during all of 2011 and $2.3 million collected last quarter.
In order to further enhance the value proposition of our integrated services, the athenaCommunicator team continues to improve the integration of athenaCommunicator with athenaClinicals. Significant progress has been made in connection with the launch of our three initiatives announced last quarter. These initiatives include (1) improving the data capture of health history information; (2) improving order compliance; and (3) initiating population health management. Streamlining the capture of health history information from the patient portal improves the quality of patient information stored in the patient record and reduces the time spent by clinical personnel during the intake stage. The clinical order follow-up engine gives our clients better visibility into the status of a physician’s order and provides our clients with the necessary tools to help drive greater order compliance. This initiative will help athenahealth close the loop on physicians’ orders and work toward improving patient outcomes. Both of these initiatives were launched during Q1 2012 and the beta testing has been well received. As a result of this positive feedback, we successfully released these new features to the entire client base in June 2012. The athenaCommunicator team also initiated the population health management project last quarter. Included among the several campaigns launched during Q2 2012 were high blood pressure awareness, skin cancer screening awareness, asthma and allergy awareness and osteoporosis awareness. athenahealth utilizes the group call platform under athenaCommunicator in conjunction with the athenaClinicals quality management engine to assist athenaClinicals providers in managing their patient populations. The end goal will be to enable automated care management protocols that leverage the data in athenaClinicals to send automated messages to patient populations with specific risk factors. In furtherance of our goal to reduce our clients’ administrative work, we are also looking for opportunities to redirect call volumes from the physician’s office to our athenaCommunicator operators. To this end, we are testing the effectiveness of leaving athenaCommunicator live operator contact information on both patients’ answering machines and printed documents to further leverage the live operator service and complete more administrative tasks on behalf of our clients. This functionality is projected to become available to the entire athenaCommunicator client base during 2013.
athenaCoordinator Service Offering
Our care coordination service offerings include athenaCoordinator Core and athenaCoordinator Plus. athenaCoordinator Plus is our cloud-based care coordination service for order transmission, insurance pre-certification, and patient registration among physicians and hospitals, surgical centers, and imaging centers. We also offer athenaCoordinator Core (f/k/a OrderFlowSM), which is a cloud-based order transmission service for all receiver types and physicians using athenaClinicals. athenaCoordinator Plus entered general availability in 2011 following the acquisition of Proxsys LLC, and the athenaCoordinator Core service offering entered general availability in 2012.
In health care today, there is no broad market for effective health information exchange. The established technologies are closed systems and do not promote the exchange of health information. athenaCoordinator represents the first industrial strength business-to-business social network to facilitate the exchange of health information. athenaCoordinator manages the entire life cycle within athenaNet. This visibility into the order flow provides the economic, operational, and financial incentives for a vast range of receiver types to join the athenahealth network.
7
athenaCoordinator product development remains focused on completing the national rollout of the rewritten application, which is now an integrated part of athenaNet. We have successfully rolled out the rewritten application in 75% of our markets and are on track for a full conversion to athenaNet by the end of Q3 2012. The new application has been well received, and we are starting to see operational efficiencies and increased productivity in these live markets. Through these efforts, we have improved our workflow and have begun to shift work offshore. In addition, we are starting to eliminate manual work by utilizing the automated eligibility-checking engine. By rewriting the application into athenaNet, the order workflows from athenaClinicals and athenaCollector are now fully integrated with athenaCoordinator. With a single sign-on, athenaClinicals and athenaCollector clients can send qualified orders with minimal effort to their supply chain partners on athenaCoordinator. This seamless integration produces end-to-end visibility of the life cycle of an order within athenaNet. Over time, we will expand the Rules Engine, workflow distribution tools, and other automated routines to further scale this service offering.
After spending the first half of 2012 on successfully solidifying our athenaCoordinator operations and rolling out our transaction-based pricing model, we are now shifting our focus to adding receivers onto our network. We are refining our go-to-market approach for receivers and have rebranded our care coordination service offerings as athenaCoordinator Core and athenaCoordinator Plus. The athenaCoordinator Core service offering (f/k/a OrderFlow) is our order transmission service that streamlines the order process between referring physicians on athenaClinicals and all receiver types. The athenaCoordinator Plus service offering expands beyond the core order transmission service to include insurance pre-certification and pre-registration services. We know that, in order to make our transaction-based pricing models more valid, we need to rapidly expand the number of receivers on our network. We are making progress in this area and have signed 395 clients representing nearly 2,400 providers onto the athenaCoordinator Core service offering as of Q2 2012. We are actively seeking to sign up more receivers and are deepening our sales strategy with a renewed focus on a broader group of receiver types. In addition to our on-going efforts to sell athenaCoordinator Plus to the hospital market, we are also broadening our addressable market for athenaCoordinator Core to attract more independent receivers onto the athenahealth network. The target market for the athenaCoordinator Core service offering will include hospitals, independent medical practices, independent imaging centers, and independent labs. Our existing sales team will continue to target hospitals and independent medical practices while renewing its focus on independent imaging centers and independent labs. We believe that the rebranding of athenaCoordinator, coupled with the refinement of our go-to-market strategy, will help drive the rapid expansion of receivers onto our network.
Anodyne Solutions Service Offerings
Anodyne Solutions are our cloud-based business intelligence services for health care professionals. These services have been generally available since 2004 through Anodyne Health Partners, Inc., which athenahealth acquired in October of 2009. Anodyne Solutions are fully integrated with athenaCollector and will be integrated with athenahealth’s other service offerings. They can also be adopted on a stand-alone basis.
The general release of Anodyne solutions to all athenaCollector clients has been extremely well received. The Anodyne solutions, branded athenaInsightSM, offer athenahealth clients a collection of services combining cloud-based software, unparalleled industry knowledge, and experienced support staff. athenaInsight expands the reporting tools currently available in athenaNet and provides more actionable insight for our client base. The opportunity to gain greater visibility into the performance of medical organizations has increased the adoption of athenaInsight across our existing client base, mainly within the group, enterprise, and national accounts segments. In addition to cross-selling Anodyne solutions into our athenaCollector client base, we will also continue to market Anodyne solutions on a stand-alone basis to clients across the entire spectrum of legacy software practice management systems. Currently, we have approximately 26,000 providers on the Anodyne Solutions platform, which has grown from approximately 11,000 providers at time of acquisition.
8
The Anodyne Solutions service offerings, consisting of Anodyne Analytics and Anodyne Dashboard, transform data into information critical to run a profitable medical practice. Anodyne Analytics organizes and analyzes billing and claims data across medical practices, allowing decision-makers to quickly and easily present and analyze data through a wide array of business performance metrics. These metrics can be viewed either as broad, practice-wide summaries or as discrete, highly specific analyses based on complex user-defined requests. Anodyne Dashboard presents business data at a higher, more summarized level and distributes results and performance trends against benchmarks and targets. This service offering is designed for use by physician management, practice administrators, and executive management. It provides the necessary insight for organizational alignment by measuring physician productivity and administrative productivity and effectiveness.
As with all of our service offerings, we are constantly looking for opportunities to tap into our knowledge base and provide more value to our clients. To this end, we are in the process of building role-specific dashboards with appropriate benchmarks and metrics for all key roles in a medical practice. These role-specific dashboards will be generated for front desk reception, physicians, practice executives, and facility managers. In addition, we are looking to harness the value of the information in athenaNet and the greater Anodyne client base by developing practice-wide benchmark data. This will allow our Anodyne solutions clients to compare their performance against benchmark data based on practice size, location, specialty, and more. Our ability to create de-identified and aggregated benchmark data highlights the power of our single-instance cloud-based platform and will significantly enhance the analytical power and value-proposition of the Anodyne platform.
Business Development Update
Our More Disruption Please (MDP) program brings together entrepreneurs, innovators, and venture capitalists to share innovative and disruptive ideas regarding health care and health care IT. In addition to providing increased awareness for athenahealth, the MDP program also allows us to innovate faster and better. Expanding our partnerships with disruptive, innovative companies enables athenahealth to further differentiate our cloud-based platform and increase our speed to market with new capabilities. Our MDP program has over 250 participants and is still growing. athenahealth is positioned to create a collaborative community for health care startups, which will then allow us to convert the most innovative companies into Ecosystem partners over time. We are currently focused on creating strategic partnerships that will improve physician productivity, support a risk-based environment, and drive incremental revenue through supplemental services. Examples of these partnerships include dictation, patient finder and physician finder services, image sharing, and telemedicine. The ultimate goal of this program is to capitalize on our cloud-based platform and provider base to promote innovation in health care and keep driving value to our clients. You can read more about athenahealth’s MDP program in the following blog post by Derek Hedges, Vice President Business Development: “More Disruption Please!”.
Revenue Discussion
Our total quarterly revenue surpassed the $100 million mark for the first time in Company history. Q2 2012 revenue reached $103.5 million and grew by 33% (or $25.6 million) over Q2 2011. Our revenue growth was primarily driven by athenaCollector client base expansion and growth in athenaClinicals, athenaCommunicator, and athenaCoordinator services.
In terms of trends in our recurring revenue base, same-store analysis of claims created — a proxy for physician office utilization — indicates that physician office activity in Q2 2012 increased modestly over physician office activity during Q2 2011.
Client Base Discussion
The total number of physicians who have gone live on athenaCollector, our core service offering, is the metric we currently use to define our client base and market share. However, as our client base expands outside the traditional ambulatory market, total active providers or nodes on our network will become a more appropriate metric used to define our client base and market share. Annual growth in total revenue
9
continues to outpace growth in our physician base. We believe that this trend will continue as athenaClinicals and athenaCommunicator are included in a growing portion of new deals and as adoption of these services spreads across our existing client base.
Our launch of the athenaOne integrated service offering during Q1 has been highly successful, as proven by the jump in combined deals sold this quarter. During Q2 2012, 83% of all new athenaCollector deals included athenaClinicals, and 67% of all new athenaCollector deals included both athenaCommunicator and athenaClinicals, up from 75% and 35%, respectively, during Q2 2011. Among “live” (i.e., implemented and active) athenaCollector clients, adoption of athenaClinicals and athenaCommunicator continues to grow rapidly and resulted in continued growth to our installed base across all of our service offerings. As our client base expands outside the traditional ambulatory market, total active providers or nodes on our network will become a more appropriate metric used to measure of our market share.
athenahealth Service Offering Adoption
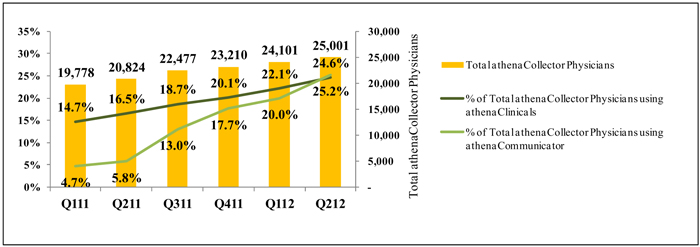
athenaCollector Clients
During Q2 2012, total active physicians on athenaCollector grew by 20% year-over-year to 25,001. On a sequential basis, we added 900 net new active physicians on athenaCollector versus 1,046 in Q2 2011. Our quarterly net new physician additions may vary widely due to the number and size of clients that go live in a particular quarter. Furthermore, our larger clients can be more complex and take longer to go live, particularly if our clients request a more phased implementation approach. Total active providers on athenaCollector grew by 20% year-over-year to 35,409. On a sequential basis, we added 1,486 net new active providers on athenaCollector versus 1,538 in Q2 2011.
athenaClinicals Clients
We continue to experience rapid growth in client adoption of athenaClinicals. Total active physicians live on athenaClinicals grew by 79% year-over-year to 6,151. On a sequential basis, we added 820 net new active physicians on athenaClinicals versus 534 in Q2 2011. This equates to an overall adoption rate of 25% of total athenaCollector physicians, up from 17% in Q2 2011. Total active providers on athenaClinicals grew by 77% year-over-year to 8,558. On a sequential basis, we added 1,156 net new active providers on athenaClinicals versus 687 in Q2 2011. We expect the athenaClinicals client base to increase significantly over time due to cross-selling within our existing base and growth in the volume of combined deals.
athenaCommunicator Clients
Our athenaCommunicator client base is also growing rapidly. Total active physicians live on athenaCommunicator grew by an impressive 426% year-over-year to 6,306, compared to 171% year-over-year in Q2 2011. On a sequential basis, we added 1,486 net new active physicians on athenaCommunicator versus 264 in Q2 2011. This equates to an overall adoption rate of 25% of total
10
athenaCollector physicians, up from 6% in Q2 2011. Total active providers on athenaCommunicator grew by 346%, to 8,642. On a sequential basis, we added 1,842 net new providers on athenaCommunicator versus 372 in Q2 2011. We expect the athenaCommunicator client base to increase significantly over time due to cross-selling within our existing base and growth in the volume of combined deals.
New Deals
On June 20, 2012, we announced that Medford Medical Clinic selected athenahealth’s integrated suite of cloud-based services, including athenaCollector, athenaClinicals, athenaCommunicator, and Anodyne Analytics. Medford Medical Clinic, located in Medford, Oregon, is an innovative primary and urgent care clinic with five nurse practitioners and 23 physicians providing family medicine, internal medicine, urgent care, neurology, endocrinology, lab, radiology, and Coumadin clinic services all on site. Medford Medical Clinic went live on athenahealth’s services in June 2012.
On July 9, 2012, we announced that two Federally Qualified Health Centers (FQHCs), Manet Community Health Center and Community Health Programs, selected athenahealth as their strategic partner to help them achieve comprehensive patient care. Community Health Programs went live on athenaCollector, athenaClinicals, and athenaCommunicator in July 2012, and Manet Community Health Center is expected to go live on the same three services later this year.
On July 11, 2012, we announced that MedExpress Urgent Care selected athenahealth to provide practice management and patient communications services for their growing business. We brought the first phase live on athenaCollector, athenaCommunicator, and Anodyne Analytics in June 2012 and expect to complete the implementation by year end. MedExpress Urgent Care is a leader in providing full-service, walk-in urgent care for the treatment of everyday injuries and illnesses. MedExpress Urgent Care operates 80 centers in five states with a number of new centers scheduled to open in 2012. MedExpress Urgent Care was one of the three enterprise deals sold in December 2011.
On July 18, 2012, we announced that Health Management Associates selected athenahealth’s integrated suite of cloud-based services including athenaCollector, athenaClinicals and athenaCommunicator for its employed physician network of approximately 1,200 providers (~900 physicians) operating in 15 states at more than 300 locations. Health Management Associates has been using Anodyne Solutions since July 2011. Health Management Associates is expected to go live by means of a phased implementation starting in Q4 2012.
Client Implementations
In terms of our publicly disclosed implementation pipeline as of June 30, 2012, the athenaCollector implementation at ProMedica (~330 physicians, ~400 providers) is progressing as planned and is expected to go live in phases during the second half of 2012. The athenaClinicals implementations were completed at Alexian Brothers Health System (~80 physicians; ~100 providers), Harbin Clinic (~140 physicians; ~210 Providers), and HealthStar Physicians (~40 physicians; ~60 providers) during Q2 2012. Finally, athenaCommunicator implementations at HealthStar Physicians and Alexian Brothers Health System are progressing well and are expected to go live in Q3 2012 and Q4 2012, respectively. University Hospitals academic medical center (~850 physicians; ~1,000 providers) is expected to go live on athenaCollector by means of a phased implementation starting in Q4 2012. Finally, the phased implementation approach at Detroit Medical Center (DMC) (~125 physicians; ~400 providers) is being re-evaluated. We are actively working with the DMC team to bring them live on athenaCollector as soon as possible.
Non-GAAP Adjusted Gross Margin Discussion
Our Non-GAAP Adjusted Gross Margin was 62.6% for Q2 2012, down approximately two hundred basis points from 64.4% in Q2 2011. As anticipated, this year-over-year decline in our Non-GAAP Adjusted Gross Margin was driven by our athenaCoordinator service offering. One of our goals is to improve gross margin on a service-line basis each year. As previously discussed, the expansion of our newest service
11
offerings, such as athenaCoordinator, will serve as a headwind to margin expansion until these new services become more automated and scalable. Our revised full year 2012 guidance for Non-GAAP Adjusted Gross Margin of 62.0% to 63.0% assumes that athenaCoordinator will compress margin.
Marketing and Selling Discussion
As an innovative, high growth company with a relatively small share of a very large market opportunity, our business model is still new to health care, and market awareness remains our biggest challenge. To improve awareness, we remain focused on expanding and enhancing our selling and marketing activities. These activities incur both fixed and variable costs, as they range from investment in personnel and infrastructure to spending on new advertising campaigns and paid search terms. We continue to experiment with and expand upon our awareness-building efforts as quickly as we deem them to be effective. The productivity of these investments is largely measured over the long term, particularly as it may take six to nine months of implementation before new clients fully contribute to revenue and join the ranks of our active client base.
Marketing Update
The athenahealth marketing organization encompasses our growth and sales operations, event and partner marketing, inside sales agents (ISAs), advertising, corporate communications, and product marketing teams. This organization executes in-market investments in an effort to generate new business opportunities for athenahealth.
Q2 2012 has been a very productive quarter for our marketing team. Our proven marketing channels including dinner seminars, on-line investments, print advertising, and website optimization, are continuing at full bore. athenahealth’s awareness across the industry received a nice boost with press announcements in the Huffington Post, The Boston Globe, The Boston Business Journal, and Forbes Magazine during Q2 2012. In addition to going mobile with athenaClinicals, we also launched a mobile version of the athenahealth website in response to the needs of our client base. Furthermore, in efforts to expand our channel partners to drive more lead generation, we formed a new partnership with American Express. Finally, we have started to make further traction with the C-suite with our Leadership Institute program in efforts to expand our awareness and presence in the Enterprise space.
Our partnership with American Express will help promote athenahealth services to the American Express® OPEN Cardmember base. American Express OPEN® is a premier small business financial services brand in the United States. Strategically, American Express OPEN has identified health care, and specifically independent providers, as a core growth segment for investment and has established aggressive internal targets to grow charge volume, attract new Cardmembers, and build new merchant and marketing relationships. We believe that their role as a “trusted advisor” to thousands of small to mid-sized practices struggling with cost control pairs well with our integrated, cloud-based service offerings that improve financial and operational health for medical care givers. During Q2 2012, athenahealth and American Express partnered on a direct mail campaign that reached approximately 20,000 American Express OPEN Cardmembers who are also physicians, to both introduce our suite of practice management and electronic health record services and to specifically promote a set of unique offers to these prospective clients. During Q12012, athenahealth also became an American Express merchant, which gives us the ability to accept American Express® Credit and Charge Cards as payment for our services. We believe that the combination of our brands and aligned focus on service quality and value will lead to a long-term and mutually beneficial relationship.
We have a unique strategy to help drive awareness in the enterprise space and have expanded the athenahealth Leadership Institute program to include an on-line forum in addition to our original live institute events. The Leadership Institute is a content-rich forum that provides top leaders from the health care industry with an opportunity to explore strategies on how to lead and succeed in today’s challenging health care environment. We have hosted three Leadership Institutes so far in 2012, including our first all-women’s Institute held at the end of June. In order to deliver this content more broadly, we recently
12
launched the online Leadership Forum as a standalone website. We have partnered with Harvard Business School professors and with the Harvard Business Review to offer on this site a leadership toolkit to help leaders in health care take full advantage of leadership lessons both inside and outside of health care. The on-line Leadership Forum contains content from both athenahealth and the Harvard Business Review and includes athenahealth whitepapers, Harvard Business Review articles, Harvard Business Review blog posts, and client testimonials. Simultaneously, we launched a new Enterprise Solutions section on athenahealth.com, providing targeted marketing content to the C-suite to increase awareness and understanding of our enterprise service model. The Enterprise Solutions section focuses on four major themes that resonate with larger health care systems and demonstrates how athenahealth’s cloud-based services are uniquely positioned to help health care organizations drive revenue and prepare for future industry changes. These four themes are (1) how to strengthen and expand the physician network; (2) how to thrive in a changing reimbursement environment; (3) how to gain visibility and align point-of-care decisions; and (4) how to do all this and minimize risk. The goal of these programs is to promote awareness of athenahealth as a strategic partner for enterprise organizations, while providing a pathway to nurturing and converting online leads.
The athenahealth team understands the growing costs and burdens placed on medical care givers today. We believe that our cloud-based services offer a better way for our clients to profit more by doing the right thing. athenahealth and Sermo recently launched the findings from the third annual Physician Sentiment Index (PSI). Five hundred physicians representing a wide range of specialties and practice sizes participated in the survey. The resonating messages from this year’s PSI survey are that physicians are over-burdened and are deeply concerned about the future of medicine. The study results suggest that the chief distractions affecting physicians’ ability to provide the best care for patients result from government intervention, increased utilization of and frustration with EHRs, and administrative burdens. You can review the full 2012 PSI findings report on athenahealth’s website. A few key data points highlighting physician sentiment are as follows:
| • | Over half the respondents from both 2011 and 2012 say that government involvement in regulation will not yield lower costs and better outcomes |
| • | 53% of the respondents see the Affordable Care Act (ACA) as detrimental to high quality care |
| • | Nearly two-thirds of the respondents expect quality of medicine to decline over the next five years |
| • | 73% of the respondents said EHRs are a distraction to doctor-patient interaction |
Our mission is to become medical care givers’ most trusted service. By listening to our clients and understanding their concerns, athenahealth will be better equipped to help our clients manage change while improving their financial and operational performance.
Selling Update
The athenahealth sales organization includes all quota-carrying sales representatives, as well as our sales team leaders, channel sales team, and sales training and development organization.
Q2 2012 was an exciting quarter for the sales team. It was the first complete quarter under the new sales organization structure, which has resulted in improved alignment and coordination across all sales segments. The continuing success of our national accounts team was marked with the signing of the largest deal in the history of the Company, Health Management Associates. We believe that recent signings of large deals like Health Management Associates, MedExpress Urgent Care, and ProMedica validate the successful emergence of our national accounts group. Another highlight of the quarter was the expansion of our relationship with Steward Health Care. We signed a deal with Steward Health Care related to their physician affiliate program in which Steward will provide a significant level of subsidization to drive electronic health record adoption and to support their recent Medicare Pioneer Accountable Care Organization award. We have also continued to expand the number of our quota-carrying sales representatives, which will assist us in achieving our bookings goals. As of June 30, 2012,
13
we have a total of 109 quota-carrying sales representatives, up 31% from 83 quota-carrying sales representatives on June 30, 2011. During Q2 2012, we added a total of four quota-carrying sales representatives in the group, cross-sell, and enterprise practice segments.
Balance Sheet and Cash Flow Highlights
Our cash, cash equivalents, and available-for-sale investments totaled $156.9 million at June 30, 2012. We do not have any outstanding debt obligations. Operating cash flow was $28.0 million in Q2 2012, up 73% from $16.2 million in Q2 2011. Our capital expenditures, including capitalized software development, were $8.4 million (or 8.1% of total revenue) in Q2 2012.
Fiscal Year 2012 Outlook
athenahealth provided 2012 annual guidance at its 4th Annual Investor Summit on December 15, 2011. As a result of our strong performance during the first half of fiscal 2012 and increased visibility into our expected performance in the second half of 2012, we are revising our expectations for full year 2012 as follows:
| Fiscal Year 2012 Expectations Forward Looking Guidance | ||
| GAAP Total Revenue |
$425 - $430 million | |
| Non-GAAP Adjusted Gross Margin |
62.0% - 63.0% | |
| Non-GAAP Adjusted Operating Income |
$59 - $65 million | |
| Non-GAAP Adjusted Net Income per Diluted Share |
$0.90 - $1.00 | |
In addition, our anticipated fiscal year 2012 GAAP effective tax rate is approximately 45% — 46%.
Closing Remarks
athenahealth continues to be well positioned to compete aggressively as a disruptive innovator in health care. We are expanding our MDP program to foster the much needed innovation in health care and health care IT. This program will help us to innovate faster and better and to provide increasing value to our client base. We are further increasing value to our clients through our service expansions, including provider credentialing and management of eligibility-related denials. We also continue to make progress in launching our re-written athenaCoordinator application and are on track to complete the rollout by the end of Q3 2012. We have done all of this while remaining ahead of our financial and operational goals. Mid-way through the year, our balanced scorecard results are 104% of goal. athenahealth’s continued focus on selling results and being medical care givers’ most trusted service continues to resonate in the health care industry, as demonstrated by our expanding client base, our high client satisfaction scores and our high customer retention.
14
Stock-Based Compensation Expense, Summary of Cash Balance and Reconciliation of Non-GAAP Financial Measures
athenahealth, Inc.
STOCK-BASED COMPENSATION EXPENSE
(Unaudited, in thousands)
Set forth below is a breakout of stock-based compensation expense for the three and six months ended June 30, 2012 and 2011:
| Three months ended June 30, | Six months ended June 30, | |||||||||||||||
| 2012 | 2011 | 2012 | 2011 | |||||||||||||
| Stock-based compensation expense charged to: |
||||||||||||||||
| Direct operating |
$ | 1,545 | $ | 810 | $ | 2,453 | $ | 1,415 | ||||||||
| Selling and marketing |
2,015 | 1,159 | 3,687 | 2,082 | ||||||||||||
| Research and development |
1,083 | 486 | 1,848 | 1,016 | ||||||||||||
| General and administrative |
2,708 | 1,456 | 4,996 | 3,403 | ||||||||||||
|
|
|
|
|
|
|
|
|
|||||||||
| Total |
$ | 7,351 | $ | 3,911 | $ | 12,984 | $ | 7,916 | ||||||||
|
|
|
|
|
|
|
|
|
|||||||||
athenahealth, Inc.
CASH, CASH EQUIVALENTS, AND AVAILABLE-FOR-SALE INVESTMENTS
(Unaudited, in thousands)
Set forth below is a breakout of total cash, cash equivalents, and available-for-sale investments as of June 30, 2012, and December 31, 2011:
| June 30, 2012 | December 31, 2011 | |||||||
| Cash, cash equivalents |
$ | 92,330 | $ | 57,781 | ||||
| Short-term investments |
63,029 | 62,084 | ||||||
| Long-term investments* |
1,555 | 18,619 | ||||||
|
|
|
|
|
|||||
| Total |
$ | 156,914 | $ | 138,484 | ||||
|
|
|
|
|
|||||
| * | The Company has purchased certain available-for-sale investments that had a maturity date longer than one-year, which it classifies in “Investments and other assets” on the condensed consolidated balance sheet. |
15
athenahealth, Inc.
RECONCILIATION OF NON-GAAP FINANCIAL MEASURES
TO COMPARABLE GAAP MEASURES
(Unaudited, in thousands, except per share amounts)
The following is a reconciliation of the non-GAAP financial measures used by the Company to describe the Company’s financial results determined in accordance with accounting principles generally accepted in the United States of America (GAAP). An explanation of these measures is also included below under the heading “Explanation of Non-GAAP Financial Measures.”
While management believes that these non-GAAP financial measures provide useful supplemental information to investors regarding the underlying performance of the Company’s business operations, investors are reminded to consider these non-GAAP measures in addition to, and not as a substitute for, financial performance measures prepared in accordance with GAAP. In addition, it should be noted that these non-GAAP financial measures may be different from non-GAAP measures used by other companies, and management may utilize other measures to illustrate performance in the future. Non-GAAP measures have limitations in that they do not reflect all of the amounts associated with the Company’s results of operations as determined in accordance with GAAP.
Please note that these figures may not sum exactly due to rounding.
Non-GAAP Adjusted Gross Margin
Set forth below is a presentation of the Company’s “Non-GAAP Adjusted Gross Profit” and “Non-GAAP Adjusted Gross Margin,” which represents Non-GAAP Adjusted Gross Profit as a percentage of total revenue.
| (unaudited, in thousands) | Three Months Ended | Six Months Ended | ||||||||||||||
| June 30, | June 30, | |||||||||||||||
| 2012 | 2011 | 2012 | 2011 | |||||||||||||
| Total revenue |
$ | 103,515 | $ | 77,885 | $ | 200,081 | $ | 147,815 | ||||||||
| Direct operating expense |
41,014 | 29,020 | 79,812 | 56,290 | ||||||||||||
|
|
|
|
|
|
|
|
|
|||||||||
| Total revenue less direct operating expense |
62,501 | 48,865 | 120,269 | 91,525 | ||||||||||||
| Add: Stock-based compensation expense allocated to direct operating expense |
1,545 | 810 | 2,453 | 1,415 | ||||||||||||
| Add: Amortization of purchased intangibles |
753 | 460 | 1,506 | 920 | ||||||||||||
|
|
|
|
|
|
|
|
|
|||||||||
| Non-GAAP Adjusted Gross Profit |
$ | 64,799 | $ | 50,135 | $ | 124,228 | $ | 93,860 | ||||||||
|
|
|
|
|
|
|
|
|
|||||||||
| Non-GAAP Adjusted Gross Margin |
62.6 | % | 64.4 | % | 62.1 | % | 63.5 | % | ||||||||
16
Non-GAAP Adjusted EBITDA
Set forth below is a reconciliation of the Company’s “Non-GAAP Adjusted EBITDA” and “Non-GAAP Adjusted EBITDA Margin,” which represents Non-GAAP Adjusted EBITDA as a percentage of total revenue.
| (unaudited, in thousands) | Three Months Ended | Six Months Ended | ||||||||||||||
| June 30, | June 30, | |||||||||||||||
| 2012 | 2011 | 2012 | 2011 | |||||||||||||
| Total revenue |
$ | 103,515 | $ | 77,885 | $ | 200,081 | $ | 147,815 | ||||||||
| GAAP net income |
4,154 | 5,186 | 6,582 | 8,437 | ||||||||||||
| Add: Provision for income taxes |
2,599 | 4,166 | 5,492 | 6,471 | ||||||||||||
| Add: Total other (income) expense |
(12 | ) | 77 | (146 | ) | 44 | ||||||||||
| Add: Stock-based compensation expense |
7,351 | 3,911 | 12,984 | 7,916 | ||||||||||||
| Add: Depreciation and amortization |
5,795 | 3,737 | 11,281 | 7,135 | ||||||||||||
| Add: Amortization of purchased intangibles |
753 | 460 | 1,506 | 920 | ||||||||||||
|
|
|
|
|
|
|
|
|
|||||||||
| Non-GAAP Adjusted EBITDA |
$ | 20,640 | $ | 17,537 | $ | 37,699 | $ | 30,923 | ||||||||
|
|
|
|
|
|
|
|
|
|||||||||
| Non-GAAP Adjusted EBITDA Margin |
19.9 | % | 22.5 | % | 18.8 | % | 20.9 | % | ||||||||
Non-GAAP Adjusted Operating Income
Set forth below is a reconciliation of the Company’s “Non-GAAP Adjusted Operating Income” and “Non-GAAP Adjusted Operating Income Margin,” which represents Non-GAAP Adjusted Operating Income as a percentage of total revenue.
| (unaudited, in thousands) | Three Months Ended | Six Months Ended | ||||||||||||||
| June 30, | June 30, | |||||||||||||||
| 2012 | 2011 | 2012 | 2011 | |||||||||||||
| Total revenue |
$ | 103,515 | $ | 77,885 | $ | 200,081 | $ | 147,815 | ||||||||
| GAAP net income |
4,154 | 5,186 | 6,582 | 8,437 | ||||||||||||
| Add: Provision for income taxes |
2,599 | 4,166 | 5,492 | 6,471 | ||||||||||||
| Add: Total other (income) expense |
(12 | ) | 77 | (146 | ) | 44 | ||||||||||
| Add: Stock-based compensation expense |
7,351 | 3,911 | 12,984 | 7,916 | ||||||||||||
| Add: Amortization of purchased intangibles |
753 | 460 | 1,506 | 920 | ||||||||||||
|
|
|
|
|
|
|
|
|
|||||||||
| Non-GAAP Adjusted Operating Income |
$ | 14,845 | $ | 13,800 | $ | 26,418 | $ | 23,788 | ||||||||
|
|
|
|
|
|
|
|
|
|||||||||
| Non-GAAP Adjusted Operating Income Margin |
14.3 | % | 17.7 | % | 13.2 | % | 16.1 | % | ||||||||
17
Non-GAAP Adjusted Net Income
Set forth below is a reconciliation of the Company’s “Non-GAAP Adjusted Net Income” and “Non-GAAP Adjusted Net Income per Diluted Share.”
| (unaudited, in thousands except per share amounts) | Three Months Ended | Six Months Ended | ||||||||||||||
| June 30, | June 30, | |||||||||||||||
| 2012 | 2011 | 2012 | 2011 | |||||||||||||
| GAAP net income |
$ | 4,154 | $ | 5,186 | $ | 6,582 | $ | 8,437 | ||||||||
| Add: Loss on interest rate derivative contract |
— | 138 | — | 73 | ||||||||||||
| Add: Stock-based compensation expense |
7,351 | 3,911 | 12,984 | 7,916 | ||||||||||||
| Add: Amortization of purchased intangibles |
753 | 460 | 1,506 | 920 | ||||||||||||
|
|
|
|
|
|
|
|
|
|||||||||
| Sub-total of tax deductible items |
8,104 | 4,509 | 14,490 | 8,909 | ||||||||||||
| (Less): Tax impact of tax deductible items (1) |
(3,242 | ) | (1,804 | ) | (5,796 | ) | (3,564 | ) | ||||||||
|
|
|
|
|
|
|
|
|
|||||||||
| Non-GAAP Adjusted Net Income |
$ | 9,016 | $ | 7,891 | $ | 15,276 | $ | 13,782 | ||||||||
|
|
|
|
|
|
|
|
|
|||||||||
| Weighted average shares - diluted |
36,906 | 35,773 | 36,951 | 35,715 | ||||||||||||
| Non-GAAP Adjusted Net Income per Diluted Share |
$ | 0.24 | $ | 0.22 | $ | 0.41 | $ | 0.39 | ||||||||
(1) — Tax impact calculated using a statutory tax rate of 40%
| (unaudited, in thousands except per share amounts) | Three Months Ended | Six Months Ended | ||||||||||||||
| June 30, | June 30, | |||||||||||||||
| 2012 | 2011 | 2012 | 2011 | |||||||||||||
| GAAP net income per share - diluted |
$ | 0.11 | $ | 0.14 | $ | 0.18 | $ | 0.24 | ||||||||
| Add: (Gain) loss on interest rate derivative contract |
— | 0.01 | — | — | ||||||||||||
| Add: Stock-based compensation expense |
0.20 | 0.11 | 0.35 | 0.22 | ||||||||||||
| Add: Amortization of purchased intangibles |
0.02 | 0.01 | 0.04 | 0.03 | ||||||||||||
|
|
|
|
|
|
|
|
|
|||||||||
| Sub-total of tax deductible items |
0.22 | 0.13 | 0.39 | 0.25 | ||||||||||||
| (Less): Tax impact of tax deductible items (1) |
(0.09 | ) | (0.05 | ) | (0.16 | ) | (0.10 | ) | ||||||||
|
|
|
|
|
|
|
|
|
|||||||||
| Non-GAAP Adjusted Net Income per Diluted Share |
$ | 0.24 | $ | 0.22 | $ | 0.41 | $ | 0.39 | ||||||||
|
|
|
|
|
|
|
|
|
|||||||||
| Weighted average shares - diluted |
36,906 | 35,773 | 36,951 | 35,715 | ||||||||||||
(1) — Tax impact calculated using a statutory tax rate of 40%
18
athenahealth, Inc.
RECONCILIATION OF NON-GAAP FINANCIAL MEASURES
TO COMPARABLE GAAP MEASURES FOR FISCAL YEAR 2012 GUIDANCE
(Unaudited, in millions, except per share amounts)
Please note that the figures presented below may not sum exactly due to rounding.
Non-GAAP Adjusted Gross Margin Guidance
Set forth below is a presentation of the Company’s “Non-GAAP Adjusted Gross Profit” and “Non-GAAP Adjusted Gross Margin” guidance for fiscal year 2012, which represents Non-GAAP Adjusted Gross Profit as a percentage of total revenue.
| LOW | HIGH | |||||||
| Fiscal Year Ending December 31, 2012 | ||||||||
| Total revenue |
$ | 425.0 | $ | 430.0 | ||||
| Direct operating expense |
169.1 | 166.7 | ||||||
|
|
|
|
|
|||||
| Total revenue less direct operating expense |
$ | 255.9 | $ | 263.3 | ||||
|
|
|
|
|
|||||
| Add: Stock-based compensation expense allocated to direct operating expense |
4.7 | 4.7 | ||||||
| Add: Amortization of purchased intangibles |
2.9 | 2.9 | ||||||
|
|
|
|
|
|||||
| Non-GAAP Adjusted Gross Profit |
$ | 263.5 | $ | 271.0 | ||||
|
|
|
|
|
|||||
| Non-GAAP Adjusted Gross Margin |
62.0 | % | 63.0 | % | ||||
Non-GAAP Adjusted Operating Income Guidance
Set forth below is a reconciliation of the Company’s “Non-GAAP Adjusted Operating Income” and “Non-GAAP Adjusted Operating Income Margin” guidance for fiscal year 2012, which represents Non-GAAP Adjusted Operating Income as a percentage of total revenue.
| LOW | HIGH | |||||||
| Fiscal Year Ending December 31, 2012 | ||||||||
| Total revenue |
$ | 425.0 | $ | 430.0 | ||||
| GAAP net income |
15.0 | 18.5 | ||||||
| Add: Provision for income taxes |
13.5 | 16.2 | ||||||
| Add: Acquisition-related expenses |
— | — | ||||||
| Add (less): Total other (income) expense |
(0.4 | ) | (0.6 | ) | ||||
| Add: Stock-based compensation expense |
28.0 | 28.0 | ||||||
| Add: Amortization of purchased intangibles |
2.9 | 2.9 | ||||||
|
|
|
|
|
|||||
| Non-GAAP Adjusted Operating Income |
$ | 59.0 | $ | 65.0 | ||||
|
|
|
|
|
|||||
| Non-GAAP Adjusted Operating Income Margin |
13.9 | % | 15.1 | % | ||||
19
Non-GAAP Adjusted Net Income Guidance
Set forth below is a reconciliation of the Company’s “Non-GAAP Adjusted Net Income” and “Non-GAAP Adjusted Net Income per Diluted Share” guidance for fiscal year 2012.
| LOW | HIGH | |||||||
| Fiscal Year Ending December 31, 2012 | ||||||||
| GAAP net income |
$ | 15.0 | $ | 18.5 | ||||
| Add: Stock-based compensation expense |
28.0 | 28.0 | ||||||
| Add: Amortization of purchased intangibles |
2.9 | 2.9 | ||||||
|
|
|
|
|
|||||
| Sub-total of tax deductible items |
$ | 30.9 | $ | 30.9 | ||||
|
|
|
|
|
|||||
| (Less): Tax impact of tax deductible items (1) |
(12.4 | ) | (12.4 | ) | ||||
|
|
|
|
|
|||||
| Non-GAAP Adjusted Net Income |
$ | 33.5 | $ | 37.0 | ||||
|
|
|
|
|
|||||
| Weighted average shares - diluted |
37.2 | 37.2 | ||||||
|
|
|
|
|
|||||
| Non-GAAP Adjusted Net Income per Diluted Share |
$ | 0.90 | $ | 1.00 | ||||
|
|
|
|
|
|||||
| (1) | Tax impact calculated using a statutory tax rate of 40% |
| LOW | HIGH | |||||||
| Fiscal Year Ending December 31, 2012 | ||||||||
| GAAP net income per share - diluted |
$ | 0.40 | $ | 0.50 | ||||
| Add: Stock-based compensation expense |
0.75 | 0.75 | ||||||
| Add: Amortization of purchased intangibles |
0.08 | 0.08 | ||||||
|
|
|
|
|
|||||
| Sub-total of tax deductible items |
$ | 0.83 | $ | 0.83 | ||||
|
|
|
|
|
|||||
| (Less): Tax impact of tax deductible items (1) |
(0.33 | ) | (0.33 | ) | ||||
|
|
|
|
|
|||||
| Non-GAAP Adjusted Net Income per Diluted Share |
$ | 0.90 | $ | 1.00 | ||||
|
|
|
|
|
|||||
| Weighted average shares - diluted |
37.2 | 37.2 | ||||||
| (1) | Tax impact calculated using a statutory tax rate of 40% |
20
Explanation of Non-GAAP Financial Measures
The Company reports its financial results in accordance with accounting principles generally accepted in the United States of America, or GAAP. However, management believes that, in order to properly understand the Company’s short-term and long-term financial and operational trends, investors may wish to consider the impact of certain non-cash or non-recurring items, when used as a supplement to financial performance measures in accordance with GAAP. These items result from facts and circumstances that vary in frequency and impact on continuing operations. Management also uses results of operations before such items to evaluate the operating performance of the Company and compare it against past periods, make operating decisions, and serve as a basis for strategic planning. These non-GAAP financial measures provide management with additional means to understand and evaluate the operating results and trends in the Company’s ongoing business by eliminating certain non-cash expenses and other items that management believes might otherwise make comparisons of the Company’s ongoing business with prior periods more difficult, obscure trends in ongoing operations, or reduce management’s ability to make useful forecasts. Management believes that these non-GAAP financial measures provide additional means of evaluating period-over-period operating performance. In addition, management understands that some investors and financial analysts find this information helpful in analyzing the Company’s financial and operational performance and comparing this performance to its peers and competitors.
Management defines “Non-GAAP Adjusted Gross Profit” as total revenue, less direct operating expense, plus (1) stock-based compensation expense allocated to direct operating expense and (2) amortization of purchased intangibles, and “Non-GAAP Adjusted Gross Margin” as Non-GAAP Adjusted Gross Profit as a percentage of total revenue. Management considers these non-GAAP financial measures to be important indicators of the Company’s operational strength and performance of its business and a good measure of its historical operating trends. Moreover, management believes that these measures enable investors and financial analysts to closely monitor and understand changes in the Company’s ability to generate income from ongoing business operations.
Management defines “Non-GAAP Adjusted EBITDA” as the sum of GAAP net income before provision for income taxes, total other (income) expense, stock-based compensation expense, depreciation and amortization, and amortization of purchased intangibles and “Non-GAAP Adjusted EBITDA Margin” as Non-GAAP Adjusted EBITDA as a percentage of total revenue. Management defines “Non-GAAP Adjusted Operating Income” as the sum of GAAP net income before provision for income taxes, total other (income) expense, stock-based compensation expense, and amortization of purchased intangibles, and “Non-GAAP Adjusted Operating Income Margin” as Non-GAAP Adjusted Operating Income as a percentage of total revenue. Management defines “Non-GAAP Adjusted Net Income” as the sum of GAAP net income before (gain) loss on interest rate derivative contract, stock-based compensation expense, amortization of purchased intangibles, and any tax impact related to these items, and “Non-GAAP Adjusted Net Income per Diluted Share” as Non-GAAP Adjusted Net Income divided by weighted average diluted shares outstanding. Management considers all of these non-GAAP financial measures to be important indicators of the Company’s operational strength and performance of its business and a good measure of its historical operating trends, in particular the extent to which ongoing operations impact the Company’s overall financial performance.
Management excludes each of the items identified below from the applicable non-GAAP financial measure referenced above for the reasons set forth with respect to that excluded item:
| • | Stock-based compensation expense — excluded because these are non-cash expenses that management does not consider part of ongoing operating results when assessing the performance of the Company’s business, and also because the total amount of expense is partially outside of the Company’s control because it is based on factors such as stock price, volatility, and interest rates, which may be unrelated to the Company’s performance during the period in which the expense is incurred. |
21
| • | Amortization of purchased intangibles — purchased intangibles are amortized over their estimated useful life and generally cannot be changed or influenced by management after the acquisition. Accordingly, this item is not considered by management in making operating decisions. Thus, including such charge does not accurately reflect the performance of the Company’s ongoing operations for the period in which such charge is incurred. |
| • | Gains and losses on interest rate derivative contract — excluded because, until they are realized, to the extent these gains or losses impact a period presented, management does not believe that they reflect the underlying performance of ongoing business operations for such period. |
22
Supplemental Metrics and Definitions

Supplemental Metrics (unaudited)
Last Updated: June 30, 2012
| Fiscal Year 2011 | Fiscal Year 2012 | |||||||||||||||||||||||
| Q1 | Q2 | Q3 | Q4 | Q1 | Q2 | |||||||||||||||||||
| Client Base |
||||||||||||||||||||||||
| Total Physicians on athenaCollector |
19,778 | 20,824 | 22,477 | 23,210 | 24,101 | 25,001 | ||||||||||||||||||
|
|
|
|
|
|
|
|
|
|
|
|
|
|||||||||||||
| Total Providers on athenaCollector |
27,944 | 29,482 | 31,675 | 32,740 | 33,923 | 35,409 | ||||||||||||||||||
|
|
|
|
|
|
|
|
|
|
|
|
|
|||||||||||||
| Total Physicians on athenaClinicals |
2,910 | 3,444 | 4,202 | 4,662 | 5,331 | 6,151 | ||||||||||||||||||
|
|
|
|
|
|
|
|
|
|
|
|
|
|||||||||||||
| Total Providers on athenaClinicals |
4,161 | 4,848 | 5,849 | 6,525 | 7,402 | 8,558 | ||||||||||||||||||
|
|
|
|
|
|
|
|
|
|
|
|
|
|||||||||||||
| Total Physicians on athenaCommunicator |
934 | 1,198 | 2,931 | 4,098 | 4,820 | 6,306 | ||||||||||||||||||
|
|
|
|
|
|
|
|
|
|
|
|
|
|||||||||||||
| Total Providers on athenaCommunicator |
1,564 | 1,936 | 4,117 | 5,830 | 6,800 | 8,642 | ||||||||||||||||||
|
|
|
|
|
|
|
|
|
|
|
|
|
|||||||||||||
| Client Performance |
||||||||||||||||||||||||
| Client Satisfaction |
86.2 | % | 85.9 | % | 85.6 | % | 87.3 | % | 86.3 | % | 89.8 | % | ||||||||||||
| Client Days in Accounts Receivable (DAR) |
41.0 | 39.1 | 39.7 | 38.9 | 40.0 | 38.2 | ||||||||||||||||||
| First Pass Resolution (FPR) Rate |
94.1 | % | 93.4 | % | 93.8 | % | 93.7 | % | 91.3 | % | 92.9 | % | ||||||||||||
| Electronic Remittance Advice (ERA) Rate |
74.6 | % | 76.7 | % | 78.3 | % | 77.9 | % | 78.0 | % | 77.7 | % | ||||||||||||
|
|
|
|
|
|
|
|
|
|
|
|
|
|||||||||||||
| Total Claims Submitted |
13,651,586 | 14,361,876 | 14,854,109 | 16,368,172 | 17,839,150 | 17,467,447 | ||||||||||||||||||
|
|
|
|
|
|
|
|
|
|
|
|
|
|||||||||||||
| Total Client Collections |
$ | 1,608,313,685 | $ | 1,811,067,978 | $ | 1,866,806,003 | $ | 1,990,373,883 | $ | 2,081,686,428 | $ | 2,259,202,690 | ||||||||||||
|
|
|
|
|
|
|
|
|
|
|
|
|
|||||||||||||
| Total Working Days |
62 | 64 | 64 | 61 | 62 | 64 | ||||||||||||||||||
|
|
|
|
|
|
|
|
|
|
|
|
|
|||||||||||||
| Employees |
||||||||||||||||||||||||
| Direct |
719 | 771 | 1036 | 1068 | 1080 | 1192 | ||||||||||||||||||
| Sales & Marketing |
217 | 236 | 247 | 276 | 295 | 315 | ||||||||||||||||||
| Research & Development |
216 | 236 | 263 | 277 | 292 | 357 | ||||||||||||||||||
| General & Administrative |
144 | 151 | 168 | 174 | 187 | 196 | ||||||||||||||||||
|
|
|
|
|
|
|
|
|
|
|
|
|
|||||||||||||
| Total Employees |
1,296 | 1,393 | 1,713 | 1,795 | 1,853 | 2,060 | ||||||||||||||||||
|
|
|
|
|
|
|
|
|
|
|
|
|
|||||||||||||
| Quota Carrying Sales Force |
||||||||||||||||||||||||
| Total Quota Carrying Sales Representatives |
78 | 83 | 83 | 99 | 105 | 109 | ||||||||||||||||||
|
|
|
|
|
|
|
|
|
|
|
|
|
|||||||||||||
23

Supplemental Metrics Definitions
| Client Base | ||
| Total Physicians on athenaCollector | The number of physicians that have rendered a service which generated a medical claim that was billed during the last 91 days on the athenaCollector platform. Examples of physicians include Medical Doctors (MD) and Doctor of Osteopathic Medicine (DO). | |
| Total Providers on athenaCollector | The number of providers, including physicians, that have rendered a service which generated a medical claim that was billed during the last 91 days on the athenaCollector platform. Examples of non-physician providers are Nurse Practitioners (NP) and Registered Nurses (RN). | |
| Total Physicians on athenaClinicals | The number of physicians that have rendered a service through the athenaClinicals platform which generated a medical claim that was billed during the last 91 days on the athenaCollector platform. Examples of physicians include Medical Doctors (MD) and Doctor of Osteopathic Medicine (DO). | |
| Total Providers on athenaClinicals | The number of providers, including physicians, that have rendered a service through the athenaClinicals platform which generated a medical claim that was billed during the last 91 days on the athenaCollector platform. Examples of non-physicians are Nurse Practitioners (NP) and Registered Nurses (RN). | |
| Total Physicians on athenaCommunicator | The number of physicians that have rendered a service which generated a medical claim that was billed during the last 91 days on the athenaCollector platform and whose practice is actively using athenaCommunicator. | |
| Total Providers on athenaCommunicator | The number of providers, including physicians, that have rendered a service which generated a medical claim that was billed during the last 91 days on the athenaCollector platform and whose practice is actively using athenaCommunicator. | |
| Client Performance | ||
| Client Satisfaction | The percentage of athenaCollector clients who chose 4 or 5 on a scale of 1 to 5 when asked if they would recommend athenahealth to a trusted friend or colleague. These responses are generated from a “client listening” survey that the company conducts for its client base twice per year. | |
| Client Days in Accounts Receivable (DAR) | The average number of days that it takes outstanding balances on claims to be resolved, e.g. paid, for clients on athenaCollector. Clients that have been live less than 90 days are excluded, as well as clients who are terminating services. | |
| First Pass Resolution (FPR) Rate | Approximates the percentage of primary claims that are favorably adjudicated and closed after a single submission during the period. Currently, the FPR rate is calculated on a monthly basis, and certain practices are excluded (e.g. those that have been live for less than 90 days). | |
| Electronic Remittance Advice (ERA) Rate | Remittance refers to the information about payments (a/k/a explanations of benefits) received from insurance companies during the period. The ERA rate reflects the percentage of total charges that were posted using electronic remittance. | |
| Total Claims Submitted | The number of claims billed through athenaNet during the period. | |
| Total Client Collections | The dollar value of collections posted on behalf of clients during the period. | |
| Total Working Days | The total number of days during the quarter minus weekends and U.S. Post Office holidays. | |
| Employees | ||
| Direct | The total number of full time equivalent individuals (FTEs) employed by the Company to support its service operations as of quarter end. This team includes production systems, enrollment services, paper claim submission, claim resolution, clinical operations, professional services, account management, and client services. | |
| Sales & Marketing | The total number of FTEs employed by the Company to support its sales and marketing efforts as of quarter end. This team includes sales representatives, business development staff and the marketing team. | |
| Research & Development | The total number of FTEs employed by the Company to support its research and development efforts as of quarter end. This team includes product development and product management. | |
| General & Administrative | The total number of FTEs employed by the Company to support its general and administrative functions as of quarter end. This team includes finance, human resources, compliance, learning and development, internal audit, corporate technology, recruiting, facilities, and legal. | |
| Total Employees | The total number of FTEs employed by the Company as of quarter end. This number excludes interns and seasonal employees. | |
| Quota-Carrying Sales Force | ||
| Total Quota Carrying Sales Representatives | The total number of sales representatives who carry quota for net new annual recurring revenue as of quarter end. | |
24

Corporate Scorecard Metrics Definitions
| Stability | ||
| Voluntary Turnover | The number of voluntary terminations during the period divided by starting headcount. | |
| Corporate Compliance | Percentage of compliance tasks that are met within the deadline. | |
| Employee Engagement | Quarterly engagement survey results for employees. | |
| Performance | ||
| Client Days in Accounts Receivable (DAR) | The average number of days that it takes outstanding balances on claims to be resolved, e.g. paid, for clients on athenaCollector. Clients that have been live less than 90 days are excluded, as well as clients who are terminating services. | |
| DAR in Client Work Buckets | The number of days in accounts receivable that are due to tasks assigned to clients’ work buckets. | |
| Client Collection Rate | The percentage of charges that are not written off to bad debt. | |
| Provider Documentation Time per Appointment | The average number of minutes athenaClinicals providers spend on the computer documenting the exam and orders for each appointment. Providers that have been live less than 90 days are excluded. | |
| Satisfaction | ||
| Client Touches per Claim | The total number of scrub records, denials on the back-end and posting exceptions that clients must work divided by the total number of claims created. | |
| Client Tickets per Provider (per month) | The number of Client Service Center (CSC) cases that are not resolved on the initial call by the CSC team divided by the number of athenaCollector providers. | |
| Client Satisfaction | The percentage of clients who chose 4 or 5 on a scale of 1 to 5 when asked if they would recommend athenahealth to a trusted friend or colleague. These responses are generated from a “client listening” survey that the company conducts for its client base twice per year. | |
| Financial | ||
| Total Revenue | Total consolidated revenue. | |
| Non-GAAP Adjusted Operating Income | Total non-GAAP adjusted operating income. | |
| Growth | ||
| Bookings | The annualized value of deals sold. | |
25