Attached files
| file | filename |
|---|---|
| 8-K - FORM 8-K - PNC FINANCIAL SERVICES GROUP, INC. | d378588d8k.htm |
| EX-99.1 - FINANCIAL SUPPLEMENT (UNAUDITED) FOR SECOND QUARTER 2012 - PNC FINANCIAL SERVICES GROUP, INC. | d378588dex991.htm |
 The PNC
Financial Services Group, Inc. Second Quarter 2012
Earnings Conference Call
July 18, 2012
Exhibit 99.2 |
 2
Cautionary Statement Regarding Forward-Looking
Information and Adjusted Information
2 |
 3
Significant 2Q12 Achievements
PNC Is Positioned to Deliver Even Greater Shareholder Value.
PNC Is Positioned to Deliver Even Greater Shareholder Value.
2Q12 financial
summary
Net income
Diluted EPS from
net income
Return on
average assets
$546 million
$0.98
.74%
Net income of $546 million and EPS of $0.98
Strong performance driven by customer growth and our Southeast expansion
Grew commercial and consumer loans
Overall credit quality improved
Well-managed expenses -
continuous improvement initiatives remained on track
Continued to maintain strong capital levels and liquidity positions
2Q12 highlights
(1) Further information is provided in the Appendix.
3
–
Includes $403 million or $0.76 EPS charge associated with residential mortgage
repurchase obligations, trust preferred securities redemptions and integration
1 |
 Business
Fundamentals Continued to Improve 2Q12 Retail Banking
2Q12 Corporate & Institutional Banking
2Q12 Asset Management Group
2Q12 Residential Mortgage
Grew
net
organic
checking
relationships
by
128,000 or 4% annualized YTD12; greater than
1.9% footprint population growth
65%
of
new
accounts opened
in
2Q12
were
relationship accounts
Virtual Wallet surpassed one million accounts
Active online bill payment customers increased
8% in 1H12; 14% from 2Q11
Serving Customers Tomorrow strategy -
deployed over 400 image enabled ATMs
Continued
strong
client
additions
–
added
nearly
500
new Corporate Banking primary clients in 1H12
Continued loan growth
–
Total average loans increased $9 billion or 12%
from 1Q12 and 32% from 2Q11
Commercial mortgage banking activities increased by
$65 million in 1H12 from 1H11 driven by higher
mortgage loan servicing income and lower CMSR
impairment
Assets under administration of $214 billion
Strong
growth
in
new
primary
clients
Referral sales
grew 25% linked quarter
Total sales increased by 10% compared to 1Q12
Loan sales revenue
up 142% from 2Q11
Driven by increased loan origination volumes up 38%
from 2Q11up 38% from
2Q11 Spreads increased 18% from 2Q11
Purchase money mortgage originations
increased
21% from 2Q11
Increased mortgage repurchase reserves reflect
increasing GSE demands -
GSEs represent 64% of
remaining UPB
(1) Net organic checking relationship growth refers to consumer and small business accounts
exclusive of 57,000 accounts acquired through acquisition in 1Q12. (2) Relationship
checking accounts refer to accounts with a committed balance level or self-service accounts with lower cost of servicing. (3) A
Corporate Banking primary client is defined as a corporate banking relationship with annual
revenue generation of $50,000 or more or, within corporate banking, a commercial
banking client relationship with annual revenue generation of $10,000 or more. AMG primary client relationships are defined as client
relationships with annual revenue generation of $10,000 or more.(4) New client sales referred
to AMG by Retail Banking or C&IB. (5) Refers to loan sales revenue
before
provision.
(6)
A
mortgage
with
a
borrower
as
part
of
a
residential
real
estate
purchase
transaction.
4
Treasury Management revenues up 3% linked quarter
1
2
3
4
5
3
6
–
Driven by increased loan origination volumes
–
Spreads increased 18% from 2Q11 |
 Earnings
2Q12
1Q12
2Q11
YTD12
YTD11
Net income ($ millions)
$546
$811
$912
$1,357
$1,744
Earnings per diluted share
$0.98
$1.44
$1.67
$2.42
$3.24
Select
charges
EPS impact
($0.76)
($0.22)
($0.04)
($0.98)
($0.05)
Performance
Measures
2Q12
1Q12
2Q11
YTD12
YTD11
Return on average assets
.74%
1.16%
1.40%
.94%
1.34%
Return
on
Tier
1
common
capital
9.3%
14.0%
16.1%
11.5%
15.5%
(1) At period-end. (2) Charges for residential mortgage repurchase obligations,
unamortized discounts related to redemptions of trust preferred
securities,
and
integration
costs.
Further
information is provided in the Appendix. (3) Tier 1 common capital at June 30, 2012 is
estimated. Return on Tier 1 common capital is calculated as annualized net income divided by
period-end Tier 1 common capital. Further information is provided in the
Appendix. Balance
Sheet
Growth
2Q12
1Q12
2Q11
Loans
$180
$176
$150
Deposits
$207
$206
$182
1
($ billions)
1
($ billions)
3
2
5
Strong Financial Performance Affected by Select
Charges |
 Strong
Commercial Loan Growth Funded by Favorable Deposit Mix
Loans increased $4.2 billion or 2%
from 1Q12, primarily driven by
total commercial loan growth of
3%
Consumer loan growth increased
1%
linked
quarter,
primarily driven
by growth in automobile
Transaction deposits increased
$1.5 billion from 1Q12, reflecting
increased commercial and
consumer liquidity
Retail CDs declined $3.1 billion
from 1Q12, reflecting expected
run-off as the final wave of higher
rate CDs matured in the quarter
Loans to deposits and capital
ratios remained stable
% change from:
Category (billions)
Jun. 30,
2012
Mar. 31,
2012
Jun. 30,
2011
Commercial
78.9
5%
35%
Commercial real estate
18.5
0%
14%
Total commercial lending
104.1
3%
28%
Home equity/Residential RE
51.7
(1%)
7%
Automobile
7.2
24%
95%
Other
17.4
(2%)
2%
Total consumer lending
76.3
1%
10%
Total loans
$180.4
2%
20%
Transaction deposits
$166.0
1%
21%
Retail CDs & other deposits
40.9
(1%)
(9%)
Total deposits
$206.9
0%
14%
Key ratios:
Loans to deposits ratio
87%
85%
83%
Tier 1 common capital ratio
9.3%
9.3%
10.5%
(1)
Total commercial lending includes commercial, commercial real estate and also includes $6.8
billion of equipment lease financing. (2)
Includes credit card, education and other loans. (3) Tier 1 common capital ratio is
period-end Tier 1 common capital divided by period-end risk weighted assets and
is estimated for June 30, 2012. 2Q12 highlights
1
3
6
2 |
 Loan Growth and
Reduced Funding Costs Driving Net Interest Income
(millions)
2Q12
1Q12
4Q11
3Q11
2Q11
Interest income -
loans
$2,163
$1,951
$1,902
$1,904
$1,905
Total interest income
2,796
2,597
2,534
2,530
2,547
Total interest expense
270
306
335
355
397
Total net interest income
$2,526
$2,291
$2,199
$2,175
$2,150
Average
interest
earning
assets
grew
$12
billion
or
5%
from
1Q12
and 13% from 2Q11
Net
interest
margin
improved
primarily
due
to
lower
funding
costs
and
higher
yielding
assets
Total
net
interest
income
grew
10%
from
1Q12
and
17%
from
2Q11
–
Higher loan balances
–
Impact of Southeast expansion
–
Lower funding costs
(1) Calculated as annualized taxable-equivalent net interest income divided by average
earning assets. See Appendix for additional information. 2Q12
1Q12
4Q11
3Q11
2Q11
Average interest earning
assets (in billions)
$250.1
$237.7
$228.4
$224.1
$220.7
Average yields/rate:
Interest-earning assets
4.51%
4.41%
4.44%
4.52%
4.64%
Interest-bearing liabilities
.58
.70
.80
.86
.95
Interest rate spread
3.93
3.71
3.64
3.66
3.69
Net interest margin
4.08%
3.90%
3.86%
3.89%
3.93%
10% LQ
17% YOY
2Q12 highlights
7
1 |
 3
Client Growth and Sales Impact Noninterest Revenue
2Q12 highlights
(1) Asset management includes the Asset Management Group and BlackRock. (2) Residential
mortgage consists of residential mortgage banking less provision for residential
mortgage repurchase obligations. (3) The Dodd-Frank Act limits related to interchange rates on debit
card transactions, which were effective October 1, 2011; 3Q11 and 2Q11 amounts reflect the
estimated impact of Durbin if it had been in effect for those quarters.
Noninterest income in the quarter
included provision for residential
mortgage
repurchase
obligations
of
$438
million
Excluding the residential mortgage
repurchase provision and Durbin
impact, noninterest income grew
4% linked quarter and 9%
compared to the same period last
year
Consumer,
corporate
and mortgage
services
delivered
strong
fee
income
growth
from
prior
periods
(millions)
2Q12
1Q12
4Q11
3Q11
2Q11
Asset management
$278
$284
$250
$287
$288
Consumer services
290
264
269
330
333
Corporate services
290
232
266
187
228
Residential mortgage
banking
265
262
193
229
184
Provision for residential
mortgage repurchase
obligations
(438)
(32)
(36)
(31)
(21)
Deposit service charges
144
127
140
140
131
Net gains on sales of
securities less net OTTI
28
19
18
33
43
Other
240
285
250
194
266
Total noninterest income
$1,097
$1,441
$1,350
$1,369
$1,452
Provision for residential
mortgage repurchase
obligations
438
32
36
31
21
Durbin impact
(70)
(70)
Total noninterest income,
excl. mortgage
repurchase obligations
and Durbin impact
$1,535
$1,473
$1,386
$1,330
$1,403
9% YOY
8
4% LQ
2
1 |
 Key
Statistics Total
Portfolio
GSEs
($ billions)
Total
Portfolio
‘06-‘08
Vintages
Original UPB
$384
$214
$57
Remaining UPB
106
68
15
Life-to-date demands
3.9
2.4
1.7
Life-to-date repurchases
2.3
1.3
1.0
Life-to-date losses
1.2
0.6
0.4
Future expected losses
0.5
0.4
0.3
Total expected losses
$1.7
$1.0
$0.7
Residential Mortgage Repurchase Obligations
Summary of Changes in Residential Mortgage Repurchase Reserve
($ millions)
2Q12
1Q12
4Q11
3Q11
2Q11
Beginning Reserve
$101
$83
$85
$95
$124
Provision
438
32
36
31
21
RBC Bank (USA)
-
26
-
-
-
Losses
(77)
(40)
(38)
(41)
(50)
Ending Balance
$462
$101
$83
$85
$95
Recent and expected elevated
levels of GSE-related repurchase
demands
As a result, PNC added provision of
approximately $438 million to
residential mortgage repurchase
reserves in 2Q12
(1) As of June 30, 2012.
2Q12 highlights
9
–
Expect lifetime losses of $1.7
billion
–
Barring significant changes in
the expected future behaviors
and demand patterns of
investors/guarantors or other
unforeseen circumstances, we
believe we are appropriately
reserved against future
demands
1 |
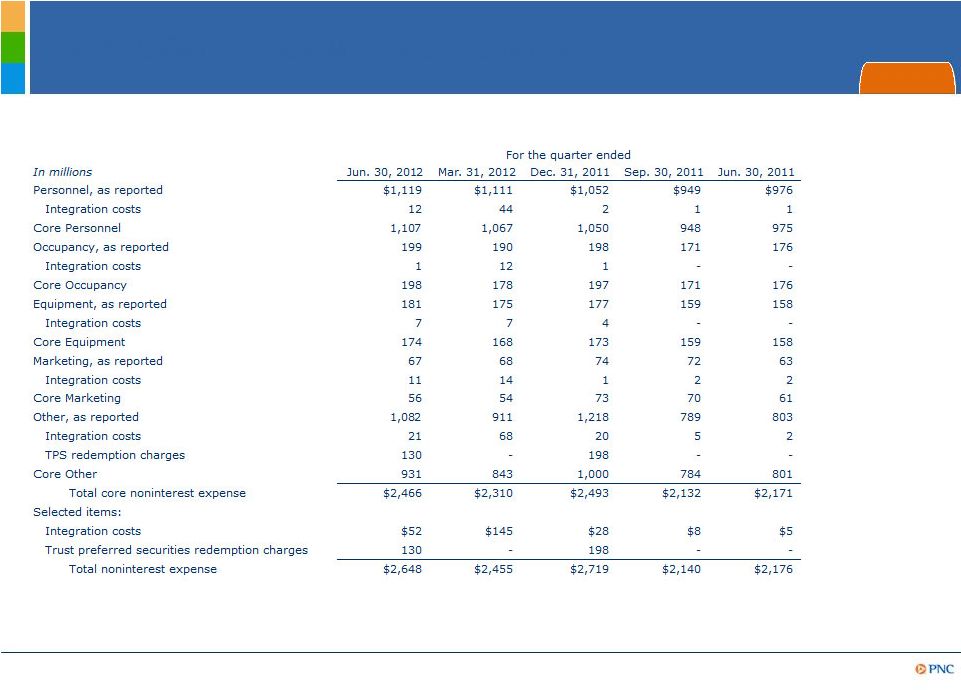
 Disciplined
Expense Management While Investing for Growth
(millions)
2Q12
1Q12
4Q11
3Q11
2Q11
Core
:
Personnel
$1,107
$1,067
$1,050
$948
$975
Occupancy
198
178
197
171
176
Equipment
174
168
173
159
158
Marketing
56
54
73
70
61
Other
931
843
1,000
784
801
Total core noninterest
expense
$2,466
$2,310
$2,493
$2,132
$2,171
Integration costs
52
145
28
8
5
Trust preferred securities
redemption charges
130
-
198
-
-
Total noninterest
expense
$2,648
$2,455
$2,719
$2,140
$2,176
(1) Core noninterest expense items do not include the impact of integration costs and trust
preferred securities redemption charges, which are listed separately in the table
above, but do include the impact of RBC Bank (USA) operating expenses. See the Appendix for the impact of
integration costs and trust preferred securities redemptions charges for unamortized discount
on each category of noninterest expense. 2Q12 highlights
10
Includes $149 million of RBC Bank (USA)
1
1
Total core noninterest expense
increased $156 million from 1Q12
primarily due to:
Core noninterest expense
increased $295 million from 2Q11
due to:
Successfully completed 60% of our
$550 million continuous
improvement annualized cost
savings goals
RBC Bank (USA) operating
costs of $149 million
Higher additions to legal
reserves, other real estate
owned expenses, mortgage
foreclosure-related expenses
and pension costs
Full quarter impact of RBC
Bank (USA) operating expenses
of $149 million vs. $40 million
in 1Q12 |
 Strong Capital
and Liquidity Position (1) Regulatory requirements are inclusive of the capital
conservation buffer and subject to further regulatory guidance and clarity on Basel
NPRs. (2) Estimated at June 30, 2012. (3) Based on Basel III NPRs and including application of
Basel II (as modified by NPRs) and Basel II.5 rules. (4) Parent company liquidity
coverage defined as liquid assets divided by funding obligations within a two year period.
2Q12 highlights
Basel I Tier 1 common ratio of 9.3%
Capital priorities:
–
Build capital to support client growth and
business investment
–
Maintain appropriate capital in light of
economic uncertainty
–
Return excess capital to shareholders
Basel III Tier 1 common ratio goal of 8.0-8.5%
by year-end 2013 without benefit of phase-ins
Strong liquidity position
–
Loans to deposits ratio of 87%
–
Parent company two year liquidity
coverage
4
of 117%
Basel III Tier 1 common ratio
8.0% -
8.5%
2013 Goal
Basel III
2013 2014 2015 2016 2017 2018 2019
3.5%
4.0%
4.5%
5.1%
5.8%
6.4%
7.0%
11
–
Improved capital treatment expected on
sub-investment grade securities
1
2
3
Basel III requirements |
 Outlook –
Full Year 2012 vs. 2011
PNC is Positioned to Deliver Strong Results in 2012.
PNC is Positioned to Deliver Strong Results in 2012.
Loans
Increase mid to high teens
Total revenue
Noninterest expense
Loan loss provision
Increase high single digits
Increase high single digits
Improving
Combined
Balance sheet
Combined
Income
statement
1
4
5,6
6
2
Estimated % Change
3
Strong loan and revenue growth expected
RBC Bank (USA) acquisition expected to be accretive in 2012
Disciplined credit and expense management
(1)
Refer
to
the
Cautionary
Statement
in
the
Appendix,
including
assumptions.
(2) Excluding
integration
costs.
(3)
Estimated
change
for
2012
is based on comparable 2011 results. (4) Excluding future significant residential mortgage
repurchase provisions. (5) Excluding integration costs and capital actions related to
TPS redemptions for 2011 and 2012. (6) Excludes future significant legal and regulatory costs that may be
incurred in the remainder of the year.
12 |
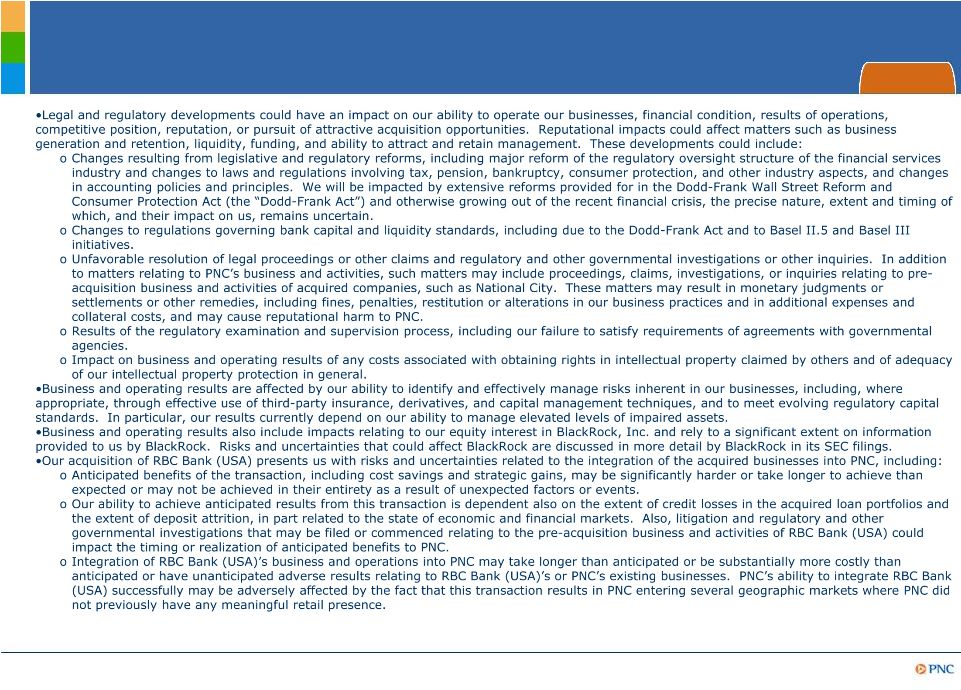
 Cautionary
Statement Regarding Forward-Looking Information
Appendix
13 |
 14
Cautionary Statement Regarding Forward-Looking
Information (continued)
Appendix |
 Cautionary
Statement Regarding Forward-Looking Information
(continued) Appendix
15 |
 16
Non-GAAP to GAAP Reconcilement
Appendix |
 17
Appendix
Non-GAAP to GAAP Reconcilement |
 18
Appendix
Non-GAAP to GAAP Reconcilement |