Attached files
| file | filename |
|---|---|
| 8-K - INVESTOR PRESENTATION 8-K - GLOBE SPECIALTY METALS INC | investorpres8k.htm |

July 18, 2012
Globe Specialty Metals Investor Day

Disclaimer
This presentation may contain statements that relate to future events and expectations and, as such, constitute
"forward-looking statements" within the meaning of the federal securities laws. These statements can be
identified by the use of words such as “believes,” “expects,” “may,” “will,” “intends,” “plans,” “estimates” or
“anticipates,” or other comparable terminology, or by discussions of strategy, plans or intentions. These
statements are based on management’s current expectations and assumptions about the industries in which
Globe operates. Globe disclaims any intention or obligation to update publicly any forward-looking statements,
whether in response to new information, future events or otherwise, except as required by applicable law.
Forward-looking statements are not guarantees of future performance and are subject to significant risks and
uncertainties that may cause actual results or achievements to be materially different from the future results or
achievements expressed or implied by the forward-looking statements. These risks and uncertainties include,
but are not limited to, those risks and uncertainties described in Globe’s most recent Annual Report on Form 10
-K, including under “Special Note Regarding Forward-Looking Statements” and “Risk Factors” and Globe’s
quarterly reports on Form 10-Q. These reports can be accessed through the “Investors” section of Globe’s
website at www.glbsm.com.
EBITDA is a non-GAAP measure. We have included EBITDA to provide a supplemental measure of our
performance which we believe is important because it eliminates items that have less bearing on our current
and future operating performance and so highlights trends in our core business that may not otherwise be
apparent when relying solely on GAAP financial measures. A reconciliation of EBITDA to net income is
provided in the attached appendix.
All references to “MT” or “tons” mean metric tons, each of which equals 2,204.6 pounds.
1

Recent Accomplishments
n Added additional 25% silicon capacity (= 10% additional revenue)
through acquisition of 51% of Quebec Silicon - a 47,000MT silicon
metal plant
through acquisition of 51% of Quebec Silicon - a 47,000MT silicon
metal plant
n Acquisition of Alden Resources - secured source for best quality
ultra-low ash, high purity coal in the world for silicon production
ultra-low ash, high purity coal in the world for silicon production
n Significant liquidity of ~$445m consisting of:
− $300m revolving credit facility at LIBOR + 175, less $120m drawn
− $125m accordion
− $141m cash*
2
*As of 3/31/12

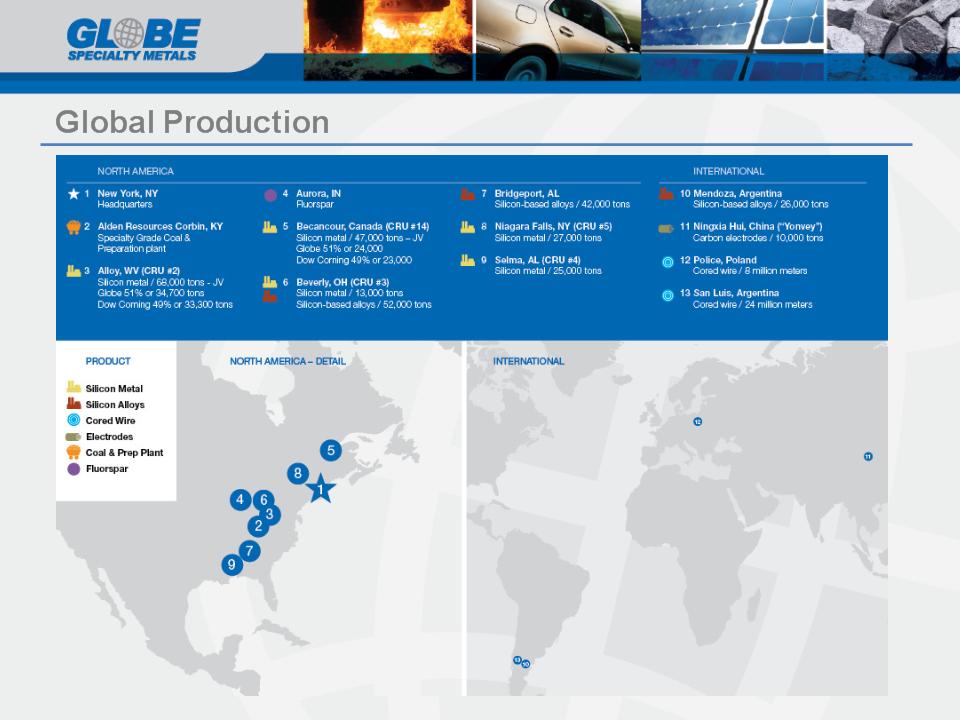
GSM: The Leader in Silicon - Well Positioned for Further Growth
n One of the world’s largest and the lowest cost silicon metal
producers
producers
n Leading global silicon-based alloy producer
n Global reach with 12 facilities in 5 countries - U.S., Canada,
Argentina, Poland, and China
Argentina, Poland, and China
n Strong profitability through all phases of the cycle with
substantial leverage to price - control across all raw material
inputs - only one in the industry
substantial leverage to price - control across all raw material
inputs - only one in the industry
n Beneficiary of new USA natural gas phenomenon
n Strong, flexible balance sheet - designed for growth
n Built and run by entrepreneurs with strong and proven M&A and
operational backgrounds and unique investment approach
operational backgrounds and unique investment approach
3

Growth Through Key, Strategic, Timely & Accretive Acquisitions
4
5
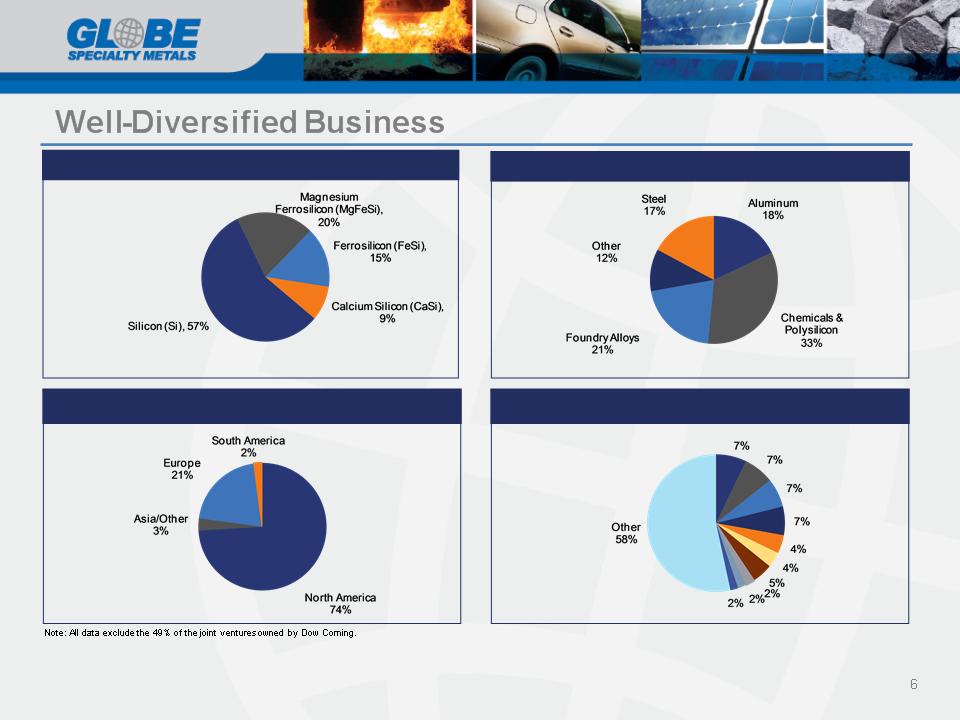
LTM Revenue Mix
End-markets
Customers - Minimal Concentration
Revenue by region
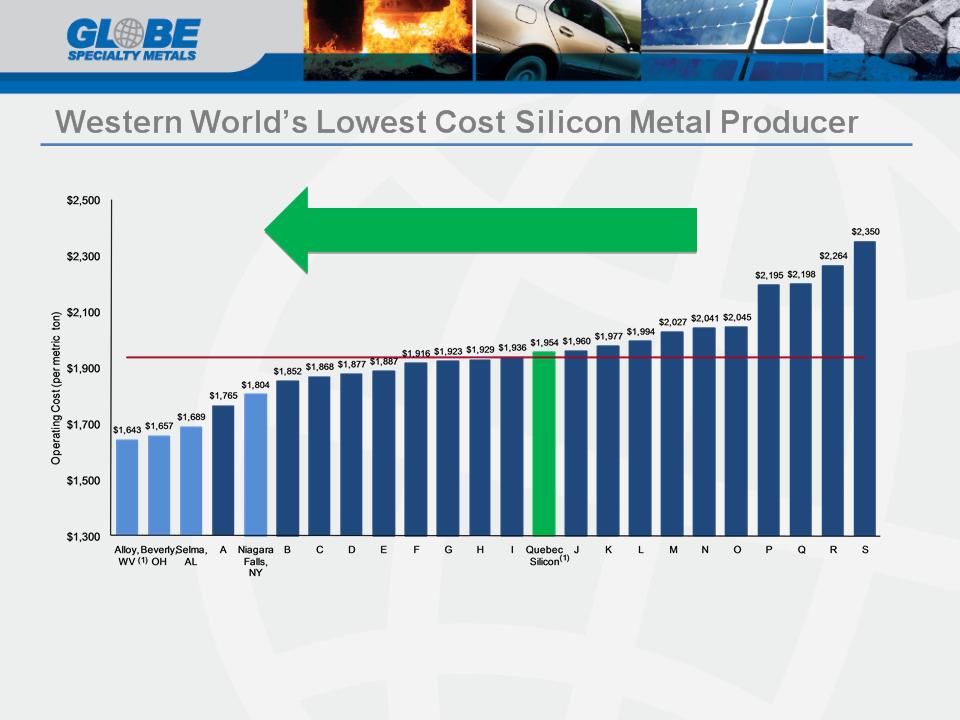
2011 Western World Silicon Metal Cost Curve
Source: CRU, 2012.
Note: Red line denotes median operating cost per ton.
Costs are Ex-works and exclude depreciation expense
Costs are Ex-works and exclude depreciation expense
(1) 49% of Alloy, WV capacity sold to Dow Corning Corporation.
(2) GSM acquired a 51% stake in Quebec Silicon on June 13, 2012.
7
Quebec Silicon Expected Cost Reduction
n Raw materials
n Technology
n Labor
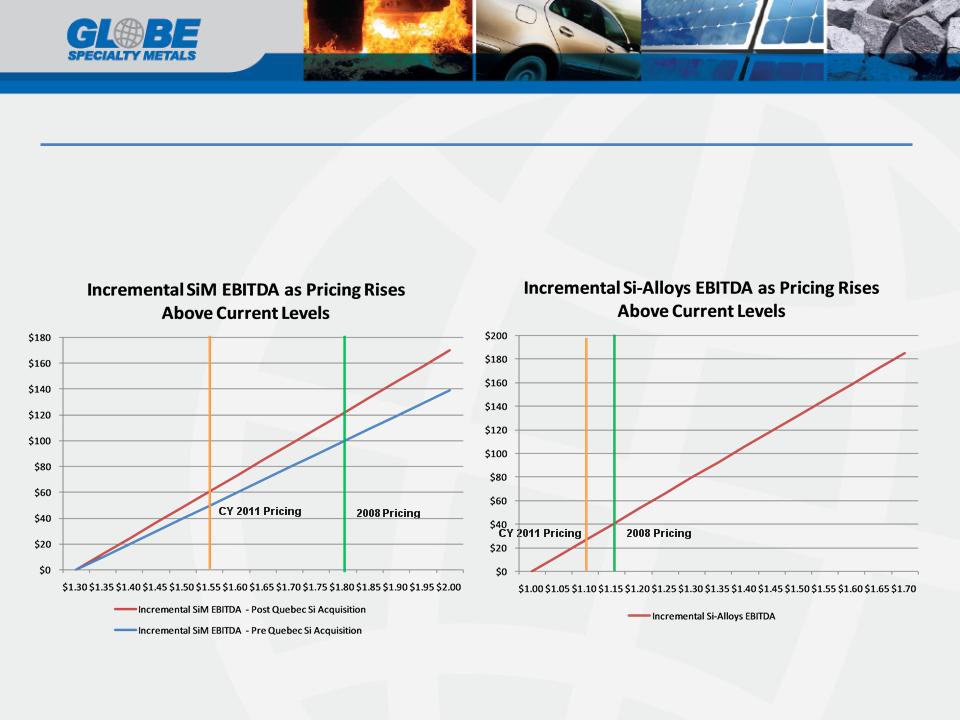
Substantial Leverage to Price
n Costs are stable and facilities are some of the most efficient in the world
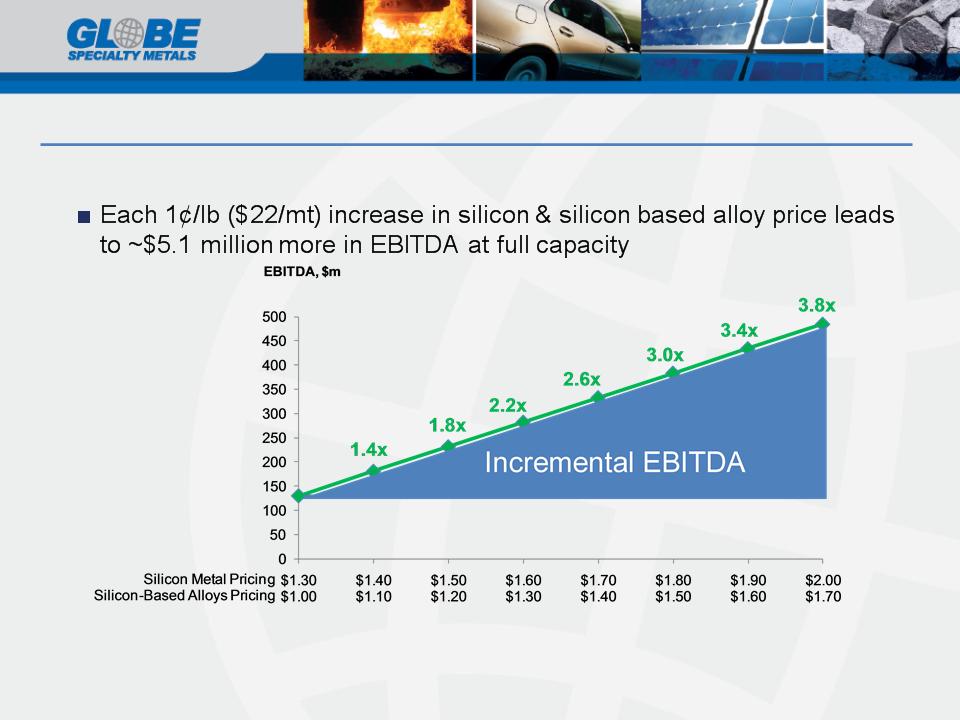
n Each 1¢/lb ($22/mt) increase in silicon & silicon based alloy price leads
to ~$5.1 million more in EBITDA at full capacity
to ~$5.1 million more in EBITDA at full capacity
Note: EBITDA impact estimated based on assumed $0.01/lb increase on all 110,000 and 120,000 tons of silicon metal and silicon-based alloys capacity, respectively.
8
Substantial Leverage to Price - Combined
n Costs are stable and facilities are some of the most efficient in the world
Note: EBITDA impact estimated based on assumed $0.01/lb increase on all 110,000 and 120,000 tons of silicon metal and silicon-based alloys capacity, respectively.
9
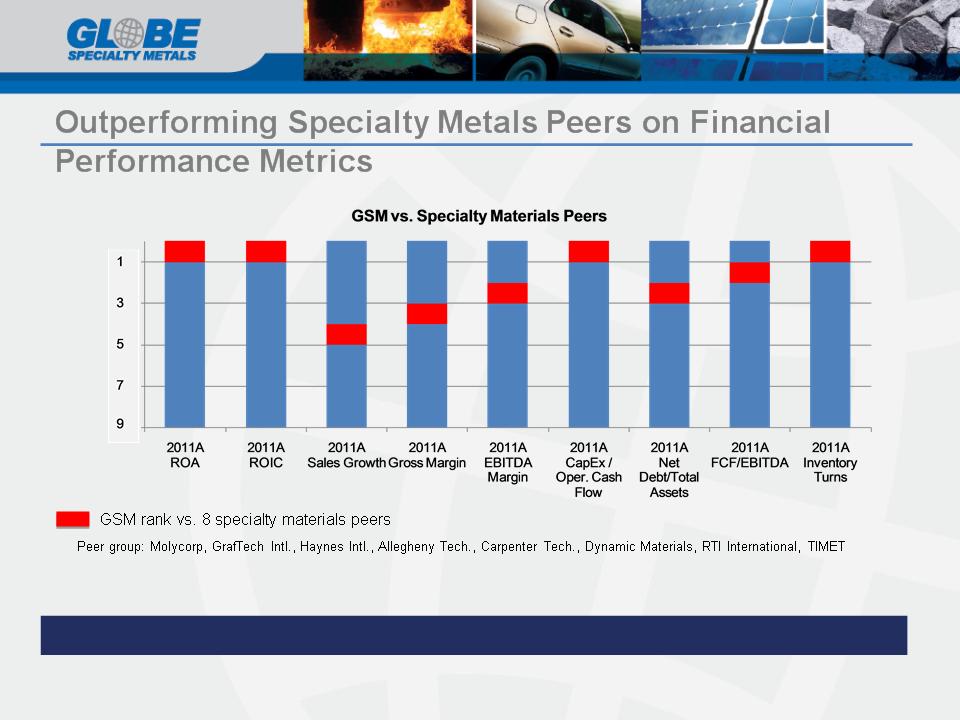
Focused on Financial Measures
10
Focused on Financial Measures
11
New Capacity Pre-requisites
1. Capital cost, lead time, and permitting obstacles of green field
construction
construction
2. Technology and operational expertise
3. Power (36% of cost) - requires stable, long-term supply of low cost
electricity
electricity
4. Raw materials (40% of cost) - requires access to high purity, low cost
raw materials
raw materials
6.6 tons of
raw materials
1 ton of
silicon
metal
metal
Raw materials are emerging as the most critical factor
12
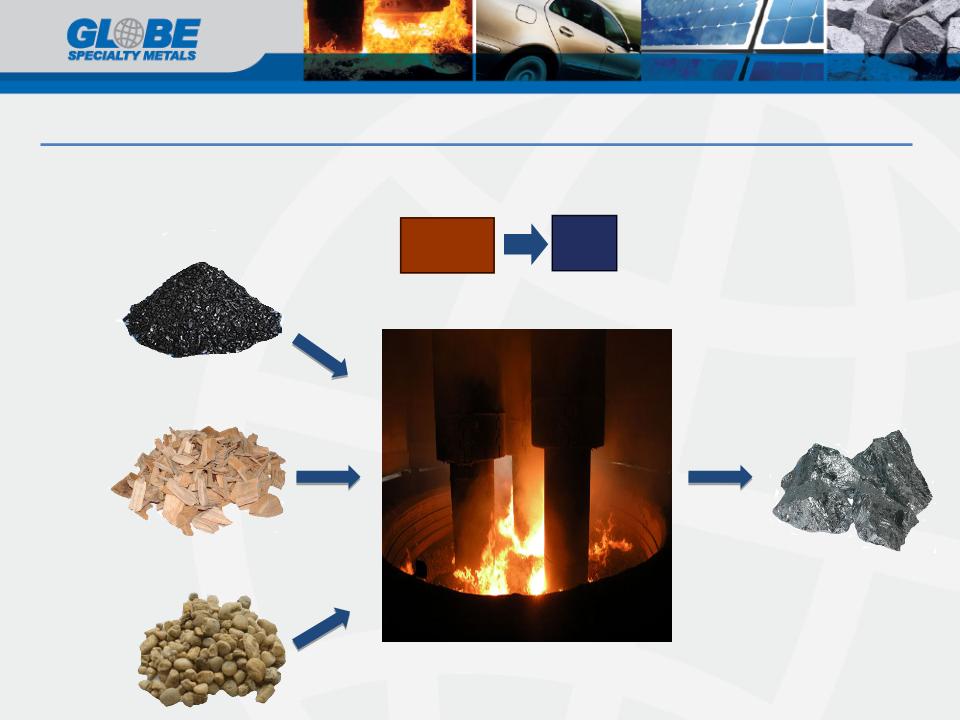
Silicon Production Process
13
Raw Material
Inputs
Inputs
Highest Quality
Metallurgical
Coal from Alden
Metallurgical
Coal from Alden
Woodchips
High Purity Quartz
Gravel
Gravel
Materials are heated at
temperatures in
excess of 4,000°F
temperatures in
excess of 4,000°F
6.6 tons of
raw materials
1 ton of
silicon
metal
metal
Chemical Reaction:
2C + SiO2 à 2CO + Si
Globe is vertically integrated--Only company that controls its supply chain from end to end
14
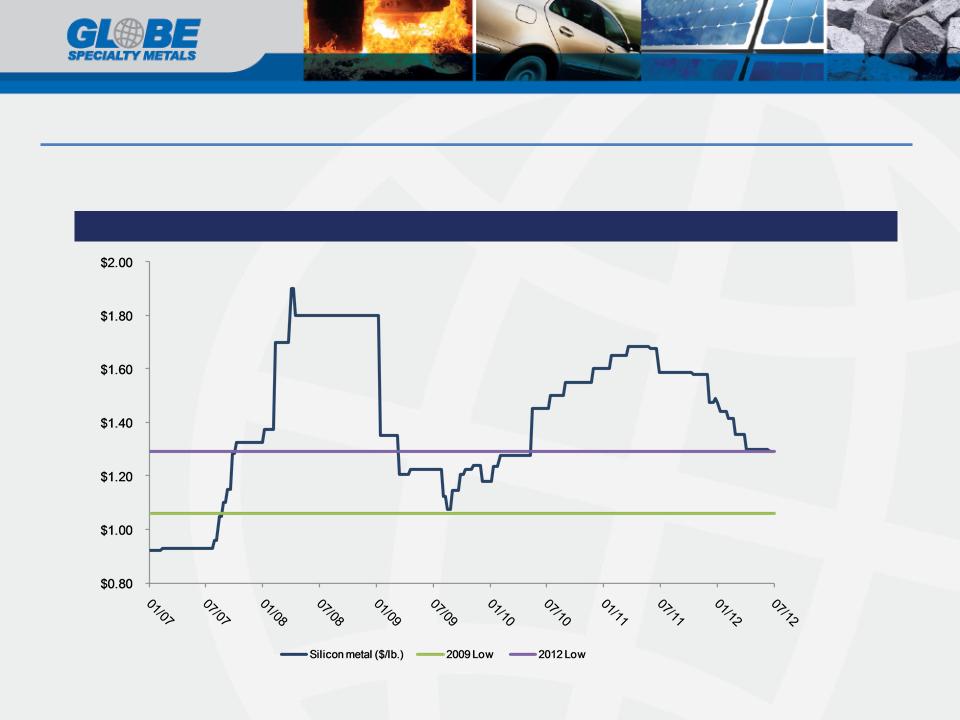
Silicon Prices Becoming More Resilient
$1.29
Source: Metal s Bulletin.
Silicon Metal Price Movement ($/lb.)
15
What’s supporting improved pricing resiliency?
Supply
n Pre-requisites for entry
n Reluctance to produce below variable cost due to flexible start/stop capability
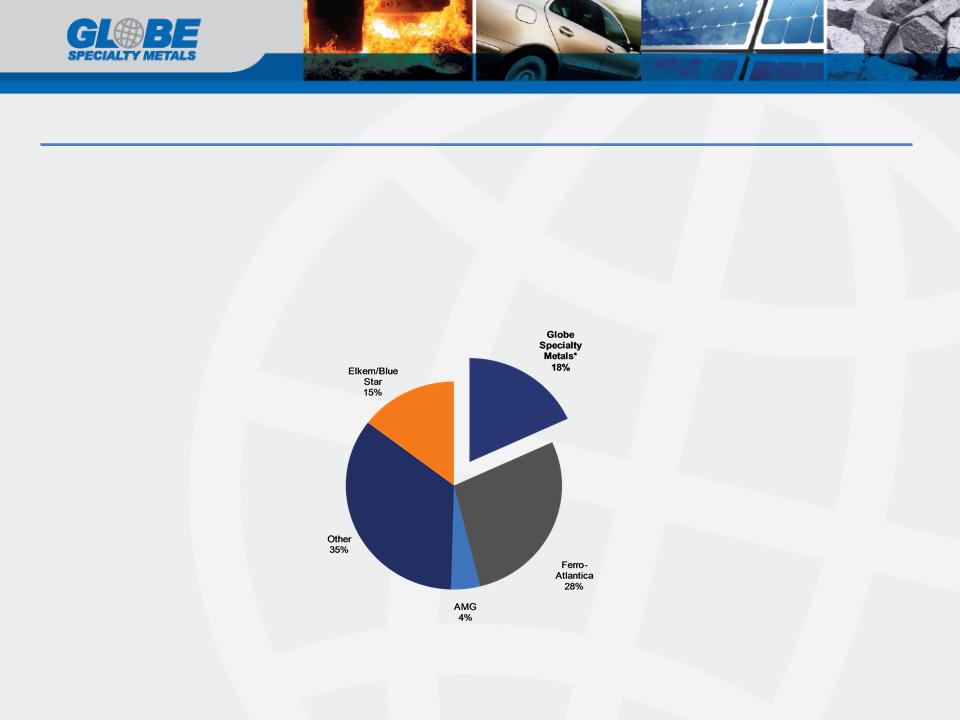
n Consolidated supply base:
16
Source: CRU, 2012. Globe supply excludes 49% of the Alloy, WV and Becancour, Canada facilities owned by Dow Corning.
Merchant supply excludes Dow Corning and Wacker captive capacity of 207,000 and 55,000 metric tons, respectively.
*GSM Pro Forma including 51% share of QSLP joint venture at Becancour, Canada
Western World Silicon Metal “Merchant” Production
Top 3 producers = 61%

What’s supporting improved pricing resiliency?
Global demand continues to increase
n Polysilicon* - increasing solar installations driven by steep pricing declines
• 20% y-o-y growth in 2012 and continued competitive improvements when
compared to thin film solar technology
compared to thin film solar technology
• New polysilicon plants - 2 new polysilicon plants will come online in the US, one
in 2012 and another in 2013 with demand of ~40,000MT of silicon metal
in 2012 and another in 2013 with demand of ~40,000MT of silicon metal
n Growth in silicones market driven by:
a) an expanding middle class in developing nations
b) new applications of silicones across all industries (www.silicones.eu)
n Auto production is increasing along with auto producers’ use of silicon containing
aluminum alloys and many components containing silicones
aluminum alloys and many components containing silicones
n New applications being developed continuously (eg. Li-ion batteries for cars &
electricity)
electricity)
17
*Note - Polysilicon is purified silicon with a minimum purity of 99.999%
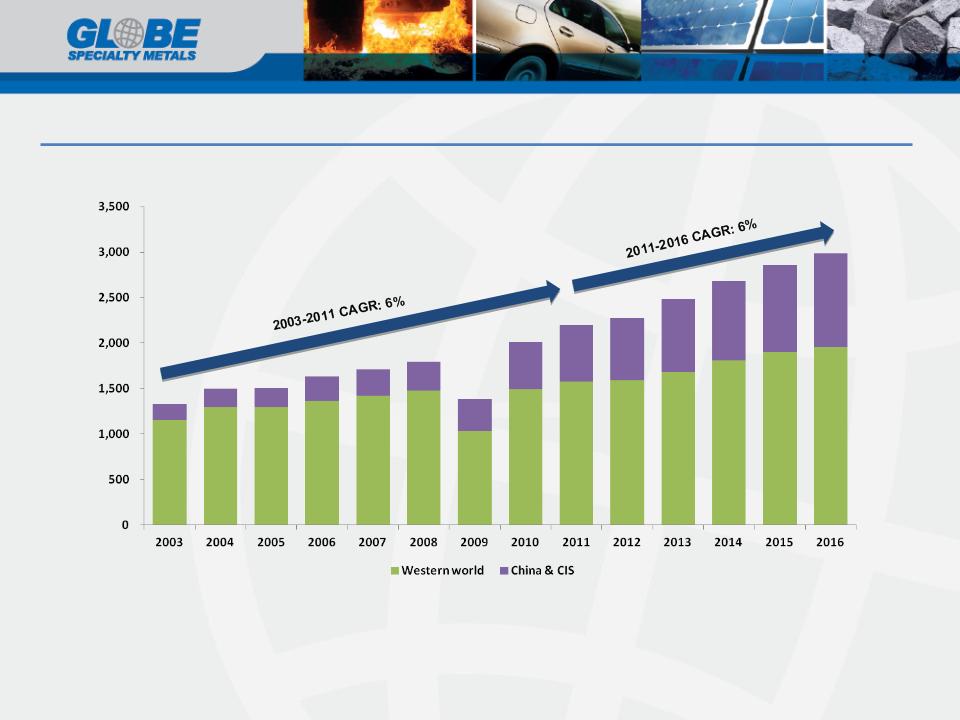
Global silicon consumption to grow +35% by 2016, from 2011 levels
Source: CRU 2012
18
kMT
Oils
n Cosmetics
n Hydraulics
n Textiles
n Polishes
n Mechanical fluids
Resins
n Insulators
n Waterproofing
n Paints
Rubber
n Automotive
n Insulators
n Consumer items
Silicones
Coatings
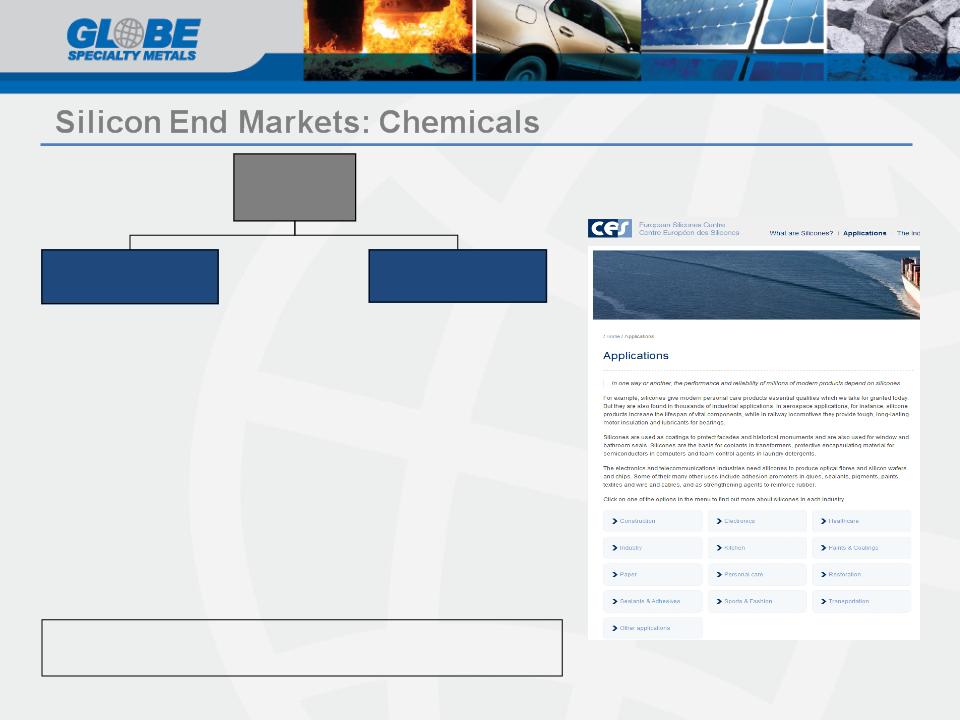
Chemicals
(50% of market)
(50% of market)
n Coatings
n Adhesives
n Sealants
n Rubber
n Thermoplastics
n Fiberglass
n 750,000 tons consumed by chemical industry
n GDP + 4% growth
Note: % of sales figures represent industry estimates of western world consumption
19
www.silicones.eu
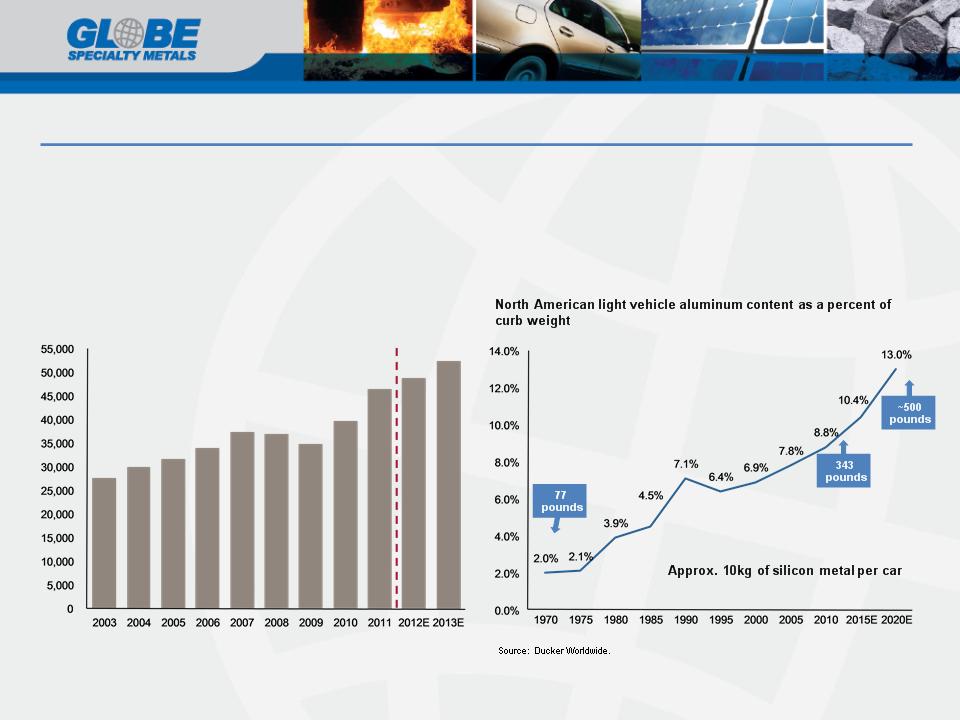
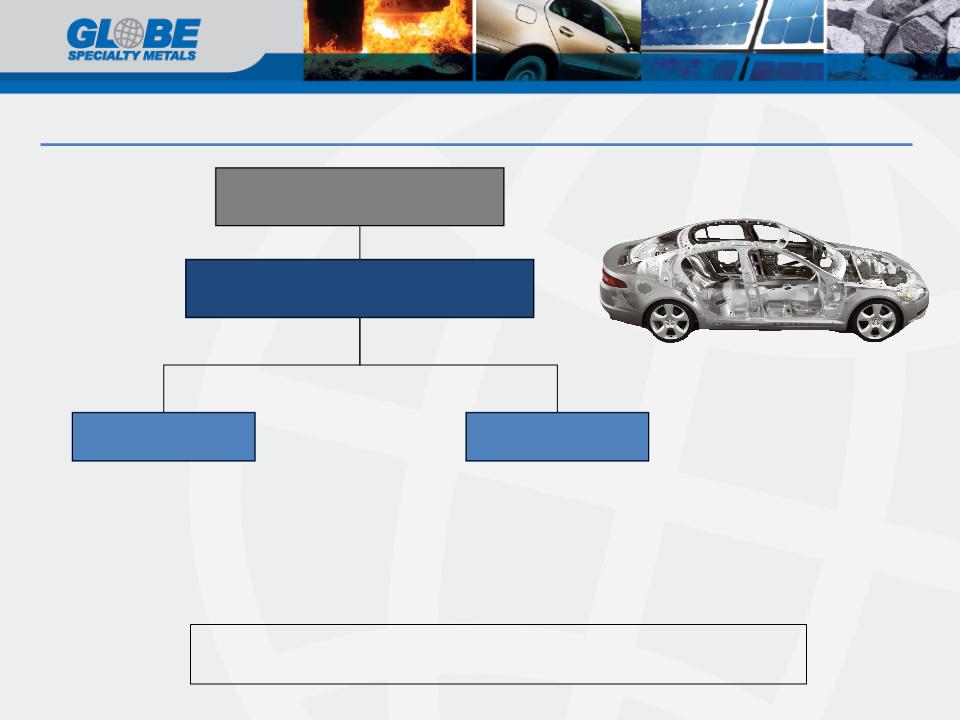
Silicon End Markets: Aluminum
n Silicon metal is required in aluminum as a strengthener and alloying agent to improve castability and
minimize shrinking and cracking
minimize shrinking and cracking
n Aluminum provides a lighter weight alternative to steel
n Aluminum demand has increased at a 5%+ CAGR for the past 20 years
Note: Based on 3,600 lbs of curb weight.
Global primary aluminum demand
(000s tons)
(000s tons)
Source: Bloomberg, Brook Hunt and Street research.
20
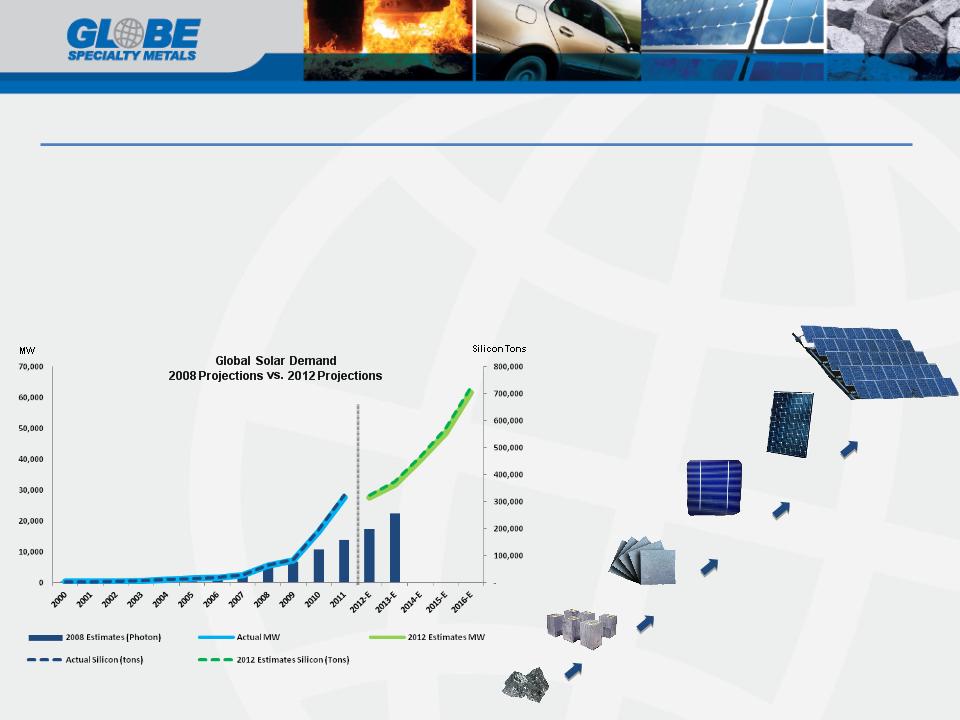
Silicon End Markets: Solar
n Continued decreases in solar wafer and module prices stimulating demand and taking
market share away from thin film makers (eg Solyndra)
market share away from thin film makers (eg Solyndra)
n Most recent estimates for 2012 global solar demand ahead of previous estimates
n Global Solar related silicon demand to double, exceeding 700,000 tons by 2016
n Projections have been consistently beaten by actual growth
Sources: Credit Suisse, CRU’12, Photon Consulting, GTM Research, EPIA, HIS, GSM Analysis
21
Silicon
Polysilicon
Wafer
Solar Cell
Solar
Panel
Panel
Solar
Installation
Installation
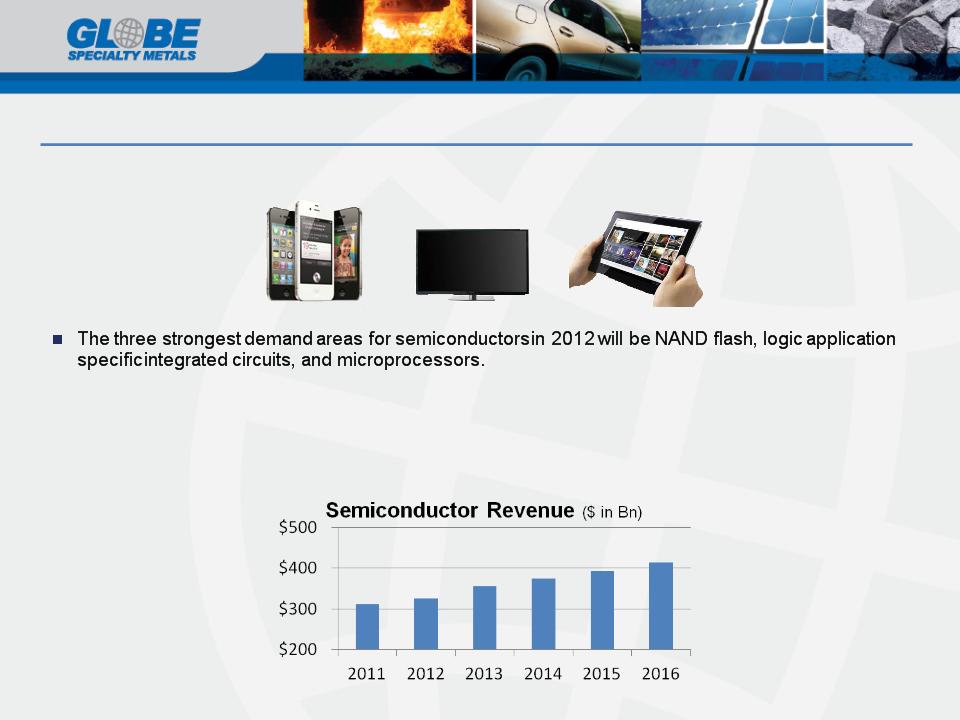
Silicon End Markets: Semiconductors
22
n Silane gas is an essential material used in the production of semi-conductors and LCD display panels
Ø NAND and ASIC demand will be driven by media tablets and smartphones
Ø Microprocessor growth will be driven by notebooks
Source: IHS

Silicon End Markets: New Applications & Products
Example: Lithium Ion Batteries
§ Silicon anode Li-ion battery technology
§ Greater energy storage capabilities
§ Higher capacity than other battery systems
§ Allows for smaller sizes batteries for electronic devices and electric cars
23
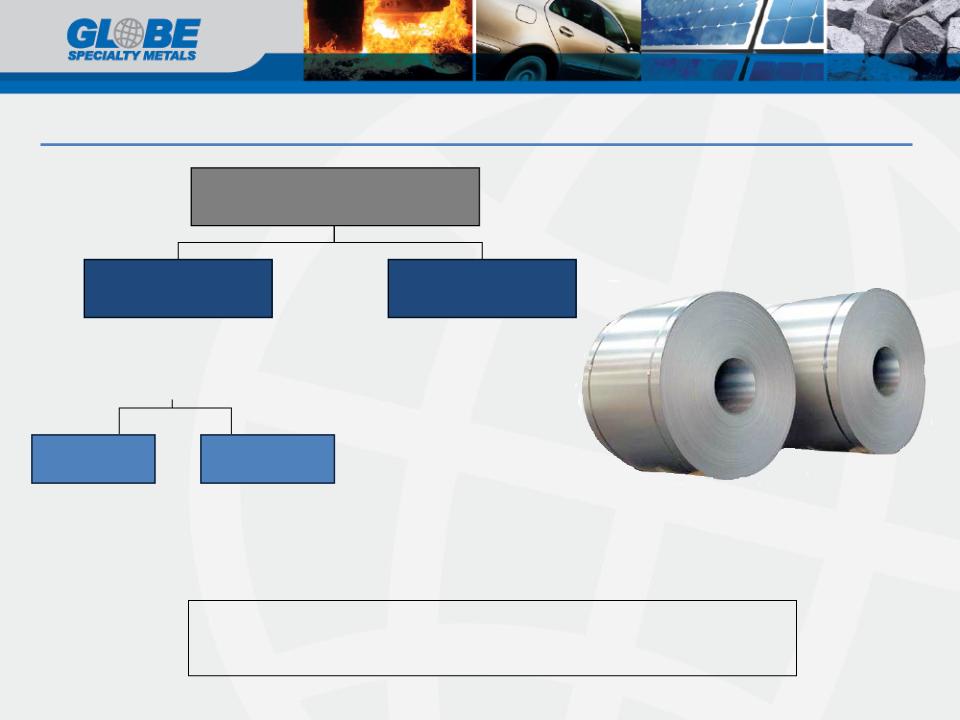
Silicon Alloys End Markets: Steel
Ferrosilicon
(FeSi)
Calcium Silicon
(CaSi)
Steel
n Only 6 producers in
Western World
Western World
n ~18% global market share
and ~50% U.S. share
and ~50% U.S. share
n High grade
specifications
specifications
n Requires technical
know-how
know-how
n Used in
production of
carbon steels,
stainless steels
and other steel
alloys
production of
carbon steels,
stainless steels
and other steel
alloys
n Competitive advantage in providing technical advice and service
by tailoring composition to customers’ requirements
by tailoring composition to customers’ requirements
n Just-in-time delivery - short lead times
n 1 of 2 U.S. producers
n 1 of 2 U.S. producers
n ~50% U.S. capacity and
~40% North American
capacity
~40% North American
capacity
n ~50% U.S. capacity and
~40% North American
capacity
~40% North American
capacity
Commodity
Specialty
24
Ductile Iron
Pipe
Magnesium Ferrosilicon
(MgFeSi)
Foundry
n Used in applications where
strength and formability are
required
strength and formability are
required
− Automotive components
n Often sole supplier
n Short lead times and variety
of grades discourage
imports
of grades discourage
imports
n Water transmission
n ~50% share of the magnesium ferrosilicon market in the Americas
and 20% in the Western World
and 20% in the Western World
25
Silicon Alloys End Markets: Foundry Products
n Collected in bag houses -- sold to re-marketers who sell to
cement makers as a by product
cement makers as a by product
• Physical strength of concrete (added to cement)
• Reduced permeability of cement (bridges)
• Whiter appearance than FeSi fumes
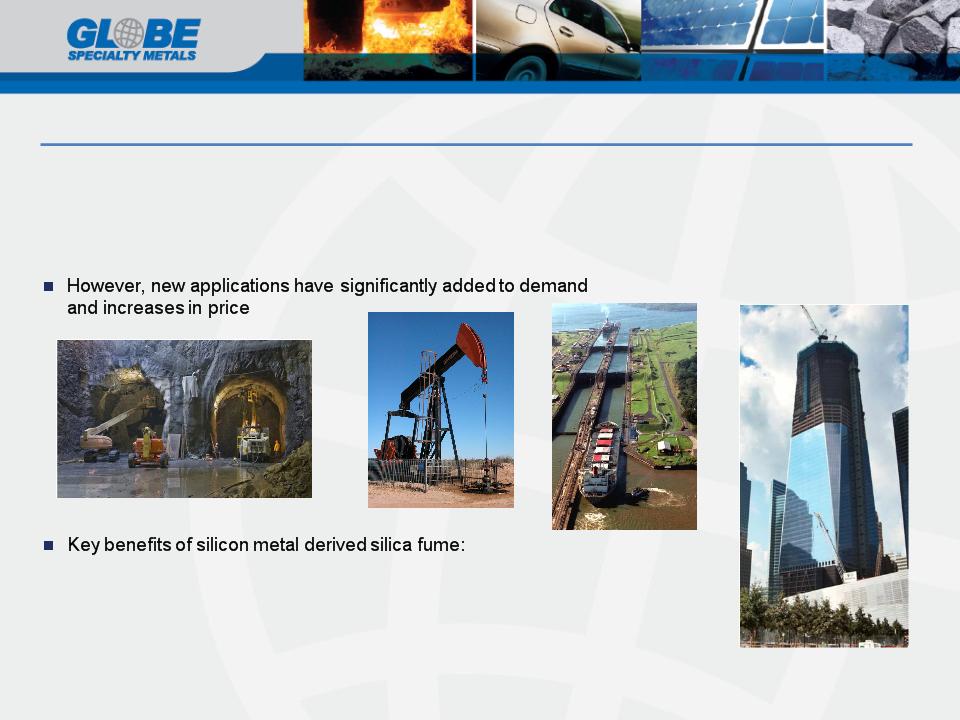
Silica Fume End Markets: Building & Construction
Silica Fume: From “By-Product” to “Product”?
26
GSM’s Silica Fume Used in
Key Projects:
Key Projects:
NYC Subway Improvements
One World Trade Center- NYC
Panama Canal Expansion
Oil Rigs
RECENT
ACCOMPLISHEMENTS
ACCOMPLISHEMENTS

Recent Acquisitions - Alden Resources
Alden Coal Advantage
Alden Coal Advantage
n Only significant North American supplier of specialty low ash
metallurgical coal used in the production of SiM and specialty FeSi
metallurgical coal used in the production of SiM and specialty FeSi
n Newly upgraded coal preparation plant in eastern Kentucky
n Best quality low ash coal in the world for silicon production—
management estimates coal improves furnace efficiency up to 10%
management estimates coal improves furnace efficiency up to 10%
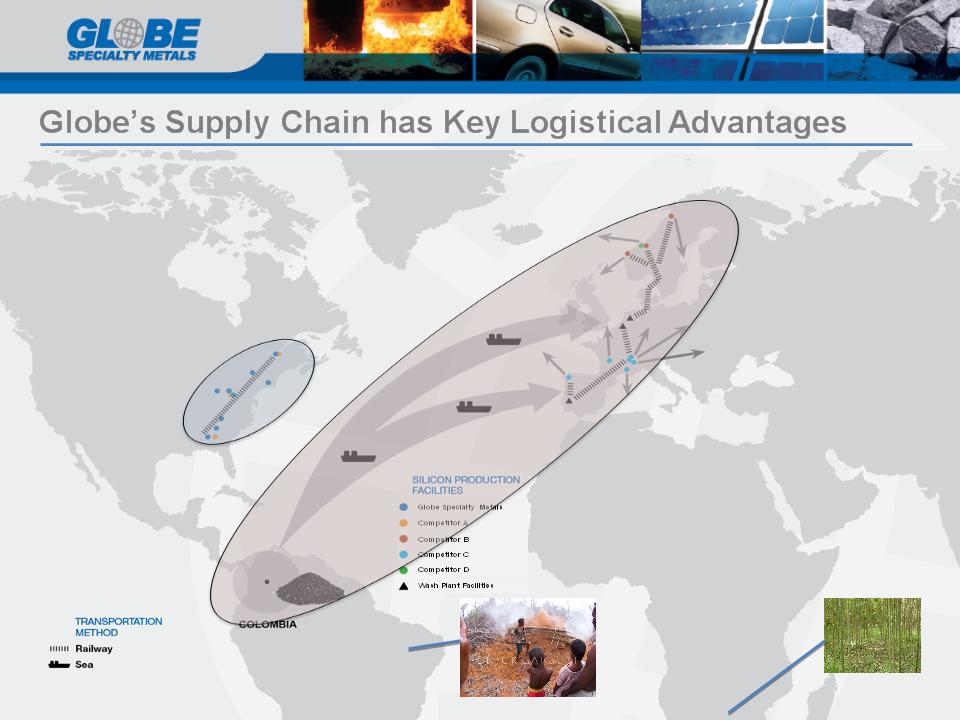
n Other currently available alternatives are Charcoal & Colombian coal
• Charcoal - more expensive and supply constrained
• Colombian coal - not as reactive
n Globe secured a stable, long-term and low-cost supply of this key raw
material to support its continued growth worldwide
material to support its continued growth worldwide
n Alden meeting its operational, financial, and quality goals resulting in
improved operations and lower costs
improved operations and lower costs
27
Example of Blue Gem Coal Advantage
28
n Furnace production tonnage output
Ø Have already seen more than 5% increase in
production tonnage since switching 1 furnace from
Colombian to a blend of Blue Gem and Colombian coal
at Quebec Silicon
production tonnage since switching 1 furnace from
Colombian to a blend of Blue Gem and Colombian coal
at Quebec Silicon
n Electrode consumption
Ø Have already seen more than a 15% decrease in
electrode consumption since switching 1 furnace from
Colombian to Blue Gem and Colombian blended coal at
Quebec Silicon
electrode consumption since switching 1 furnace from
Colombian to Blue Gem and Colombian blended coal at
Quebec Silicon

Recent Acquisition - Quebec Silicon
29
n Purchased from bankrupt shareholder
n One of the largest and most robust plants in the world - 47,000 MT capacity
n 51% / 49% Joint-venture with Dow Corning Corporation
n On river - good for inbound and outbound logistics
n Stable and competitive power from Hydro Quebec
n Purchased for less than 1/3 of the cost of building a new smelter without
engineering, permitting risks, or timing
engineering, permitting risks, or timing
n Additional quartz reserves mines
n Significant upside on cost reduction:
Ø Operational improvements
Ø Raw material
Ø Efficiencies & synergies

Significant Liquidity & Net Cash Positive Balance Sheet
30
Poised for continued growth:
n $445 million of liquidity
Ø New $300 million credit facility provides an additional ~$180 million of borrowing availability and a
$125 million accordion feature at LIBOR + 175 (at current leverage ratio)
$125 million accordion feature at LIBOR + 175 (at current leverage ratio)
Ø Usable for general corporate purposes, share buy backs, dividends and M&A
Ø $141 million of cash on hand*
n Strong balance sheet with significant liquidity
n Positions Globe for further growth through acquisitions
* As of March 31, 2012
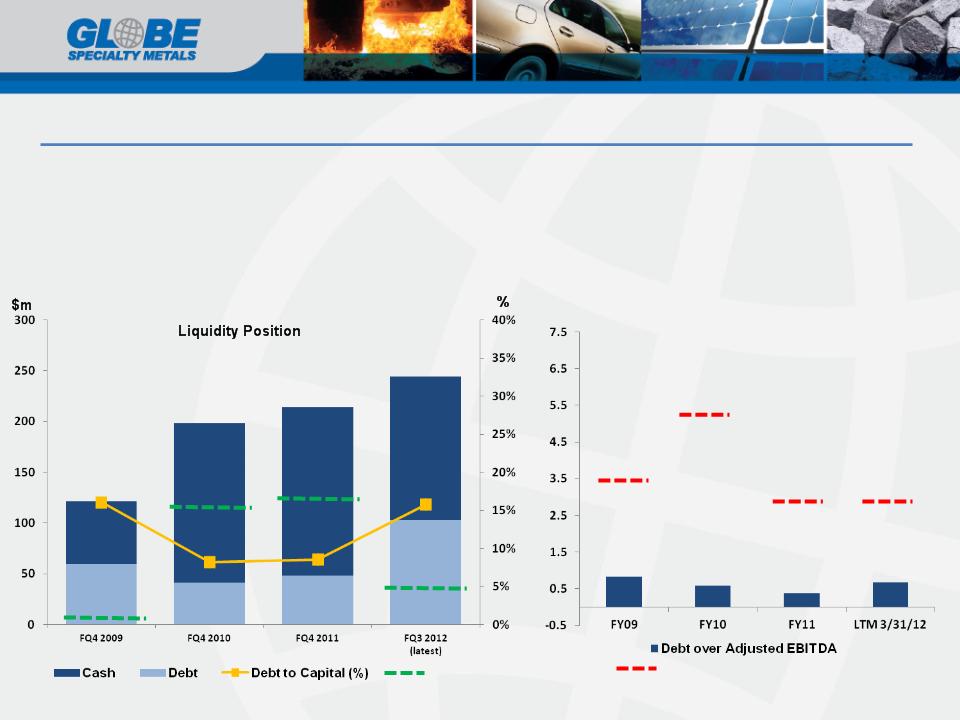
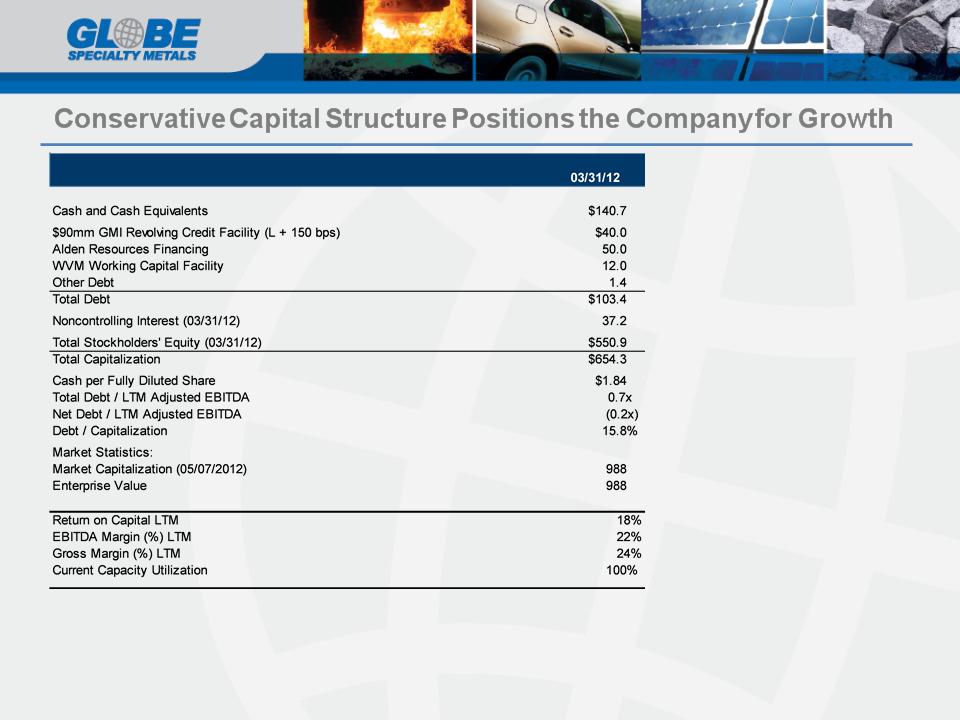
Strong Balance Sheet Provides Opportunity to Pursue Growth
Debt / Adjusted EBITDA
Ratio
n Historical acquisition and financial discipline has maintained strong liquidity position
n Balance sheet strength facilitates action when growth and value opportunities are identified
n Unique approach to investing
31
Net Cash
*
*
*
*
Broad Metals Peer Avg Debt to Capital (%)
*
Broad Metals Peer Avg Debt / EBITDA

Substantial Leverage to Price
n Costs are stable and facilities are some of the most efficient in the world
Note: EBITDA impact estimated based on assumed $0.01/lb increase on all 110,000 and 120,000 tons of silicon metal and silicon-based alloys capacity, respectively.
32
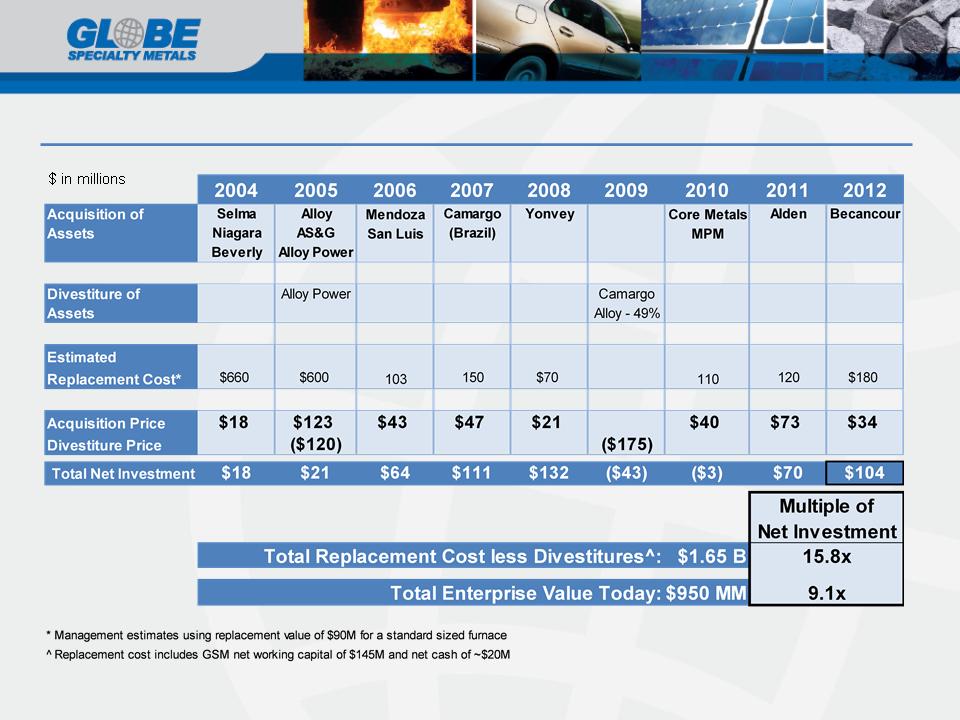
Growth Through Key, Strategic, Timely & Accretive Acquisitions
33
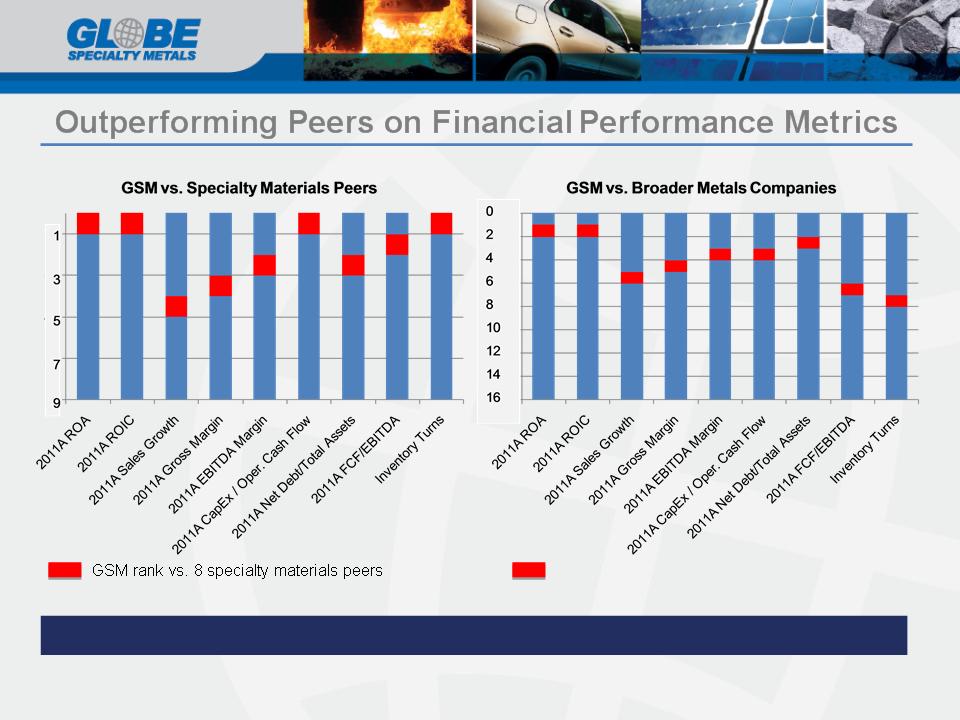
Focused on Financial Measures
34
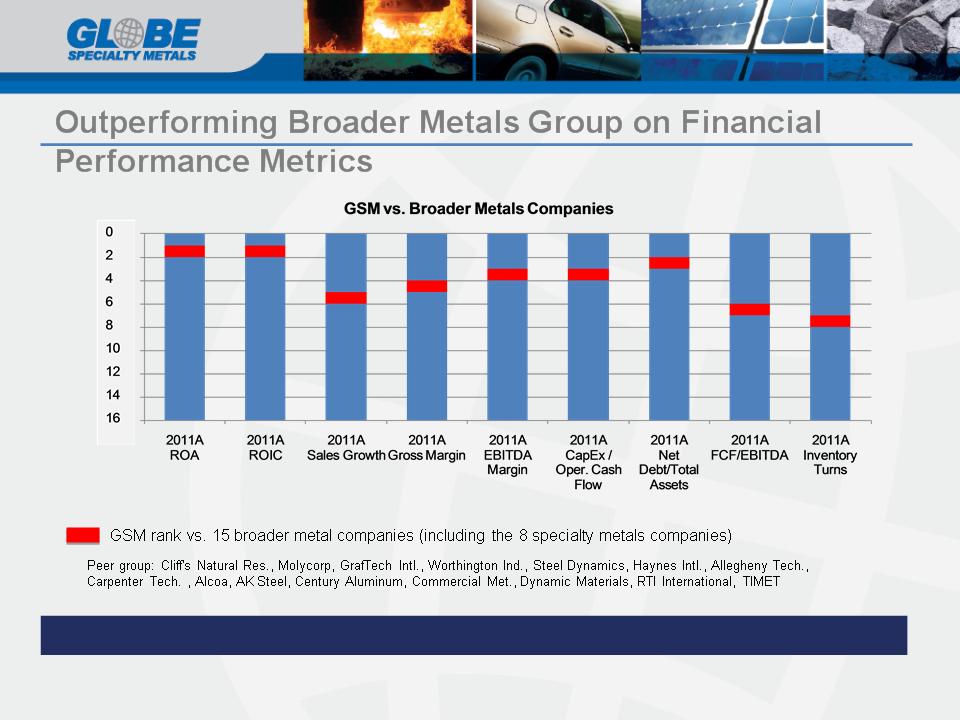
GSM rank vs. 15 broader metal companies
Vision for the Future - The World has Changed
35
n Economic cycles are driven by the shifting credit bubble
n Cycles are shorter
n Less forward visibility
n Other companies have over-paid at cycle peaks—permanently hurting their
capital structures; (GSM hasn’t)
capital structures; (GSM hasn’t)
n Acquisitions in the trough, at the right time and at the right price, achieves
faster growth at much lower cost of investment
faster growth at much lower cost of investment
n Globe’s track record proves this thesis
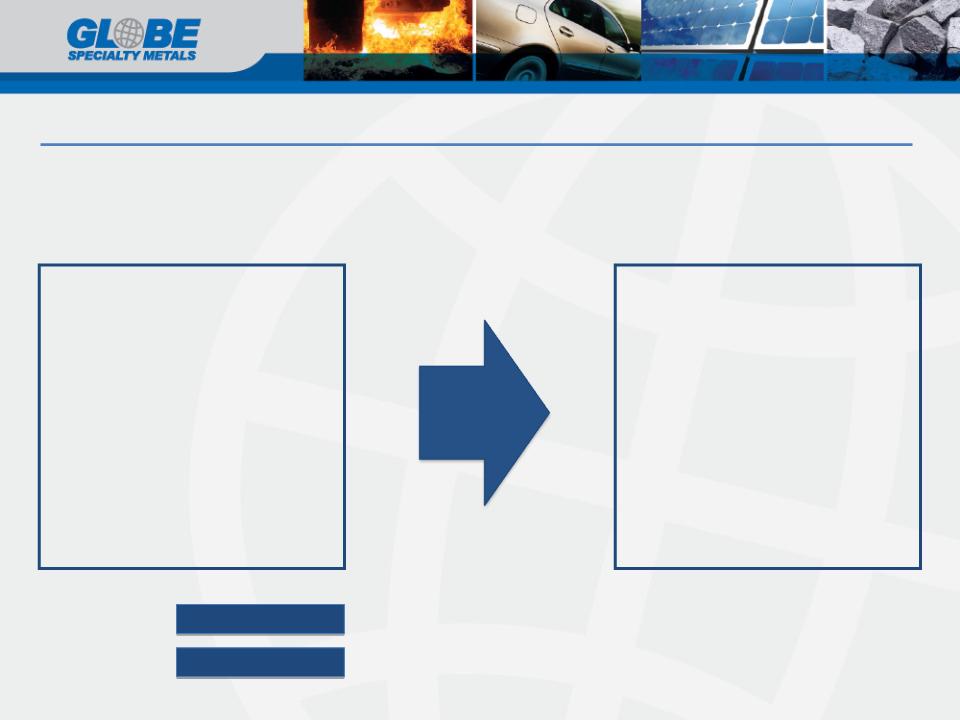
Globe’s Strategy & Roadmap in the New World
36
n Global uncertainty
n Shorter Cycles
n Less forward visibility
n Necessity of discipline
n Increased risk of mis-timing
and over paying for
investments
and over paying for
investments
Environment
n Continue cyclical trough
acquisitions at low costs
acquisitions at low costs
n Patience
n Discipline
Globe’s Strategy
Faster Growth & Higher Returns

Highlights
n Production and input costs are largely fixed, which yields substantial leverage to price
• Highly variable cost structure and low overhead - variable costs account for 85% of production
costs
costs
• Ownership of all key raw materials - only one in industry
• Competitive power rates and industrial demand should improve even more due to natural gas
phenomenon
phenomenon
n Business decisions, including M&A and CAPEX, are taken with a focus on financial metrics
n Conservative capital structure with flexibility -- well positioned to pursue growth opportunities, in our
differentiated style
differentiated style
n Paid $0.15 annual dividend in October 2010 and $0.20 in October 2011- shareholder friendly
37

APPENDIX
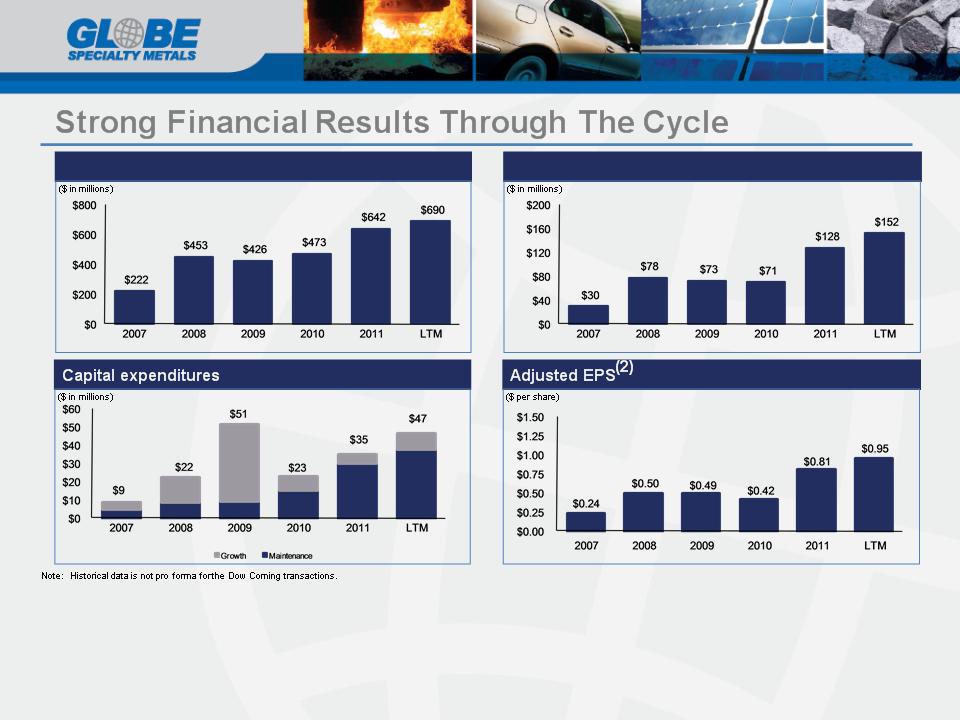
Adjusted EBITDA(1)
Revenue
(1) Adjusted EBITDA for fiscal 2009 is EBITDA plus goodwill and asset impairment charges of $69.7 million, deferred offering costs of $2.5 million, restructuring costs of $1.7 million, prior period power penalty of
$1.0 million and inventory write-downs of $5.8 million. Adjusted EBITDA for fiscal 2010 is EBITDA plus, prior period power adjustment of ($0.5) million, fixed asset impairment of $0.7 million, transaction
expenses of $0.7 million and start-up costs of $10.0 million, less a gain on the sale of Globe Metais of $19.7 million. Adjusted EBITDA for fiscal 2011 is EBITDA plus, transaction expenses of $5.0 million,
start-up costs of $3.2 million, and gain on the sale of business of $4.2 million, less net settlements of $5.1 million. Adjusted EBITDA for LTM (the 12 months ended Mar 31, 2012) is EBITDA plus transaction
expenses of $6.3 million, Bridgeport fire related loss of $5.0 million, and loss on the sale of business of $3.8 million.
(2) Fiscal 2009 EPS adjusted for goodwill and asset impairment charges of $69.7 million, deferred offering costs of $2.5 million, restructuring costs of $1.7 million, prior period power penalty of $1.0 million and
inventory write-downs of $5.8 million. Fiscal 2010 EPS adjusted for prior period power adjustment of ($0.5) million, fixed asset impairment of $0.7 million, transaction expenses of $0.7 million and start-up
costs of $10.0 million, less a gain on the sale of Globe Metais of $19.7 million. EPS for fiscal 2011 is adjusted for, transaction expenses of $5.0 million, start-up costs of $3.2 million, and gain on the sale of
business of $4.2 million, less net settlements of $5.1 million. Adjusted EPS for LTM (the 12 months ended Mar 31, 2012) is adjusted for transaction expenses of $6.3 million, Bridgeport fire related loss of
$5.0 million, and loss on the sale of business of $3.8 million.
38
Share information
n 75,048,873 basic shares outstanding
n 4,314,249 options outstanding
39

Presenting Management Team
40
Alan Kestenbaum, Executive Chairman
n Founded GSM through the roll-up of global silicon assets and subsequently led GSM through it’s IPO on NASDAQ and several key acquisition
and divestitures
and divestitures
n Over 20 years' experience in metals trading, distribution, finance and manufacturing
n Founded leading international metals trader, Marco International, in 1985 and led its expansion into China and former Soviet Union.
n Managed a series of successful metals private equity transactions
n Began his career in metals with Glencore and Philip Brothers in New York
Malcolm Appelbaum, Chief Financial Officer
n Joined GSM in 2008
n President of AppleTree Advisors, Inc. from 2000 until September 2008 - worked with various HIG Capital companies
n Prior roles include: Interim-Chief Financial Officer for several underperforming companies; Principal - Wand Partners; Financial Analyst -
Goldman Sachs; and, Senior Consultant at Deloitte
Goldman Sachs; and, Senior Consultant at Deloitte
Jeff Bradley, Chief Executive Officer
n Over 27 years experience in the metals industry
n Joined GSM in 2008
n Prior roles include: CEO - Claymont Steel (former public company); Vice President and General Manager - Worthington Industries

Board of Directors
GSM’s Board of Directors is comprised of seasoned executives with strong management,
metals, finance and international experience
metals, finance and international experience
n Alan Kestenbaum (Executive Chairman)
n Stuart Eizenstat
− Partner, Covington & Burling LLP; Former Deputy Secretary of the United States Department of
the Treasury; International Advisory Board Member of Coca-Cola, Board Member of UPS
the Treasury; International Advisory Board Member of Coca-Cola, Board Member of UPS
n Franklin Lavin
− Chairman of the Public Affairs practice for Asia-Pacific at Edelman; Former Managing Director
and Chief Operating Officer of Cushman & Wakefield Investors Asia; Former Under Secretary for
International Trade at the United States Department of Commerce
and Chief Operating Officer of Cushman & Wakefield Investors Asia; Former Under Secretary for
International Trade at the United States Department of Commerce
n Thomas Danjczek
− President of the Steel Manufacturers Association; former senior executive at Wheeling-Pittsburgh
Steel Corporation
Steel Corporation
n Donald Barger, Jr.
− Former Chief Financial Officer at YRC Worldwide, Worthington Industries and Hillenbrand
Industries; Board Member and Audit Chair of Gardner Denver and Quanex
Industries; Board Member and Audit Chair of Gardner Denver and Quanex
41
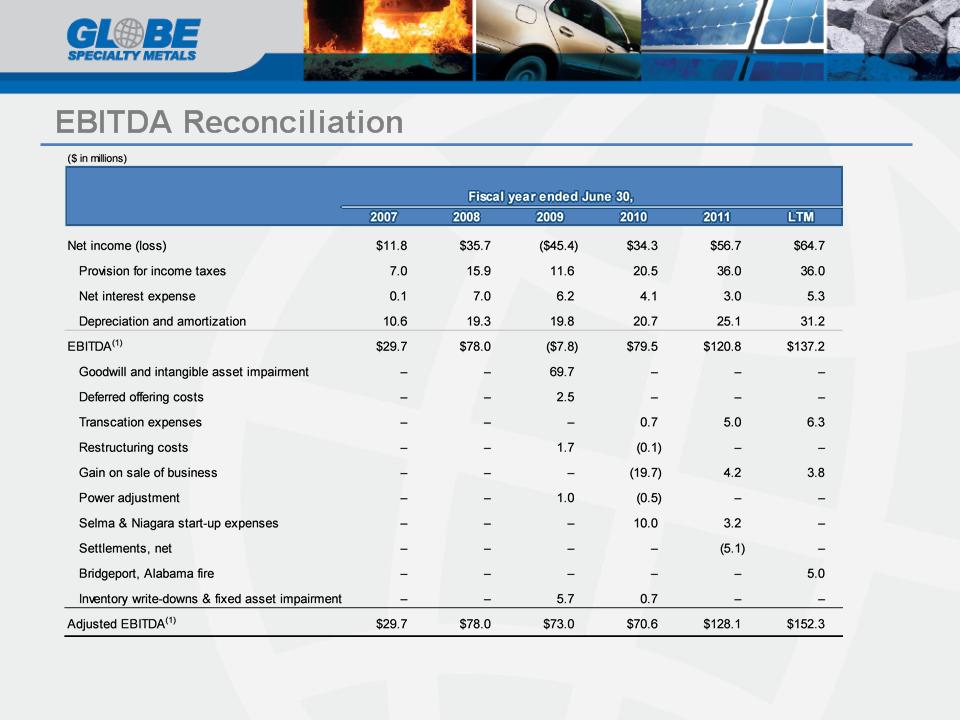
(1) EBITDA and Adjusted EBITDA include non-cash share-based compensation expense of $2.3 million, $4.3 million, $5.7 million, $6.4 million, $8.2 million and $2.4 million for the latest twelve months
ended March 31, 2012, and the fiscal years ended June 30, 2011, June 30, 2010, June 30, 2009, June 30, 2008, and June 30, 2007, respectively.
ended March 31, 2012, and the fiscal years ended June 30, 2011, June 30, 2010, June 30, 2009, June 30, 2008, and June 30, 2007, respectively.
Note: LTM represents the latest twelve months ended March 31, 2012.
42