Attached files
| file | filename |
|---|---|
| 8-K - FORM 8-K -- EARNINGS RELEASE - CAPITAL ONE FINANCIAL CORP | d381774d8k.htm |
| EX-99.2 - EXHIBIT 99.2 - CAPITAL ONE FINANCIAL CORP | d381774dex992.htm |
| EX-99.1 - EXHIBIT 99.1 - CAPITAL ONE FINANCIAL CORP | d381774dex991.htm |
 Second Quarter 2012
Results July 19, 2012
Exhibit 99.3 |
| Forward-Looking Statements
Please note that the following materials containing information regarding Capital One's financial
performance speak only as of the particular date or dates indicated in these materials. Capital
One does not undertake any obligation to update or revise any of the information contained herein whether as a result of new information,
future events or otherwise.
Certain statements in this presentation and other oral and written statements made by Capital One from
time to time are forward-looking statements, including those that discuss, among other
things: strategies, goals, outlook or other non-historical matters; projections, revenues, income, returns, expenses, capital measures,
accruals for claims in litigation and for other claims against Capital One, earnings per share or other
financial measures for Capital One; future financial and operating
results;
Capital
One's
plans,
objectives,
expectations
and
intentions;
the
projected
impact
and
benefits
of
the
acquisitions
of
ING
Direct
and
HSBC's
U.S.
credit card business (the "Transactions"); and the assumptions that underlie these
matters. To the extent that any such information is forward-looking, it is intended to
fit within the safe harbor for forward-looking information provided by the Private
Securities
Litigation
Reform
Act
of
1995.
Numerous
factors
could
cause
Capital
One's
actual
results
to
differ
materially
from
those
described
in
such
forward-
looking statements, including, among other things: general economic and business conditions in the U.S.,
the U.K., Canada and Capital One’s local markets, including conditions affecting employment
levels, interest rates, consumer income and confidence, spending and savings that may affect consumer bankruptcies,
defaults, charge-offs and deposit activity; an increase or decrease in credit losses (including
increases due to a worsening of general economic conditions in the credit environment); the
possibility that Capital One may not fully realize the projected cost savings and other projected benefits of the Transactions; difficulties and
delays in integrating the assets and businesses acquired in the Transactions; business disruption during
the pendency of or following the Transactions; diversion of management time on issues related to
the Transactions, including integration of the assets and businesses acquired; reputational risks and the reaction of
customers and counterparties to the Transactions; disruptions relating to the Transactions negatively
impacting Capital One’s ability to maintain relationships with customers,
employees
and
suppliers;
changes
in
asset
quality
and
credit
risk
as
a
result
of
the
Transactions;
the
accuracy
of
estimates
and
assumptions
Capital
One uses to determine the fair value of assets acquired and liabilities assumed in the Transactions, and
the potential for its estimates or assumptions to change as additional information becomes
available and Capital One completes the accounting analysis of the Transactions; financial, legal, regulatory, tax or accounting
changes or actions, including the impact of the Dodd-Frank Wall Street Reform and Consumer
Protection Act and the regulations promulgated thereunder; developments, changes or actions
relating to any litigation matter involving Capital One; the inability to sustain revenue and earnings growth; increases or
decreases in interest rates; Capital One’s ability to access the capital markets at attractive
rates and terms to capitalize and fund its operations and future growth; the success of Capital
One’s marketing efforts in attracting and retaining customers; increases or decreases in Capital One’s aggregate loan balances or the number
of customers and the growth rate and composition thereof, including increases or decreases resulting
from factors such as shifting product mix, amount of actual marketing
expenses
Capital
One
incurs
and
attrition
of
loan
balances;
the
level
of
future
repurchase
or
indemnification
requests
Capital
One
may
receive,
the
actual
future performance of mortgage loans relating to such requests, the success rates of claimants against
it, any developments in litigation and the actual recoveries Capital One may make on any
collateral relating to claims against it; the amount and rate of deposit growth; changes in the reputation of or expectations regarding
the financial services industry or Capital One with respect to practices, products or financial
condition; any significant disruption in Capital One’s operations or technology platform;
Capital One’s ability to maintain a compliance infrastructure suitable for its size and complexity; Capital One’s ability to control costs; the
amount of, and rate of growth in, its expenses as its business develops or changes or as it expands into
new market areas; Capital One’s ability to execute on its strategic and operational plans;
any significant disruption of, or loss of public confidence in, the United States Mail service affecting Capital One’s response rates
and consumer payments; Capital One’s ability to recruit and retain experienced personnel to assist
in the management and operations of new products and services; changes in the labor and
employment markets; fraud or misconduct by Capital One’s customers, employees or business partners; competition from
providers
of
products
and
services
that
compete
with
Capital
One’s
businesses;
and
other
risk
factors
set
forth
from
time
to
time
in
reports
that
Capital
One
files
with the Securities and Exchange Commission, including, but not limited to, the Annual Report on Form
10-K for the year ended December 31, 2011. You should carefully consider the factors
discussed above in evaluating these forward-looking statements. All information in these slides is based on the
consolidated results of Capital One Financial Corporation, unless otherwise noted. A reconciliation of
any non-GAAP financial measures included in this presentation can be found in Capital One's
most recent Current Report on Form 8-K filed July 18, 2012, available on its website at www.capitalone.com under
"Investors." |
| 3
July 19, 2012
Second quarter results reflect significant purchase accounting and
other items, as well as continued solid business performance
•
Second quarter net income of $92 million, or $0.16 per common share
•
Completed
HSBC
U.S.
Card
Business
acquisition
on
May
1
st
–
Purchase accounting drove Total Company and Domestic Card Q2 results
–
ING Direct and HSBC U.S. Card Integrations on track
–
Combined Capital One, ING Direct and HSBC U.S. Card businesses on track to deliver strong returns and
capital generation
•
Quarter included more than usual number of other items
–
Reps and Warranties
–
UK PPI
–
Interchange settlement
–
Cross-sell settlement
•
All three business segments delivered solid performance
•
The combination of Capital One, ING Direct, and the HSBC U.S. Card business puts us in an
even stronger position to deliver sustained shareholder value |
 4
July 19, 2012
Consumer Banking
Commercial Banking
Domestic Card
(Excluding HSBC Deal
Impacts)
Our businesses continue to deliver solid results
•
Excluding expected IL run-
off, loans grew about 1% in
the quarter
•
Purchase volumes grew
11% vs. Q211
1
•
Net revenue margin
remained in the 16% range,
despite other items
2
•
Credit remains stable at
historically strong levels,
with expected seasonality
•
Solid underlying net income
•
Steady loan growth
continued, with loans up 3%
in the quarter and 15% year-
over year
•
Net revenues were stable
compared to Q112, and up
13% year-over-year
•
Strong credit continued
•
Net income of $228 million
•
Modest ending loan growth,
with auto finance growth
more than offsetting
mortgage run-off
–
Stronger average loan
growth, with full quarter
of INGD mortgage loans
•
Deposits declined modestly,
with improving deposit
interest expense rate
•
Strong revenue, driven by
higher average loan
balances
•
Strong credit, with seasonal
tailwinds
•
Net income of $438 million
1
As reported purchase volume growth was 34%
2
As reported Domestic Card Net Revenue Margin was 15.82% |
 5
July 19, 2012
Building a Great
Customer Franchise
Strong Returns and
Capital Generation
Sure-footed Integrations
We are focused on delivering sustained shareholder value |
 6
July 19, 2012
The composition of our second quarter balance sheet was impacted
by the closing of the HSBC acquisition
$B
HSBC Impacts
6/30/2012
3/31/2012
5/1/2012
Assets:
Cash and cash equivalents
(31.1)
$
6.3
$
31.7
$
Securities
-
55.3
60.8
Loans held for investment
27.6
202.8
173.8
Less: Allowance for loan and lease losses
-
(5.0)
(4.0)
Net loans held for investment
27.6
197.8
169.8
Other Assets
4.0
37.2
32.2
Total assets
0.5
$
296.6
$
294.5
$
Liabilities:
Deposits
-
$
213.9
$
216.5
$
Debt
-
35.9
32.9
Other liabilities
0.5
9.6
8.1
Total liabilities
0.5
259.4
257.5
Stockholders' equity:
-
37.2
37.0
Total liabilities and stockholders' equity
0.5
$
296.6
$
294.5
$
|
 7
July 19, 2012
Numerous acquisition accounting items impacted both the balance
sheet and the income statement in the quarter
* Non-Impaired loans includes revolving accounts less than 60 days delinquent
*
Select purchase accounting items
Item
Purchase
Accounting
5/1/2012
Q2 P&L
Impact
Timing
Notes
Allowance build for
non-impaired loans
n/a
(1,198)
Expect modest impacts in Q3
Increases Domestic Card provision expense
Finance charge and
fee reserve for non-
impaired loans
n/a
(174)
Expect modest impact in Q3
Reduces Domestic Card revenue
Credit mark on
impaired loans
(666)
251
Absorbs bulk of HSBC
impaired loan losses until
early 2013
Temporarily reduces Domestic Card provision expense
and credit metrics
Fair value mark on
non-impaired loans
692
(63)
Accelerated through 2013
Amortization of premium on non-impaired HSBC loans;
lowers Domestic Card net interest income
Purchased Credit
Card Relationships
2,132
(85)
Accelerated on average
over 9 years
Increases Domestic Card operating expense
Other intangibles and
FV marks
47
58
Varies
Increases Domestic Card revenue
Goodwill
272
-
-
No P&L impact
*
* |
 8
July 19, 2012
Second quarter 2012 earnings reflected a significant impact from
the
acquisition of HSBC’s loan portfolio and other items
* HSBC impacts are estimated direct impacts post acquisition, including transaction & merger related
expenses **Q1 includes ½
quarter impact of INGD earnings; Non Interest Income includes $594MM bargain
purchase gain related to closing of INGD
Actual
HSBC* Impact
COF (excl.HSBC)
Actual
$MM
Q2'12
Q2'12
Q2'12
Q1'12
Net Interest Income
4,001
$
500
$
3,501
$
3,414
$
Non-Interest Income
1,054
163
891
1,521
Total Net Revenue
5,055
663
4,392
4,935
Marketing
334
9
325
321
Operating Expense
2,808
442
2,366
2,183
Non-Interest Expense
3,142
451
2,691
2,504
Pre-Provision Earnings (before tax)
1,913
212
1,701
2,431
Net Charge-offs
738
10
728
780
Other
1
-
1
(17)
Allowance Build (Release)
938
1,198
(260)
(190)
Provision Expense
1,677
1,208
469
573
Pretax Income
236
(996)
1,232
1,858
Taxes
43
(352)
395
353
Operating Earnings (after tax)
193
(644)
837
1,505
Discontinued Operations, net of tax
(100)
-
(100)
(102)
Total Company (after tax)
93
$
(644)
$
737
$
1,403
$
Diluted EPS (Continuing Ops)
0.33
$
NA
NA
2.92
$
Diluted EPS per common share
0.16
$
NA
NA
2.72
$
Wtd Avg Common Shares Outstanding
582.8
NA
NA
513.1
HSBC acquisition
–
Merger-related & purchase accounting include:
•
$1.2B ALLL build in provision expense
•
($174MM) FCFR build in revenue
•
($63MM) amortization of premium in net interest
income
•
$85MM PCCR in operating expense
•
$14MM other net impact to income
•
$106MM Transaction and merger-related expenses
in non-interest expense
–
HSBC impacts on Q2 2012 earnings excluding
merger-related and purchase accounting
impacts:
–
Revenue of ~ $830M
–
Non-interest expense of ~ $260M
Other items
•
$180MM Rep & Warranty Expense
–
$154MM in discontinued operations;
$26MM reduced non-interest income
•
$98MM net litigation reserve to cover interchange
&
other
settlements
in
non
-interest
expense
•
$101MM expense related to settlement &
remediation re: cross sell activities
–
$60MM penalty in non-interest expense
–
$20MM customer remediation reduced net
interest income
–
$21MM customer remediation reduced
non-interest income
•
$82MM accrual related to UK PPI in Revenue
–
$29MM reduced net interest income
–
$30MM reduced non interest income
–
$23MM non interest expense
** |
 9
July 19, 2012
Second quarter NIM impacted by full quarter of ING Direct, partial
quarter impact of HSBC and HSBC purchase accounting
Average Balances & Margin Highlights
Average
Yield/
Average
Yield/
(Dollars in millions)
Balance
Rate
Balance
Rate
Interest-earning assets:
Loans held for investment
$
192,632
8.84
%
Investment securities
56,972
2.35
Cash equivalents and other
15,415
0.67
Total interest-earning assets
$
265,019
6.97
%
Interest-bearing liabilities:
Total interest-bearing deposits
$
195,597
0.76
%
Securitized debt obligations
14,948
1.85
Senior and subordinated notes
3.10
Other borrowings
3.72
Total interest-bearing liabilities
$
1.06
%
Impact of non-interest bearing funding
0.14
%
Net interest margin
6.04
%
2012 Q2
2012 Q1
11,213
9,257
231,015
$
152,900
9.56
%
50,543
2.36
16,803
0.62
$
220,246
7.23
%
$
151,625
0.82
%
16,185
1.98
3.43
3.61
$
1.20
%
0.17
%
6.20
%
10,268
9,541
187,619 |
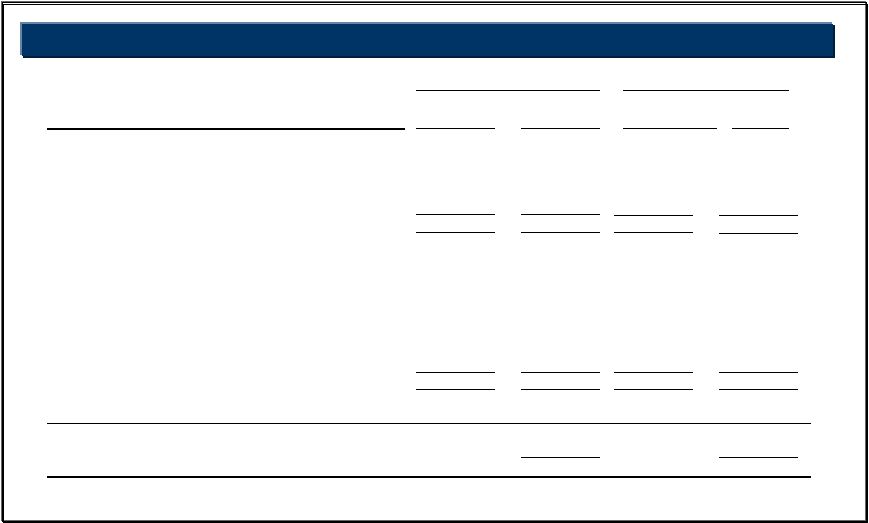
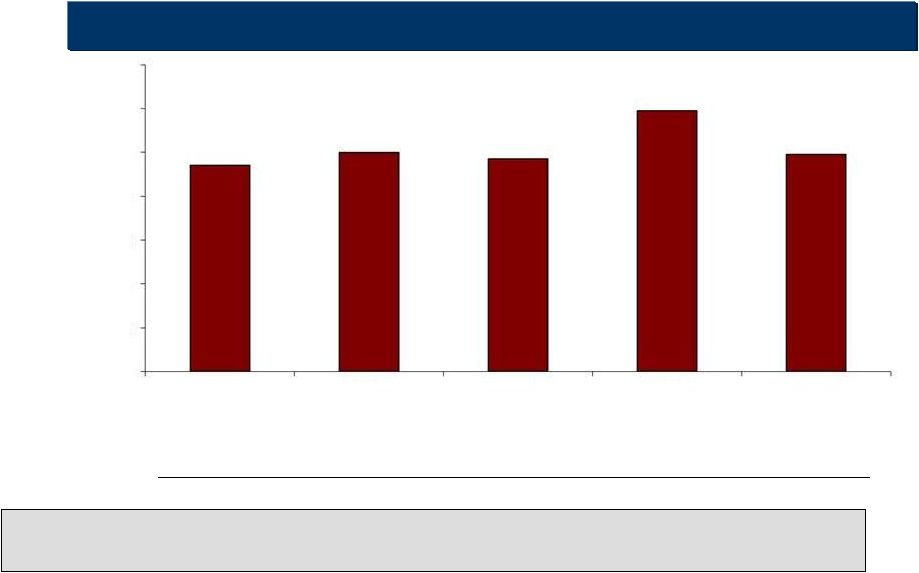 10
July 19, 2012
Our capital position remains strong after the closing of the HSBC
transaction
1
Tier 1 common ratio is a regulatory capital measure calculated based on Tier 1 common capital divided
by risk-weighted assets. See "Exhibit 99.2—Table 13: Reconciliation of
Non-GAAP Measures and Calculation of Regulatory Capital Measures" for the calculation of this ratio.
Tier 1 Common Ratio (Basel I)
1
Disallowed DTA
RWA
EOP Loans
Tier 1 common capital
including disallowed DTA
($B)
Tier 1 common capital
(0.6)
146
129
14.3
13.7
(0.2)
149
130
15.1
14.9
(0.5)
156
15.6
15.1
136
(0.9)
183
22.6
21.7
174
216
22.3
21.5
203
(0.8)
14%
12%
10%
8%
6%
4%
2%
0%
9.4%
10.0%
9.7%
11.9%
9.9%
Q211
Q311
Q411
Q112
Q212 |
 |