Attached files
| file | filename |
|---|---|
| 8-K - 8-K - Rockwood Holdings, Inc. | a12-16489_18k.htm |
Exhibit 99.1
|
|
CONFIDENTIAL The Specialty TiO2 Company July 2012 |
|
|
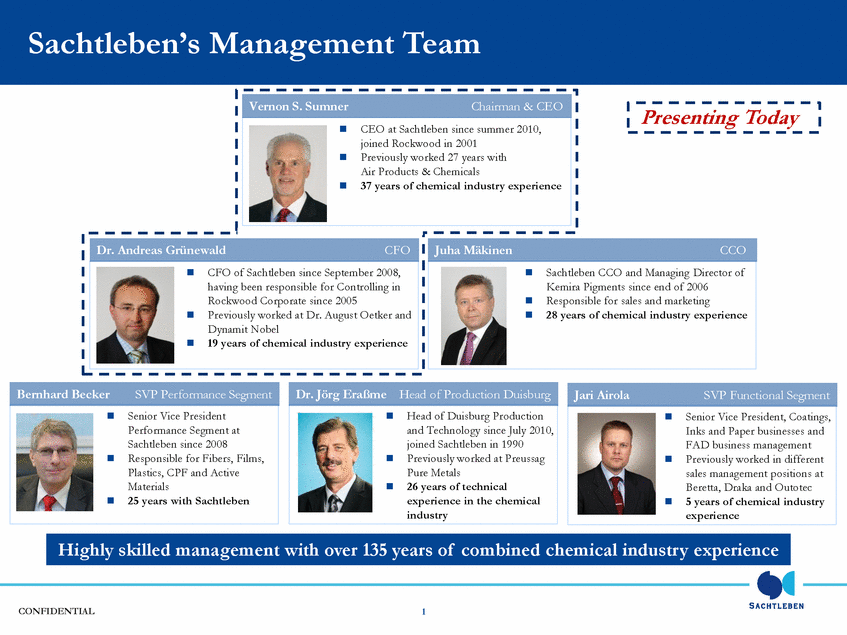
CONFIDENTIAL .CFO of Sachtleben since September 2008, having been responsible for Controlling in Rockwood Corporate since 2005 .Previously worked at Dr. August Oetker and Dynamit Nobel .19 years of chemical industry experience .CEO at Sachtleben since summer 2010, joined Rockwood in 2001 .Previously worked 27 years with Air Products & Chemicals .37 years of chemical industry experience Vernon S. Sumner Chairman & CEO Dr. Andreas Grünewald CFO .Sachtleben CCO and Managing Director of Kemira Pigments since end of 2006 .Responsible for sales and marketing .28 years of chemical industry experience Juha Mäkinen CCO Sachtleben’s Management Team Highly skilled management with over 135 years of combined chemical industry experience 1 .Head of Duisburg Production and Technology since July 2010, joined Sachtleben in 1990 .Previously worked at Preussag Pure Metals .26 years of technical experience in the chemical industry .Senior Vice President Performance Segment at Sachtleben since 2008 .Responsible for Fibers, Films, Plastics, CPF and Active Materials .25 years with Sachtleben .Senior Vice President, Coatings, Inks and Paper businesses and FAD business management .Previously worked in different sales management positions at Beretta, Draka and Outotec .5 years of chemical industry experience Dr. Jörg Eraßme Head of Production Duisburg Bernhard Becker SVP Performance Segment Jari Airola SVP Functional Segment Presenting Today |
|
|
CONFIDENTIAL A world leader in specialty TiO2 and zinc and barium based Functional Additives for high value applications .2011 revenue of €669m, with EBITDA of €183m, an EBITDA margin of 27% .Global leadership positions in innovation-driven niches with potential for premium pricing .Robust cash flow generation, positioned for significant future growth following crenox acquisition(1) Europe 59% Americas 16% Asia Pacific 21% RoW 4% Sachtleben – The Specialty TiO2 Company Source: TZMI, Sachtleben Note: Financials presented excluding crenox acquisition; all Sachtleben financial figures presented in accordance with IFRS. Reconciliations of IFRS to US-GAAP are provided in the Appendix (1) Asset Purchase Agreement signed between parties, Transaction closed 15 July 2012 (2) CPF = Cosmetics, Pharma & Food (3) AM = Active Materials (4) FAD = Barium/Zinc additives OVERVIEW SACHTLEBEN SALES SPLIT 2011 BY APPLICATION BY PRODUCT 2 BY REGION (2) (3) Emerging Markets 30% Focus on specialty TiO2 applications .Fibers .CPF(2) .Inks .Specialty Plastics .Specialty Coatings .Other specialties (4) Sachtleben Segment Focus >65% Specialty FAD 18% TiO2 76% Coatings 25% Environmental 4% Paper 3% Plastics 22% Fibers/ Films 19% Inks 14% CPF 9% AM 4% Environmental/ Other 6% |

|
|
CONFIDENTIAL Asia Pacific 39% Western Europe 22% North America 17% South America 9% Central Europe 7% 3 TiO2 and FAD – “Quality of Life Products” .Most widely used white pigment with unparalleled whitening strength and opacifying characteristics .Two commercially significant forms: ANATASE and RUTILE .Differ in crystal form and properties .Anatase pigments produced by the sulfate process, rutile pigments by both sulfate and chloride process .Softer anatase pigments preferred for specialty applications .Sachtleben produces both anatase and rutile pigments .Following the crenox acquisition, Sachtleben is the largest global TiO2 producer via the sulfate process and the third largest TiO2 producer in Europe .Approximately 6% share of global capacity following the acquisition Source: TZMI (1) Based on 2011 demand of 5.6 million tons and average selling price of US$3.2m/kt FUNCTIONAL ADDITIVES TiO2 OVERVIEW Specialties & Other 4% Paints & Coatings 58% Paper 9% Plastics 22% Inks 3% Fiber 2% GLOBAL TiO2 DEMAND CPF 1% Middle East & Africa 6% 2011 DEMAND: 5,575kt (US$18bn)(1) SACHTLEBEN FOCUS .Specialty barium and zinc based white pigments .Main applications in coatings, plastics and films .Also used as an extender for TiO2 .Similar demand and pricing dynamics to TiO2 given applications overlap .A leading global supplier of FAD for high quality applications, with numerous brands considered industry benchmarks .Largest global producer of Blanc Fixe .Only global producer of Sachtolith and a leading producer of Lithopone |

|
|
CONFIDENTIAL €547m €122m Anatase pigments Rutile pigments Other TiO2 specialties Environmental Products Blanc Fixe Sachtolith Lithopone FIBERS/ FILMS CPF PLASTICS AM INKS COATINGS ENVIRONMENT PAPER €127m €60m €144m €25m €94m €165m €30m €20m Cloth/ fabric Photovoltaic LCD screens Sun care Confectionary X-ray contrast Masterbatches PVC products Packaging CICP Catalyst Steel Industry Flexible Packaging Inks Architectural Automotive Industrial Water purification Additives Decorative paper Laminate A Global Leader in Specialty White Pigments Source: Sachtleben Note: Financials presented excluding crenox acquisition; all Sachtleben financial figures presented in accordance with IFRS. Reconciliations of IFRS to US-GAAP are provided in the Appendix (1) Sales by application excludes other sales of €5m 4 2011 Key Figures: Revenue: €669m EBITDA €183m (EBITDA Margin 27%) 2011 SALES KEY PRODUCTS APPLICATIONS |

|
|
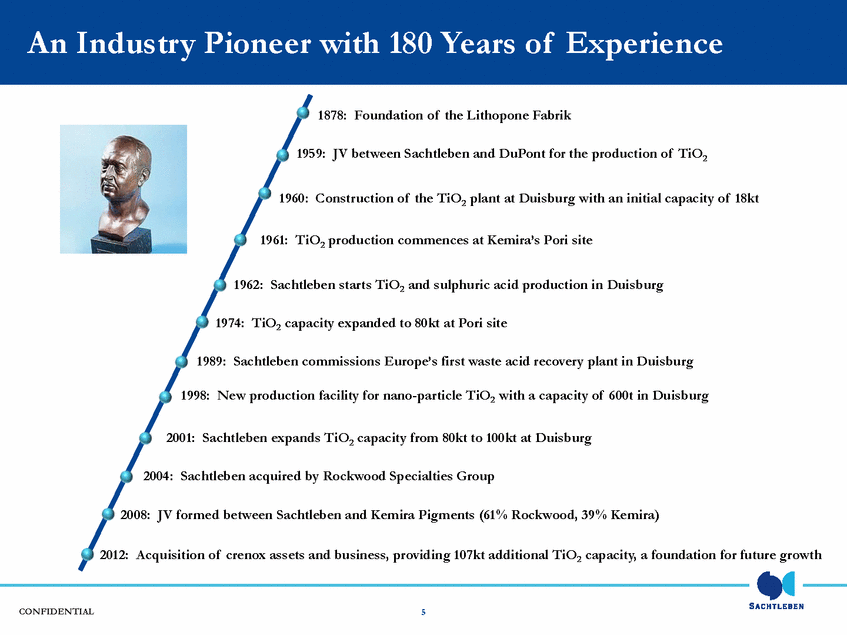
CONFIDENTIAL An Industry Pioneer with 180 Years of Experience 5 1878: Foundation of the Lithopone Fabrik 1959: JV between Sachtleben and DuPont for the production of TiO2 1960: Construction of the TiO2 plant at Duisburg with an initial capacity of 18kt 1961: TiO2 production commences at Kemira’s Pori site 1962: Sachtleben starts TiO2 and sulphuric acid production in Duisburg 1974: TiO2 capacity expanded to 80kt at Pori site 1989: Sachtleben commissions Europe’s first waste acid recovery plant in Duisburg 1998: New production facility for nano-particle TiO2 with a capacity of 600t in Duisburg 2004: Sachtleben acquired by Rockwood Specialties Group 2008: JV formed between Sachtleben and Kemira Pigments (61% Rockwood, 39% Kemira) 2001: Sachtleben expands TiO2 capacity from 80kt to 100kt at Duisburg 2012: Acquisition of crenox assets and business, providing 107kt additional TiO2 capacity, a foundation for future growth |
|
|
CONFIDENTIAL Company Overview Vernon Sumner |

|
|
CONFIDENTIAL A Focus on Niche Pigment Applications 6 FIBERS AND FILMS (19% Sales) Source: Sachtleben Note: Financials presented excluding crenox acquisition; all Sachtleben financial figures presented in accordance with IFRS. Reconciliations of IFRS to US-GAAP are provided in the Appendix OVERVIEW .Soft anatase TiO2 used to deluster man made fibers (MMF) .Hombitan TiO2 and Blanc Fixe are market leaders in MMF, particularly polyamide, high end polyester and white BOPET films .New “melt conditioning technology” TiO2 improves fiber plant profitability CPF (9% Sales) .Providing leading TiO2 solutions for customer formulations, and only producer of treated anatase and rutile products for all required applications .Ultra fine TiO2 grades used as UV absorbers in production of cosmetics and specialty sun care products .Hombitan AFDC a global TiO2 benchmark in food and pharmaceutical whitening TRENDS .MMF demand driven by population growth, improving Asian living standards .Ecological awareness and cotton prices increase MMF demand .Shift in white BOPET film portfolio to flat panel displays, solar cells and super size advertising films .Higher loading in white films for high performance flat panel displays (20% – 40% TiO2 content) .Increasing standard of living correlated to use of cosmetics .Low cyclicality, with high growth in emerging markets .Increasing consumer awareness of safety and more demanding regulatory requirements INKS (14% Sales) .A leading supplier of packaging ink for printing flexible packaging and can coatings .Competitive advantage due to particle size control, a result of superior milling know-how .Softer sulfate TiO2 technology preferred due to lower abrasion .Packaging inks growth and resilience related to demand for consumer goods .Emerging markets represent the highest growth potential .Employing technological know-how to enter the high growth, high performance market for electric battery anodes with lithium titanates |

|
|
CONFIDENTIAL A Focus on Niche Pigment Applications (cont’d) 7 COATINGS (25% Sales) Source: Sachtleben Note: Financials presented excluding crenox acquisition; all Sachtleben finanical figures presented in accordance with IFRS. Reconciliations of IFRS to US-GAAP are provided in the Appendix OVERVIEW PLASTICS (22% Sales) TRENDS .Represents the largest global market for TiO2, with Sachtleben focused on small to medium players in Europe, plus industrial and wood coating applications .A leading global supplier of Blanc Fixe and Blanc Fixe micro .Business development focused on high value, high margin niche opportunities .Inorganic additives such as TiO2 modify polymer systems, improving characteristics and color for the intended applications .Sachtleben targets niche applications in plastics with higher margin potential .Broad TiO2 and FAD product range with new product introductions driving growth .Demand for plastics largely related to demand for consumer goods (packaged foods, etc.), automotive and construction applications .Increasing demand for sophisticated products (e.g. low-lacing for multilayer films) .Window profiles industry using durable TiO2 grades is growing, driven by improving living standards and new energy saving regulations .Emerging markets represent the highest growth potential .Increasing technical requirements of customers provides opportunities for FAD .Formulation changes difficult without compromising quality .Increasing use of extenders benefits Sachtleben’s FAD business |

|
|
CONFIDENTIAL A Focus on Niche Pigment Applications (cont’d) 8 ENVIRONMENT (4% Sales) PAPER (3% Sales) Source: Sachtleben Note: Financials presented excluding crenox acquisition; all Sachtleben financial figures presented in accordance with IFRS. Reconciliations of IFRS to US-GAAP are provided in the Appendix .Increasingly shifting volumes away from paper to other areas with a higher degree of differentiation and lower competitive intensity .Lower performance requirements result in lower prices, though increasing demand seen for specialty anatase grades in certain applications .A key segment for Sachtleben’s waste minimization strategy – responsible for the sale of co-products from TiO2 production .Reprocesses waste acid, filter salt and digestor residues under contracts for TiO2 competitors ACTIVE MATERIALS (4% Sales) Active Materials include complex inorganic color pigments (CICPs), catalysts and refractory and metallurgical additives .Acquisition of crenox enhances position in high margin catalyst applications OVERVIEW SELECTED END USES |

|
|
CONFIDENTIAL Key Investment Highlights Vernon Sumner |

|
|
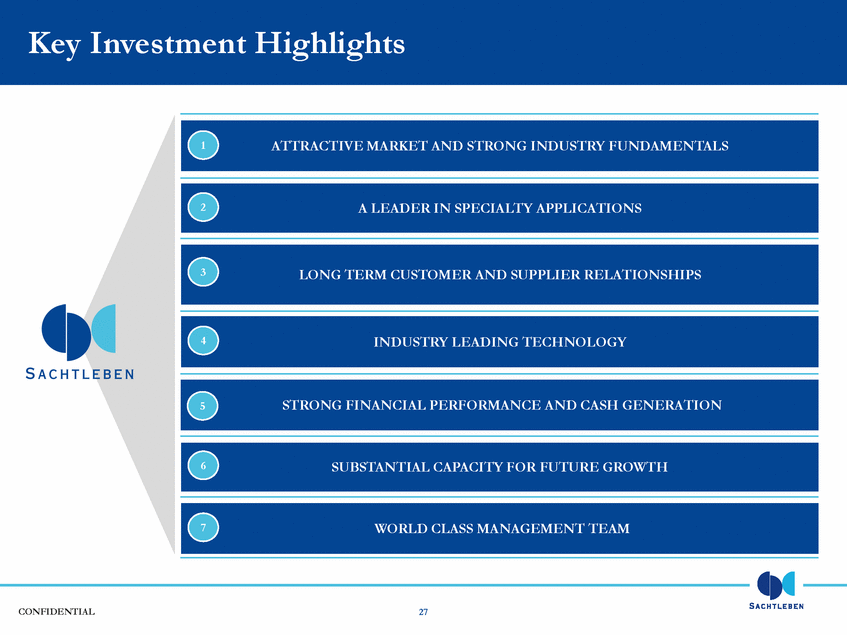
CONFIDENTIAL Key Investment Highlights ATTRACTIVE MARKET AND STRONG INDUSTRY FUNDAMENTALS A LEADER IN SPECIALTY APPLICATIONS LONG TERM CUSTOMER AND SUPPLIER RELATIONSHIPS INDUSTRY LEADING TECHNOLOGY WORLD CLASS MANAGEMENT TEAM 7 9 4 3 2 1 STRONG FINANCIAL PERFORMANCE AND CASH GENERATION 5 SUBSTANTIAL CAPACITY FOR FUTURE GROWTH 6 |

|
|
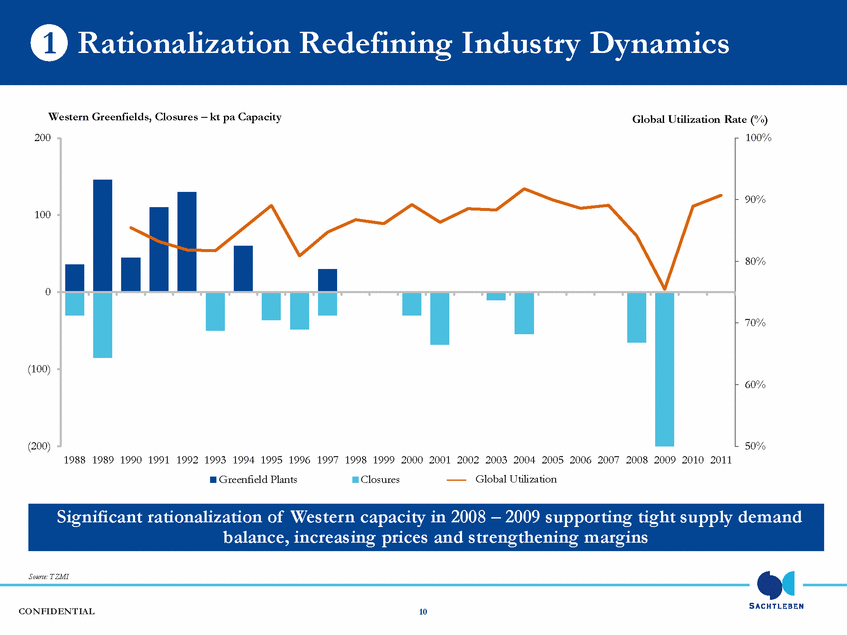
CONFIDENTIAL 50% 60% 70% 80% 90% 100% (200) (100) 0 100 200 1988 1989 1990 1991 1992 1993 1994 1995 1996 1997 1998 1999 2000 2001 2002 2003 2004 2005 2006 2007 2008 2009 2010 2011 Greenfield Plants Closures Western Greenfields, Closures – kt pa Capacity Global Utilization Rate (%) 10 Rationalization Redefining Industry Dynamics 1 Significant rationalization of Western capacity in 2008 – 2009 supporting tight supply demand balance, increasing prices and strengthening margins Source: TZMI Global Utilization |
|
|
CONFIDENTIAL 2,147 2,313 3,428 4,356 5,575 6,669 0 1,000 2,000 3,000 4,000 5,000 6,000 7,000 8,000 2011 2015 Developed Markets Emerging Markets TiO2 – a $18bn(1) Global Market with Attractive Growth Prospects 11 Source: TZMI (1) Based on 2011 demand of 5.6 million tons and average selling price of US$3.2m/kt (2) Developed markets include North America and Western Europe (3) Emerging markets include Asia-Pacific, Central and South America, Central Europe, Middle East and Africa 1 Global demand growth driven by emerging markets, with limited announced Western capacity additions and 250 – 300kt required to meet annual incremental demand STRONG EMERGING MARKET DRIVEN GROWTH +6.2% +1.9% 2011 – 2015E CAGR: +4.6% TiO2 demand in kt HIGH CORRELATION BETWEEN PER CAPITA GDP AND TiO2 CONSUMPTION India China Brazil Russia UK Germany Japan France Canada US 0.0 0.5 1.0 1.5 2.0 2.5 3.0 3.5 4.0 4.5 5.0 5.5 0 10,000 20,000 30,000 40,000 50,000 60,000 70,000 Consumption (kg TiO2/Capita) GDP (US$/Capita) (3) (2) |

|
|
CONFIDENTIAL 12 Limited Western Capacity Additions Expected Source: TZMI (1) Implied supply deficit based on announced capacity additions, debottlenecking projects and forecast demand growth TIGHT GLOBAL TiO2 SUPPLY/ DEMAND FUNDAMENTALS LIMITED WESTERN CAPACITY ADDITIONS PROVIDE VISIBILITY 5 years of lead-time for greenfield plant in Western Europe and as low as 3 years in China Little additional Western capacity expected in medium term (and no sulfate capacity) DuPont only major producer to announce additional capacity, adding 350kt by 2014 Limited potential for further additions Limited impact of additions in China on global balance Mainly targeting less demanding applications for domestic market Lower product quality, limited access to technology and know-how Raw material access a limiting factor for capacity additions 50% 60% 70% 80% 90% 100% 0 1,000 2,000 3,000 4,000 5,000 6,000 7,000 1990A 1991A 1992A 1993A 1994A 1995A 1996A 1997A 1998A 1999A 2000A 2001A 2002A 2003A 2004A 2005A 2006A 2007A 2008A 2009A 2010A 2011A 2012E 2013E 2014E 2015E Global Capacity (kt) Global Demand (kt) Global Utilization (%) Demand forecast and current utilization implies ~400kt global supply deficit by 2015(1) 1 Tight supply demand balance expected to continue given limited Western capacity additions insufficient to meet forecast demand and significant lead times required |

|
|
CONFIDENTIAL Well-Structured Market Offering Sustainable Competitive Advantages WELL-STRUCTURED HIGH QUALITY TiO2 MARKET WITH SUSTAINABLE COMPETITIVE ADVANTAGES Source: TZMI 13 Proprietary production technology and process know-how Environmental compliance R&D intensity Access to feedstocks Regulatory approvals High switching costs for specialty applications 5 years of lead-time for Western greenfield plant 1 1 2 3 4 5 7 6 High Quality TiO2 66% Low Quality 34% ISK DuPont Cristal Huntsman Kronos Tronox...... |

|
|
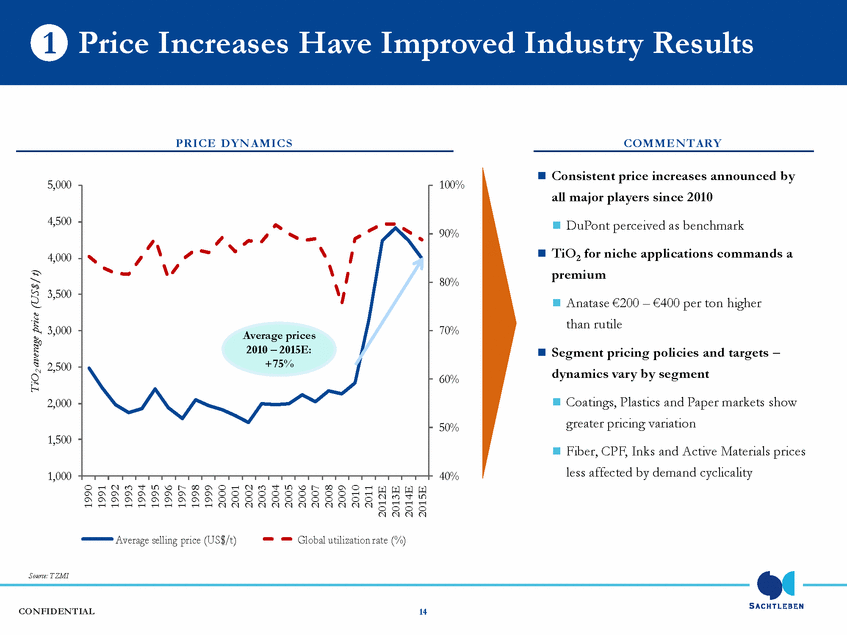
CONFIDENTIAL COMMENTARY Price Increases Have Improved Industry Results PRICE DYNAMICS Source: TZMI 14 Average prices 2010 – 2015E: +75% 1 .Consistent price increases announced by all major players since 2010 .DuPont perceived as benchmark .TiO2 for niche applications commands a premium .Anatase €200 – €400 per ton higher than rutile .Segment pricing policies and targets – dynamics vary by segment .Coatings, Plastics and Paper markets show greater pricing variation .Fiber, CPF, Inks and Active Materials prices less affected by demand cyclicality |
|
|
CONFIDENTIAL Favorable Market Fundamentals DEMAND CAPACITY PRICING .Strong correlation with per capita wealth and growth in emerging markets .Limited potential for substitution, especially within high quality applications .“Quality of life product” with growth rates exceeding GDP growth .Closures resulted in capacity reduction during downturn .Limited new Western capacity expected on stream, and no sulfate capacity in the near term .High quality TiO2 capacity fully utilized in 2010 and 2011 .Well-structured market .Securing supply an increasing priority for customers given capacity reductions .Premium pricing for specialty products .Sachtleben price increases of over 75% between June 2009 and December 2011 15 1 |

|
|
CONFIDENTIAL Architectural Coatings Specialty Coatings Paper Standard Plastics Specialty Plastics CPF Fibers Inks Active Materials Potential for premium pricing Degree of specialization Primarily rutile Primarily anatase High Low High Low 16 Focus on Specialty Applications with High Differentiation Potential 2 SACHTLEBEN WITH CLEAR FOCUS ON SPECIALTIES Sachtleben focuses on specialty niches with high degree of specialization as compared to other leading producers SPECIALTY NICHES WITH POTENTIAL FOR PREMIUM PRICING Source: Sachtleben, TZMI Note: Size of bubbles indicates relative global TiO2 demand by market segment. Specialty Coatings includes “Industrial/OEM” and “Specialty”; Standard Plastics includes “Polyolefins”; Specialty Plastics includes “PVC” and “Engineering Plastics”, Assessment of peers according to TZMI; “Potential for pricing premium” and “Degree of specialisation” as relative measures SACHTLEBEN FOCUS Specialties & Other 4% Paints & Coatings 58% Paper 9% Plastics 22% Inks 3% Fiber 2% SACHTLEBEN FOCUS CPF 1% |

|
|
CONFIDENTIAL 0% 10% 20% 30% 2005 2006 2007 2008 2009 2010 2011 Sachtleben European Specialty Chemicals Tronox Kronos Huntsman - Pigments Industry-Leading Profitability 2 Source: Sachtleben, Company reports Note: No separate EBITDA figures for DuPont’s TiO2 business available (1) Sachtleben 2005-2008 EBITDA as reported by Rockwood and US-GAAP based. All other Sachtleben financials presented in accordance with IFRS. US-GAAP and IFRS figures may not be directly comparable. Reconciliations of IFRS to US-GAAP are provided in the Appendix (2) Includes Elementis, Johnson Matthey, Umicore, AZ Electronic Materials and Croda (3) Tronox pro forma adjusted for Exxaro Mineral Sands acquisition in September 2011 (4) EBITDA (Earnings Before Interest Depreciation and Amortisation) is not a measure of profit from operations, net income or cash flow under IFRS and is not defined by, or presented in accordance with IFRS figures. Sachtleben defines and computes EBITDA as net income adjusted for income tax benefit/ expense, financial result, depreciation, amortization and impairments on non-current assets and results from discontinued operations. Sachtleben’s EBITDA may not be comparable to EBITDA reported by other companies due to differences in the way this measure is calculated EBITDA(4) margin % 17 Focus on niche Specialty Applications differentiates Sachtleben from commodity TiO2 producers Sachtleben’s minimum EBITDA margin 14% 2005A 2006A 2007A 2008A 2009A 2010A 2011A Avg. 05A-11A Sachtleben(1) 21% 20% 17% 14% 15% 17% 27% 19% Selected European Specialty Chemicals(2) 21% 23% 23% 21% 19% 23% 23% 22% Tronox(3) 14% 12% 8% 10% 14% 19% 28% 15% Kronos 18% 15% 10% 8% 3% 15% 29% 14% Huntsman - Pigments 14% 11% 5% 2% 3% 18% 30% 12% |

|
|
CONFIDENTIAL SEGMENT/ PRODUCT .Fibres .Printing Inks .CPF .AM/ CICP .Plastics, Zinc-based .Coatings 18 COMMENTS .Technology leader .Product launches supporting leadership .Excellent brand reputation .Long-term relationships with major customers .Supplying all CPF applications .Unparalleled reputation with major cosmetics companies .State-of-the-art UV absorbers .World’s only producer of ZnS .A leading Western producer of Lithophone .Leader in high performance CICP .Significant growth opportunities in catalysts .A leading supplier of Specialty Blanc Fixe A Global Leader Across Niche Applications 2 Sachtleben derives over half of its revenue from niche applications in which it has a leadership position Source: Sachtleben TITANIUM DIOXIDE FAD |

|
|
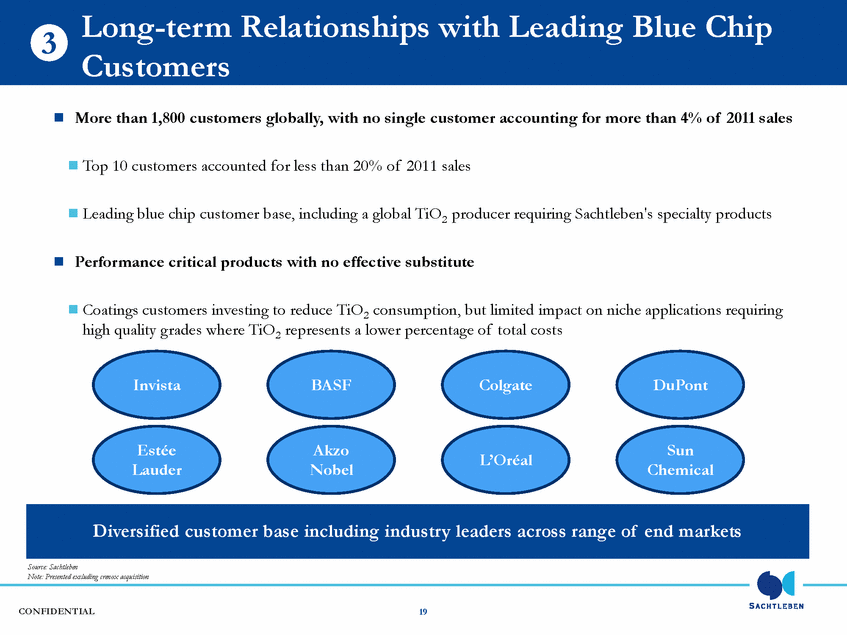
CONFIDENTIAL Source: Sachtleben Note: Presented excluding crenox acquisition Diversified customer base including industry leaders across range of end markets Long-term Relationships with Leading Blue Chip Customers 3 19 .More than 1,800 customers globally, with no single customer accounting for more than 4% of 2011 sales .Top 10 customers accounted for less than 20% of 2011 sales .Leading blue chip customer base, including a global TiO2 producer requiring Sachtleben's specialty products .Performance critical products with no effective substitute .Coatings customers investing to reduce TiO2 consumption, but limited impact on niche applications requiring high quality grades where TiO2 represents a lower percentage of total costs Invista Estée Lauder BASF Akzo Nobel Colgate L’Oréal DuPont Sun Chemical |
|
|
CONFIDENTIAL Long-term Secured Supply of Feedstock Source: TZMI, Sachtleben Note: Presented excluding crenox acquisition Red Current Supplier Orange Potential Supplier Ilmenite Sulfate Slag ~90% of ilmenite and slag already secured for 2013/2014/2015 20 3 Chlorine Slag Sorel, Canada Tyssedal, Norway South Africa India Vietnam China Ukraine Madagascar Australia Senegal Moma, Mozambique SLAG QIT EXXARO ILMENITE TITANIA AUSTRALASIAN MINERALS KENMARE |

|
|
CONFIDENTIAL Well Invested Infrastructure Supported by Industry Leading Technology 21 4 Source: Sachtleben DUISBURG PORI KREFELD .With 200kt of capacity, one of the largest white pigment facilities in the world .100kt TiO2 and 100kt of FAD (zinc sulfate, Lithopone, Blanc Fixe) .Fully integrated production site .“Zero Waste” TiO2 production – all by-products are recycled back into process or sold .First TiO2 site to practice total acid recycling Uniquely positioned in terms of sulfate process capacity and know-how, with state-of-the-art technology capable of producing anatase TiO2 for niche, high growth applications .The largest sulfate process TiO2 plant in the western world .130kt TiO2 capacity .Only GMP TiO2 site in the world .State-of-the-art nano particle plant .On-site co-generation plant .Ilmenite is primary feedstock .Co-product copperas sold for waste water treatment and iron oxide pigment applications .Additional sulfate TiO2 capacity of 107kt acquired in 2012 .Allowing for future profitable volume growth .Strong position in high growth, high margin catalysts .Integration plan expected to replicate successful combination of Rockwood and Kemira assets .Flexible ilmenite / slag feedstock technology |

|
|
CONFIDENTIAL Strong Financial Performance 22 Source: Sachtleben Note: Financials presented excluding crenox acquisition; all Sachtleben financial figures presented in accordance with IFRS. Reconciliations of IFRS to US-GAAP are provided in the Appendix (1) LTM = Last Twelve Months Industry leading margins reflect optimal capacity utilization and leading positions in specialty applications 5 70 77 87 97 100 118 137 161 183 15% 15% 16% 18% 17% 19% 21% 24% 27% 10% 15% 20% 25% 30% 0 25 50 75 100 125 150 175 200 Q4 2009 Q1 2010 Q2 2010 Q3 2010 Q4 2010 Q1 2011 Q2 2011 Q3 2011 Q4 2011 LTM EBITDA LTM EBITDA Margin (1) €m |

|
|
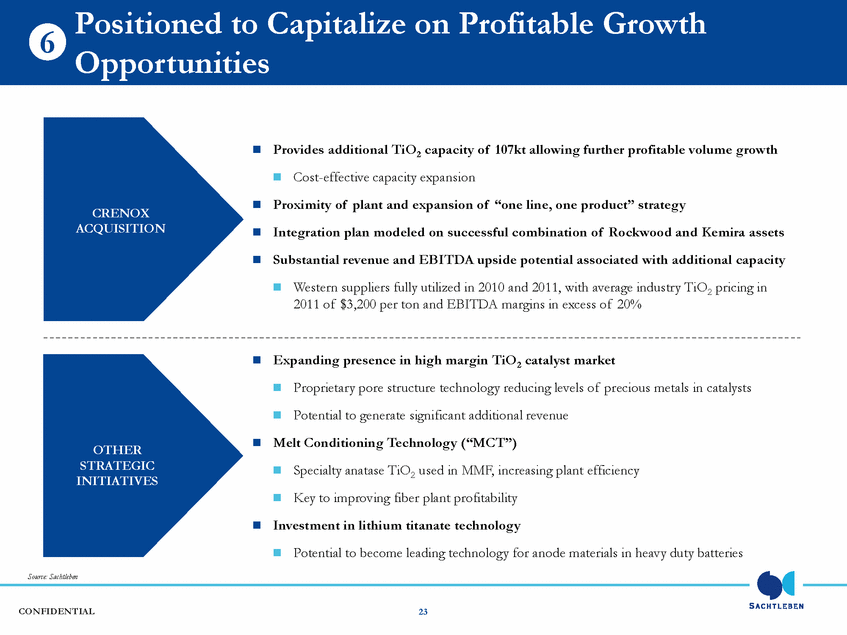
CONFIDENTIAL 23 Source: Sachtleben Positioned to Capitalize on Profitable Growth Opportunities 6 .Provides additional TiO2 capacity of 107kt allowing further profitable volume growth .Cost-effective capacity expansion .Proximity of plant and expansion of “one line, one product” strategy .Integration plan modeled on successful combination of Rockwood and Kemira assets .Substantial revenue and EBITDA upside potential associated with additional capacity .Western suppliers fully utilized in 2010 and 2011, with average industry TiO2 pricing in 2011 of $3,200 per ton and EBITDA margins in excess of 20% .Expanding presence in high margin TiO2 catalyst market .Proprietary pore structure technology reducing levels of precious metals in catalysts .Potential to generate significant additional revenue .Melt Conditioning Technology (“MCT”) .Specialty anatase TiO2 used in MMF, increasing plant efficiency .Key to improving fiber plant profitability .Investment in lithium titanate technology .Potential to become leading technology for anode materials in heavy duty batteries CRENOX ACQUISITION OTHER STRATEGIC INITIATIVES |
|
|
CONFIDENTIAL Key Financials Dr. Andreas Grünewald |

|
|
CONFIDENTIAL 196 208 189 83 100 80 2009A 2010A 2011A TiO2 FAD 474 573 669 0 300 600 900 2009A 2010A 2011A 24 Source: Sachtleben Note: Financials presented excluding crenox acquisition; all Sachtleben financial figures presented in accordance with IFRS. Reconciliations of IFRS to US-GAAP are provided in the Appendix SALES (€M) VOLUMES(KT) Pricing Driving Revenue Growth & Margin Development Compound annual sales growth of 19% between 2009 and 2011, driven by increasing prices Substantial upside potential from recent crenox acquisition – additional 107kt capacity Average industry TiO2 pricing of ~$3,200 per ton in 2011, with Western producers fully utilized EBITDA margin expansion of 130 basis points since 2009, reaching 27% in 2011 TiO2 70 100 183 15% 17% 27% 10% 15% 20% 25% 30% 35% 40% 0 60 120 180 240 2009A 2010A 2011A EBITDA Margin EBITDA (€M) |

|
|
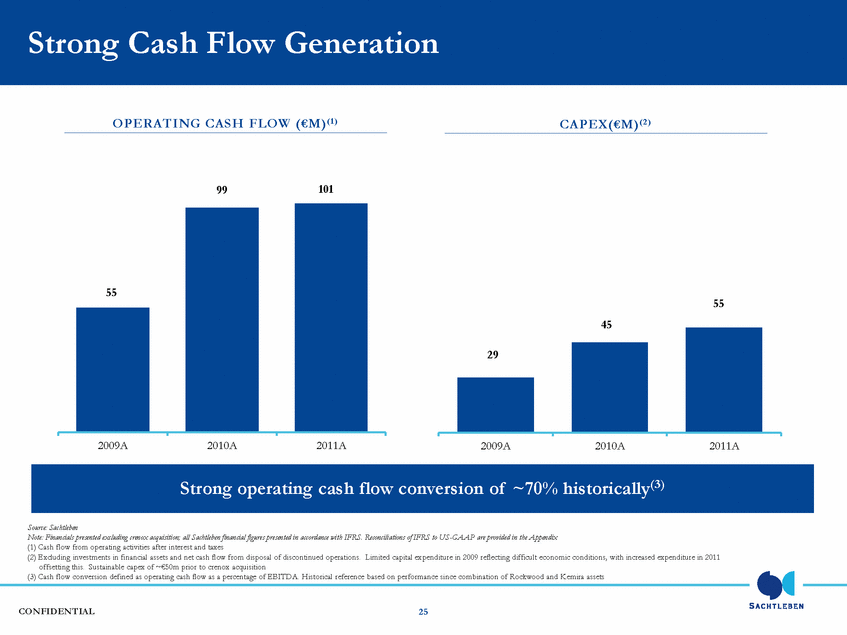
CONFIDENTIAL 55 99 101 0 60 120 2009A 2010A 2011A 29 45 55 0 60 120 2009A 2010A 2011A 25 Source: Sachtleben Note: Financials presented excluding crenox acquisition; all Sachtleben financial figures presented in accordance with IFRS. Reconciliations of IFRS to US-GAAP are provided in the Appendix (1) Cash flow from operating activities after interest and taxes (2) Excluding investments in financial assets and net cash flow from disposal of discontinued operations. Limited capital expenditure in 2009 reflecting difficult economic conditions, with increased expenditure in 2011 offsetting this. Sustainable capex of ~€50m prior to crenox acquisition (3) Cash flow conversion defined as operating cash flow as a percentage of EBITDA. Historical reference based on performance since combination of Rockwood and Kemira assets OPERATING CASH FLOW (€M)(1) Strong Cash Flow Generation Strong operating cash flow conversion of ~70% historically(3) CAPEX(€M)(2) |
|
|
CONFIDENTIAL Balance Sheet 26 €M, Y/E DEC 2009A 2010A 2011A Goodwill & Other Intangibles 295 286 275 PP&E 306 308 321 Other Non-Current Assets 19 18 5 Total Non-Current Assets 620 612 601 Inventories 108 109 169 Trade Receivables 75 81 78 Other Receivables and Assets 14 14 18 Cash & Cash Equivalents 34 43 25 Total Current Assets 231 247 290 Provisions 90 95 112 Liabilities 253 214 179 Deferred Tax 32 33 24 Total Non-Current Liabilities 376 342 315 Provisions 20 46 69 Trade Payables 59 67 62 Liabilities 36 26 32 Total Current Liabilities 115 139 163 Total Equity 361 378 414 Source: Sachtleben Note: Financials presented excluding crenox acquisition; all Sachtleben financial figures presented in accordance with IFRS. Reconciliations of IFRS to US-GAAP are provided in the Appendix (1) Leverage calculated as net financial debt divided by EBITDA as defined in senior facilities agreement Recently refinanced debt facilities, securing €400m term loans and €30m revolving credit facility (revised leverage(1) ~2.2x 2011 EBITDA) |

|
|
CONFIDENTIAL Conclusions Vernon Sumner |
|
|
CONFIDENTIAL Key Investment Highlights ATTRACTIVE MARKET AND STRONG INDUSTRY FUNDAMENTALS A LEADER IN SPECIALTY APPLICATIONS LONG TERM CUSTOMER AND SUPPLIER RELATIONSHIPS INDUSTRY LEADING TECHNOLOGY WORLD CLASS MANAGEMENT TEAM 7 27 4 3 2 1 STRONG FINANCIAL PERFORMANCE AND CASH GENERATION 5 SUBSTANTIAL CAPACITY FOR FUTURE GROWTH 6 |
|
|
CONFIDENTIAL Appendix – Reconciliations of IFRS to US GAAP |

|
|
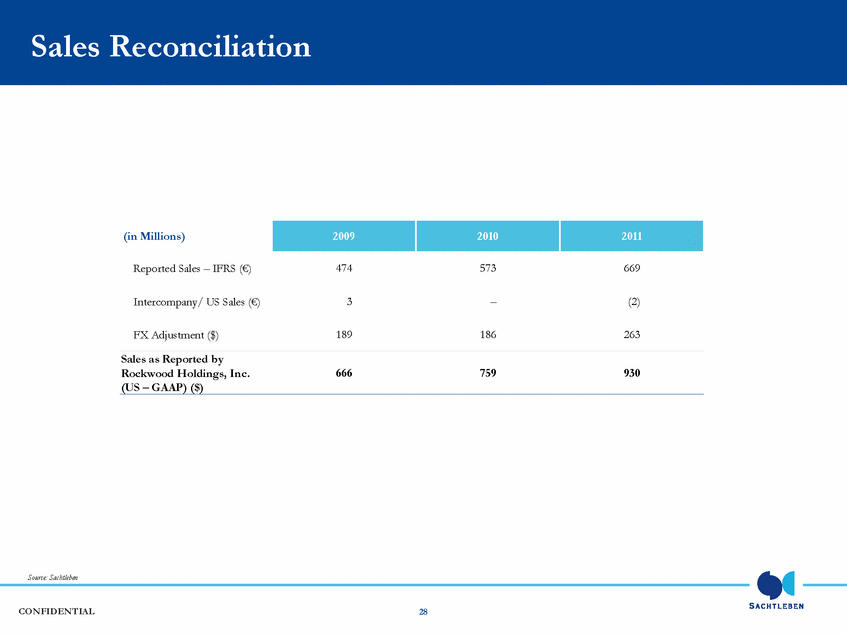
CONFIDENTIAL Sales Reconciliation 28 Source: Sachtleben (in Millions) 2009 2010 2011 Reported Sales – IFRS (€) 474 573 669 Intercompany/ US Sales (€) 3 – (2) FX Adjustment ($) 189 186 263 Sales as Reported by Rockwood Holdings, Inc. (US – GAAP) ($) 666 759 930 |
|
|
CONFIDENTIAL LTM EBITDA Reconciliation to Income Before Taxes (US – GAAP) 29 (in Millions) 2009 2010 2011 Q4 Q1 Q2 Q3 Q4 Q1 Q2 Q3 Q4 IFRS EBITDA LTM reported (€) 70 77 87 97 100 118 137 161 183 IFRS/ US – GAAP Adjustments (€) (1) (2) (3) (4) (2) (3) (1) 2 2 FX Adjustment ($) 28 32 33 33 32 39 51 65 73 Adjusted EBITDA ($) 97 107 117 126 130 154 187 228 258 Interest expense, Net ($) (25) (19) (18) (16) (15) (9) (10) (12) (13) Depreciation and Amortization ($) (78) (78) (75) (72) (70) (69) (71) (73) (72) Other Adjustments ($) (2) (3) (2) – – (1) – (4) (9) Income Before Taxes as Reported by Rockwood Holdings, Inc. (US – GAAP) ($) (8) 7 22 38 45 75 106 139 164 Source: Sachtleben |

|
|
CONFIDENTIAL Operating Cash Flow Reconciliation 30 Source: Sachtleben (in Millions) 2009 2010 2011 Reported Operating Cash Flow – IFRS (€) 55 99 101 IFRS/ US – GAAP Adjustments (€) 8 (1) (1) FX Adjustment ($) 24 33 39 Operating Cash Flow as Reported by Rockwood Holdings, Inc. (US – GAAP) ($) 87 131 139 |

|
|
CONFIDENTIAL Capex Reconciliation 31 Source: Sachtleben (in Millions) 2009 2010 2011 Reported Capital Expenditures – IFRS (€) 29 45 55 IFRS/ US – GAAP Adjustments (€) – – – FX Adjustment ($) 12 15 20 Capital Expenditures as Reported by Rockwood Holdings, Inc. (US – GAAP) ($) 41 60 75 |

|
|
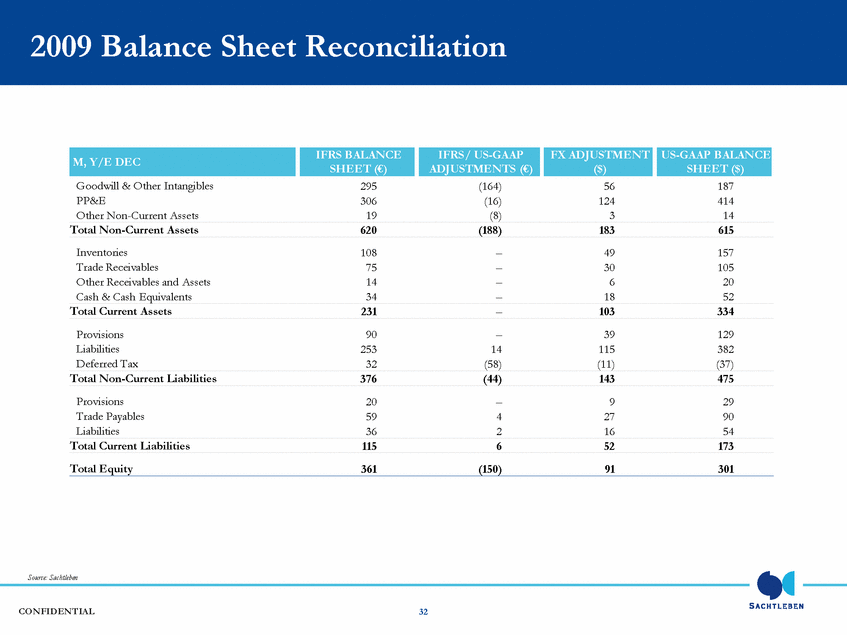
CONFIDENTIAL 2009 Balance Sheet Reconciliation 32 M, Y/E DEC IFRS BALANCE SHEET (€) IFRS/ US-GAAP ADJUSTMENTS (€) FX ADJUSTMENT ($) US-GAAP BALANCE SHEET ($) Goodwill & Other Intangibles 295 (164) 56 187 PP&E 306 (16) 124 414 Other Non-Current Assets 19 (8) 3 14 Total Non-Current Assets 620 (188) 183 615 Inventories 108 – 49 157 Trade Receivables 75 – 30 105 Other Receivables and Assets 14 – 6 20 Cash & Cash Equivalents 34 – 18 52 Total Current Assets 231 – 103 334 Provisions 90 – 39 129 Liabilities 253 14 115 382 Deferred Tax 32 (58) (11) (37) Total Non-Current Liabilities 376 (44) 143 475 Provisions 20 – 9 29 Trade Payables 59 4 27 90 Liabilities 36 2 16 54 Total Current Liabilities 115 6 52 173 Total Equity 361 (150) 91 301 Source: Sachtleben |
|
|
CONFIDENTIAL 2010 Balance Sheet Reconciliation 33 M, Y/E DEC IFRS BALANCE SHEET (€) IFRS/ US-GAAP ADJUSTMENTS (€) FX ADJUSTMENT ($) US-GAAP BALANCE SHEET ($) Goodwill & Other Intangibles 286 (164) 40 162 PP&E 308 (14) 100 394 Other Non-Current Assets 18 (10) 1 9 Total Non-Current Assets 612 (188) 141 565 Inventories 109 – 38 147 Trade Receivables 81 – 27 108 Other Receivables and Assets 14 – 2 16 Cash & Cash Equivalents 43 – 17 60 Total Current Assets 247 – 84 332 Provisions 95 – 32 127 Liabilities 214 14 78 306 Deferred Tax 33 (57) (8) (32) Total Non-Current Liabilities 342 (43) 102 401 Provisions 46 – 15 61 Trade Payables 67 3 23 93 Liabilities 26 – 9 35 Total Current Liabilities 139 3 47 189 Total Equity 378 (148) 77 307 Source: Sachtleben |

|
|
CONFIDENTIAL 2011 Balance Sheet Reconciliation 34 M, Y/E DEC IFRS BALANCE SHEET (€) IFRS/ US-GAAP ADJUSTMENTS (€) FX ADJUSTMENT ($) US-GAAP BALANCE SHEET ($) Goodwill & Other Intangibles 275 (164) 33 144 PP&E 321 (11) 92 402 Other Non-Current Assets 5 – 2 7 Total Non-Current Assets 601 (175) 127 553 Inventories 169 – 51 220 Trade Receivables 77 – 24 101 Other Receivables and Assets 18 – 5 23 Cash & Cash Equivalents 25 – 8 33 Total Current Assets 290 – 88 377 Provisions 112 – 33 145 Liabilities 179 13 56 248 Deferred Tax 24 (44) (6) (26) Total Non-Current Liabilities 315 (31) 83 367 Provisions 69 – 21 90 Trade Payables 62 3 19 84 Liabilities 32 – 10 42 Total Current Liabilities 163 3 50 216 Total Equity 414 (147) 81 347 Source: Sachtleben |
