Attached files
| file | filename |
|---|---|
| 8-K - CURRENT REPORT ON FORM 8-K - WELLS FARGO & COMPANY/MN | d378397d8k.htm |
| EX-99.1 - THE PRESS RELEASE, DEEMED "FILED" UNDER THE SECURITIES EXCHANGE ACT OF 1934 - WELLS FARGO & COMPANY/MN | d378397dex991.htm |
 2Q12 Quarterly Supplement
July 13, 2012
Exhibit 99.2 |
 Wells Fargo
2Q12 Supplement 1
Appendix
Pages 22-39
-
Recent acquisitions and divestitures
23
-
Non-strategic/liquidating loan portfolio risk reduction
24
-
Purchased credit-impaired (PCI) portfolios
25
-
PCI accretable yield
26
-
PCI accretable yield (Commercial & Pick-a-Pay)
27
-
2Q12 Credit quality highlights
28
-
Pick-a-Pay mortgage portfolio
29
-
Pick-a-Pay credit highlights
30
-
Real estate 1-4 family first mortgage portfolio
31
-
Home equity portfolio
32-33
-
Credit card portfolio
34
-
Auto portfolios
35
-
Student lending portfolio
36
Tier 1 common equity under Basel I
37
Tier 1 common equity under Basel III
(Estimated)
38
Forward-looking statements and
additional information
39
Table of contents
2Q12 Results
-
2Q12 Results
Page 2
-
Continued strong diversification
3
-
Balance Sheet overview
4
-
Income Statement overview
5
-
Loans
6
-
Deposits
7
-
Net interest income
8
-
Noninterest income
9
-
Noninterest expense
10
-
Year-over-year revenue up while expenses down
11
-
Efficiency ratio improvements
12
-
Community Banking
13
-
Wholesale Banking
14
-
Wealth, Brokerage and Retirement
15
-
Credit quality
16-17
-
Mortgage servicing
18-19
-
Capital
20
-
Summary
21 |
 Wells Fargo
2Q12 Supplement 2
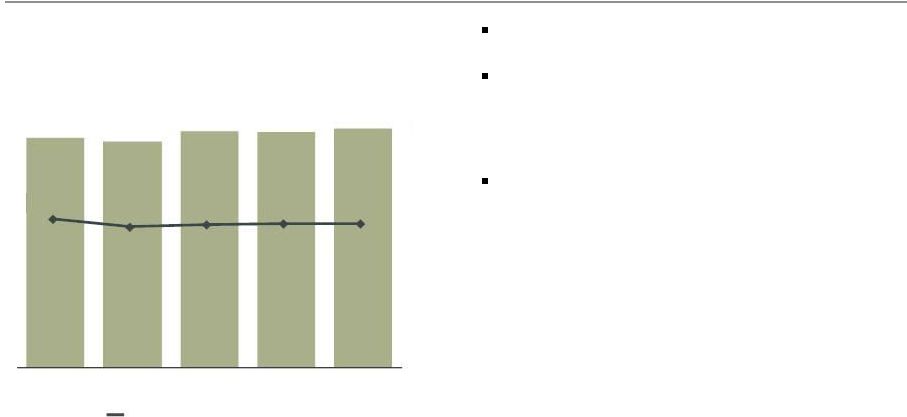
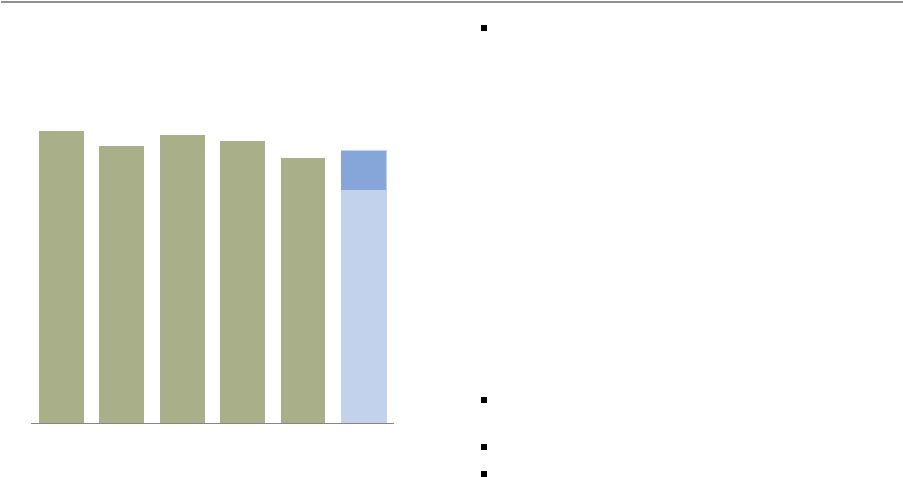
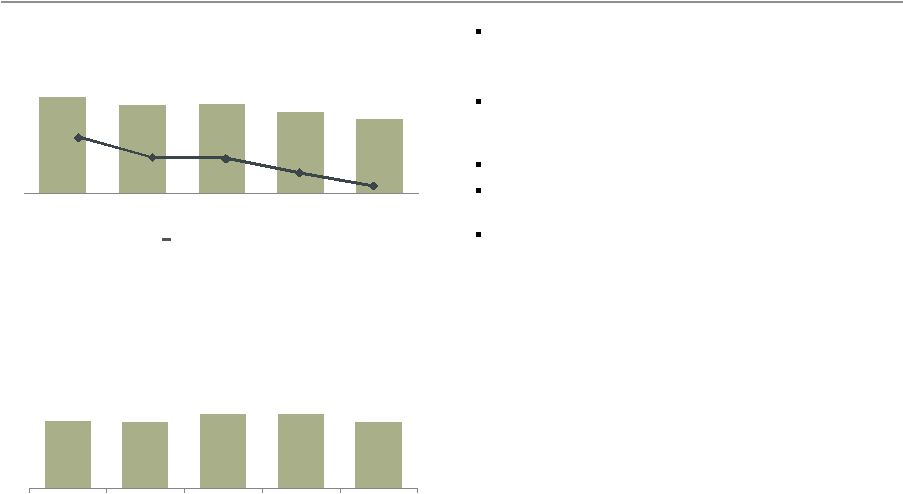
Record earnings of $4.6 billion, up 9% linked
quarter (LQ) and 17% year-over-year (YoY)
Record diluted earnings per share of $0.82, up
9% LQ and 17% YoY
Total revenue of $21.3 billion, down $347 million
LQ as higher net interest income was offset by
lower market-sensitive revenues
Pre-tax pre-provision profit
(1)
of $8.9 billion, up
$249 million LQ
Positive operating leverage; efficiency ratio
improvement to 58.2%
(2)
Improved credit quality including an 8% LQ
decline in net charge-offs and a 7% LQ decline in
NPAs
ROA = 1.41%, up 10 bps LQ and up 14 bps YoY
ROE = 12.86%, up 72 bps LQ and up 94 bps YoY
Capital levels remained strong
-
10.08% Tier 1 common equity ratio under Basel I
and estimated Tier 1 common equity ratio under
Basel III of
7.78%
(3)
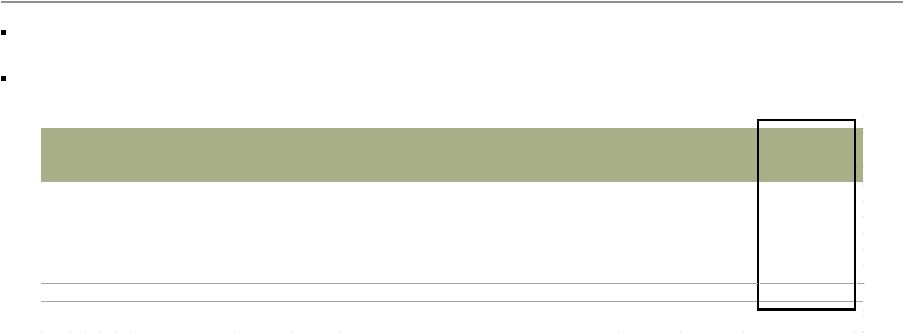
2Q12 Results
Wells Fargo Net Income
($ in millions)
3,948
4,055
4,107
4,248
4,622
2Q11
3Q11
4Q11
1Q12
2Q12
(1) Pre-tax pre-provision profit (PTPP) is total revenue less noninterest
expense. Management believes PTPP is a useful financial measure because it enables investors
and others to assess the Company’s ability to generate capital to cover credit losses
through a credit cycle. (2) Efficiency ratio defined as noninterest expense
divided by total revenue (net interest income plus noninterest income). (3)
Estimated
Basel
III
calculation
based
on
management’s
current
interpretation
of
the
Basel
III
capital
rules
proposed
by
federal
banking
agencies
in
notices
of proposed rulemaking announced in June 2012. The proposed rules and interpretations and
assumptions used in estimating Basel III calculations are subject to change depending
on final promulgation of Basel III capital rules. See pages 37-38 for additional information regarding Tier 1 common equity ratios. |
 Wells Fargo
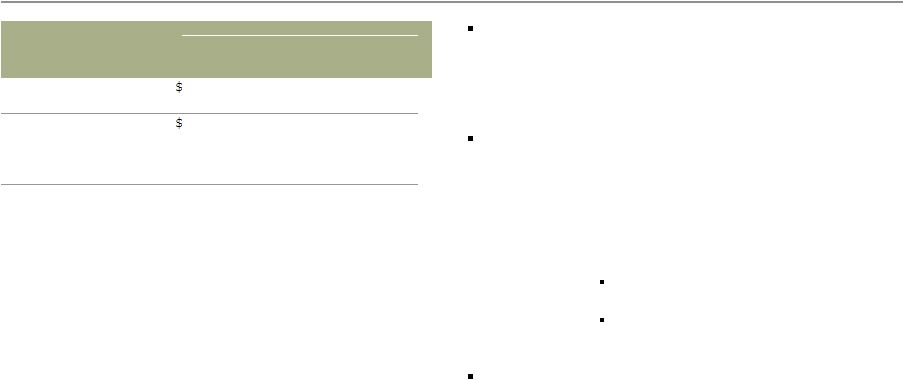
2Q12 Supplement 3
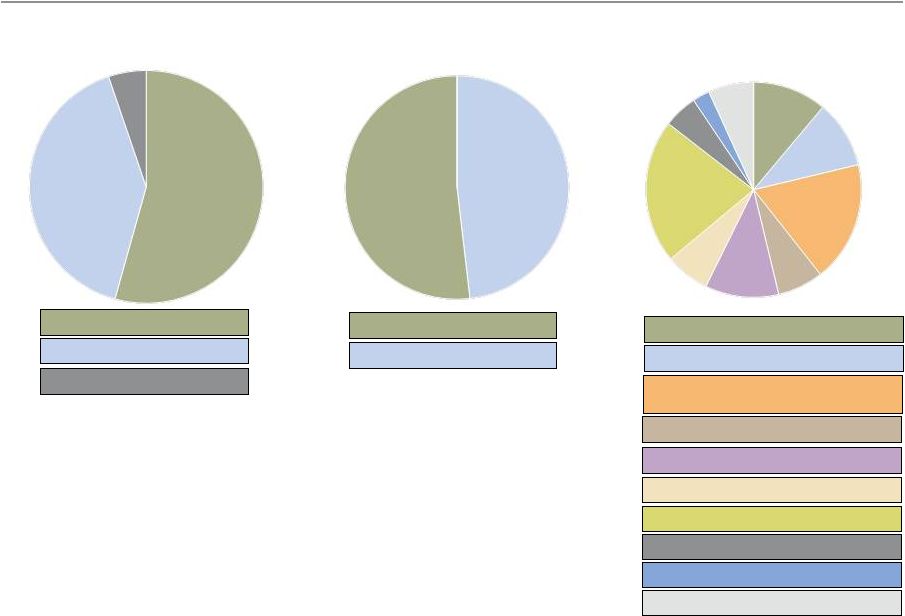
Balanced Spread and
Fee Income
Diversified Fee
Generation
Deposit Service Charges
11%
Card Fees
7%
Other Banking Fees
11%
Mortgage Servicing, net
7%
Insurance
5%
Net Gains from Trading
(1)
2%
Noninterest Income
48%
Net Interest Income
52%
All data is for 2Q12.
(1) Net gains from trading activities.
(2) Other noninterest income includes net losses on debt securities available for sale,
net gains from equity Diversified Loan
Portfolio
Commercial Loans
41%
Consumer Loans
54%
Continued strong diversification
Foreign Loans
5%
Mortgage Orig./Sales, net
22%
Trust, Investment & IRA fees
10%
Commissions & All Other
Investment Fees
18%
Other Noninterest Income
(2)
7%
48%
52%
11%
10%
18%
7%
11%
7%
22%
5%
2%
7%
54%
41%
5%
investments, operating leases and all other noninterest income. |
 Wells Fargo
2Q12 Supplement 4
Balance Sheet overview
Loans
Total period-end loans up $8.7 billion; core loans grew $13.8 billion;
non-strategic/liquidating portfolio decreased $5.1 billion
(1)
Securities available for
sale (AFS)
Balances down $3.4 billion as new investments were more than offset by
called lower-yielding securities and run-off
Trading assets
Balances down $11.3
billion as first quarter conforming agency MBS
production held over quarter-end to facilitate best execution was delivered
during the second quarter
Deposits
Balances down $1.3 billion reflecting seasonality due to tax payments
Long-term debt
Balances down $4.8 billion as $7.6 billion in issuances were more than
offset by $12.4 billion in maturities and redemptions
Common stock
repurchases
Purchased 53 million common shares in the quarter and an additional
estimated 11 million shares through a forward repurchase transaction that
is expected to settle in 3Q12
Pick-a-Pay, liquidating home equity, legacy WFF indirect auto, legacy WFF debt
consolidation, Education Finance-government guaranteed, and (1) See pages 6 and 24 for additional information regarding core loans and the
non-strategic/liquidating portfolio, which comprises the
Period-end balances. All result comparisons are 2Q12 compared to 1Q12.
legacy Wachovia Commercial & Industrial, Commercial Real Estate, foreign and other PCI
loan portfolios. |
 Wells Fargo
2Q12 Supplement 5
Income Statement overview
Net interest income
NII up $149 million as higher PCI loan resolution income and lower
long-term debt expense were offset by continued balance sheet repricing
Net interest margin (NIM) unchanged at 3.91%
Noninterest income
Mortgage banking up $23 million
-
Provision for mortgage repurchase losses up $239 million primarily due
to future expected demands from the GSEs on loans sold between 2006
and 2008
Market sensitive revenues
(1)
down $553 million
-
Trading down $377 million driven by $218 million lower deferred
compensation plan investment income (P&L neutral)
-
Equity investment gains down $122 million from strong 1Q12 results and
higher OTTI
(2)
Trust & investment fees up $59 million on higher retail brokerage asset-
based fees and capital markets
Noninterest expense
Employee
benefits
expense
down
$559
million
from
seasonally
high
1Q12
and $222 million lower deferred compensation expense
Commission and incentive compensation decreased $63 million from
seasonally high 1Q12, which was partially offset by $112 million higher
revenue-based compensation
Operating losses up $47 million and included an accrual for the settlement
with the Department of Justice (DOJ) announced 7/12/12
All result comparisons are 2Q12 compared with 1Q12.
(1) Includes net gains from trading activities, net losses on debt securities available
for sale and net gains from equity investments. (2) Other-than-temporary
impairment. |
 Wells Fargo
2Q12 Supplement 6
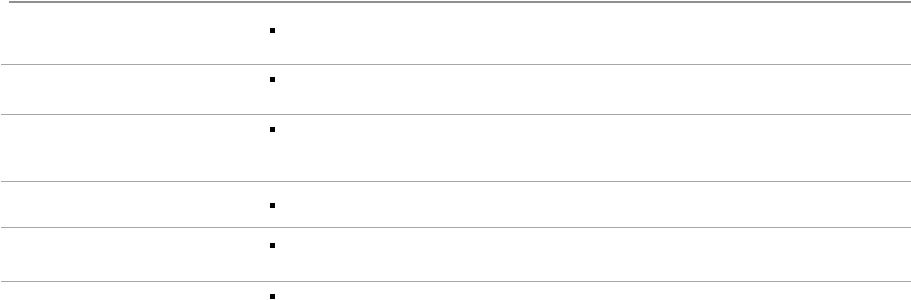
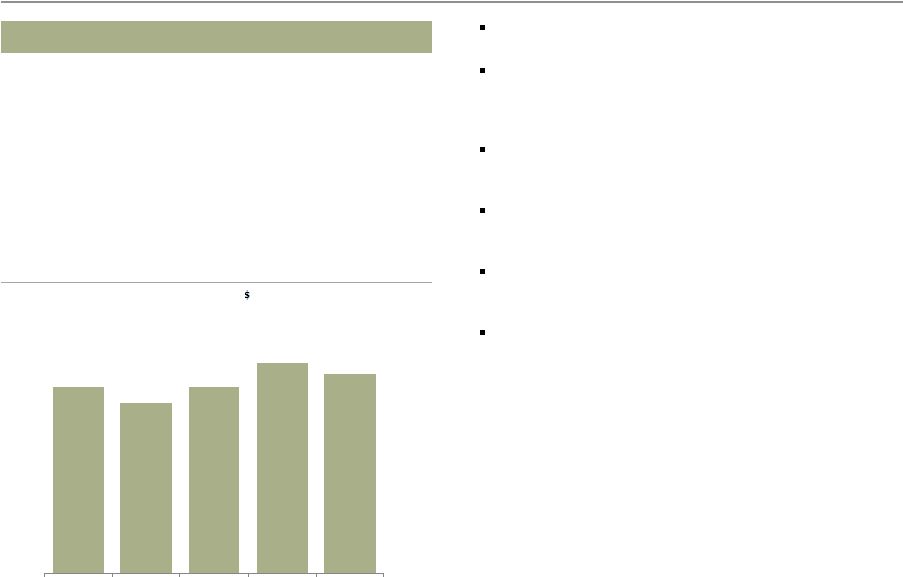
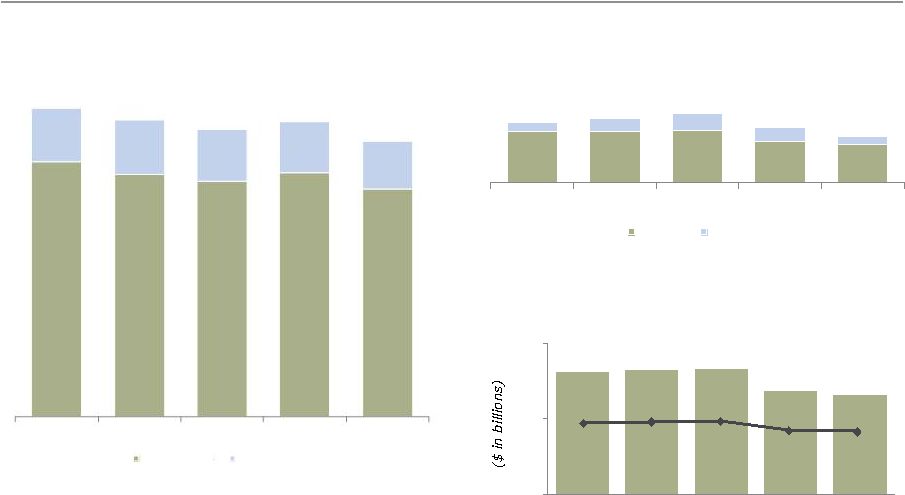
Loans
Strong core loan growth
Period-end loans up $8.7 billion from 1Q12
-
Commercial loans up $8.3 billion as growth in
C&I and foreign was partially offset by lower CRE
•
Included $6.9 billion ($5.4 billion C&I and $1.5
billion foreign) from the purchase of BNP Paribas’
energy lending business and the purchase of
subscription finance loans from WestLB
-
Consumer loans up $375 million as growth in
first mortgages, core auto and credit card was
partially offset by a $2.3 billion decline in junior
lien mortgage
Non-strategic/liquidating loans
(1)
down $5.1
billion from 1Q12
Core loans grew $13.8 billion from 1Q12
Total average loan yield of 4.83% up 2 bps LQ
-
Benefited from higher than average PCI loan
resolutions
-
Weighted average yield of the non-strategic
portfolio was 6.20% in 2Q12 vs. 5.40% in 1Q12
Period-end balances.
(1) See page 24 for additional information regarding the non-strategic/liquidating
portfolio, which comprises the Pick-a-Pay, liquidating home equity, legacy WFF
indirect auto, legacy WFF debt consolidation, Education Finance-government guaranteed, and
legacy Wachovia Commercial & Industrial, Commercial Real Estate, foreign and other
PCI loan portfolios. Period–end Loans Outstanding
($ in billions)
(1)
Total average loan yield
630.1
643.6
657.3
658.3
672.1
121.8
116.5
112.3
108.2
103.1
751.9
760.1
769.6
766.5
775.2
2Q11
3Q11
4Q11
1Q12
2Q12
Core loans
Non-strategic/liquidating loans
5.00%
4.87%
4.81%
4.81%
4.83% |
 Wells Fargo
2Q12 Supplement 7
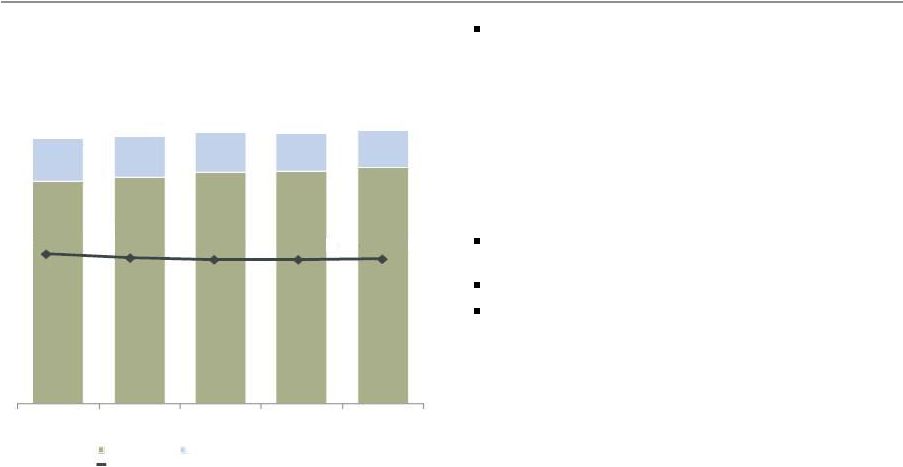
Deposits
Strong growth and reduced average cost
Average deposits up $9.0 billion LQ to $924.0
billion driven by growth in consumer deposits
Average core deposits of $880.6 billion up $10.1
billion from 1Q12 and up $73.2 billion, or 9% YoY
-
115% of average loans
-
Average retail core deposits up 5%
annualized LQ
Average core checking and savings up $12.5
billion, or 2% from 1Q12, and up $84.9 billion, or
12% YoY
-
93% of average core deposits
Consumer checking accounts
(1)
up a net
1.0% YoY
Average deposit cost of 19 bps down 1 bp from
1Q12 and 9 bps YoY
Average Deposits and Rates
($ in billions)
Average Core Checking and Savings
($ in billions)
(1) Checking account growth is 12-months ending May 2012.
735.4
807.8
820.3
2Q11
1Q12
2Q12
651.4
668.4
669.5
199.3
246.6
254.5
850.7
915.0
924.0
2Q11
1Q12
2Q12
Interest-bearing deposits
Noninterest-bearing deposits
0.28%
0.20%
0.19%
Average deposit cost |
 Wells Fargo
2Q12 Supplement 8
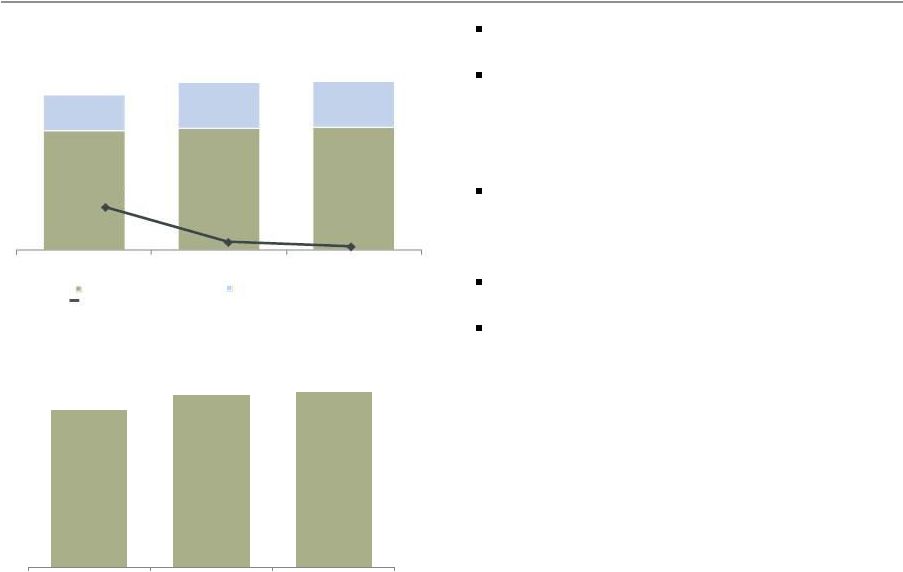
Net interest income
Net Interest Income (TE)
(1)
($ in millions)
Tax-equivalent net interest income
(1)
up $155
million from 1Q12; NIM unchanged
Average earning assets up 1% LQ
-
Short-term investments/cash up $15.3 billion
-
$2.6 billion increase in mortgages held for sale
-
Trading assets down $1.2 billion
NIM stable on an ~7 bps benefit from variable
items including PCI loan resolution income
-
Balance sheet repricing continued as higher
yielding earning assets ran off
-
Interest-bearing deposit costs stable in
the quarter
-
Long-term debt expense declined on the
redemption of TRUPs
Net Interest Margin (NIM)
(1) Tax equivalent net interest income is based on the federal statutory rate of 35% for
the periods presented. Net interest income was $10,678 million, $10,542 million,
$10,892 million, $10,888 million and $11,037 million for 2Q11, 3Q11, 4Q11, 1Q12 and 2Q12 respectively.
10,851
10,714
11,083
11,058
11,213
2Q11
3Q11
4Q11
1Q12
2Q12
4.01%
3.84%
3.89%
3.91%
3.91% |
 Wells Fargo
2Q12 Supplement 9
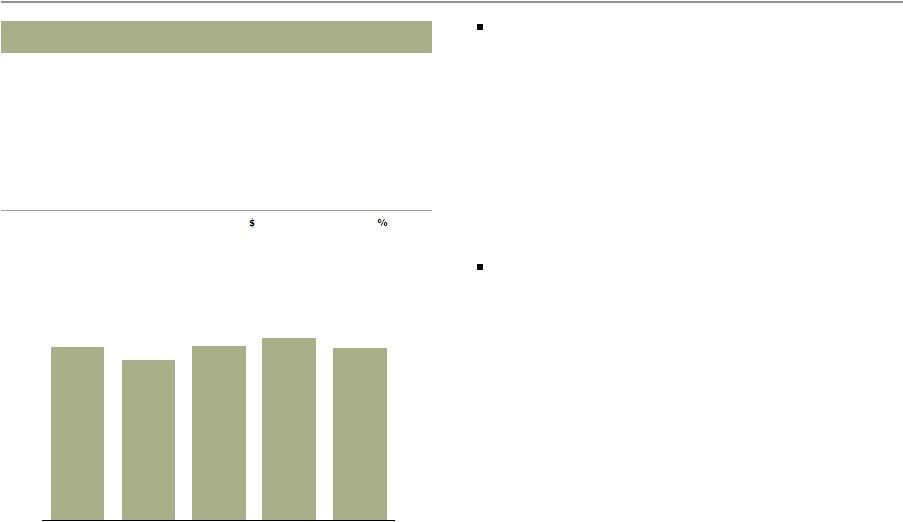
Noninterest income
Deposit service charges up 5% LQ reflecting product
and pricing changes as well as seasonality
Trust and investment fees up 2% LQ on higher retail
brokerage asset-based fees and capital markets
activity partially offset by weaker retail brokerage
transaction activity
Card fees up 8% LQ reflecting higher credit and debit
interchange revenue on higher volumes and new
account growth
Mortgage banking up $23 million, or 1%, LQ despite a
$239 million increase in the provision for mortgage
repurchase losses
Trading gains down $377 million primarily on $218
million lower deferred compensation plan investment
results (P&L neutral)
Equity gains down $122 million LQ from strong 1Q12
results and higher OTTI
9,708
9,086
9,713
10,748
10,252
2Q11
3Q11
4Q11
1Q12
2Q12
vs
vs
($ in millions)
2Q12
1Q12
2Q11
Noninterest income
Service charges on deposit accounts
$
1,139
5
%
6
Trust and investment fees
2,898
2
(2)
Card fees
704
8
(30)
Other fees
1,134
4
11
Mortgage banking
2,893
1
79
Insurance
522
1
(8)
Net gains from trading activities
263
(59)
(36)
(61)
n.m.
(52)
Net gains from equity investments
242
(34)
(67)
Operating leases
120
n.m.
17
Other
398
(37)
9
Total nonterest income
10,252
(5)
%
6
Net losses on debt securities available
for sale |
 Wells Fargo
2Q12 Supplement 10
Noninterest expense
Noninterest expense down $596 million from
1Q12 driven by lower personnel expense; down
$78 million from 2Q11
-
Commission and incentive compensation
decreased $63 million LQ, or 3%, as $112
million increase in revenue driven compensation
was more than offset by declines in seasonally
high 1Q12 expense
-
Employee benefits expense down $559 million
from 1Q12 seasonally high expense and $222
million decline in deferred compensation
expense
-
$89 million higher severance expense driven by
expense initiatives
-
~$100 million in mortgage servicing regulatory
consent orders outside professional services
expense was stable LQ
-
$47 million higher operating losses included an
accrual for the settlement with the DOJ
12,475
11,677
12,508
12,993
12,397
2Q11
3Q11
4Q11
1Q12
2Q12
vs
vs
($ in millions)
2Q12
1Q12
2Q11
Noninterest expense
Salaries
$
3,705
3
%
3
Commission and incentive compensation
2,354
(3)
8
Employee benefits
1,049
(35)
(10)
Equipment
459
(18)
(13)
Net occupancy
698
(1)
(7)
Core deposit and other intangibles
418
-
(10)
FDIC and other deposit assessments
333
(7)
6
Other
3,381
2
(3)
Total noninterest expense
12,397
(5)
(1)
2Q12 expenses included: |
 Wells Fargo
2Q12 Supplement 11
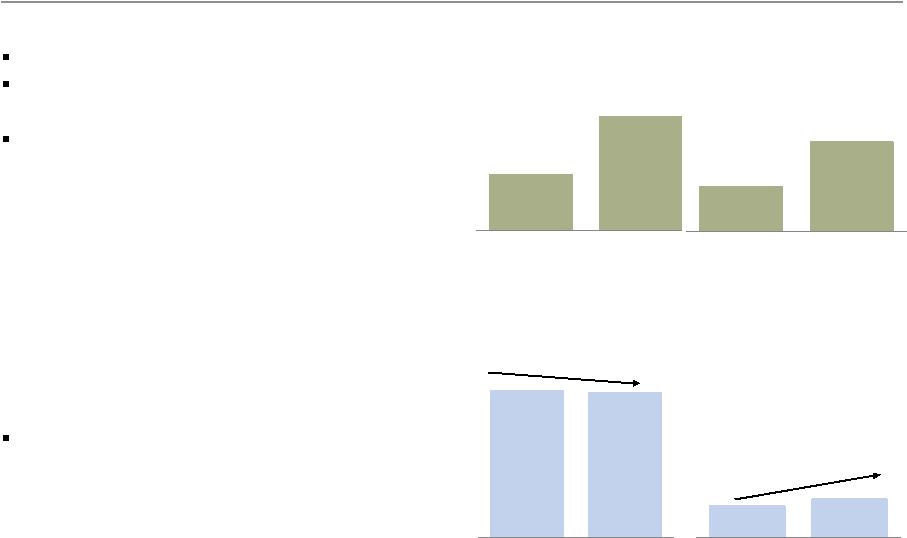
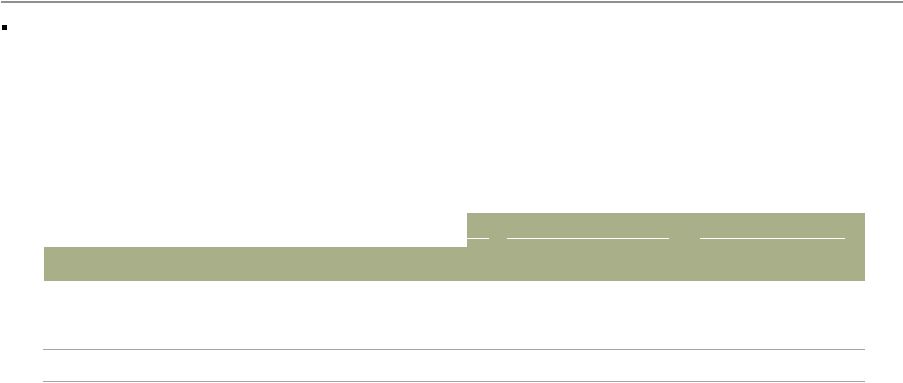
Year-over-year revenue up while expenses down
$64
$131
2Q11
2Q12
Year-over-year change:
Revenue up $903 million
Noninterest expense down $78 million
Revenue and expense considerations as of 6/30/12
include:
-
Higher volume-driven revenue and expenses
•
Record mortgage loan applications in 2Q12
•
Second largest mortgage pipeline at the end
of 2Q12
-
Successfully acquired several companies and loan
portfolios during the last twelve months
-
Continued reinvestment in the business
-
Elevated litigation accruals
-
Mortgage servicing costs remain elevated due to
the consent orders
Currently expect 4Q12 noninterest expense to
exceed our original target of ~$11,250 million given
stronger than anticipated revenue
-
Expenses are expected to trend down over the
remainder of the year
2Q11
2Q12
(1%)
Total
Consumer Lending
Real Estate
2Q11
2Q12
+19%
Originations
$51
$102
2Q11
2Q12
Pipeline
Mortgage
($ in billions)
FTEs |
 Wells Fargo
2Q12 Supplement 12
Efficiency ratio
(1)
improvements
61.2%
59.5%
60.7%
60.1%
58.2%
55% -
59%
2Q11
3Q11
4Q11
1Q12
2Q12
Target
Expense reduction accomplishments to date
(2)
:
-
Reduced FTEs by 3%
•
FTEs in high cost geographies reduced 10%
-
Net occupancy expense reduced by 7%
•
Includes real estate reduction of 3 million
square feet
-
Reduced third party spend through renegotiated
contracts and optimization of internal demand
-
Reduced foreclosed asset expense
-
Reduced loss mitigation personnel and related
expenses
-
Reduced technology expenses by 3% despite
meaningful growth in IT-related volumes
-
Reduced organizational complexity
•
13% reduction in legal entities
•
13% reduction in satellite data centers
Efficiency ratio of 58.2% in 2Q12 was the lowest
in nine quarters
Continue to target a range of 55%-59%
Currently expect to be within that range for the
rest of 2012
(1)
Efficiency ratio defined as noninterest expense divided by total revenue (net interest income
plus noninterest income).
(2) Expense reductions since 4Q10 except for technology savings measured from 2Q10.
|
 Wells Fargo
2Q12 Supplement 13
vs
vs
($ in billions)
2Q12
1Q12
2Q11
Consumer Lending
Credit card payment volumes (POS)
$
11.7
14
%
15
Credit card penetration
(1)
31.0
110
bps
360
Home Mortgage
Applications
$
208
11
%
91
Application pipeline
102
29
100
Originations
131
2
105
Managed residential
mortgage servicing ($ in trillions)
$
1.9
1
3
Community Banking
Average loans were stable LQ as growth in first
mortgage, core auto and credit card was offset by
non-strategic/liquidating portfolio run-off and
lower home equity outstandings
Regional Banking
Continued franchise and cross-sell growth
(1)
-
Consumer checking
(2)
up a net 1.0%
-
Business checking
(2)
up a net 3.8%
-
Retail bank cross-sell of 6.00 products per
household up from 5.82 in 2Q11
•
West cross-sell = 6.37
•
East cross-sell = 5.52
Consumer Lending
Credit card penetration
(1) (3)
rose to 31.0%, up
from 29.9% in 1Q12 and 27.4% in 2Q11
Record consumer auto originations of $6.6 billion,
up 6% LQ and 18% YoY
Mortgage originations of $131 billion up 2% LQ
-
16% of originations
were
from
HARP
Quarter-end pipeline of $102 billion up 29% LQ
Managed residential mortgage servicing of $1.9
trillion up 1% LQ and 3% YoY
(1) Metrics reported on a one-month lag from reported quarter-end; for example
2Q12 cross-sell is as of May 2012.
(2) Checking account growth is 12-months ending May 2012.
(3) Household penetration as of May 2012 and defined as the percentage of retail
banking deposit households that have a credit card with Wells Fargo. Household
penetration has been redefined to include legacy Wells Fargo Financial accounts.
(4) Home Affordable Refinance Program.
vs
vs
($ in millions)
2Q12
1Q12
2Q11
Net interest income
$
7,306
-
%
(1)
Noninterest income
5,786
(5)
11
Provision for credit losses
1,573
(16)
(18)
Noninterest expense
7,580
(3)
2
Income tax expense
1,313
2
24
Segment earnings
$
2,535
8
%
20
($ in billions)
Avg loans, net
$
483.9
-
(3)
Avg core deposits
586.1
2
6
(4)
2Q12
1Q12
2Q11
Regional
Banking
Consumer checking account growth
(1)(2)
1.0
%
2.5
7.5
Business checking account growth
(1)(2)
3.8
3.8
5.0
Retail Bank household cross-sell
(1)
6.00
5.98
5.82
(3) |
 Wells Fargo
2Q12 Supplement 14
Wholesale Banking
Record revenue of $6.1 billion
Net interest income up 5% driven by higher PCI
loan resolution income and loan outstandings
-
Average loans up $1.6 billion driven by
acquisitions and customer loan growth partially
offset by continued runoff of the liquidating
portfolio
Noninterest income down 3% LQ driven by lower
trading and equity gains
Provision expense up $93 million LQ as lower losses
were offset by a $25 million reserve build vs. a
$100 million release in 1Q12
Expenses up 2% LQ driven by non-personnel
expenses related to growth initiatives and
compliance and regulatory requirements
Treasury Management
Commercial card spend volume of $4.0 billion up
8% LQ and 26% YoY
Investment Banking
Investment Banking fees from Commercial Banking
customers up 22% YTD from 2011 YTD
YTD U.S. investment banking market share
(2)
of
4.9% up from 4.7% YTD 2011
Asset Management
Total AUM down 2% LQ
(1) Approved and initiated.
(2) Source: Dealogic U.S. investment banking fee market share.
vs
vs
($ in millions)
2Q12
1Q12
2Q11
Net interest income
$
3,347
5
%
14
Noninterest income
2,770
(3)
4
Provision for credit losses
188
98
n.m.
Noninterest expense
3,113
2
13
Income tax expense
932
(8)
(7)
Segment earnings
$
1,881
1
%
(2)
($ in billions)
Avg loans, net
$
270.2
1
11
Avg core deposits
220.9
-
16
vs
vs
($ in billions)
2Q12
1Q12
2Q11
Key Metrics:
Commercial card spend
volume
$
4.0
8
%
26
CEO Mobile Wire volume
(1)
4.1
26
217
YTD U.S. investment banking
market share %
(2)
4.9
%
10
bps
20
Total AUM
$
436.5
(2)
%
(9)
Advantage Funds AUM
204.1
(3)
(12)
-
Money market outflows and lower market valuation
partially offset by positive fixed income flows |
 Wells Fargo
2Q12 Supplement 15
Wealth, Brokerage and Retirement
Net interest income flat LQ
Noninterest income down 4% LQ driven by lower
deferred compensation results
Total revenue declined 3% LQ; excluding $122
million lower deferred compensation plan
investment results, revenues increased 1% on
higher retail brokerage asset-based fees, partially
offset by lower brokerage transaction revenue
Expenses down 7% LQ primarily due to lower
deferred compensation expense; excluding $118
million lower deferred compensation expense,
expenses were down 2%
Retail Brokerage
Managed account assets flat LQ and up 7% YoY
driven by strong net flows
Wealth Management
Wealth
Management
client
assets
down
4%
YoY
reflecting asset mix including global equities and
commodities, as well as lower deposit balances
Retirement
IRA assets down 2% LQ and 1% YoY
Institutional Retirement plan assets down 2% LQ
and up 1% YoY
(1) Includes deposits.
(2) Data as of May 2012.
vs
vs
($ in millions)
2Q12
1Q12
2Q11
Net interest income
$
698
-
-
Noninterest income
2,273
(4)
(5)
Provision for credit losses
37
(14)
(40)
Noninterest expense
2,376
(7)
(4)
Income tax expense
210
16
2
Segment earnings
$
343
16
2
($ in billions)
Avg loans, net
$
42.5
-
(2)
Avg core deposits
134.2
(1)
7
vs
vs
($ in billions, except where noted)
2Q12
1Q12
2Q11
Key Metrics:
WBR Clients Assets
(1)
($ in trillions)
$
1.4
(2)
%
(2)
Cross-sell
(2)
10.22
1
3
Retail
Brokerage
Financial Advisors
15,170
-
%
-
Managed account assets
$
278.9
-
7
Client assets
(1)
($ in trillions)
1.2
(2)
(2)
Wealth
Management
Client assets
(1)
196.7
(2)
(4)
Retirement
IRA Assets
282.3
(2)
(1)
Institutional Retirement
Plan Assets
250.2
(2)
1
% |
 Wells Fargo
2Q12 Supplement 16
2.84
2.61
2.64
2.40
2.20
2Q11
3Q11
4Q11
1Q12
2Q12
1.52%
1.37%
1.36%
1.25%
1.15%
1.84
1.81
2.04
2.00
1.80
2Q11
3Q11
4Q11
1Q12
2Q12
Credit quality
Improved performance with lower net charge-offs
$2.2 billion net charge-offs, down $195 million LQ
and down 59% from 4Q09 peak
-
1.15% net charge-off rate, down 10 bps LQ
Provision expense of $1.8 billion, down $195
million from 1Q12, included a $400 million reserve
release
(1)
in 2Q12 in line with 1Q12
Allowance for credit losses = $18.6 billion
Remaining PCI nonaccretable = 25.4% of
remaining UPB
(2)
Credit metrics:
-
$1.8 billion LQ decline in NPAs reflects $1.4
billion reduction in NPLs and $310 million lower
foreclosed assets
-
Early stage consumer delinquency balances
declined 3% and rates improved 6 bps LQ
driven by the Pick-a-Pay and core home equity
portfolios
(1) Reserve release represents the amount by which net charge-offs exceed the
provision for credit losses. (2) Unpaid principal balance for PCI loans that have
not had a UPB charge-off. Net Charge-offs
($ in billions)
Net charge-off rate
Provision Expense
($ in billions) |
 Wells Fargo
2Q12 Supplement 17
1.5
1.5
1.5
1.2
1.1
0.3
0.4
0.5
0.4
0.3
1.8
1.9
2.0
1.6
1.4
2Q11
3Q11
4Q11
1Q12
2Q12
Consumer
Commercial
8.1
8.2
8.3
6.8
6.6
$0
$5
$10
2Q11
3Q11
4Q11
1Q12
2Q12
2.32%
2.37%
2.40%
2.00%
1.94%
Credit quality
Nonperforming Assets
($ in billions)
Consumer
Loans
30-89
DPD
&
Still
Accruing
(Balances and rates)
Loans
90+
DPD
and
Still
Accruing
($ in billions)
(1)
23.0
21.9
21.3
22.0
20.6
4.9
4.9
4.7
4.6
4.3
27.9
26.8
26.0
26.6
24.9
2Q11
3Q11
4Q11
1Q12
2Q12
Nonaccrual loans
Foreclosed assets
(1)
Includes $1.7 billion at March 31, 2012, resulting from implementation of Interagency
Supervisory Guidance on Allowance for Loan and Lease Losses Estimation Practices for
Loans and Lines of Credit Secured by Junior Liens on 1-4 Family Residential Properties issued January 31, 2012.
(2)
Excludes mortgage loans insured/guaranteed by the FHA or VA, reverse mortgages, margin loans
and student loans whose repayments are predominantly guaranteed by guarantee agencies
on behalf of the U.S. Department of Education under the Federal Family Education Loan Program. Also excludes the
carrying value of PCI loans contractually delinquent. (3) Consumer
includes mortgage loans held for sale 30-89 days and 90 days or more past due and still accruing.
(2)
(3)
(2)
(3) |
 Wells Fargo
2Q12 Supplement 18
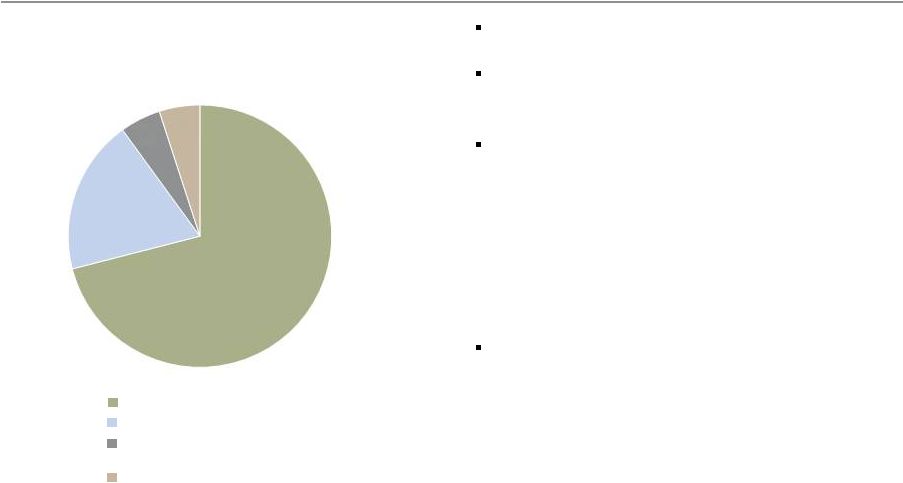
Mortgage servicing
Wells Fargo has a high quality servicing portfolio
Residential Mortgage Servicing Portfolio
$1.9 Trillion
(as of June 30, 2012)
Agency
Retained and acquired portfolio
Non-agency securitizations of
WFC originated loans
Non-agency acquired servicing
and private whole loan sales
71% of the portfolio is with the Agencies (FNMA,
FHLMC and GNMA)
19% are loans that we retained or acquired
-
Loss exposure handled through loan loss
reserves and PCI nonaccretable
5% are private securitizations where Wells Fargo
originated the loan and therefore has some
repurchase risk
-
79% prime at origination
-
58% from pre-2006 vintages
-
Insignificant amount of home equity and no
option ARMs
-
~50% do not have traditional reps and
warranties
5% are non-agency acquired servicing and
private whole loan sales
-
4% is acquired servicing where Wells Fargo
did not underwrite and securitize and has
repurchase recourse with the originator
-
1% are private whole loan sales
•
Less than 2% subprime at origination
•
Loans sold to others and subsequently
securitized are included in private
securitizations above
71%
19%
5%
5% |
 Wells Fargo
2Q12 Supplement 19
Mortgage servicing
Delinquency and outstanding repurchase demands
As of 1Q12, the delinquency and foreclosure ratio
of Wells Fargo’s servicing portfolio continued to
be significantly lower than peers, per industry
data
Wells Fargo’s total delinquency and foreclosure
ratio for 2Q12 was 7.14%, up LQ due to
seasonality but down from 7.44% in 2Q11
Balance of total outstanding repurchase demands
down 10% LQ and down 26% YoY
Increased repurchase reserve in 2Q12 primarily
due to future expected demands from the GSEs
on loans sold between 2006 and 2008
Agency
demands
outstanding
-
Agency repurchase demands outstanding down
from 1Q12
-
Demands on newer vintage originations continue
to emerge consistent with our estimates
-
Demands and losses continued to be concentrated
in
the
2006
-
early
2008
vintages
Non-Agency
demands
outstanding
-
Balance of non-agency repurchase demands
outstanding, which includes non-agency securities,
whole loans sold and acquired servicing, down
from 1Q12; continued to be a small percentage of
total demands outstanding
(1) Inside Mortgage Finance, data as of March 31, 2012. Industry excluding WFC
performance calculated based on IMF data.
(2) Industry is all large servicers ($6.6 trillion) including WFC, C, JPM and BAC.
(3) Includes mortgage insurance rescissions.
(2)
Total Outstanding Repurchase Demands
(3)
and
Agency New Demands for 2006-2008 Vintages
1Q12 Servicing Portfolio Delinquency
Performance
(1)
(1,000)
1,000
3,000
5,000
7,000
9,000
11,000
13,000
15,000
17,000
19,000
2Q10
3Q10
4Q10
1Q11
2Q11
3Q11
4Q11
1Q12
2Q12
Number of Outstanding Demands
Agency New Demands for 2006-2008 Vintages
Original Loan Balance of Outstanding Demands ($ in B)
4.51%
5.56%
5.48%
9.10%
6.24%
6.92%
2.38%
2.70%
4.97%
3.98%
3.64%
4.11%
Wells Fargo
Citi
JPM Chase
Bank of
America
Industry
Industry ex
WFC
Foreclosure Rate
Delinquency Rate
6.89%
8.26%
10.45%
13.08%
9.88%
11.03% |
 Wells Fargo
2Q12 Supplement 20
Capital
Capital remained strong and continued to grow
9.15%
9.34%
9.46%
9.98%
10.08%
2Q11
3Q11
4Q11
1Q12
2Q12
Tier 1 common equity ratio under Basel I
increased 10 bps in 2Q12
Tier 1 common equity ratio under Basel III is
estimated to be 7.78% at 6/30/12
(1)
-
Pro forma estimate approximately 30 bps lower as a
result of latest Basel III capital proposals released in
June 2012
Redeemed $1.8 billion of trust preferred
securities with a weighted average coupon
of 6.31% on 6/15/12, and repurchased $2.2
billion of subordinated debt on 6/28/12
Purchased 53 million common shares in
2Q12 and entered into a $350 million 2Q12
forward repurchase transaction, estimated
to be 11 million shares, that is expected to
settle in 3Q12
Tier 1 Common Equity Ratio
Under Basel I
See Appendix page 37 for additional information on Tier 1 common equity. 2Q12 capital
ratios are preliminary estimates. (1) Estimated Basel III calculation based on management’s current interpretation of
the Basel III capital rules proposed by federal banking agencies in notices of proposed
rulemaking announced in June 2012. The proposed rules and interpretations and assumptions used in estimating Basel III calculations are
subject to change depending on final promulgation of Basel III capital rules. See pages
37-38 for additional information regarding Tier 1 common equity ratios. |
 Wells Fargo
2Q12 Supplement 21
Summary
Record earnings of $4.6 billion
Higher net interest income and revenue momentum across many fee categories offset by higher
provision for mortgage repurchase losses and lower market-sensitive revenues
-
Period end loans up $8.7 billion from 1Q12
Expenses down $596 million from 1Q12 on lower personnel expense
-
2Q12 efficiency ratio within our target range of 55% to 59%; expect to operate within this
range over remainder of 2012
(1)
Higher PTPP
(2)
of $8.9 billion
Improved credit quality
Solid returns
-
ROA = 1.41%; highest in 16 quarters
-
ROE = 12.86%
Capital levels remained strong
(1) Noninterest expense and our efficiency ratio may be affected by a variety of
factors, including business and economic cyclicality, seasonality, changes in our
business composition and operating environment, growth in our business and/or acquisitions, and unexpected expenses relating to, among other
(2) Pre-tax pre-provision profit (PTPP) is total revenue less noninterest
expense. Management believes that PTPP is a useful financial measure because it
enables investors and others to assess the Company’s ability to generate capital to cover
credit losses through a credit cycle.
things, litigation and regulatory matters. |
 Wells Fargo
2Q12 Supplement 22
Appendix |
 Wells Fargo
2Q12 Supplement 23
Recent acquisitions and divestitures
Acquired from / Divestiture of
Date
2012
Pending
Merlin Securities, LLC
Complete
WestLB (Subscription finance portfolio)
2Q12
BNP Paribas North American Energy Lending
2Q12
Burdale Financial Holdings Limited
1Q12
EverKey Global Partners
1Q12
2011
Loan portfolio purchases
Irish Bank Resolution Corp.
4Q11
Bank of Ireland
3Q11
Allied Irish
2Q11
Acquisitions
LaCrosse Holdings, LLC
4Q11
CP Equity, LLC (remaining equity interest)
3Q11
Foreign Currency Exchange Corp. (certain assets)
3Q11
Insurance brokerage firms
7 transactions
2Q11-3Q11
Divestitures
H.D. Vest Financial Services
4Q11
Wells Fargo Third Party Administrator, Inc.
4Q11
WFF Canadian, Guam and Saipan receivables
4Q11
American E&S
2Q11 |
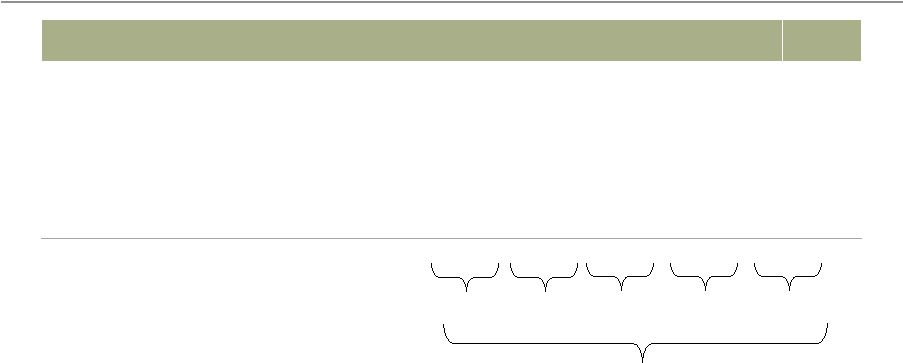 Wells Fargo
2Q12 Supplement 24
(1) Net of purchase accounting adjustments.
-$69.0
Non-strategic/liquidating loan portfolio risk reduction
-$5.3
-$87.7
-$4.2
-$4.1
-$5.1
($ in billions)
2Q12
1Q12
4Q11
3Q11
2Q11
4Q08
Pick-a-Pay mortgage
(1)
$
62.0
64.0
65.7
67.4
69.6
95.3
Liquidating home equity
5.2
5.5
5.7
6.0
6.3
10.3
Legacy WFF indirect auto
1.5
1.9
2.5
3.1
3.9
18.2
Legacy WFF debt consolidation
15.5
16.0
16.5
17.2
17.7
25.3
Education Finance - gov't guaranteed
13.8
14.8
15.4
15.6
16.3
20.5
Legacy WB C&I, CRE and foreign PCI loans
(1)
4.3
5.2
5.7
6.3
7.0
18.7
Legacy WB other PCI loans
(1)
0.8
0.8
0.8
0.9
1.0
2.5
Total
$
103.1
108.2
112.3
116.5
121.8
190.8
|
 Wells Fargo
2Q12 Supplement 25
Purchased credit-impaired (PCI) portfolios
Legacy Wachovia PCI loans continued to perform better than originally expected
(1) Includes write-downs taken on loans where severe delinquency (normally
180 days) or other indications of severe borrower financial stress exist that
indicate there will be a loss of contractually due amounts upon final resolution of the
loan. (2) Reflects releases of $1.8 billion for loan resolutions and $4.5 billion from the
reclassification of nonaccretable difference to the accretable yield, which will
result in increasing income over the remaining life of the loan or pool of loans.
($ in billions)
Adjusted
unpaid
principal
balance
(1)
December 31, 2008
$
29.2
62.5
6.5
98.2
March 31, 2012
7.8
35.8
1.8
45.4
June 30, 2012
6.6
34.6
1.7
42.9
Nonaccretable
difference
rollforward
12/31/08 Nonaccretable difference
$
10.4
26.5
4.0
40.9
Addition of nonaccretable difference due to acquisitions
0.2
-
-
0.2
Losses from loan resolutions and write-downs
(6.8)
(16.0)
(2.8)
(25.6)
Release of nonaccretable difference since merger
(3.1)
(2.4)
(0.8)
(6.3)
(2)
6/30/12 Remaining nonaccretable difference
0.7
8.1
0.4
9.2
Life-to-date
net
performance
Additional provision since 2008 merger
$
(1.7)
-
(0.1)
(1.8)
Release of nonaccretable difference since 2008 merger
3.1
2.4
0.8
6.3
(2)
Net performance
1.4
2.4
0.7
4.5
Commercial
Pick-a-Pay
Other
consumer
Total |
 Wells Fargo
2Q12 Supplement 26
2Q12 results included accretion into interest income of $630 million, up from 1Q12 reflecting
higher settlements with borrowers
Balance of $15.2 billion expected to accrete to income over the remaining life of the
underlying loans PCI accretable yield
(1) Includes accretable yield released as a result of settlements with borrowers, which
is included in interest income. (2) Includes accretable yield released as a
result of sales to third parties, which is included in noninterest income. (3)
Represents changes in cash flows expected to be collected due to changes in interest rates on variable rate PCI loans, changes in prepayment assumptions
and the impact of modifications.
Cumulative
Accretable yield rollforward
since
($ in millions)
2Q12
1Q12
merger
Total, beginning of period
$
15,763
15,961
10,447
Addition of accretable yield due to acquisitions
-
-
128
Accretion into interest income
(1)
(630)
(514)
(8,343)
Accretion
into
noninterest
income
due
to
sales
(2)
(5)
-
(242)
Reclassification from nonaccretable difference for loans with improving cash flows
84
235
4,532
Changes
in
expected
cash
flows
that
do
not
affect
nonaccretable
difference
(3)
(59)
81
8,631
Total, end of period
$
15,153
15,763
15,153 |
 Wells Fargo
2Q12 Supplement 27
PCI accretable yield (Commercial
(1)
and Pick-a-Pay)
Commercial accretion
(2)
increased
$113 million and accretable yield
percentage rose to 22.95% reflecting
higher settlements with borrowers in
2Q12
Pick-a-Pay weighted average life
increased to 11.4 years on the
extension of liquidation timing
Pick-a-Pay PCI Accretable Yield
($ in millions)
2Q12
1Q12
4Q11
PCI interest income
Accretion
$
303
311
326
Average carrying value
28,041
28,734
29,331
Accretable yield percentage
4.32
%
4.32
4.45
Accretable yield balance
$
13,466
13,709
14,018
Weighted average life (years)
11.4
11.0
11.0
Commercial
(1)
PCI Accretable Yield
($ in millions)
2Q12
1Q12
4Q11
PCI interest income
Accretion
and resolution income
$
323
210
242
Average carrying value
5,629
6,638
6,812
Accretable yield percentage
(2)
22.95
%
12.61
14.20
Accretable yield balance
$
1,008
1,347
1,363
Weighted average life (years)
2.2
2.8
3.2
(1) Includes both legacy Wachovia PCI loans as well as recently purchased PCI
loans.
(2) Includes resolution income. |
 Wells Fargo
2Q12 Supplement 28
2Q12 Credit quality highlights
Net charge-offs of $2.2 billion down $195 million LQ
-
Commercial losses down $28 million driven by
lower CRE construction and C&I losses
-
Consumer losses down $167 million on declines
across all asset classes
Total NPAs of $24.9 billion down $1.8 billion
-
Nonaccrual loans down $1.4 billion with declines in
both commercial and consumer nonaccruals
-
Foreclosed assets down $310 million
•
60% of the balance are government guaranteed
loans and loans written down through purchase
accounting
$1.5 billion, or 34%, are government
guaranteed
$1.1 billion, or 25%, reflects shift from
PCI loans to REO ($321 million consumer
and $777 million C&I and CRE)
Currently expect future reserve releases in 2012
absent significant deterioration in the economy
Total
($ in millions)
Wells Fargo
Commercial loans
5,285
348,767
354,052
Consumer loans
28,521
392,626
421,147
Total period-end loans
33,806
741,393
775,199
Total nonaccrual loans
$
20,578
Total foreclosed assets
4,307
Total NPAs
$
24,885
as % of loans
3.21
%
Provision for credit losses
$
1,800
Net charge-offs
2,200
as % of avg loans
1.15
%
Commercial
0.42
Consumer
1.76
%
Allowance for credit losses
18,313 $
18,646
as % of loans
2.47
2.41
%
as % of nonaccrual loans
91
%
2Q12
PCI loans
Non PCI
loans |
  Wells Fargo 2Q12
Supplement 29
Pick-a-Pay mortgage portfolio
Carrying value
of
$62.0
billion
in
first
lien
loans
outstanding,
down
$1.9
billion
from
1Q12
and
down
$33.3 billion from 4Q08 on paid-in-full loans and loss mitigation efforts
-
Adjusted unpaid principal balance of $68.9 billion, down $2.4 billion from 1Q12 and down $46.8
billion from 4Q08
-
$4.3 billion in modification principal forgiveness since acquisition reflects over 105,000
completed full-term modifications; additional $548 million of conditional
forgiveness that can be earned by borrowers through performance over the next 3 years
-
Modification redefault rate has been consistently better than the industry average (as
measured by 60+ DPD after six months)
($ in millions)
Product type
Adjusted
unpaid
principal
% of total
Adjusted
unpaid
principal
% of total
Adjusted
unpaid
principal
% of total
Option payment loans
(1)
$
35,353
51
%
37,251
52
%
$
99,937
86
%
Non-option payment adjustable-rate and
fixed-rate loans
(1)
9,315
14
9,673
14
15,763
14
Full-term loan modifications
(1)
24,184
35
24,284
34
-
-
Total adjusted unpaid principal balance
(1)
$
68,852
100
%
71,208
100
%
$
115,700
100
%
Total carrying value
62,045
63,983
95,315
At 6/30/2012
At 3/31/2012
At 12/31/2008
(1)
Adjusted unpaid principal includes write-downs taken on loans where severe delinquency
(normally 180 days) or other indications of severe borrower financial stress exist that indicate there will be a loss of contractually due amounts
upon final resolution of the loan. $
$ |
 Wells Fargo
2Q12 Supplement 30
Pick-a-Pay credit highlights
Non-PCI portfolio
Loans down 3% driven by loans paid-in-full
85% of portfolio current
Nonaccrual loans declined 3% from 1Q12
-
$117 million of nonaccrual TDRs reclassified to
accruing TDR status based on borrower payment
performance
$3.8 billion in nonaccruals includes $1.1 billion
of nonaccruing TDRs
Net charge-offs of $203 million in 2Q12,
consistent with expectations
43% of portfolio with LTV
(2)
80%
PCI portfolio
Carrying value down 3%
68% of portfolio current
Life-of-loan losses continued to be lower than
originally projected at time of merger
(1)
The carrying value, which does not reflect the allowance for loan losses, includes purchase
accounting adjustments, which, for PCI loans, are the nonaccretable difference and the
accretable yield, and for all other loans, an adjustment to mark the loans to a market yield at date of merger less any
subsequent charge-offs.
(2) The current loan-to-value (LTV) ratio is calculated as the net carrying
value (defined in (1) above) divided by the collateral value. (3) The adjusted unpaid principal balance includes write-downs taken on loans where
severe delinquency (normally 180 days) or other indications of severe borrower
financial stress exist that indicate there will be a loss of contractually due amounts upon final resolution of the loan.
($ in millions)
2Q12
1Q12
Non-PCI loans
Carrying value
(1)
$
34,342
35,563
Nonaccrual loans
3,808
3,918
as a % of loans
11.09
%
11.02
Net charge-offs
$
203
200
as % of avg loans
2.35
%
2.21
90+ days past due
as % of loans
10.16
10.27
Current average LTV
(2)
85
%
86
Current average FICO
682
681
Contractual average loan size
$
206,000
208,000
Contractual average age of loans
8.29
years
8.04
% of loans in California
49
%
49
($ in millions)
PCI loans
Adjusted unpaid principal balance
(3)
$
34,644
35,785
Carrying value
(1)
27,703
28,420
Current average LTV
(2)
89
%
90
Current average FICO
615
612
Contractual average loan size
$
307,000
310,000
Contractual average age of loans
6.25
years
6.00
% of loans in California
68
%
68 |
 Wells Fargo
2Q12 Supplement 31
Real estate 1-4 family first mortgage portfolio
First lien mortgage loans up 1% as growth in core
first lien mortgage was partially offset by
continued run-off in the liquidating portfolio
-
Pick-a-Pay non-PCI portfolio down 3%
-
PCI portfolio down 3%
-
Debt consolidation first lien down 3%
-
Core first lien up $3.8 billion, or 3%, reflecting
strong origination volumes
Core first lien mortgage nonaccruals down $80
million, or 12 bps
Core net charge-offs down $47 million
(1) Ratios
on
Legacy
WFF
debt
consolidation
first
mortgage
loan
portfolio
only.
(2) Ratios on non run-off first lien mortgage loan portfolio only.
($ in millions)
2Q12
1Q12
Total real estate 1-4 family first mortgage
$
230,263
228,885
Less consumer non-strategic/liquidating portfolios:
Pick-a-Pay non-PCI first lien mortgage
34,342
35,563
PCI first lien mortgage
28,331
29,082
Debt consolidation first mortgage portfolio
15,129
15,610
Core first lien mortgage
152,461
148,630
Nonaccrual loans
$
2,158
2,284
as % of loans
14.26
%
14.63
Net charge-offs
$
191
195
as % of average loans
4.97
%
4.91
Nonaccrual loans
$
4,402
4,481
as % of loans
2.89
%
3.01
Net charge-offs
$
349
396
as % of loans
0.92
%
1.07
Legacy
WFF
debt
consolidation
first
mortgage
loan
performance
(1)
Core
first
lien
mortgage
loan
performance
(2) |
 Wells Fargo
2Q12 Supplement 32
Home equity portfolio
Core Portfolio
(1)
Outstandings down
2%
-
High quality new originations with weighted
average CLTV of 62%, 778 FICO, and 32% total
debt service ratio
2Q12 losses decreased $94 million, or 31 bps
2+ delinquencies decreased $168 million
Continued decline in delinquency rate for loans
with a CLTV >100%, 6 bps improvement
Liquidating Portfolio
Outstandings down 5%
2Q12 losses down $5 million
2+ delinquencies declined $23 million
Continued decline in delinquency rate for loans
with a CLTV >100%, 23 bps improvement
($ in millions)
2Q12
1Q12
Core Portfolio
(1)
Outstandings
$
95,753
98,009
Net charge-offs
627
721
as % of avg loans
2.60
%
2.91
2+ payments past due
$
2,686
2,854
as % loans
2.81
%
2.92
% CLTV > 100%
(2)
36
37
2+ payments past due
3.93
3.99
% Unsecured balances
(3)
16
18
% 1st lien position
21
21
Liquidating Portfolio
Outstandings
$
5,199
5,456
Net charge-offs
108
113
as % of avg loans
8.14
%
8.11
2+ payments past due
$
218
241
as % loans
4.19
%
4.41
% CLTV > 100%
(2)
73
74
2+ payments past due
4.46
4.69
% 1st lien position
4
4
Excludes purchased credit-impaired loans. (1)
Includes equity lines of credit and closed-end junior liens associated with the Pick-a-Pay portfolio totaling $1.4 billion at June 30, 2012 and $1.5 billion at
March 31, 2012.
(2) CLTV is calculated based on outstanding balance plus unused lines of credit divided
by estimated home value. Estimated home values are determined predominantly based on
automated valuation models updated through June 2012.
(3) Unsecured balances, representing the percentage of outstanding balances above the
most recent home value. |
 Wells Fargo
2Q12 Supplement 33
$101 billion home equity portfolio
-
20% in 1 lien position
-
40%
in
junior
lien
position
behind
WFC
owned
or
serviced
1
st
lien
-
40%
in
junior
lien
position
behind
third
party
1
st
lien
Excludes purchased credit-impaired loans.
(1) Delinquency represents two or more payments past due as of May 2012.
Home equity portfolio
Delinquency Status
(1)
of
Junior
Liens
Behind
a
Wells
Fargo
1
st
Lien
Delinquency Status
Current
1
st
lien, Current junior lien
95.8
%
Current 1
st
lien, Delinquent junior lien
0.9
Delinquent
1
st
lien, Current junior lien
1.5
Delinquent 1
st
lien, Delinquent junior lien
1.8
Outstanding Balance %
st |
 Wells Fargo
2Q12 Supplement 34
Credit card portfolio
$22.7 billion credit card outstandings up 3% from
1Q12 and 7% YoY on strong account growth
–
Consumer credit card new accounts in 2Q12
increased 5% LQ with household penetration
increasing to 31.0%
(1)
–
Purchase dollar volume increased 14% and
transactions rose 13% from 1Q12
–
Purchase dollar volume increased 15% and
transactions rose 18% from 2Q11
Net charge-offs down $2 million, or 3 bps, LQ and
down $54 million, or 126 bps, YoY reflecting
continued steady improvement
(1) Household penetration as of May 2012 and defined as the percentage of retail banking
deposit households that have a credit card with Wells Fargo. ($ in millions)
2Q12
1Q12
Credit card outstandings
$
22,706
21,998
Net charge-offs
240
242
as % of avg loans
4.37
%
4.40 |
 Wells Fargo
2Q12 Supplement 35
Auto portfolios
(1)
Core Consumer Portfolio
Core auto outstandings of $44.8 billion up 3% LQ
and 9% YoY
-
Record originations were up 6% LQ and 18% YoY
reflecting growth across the credit spectrum
Net charge-offs were down $31 million LQ on
higher recoveries
-
June Manheim index of 123.4, down 2% LQ and
down 3% from June 2011
30+ days past due increased $65 million LQ
reflecting seasonality
Commercial Portfolio
Loans of $6.7 billion increased on higher demand
in floor plan lending
Continued strong credit performance
(1)
Legacy Wells Fargo Financial indirect portfolio balance as of June 30, 2012, was $1,454
million. (2)
1Q12 Commercial outstandings have been revised to conform with 2Q12 presentations.
($ in millions)
2Q12
1Q12
Direct
Auto outstandings
$
2,387
2,380
Nonaccrual loans
46
56
as % of loans
1.92
%
2.35
Net charge-offs
$
0
7
as % of avg loans
n.m.
%
1.09
30+ days past due
$
26
31
as % of loans
1.09
%
1.31
Indirect
Auto outstandings
$
42,411
40,908
Nonaccrual loans
68
9
as % of loans
0.16
%
0.02
Net charge-offs
$
30
54
as % of avg loans
0.29
%
0.57
30+ days past due
$
517
447
as % of loans
1.22
%
1.09
Auto outstandings
(2)
$
6,652
6,268
Nonaccrual loans
-
-
as % of loans
-
%
-
Net charge-offs (recoveries)
$
-
(3)
as % of avg loans
n.m.
%
n.m.
Commercial Portfolio
Core Consumer Portfolios |
 Wells Fargo
2Q12 Supplement 36
Student lending portfolio
$24.1 billion student lending outstandings down
4% LQ
Private Portfolio
$10.3 billion private loans outstandings flat with
1Q12 and up 10% YoY
-
Applications increased 50% LQ as peak season
approaches
-
Dollar originations decreased 70% LQ due to
seasonality
-
Continued to originate high quality loans with an
average FICO of 751 and 79% of new loans co-
signed
Net charge-offs up $4 million LQ due to
seasonality of repayments on loans but down $8
million YoY
Government Portfolio
$13.8 billion liquidating government guaranteed
outstandings declined 7% LQ and 15% YoY
($ in millions)
2Q12
1Q12
Education Finance
Total outstandings
$
24,131
25,102
Private Portfolio
Private outstandings
$
10,308
10,302
Net charge-offs
26
22
as % of avg loans
1.01
%
0.88
30 days past due
$
181
197
as % of loans
1.76
%
1.91
Government Guaranteed Portfolio
Government outstandings
$
13,823
14,800 |
 Wells Fargo
2Q12 Supplement 37
Tier 1 common equity under Basel I
(1)
Quarter ended
June 30,
Mar. 31,
Dec. 31,
Sept. 30,
June 30,
2012
2012
2011
2011
2011
$
149.4
146.8
141.7
139.2
137.9
(1.3)
(1.3)
(1.5)
(1.5)
(1.5)
148.1
145.5
140.2
137.7
136.4
(10.6)
(10.6)
(10.6)
(10.6)
(10.6)
(33.5)
(33.7)
(34.0)
(34.4)
(34.6)
3.5
3.7
3.8
4.0
4.1
(0.7)
(0.9)
(0.8)
(0.7)
(0.9)
(4.6)
(4.1)
(3.1)
(3.7)
(5.3)
(0.5)
(0.4)
(0.4)
(0.4)
(0.3)
(A)
$
101.7
99.5
95.1
91.9
88.8
(B)
$
1,009.1
996.8
1,005.6
983.2
970.2
(A)/(B)
10.08
%
9.98
9.46
9.34
9.15
(1)
(2)
Total risk-weighted assets
(2)
Tier 1 common equity to total risk-weighted assets
Cumulative other comprehensive income
Other
Tier 1 common equity
MSRs over specified limitations
Wells Fargo & Company and Subsidiaries
($ in billions)
Total equity
Noncontrolling interests
Total Wells Fargo stockholders' equity
Adjustments:
FIVE
QUARTER
TIER
1
COMMON
EQUITY
UNDER
BASEL
I
(1)
Preferred equity
Goodwill and intangible assets (other than MSRs)
Applicable deferred taxes
Tier 1 common equity is a non-generally accepted accounting
principle (GAAP) financial measure that is used by investors, analysts and bank regulatory agencies to assess the capital position of
financial services companies. Management reviews Tier 1 common equity
along with other measures of capital as part of its financial analyses and has included this non-GAAP financial
information, and the corresponding reconciliation to total equity,
because of current interest in such information on the part of market participants.
Under the regulatory guidelines for risk-based capital,
on-balance sheet assets and credit equivalent amounts of derivatives and off-balance sheet items are assigned to one of several broad risk
categories according to the obligor or, if relevant, the guarantor or
the nature of any collateral. The aggregate dollar amount in each risk category is then multiplied by the risk weight associated
with that category. The resulting weighted values from each of the risk
categories are aggregated for determining total risk-weighted assets. The Company's June 30, 2012, preliminary risk-
weighted assets reflect estimated on-balance sheet
risk-weighted assets of $841.0 billion and derivative and off-balance sheet risk-weighted assets of $168.1 billion. |
 Wells Fargo
2Q12 Supplement 38
Tier 1 common equity under Basel III (Estimated)
(1)
Quarter ended
June 30,
2012
$
101.7
4.2
Other
0.3
Total Adjustments from Basel I to Basel III
4.5
Threshold deductions, as defined under Basel III
(4) (5)
(0.7)
Tier 1 common equity anticipated under Basel III
(C)
105.5
(D)
$
1,355.4
(C)/(D)
7.78
%
(1)
(2)
(3)
(4)
(5)
(6)
Threshold
deductions,
as
defined
under
Basel
III,
include
individual
and
aggregate
limitations,
as
a
percentage
of
Tier
1
common
equity,
with
respect
to
MSRs,
deferred
tax
assets
and
investments
in
unconsolidated
financial
companies.
($ in billions)
Tier 1 common equity under Basel I
Adjustments from Basel I to Basel III
(3)(5)
Cumulative other comprehensive income related to AFS securities
and defined benefit pension plans
Total risk-weighted assets anticipated under Basel III
(6)
The Basel
III
Tier
1
common
equity
and
risk-weighted
assets
are
calculated
based
on
management’s
current
interpretation
of
the
Basel
III
capital
rules
proposed
by
federal
banking
agencies
in
notices
of
proposed
rulemaking
announced
in
June
2012.
The
proposed
rules
and
interpretations
and
assumptions
used
in
estimating
Basel
III
calculations
are
subject
to
change
depending
on
final
promulgations
of Basel III capital rules.
Adjustments
from
Basel
I
to
Basel
III
represent
reconciling
adjustments,
primarily
certain
components
of
cumulative
other
comprehensive
income
deducted
for
Basel
I
purposes,
to
derive
Tier
1
common
equity
under
Basel
III.
Under
current
Basel
proposals,
risk-weighted
assets
incorporate
different
classifications
of
assets,
with
certain
risk
weights
based
on
a
borrower's
credit
rating
or
Wells
Fargo's
own
risk
models,
along
with
adjustments
to
address
a
combination
of
credit/counterparty,
operational
and
market
risks,
and
other
Basel
III
elements.
The
amount
of
risk-weighted
assets
anticipated
under
Basel
III
is
preliminary
and
subject
to
change
depending
on
final
promulgation
of
Basel
III
capital
rulemaking
and
interpretations
thereof
by
regulatory
authorities.
Volatility
in
interest
rates
can
have
a
significant
impact
on
the
valuation
of
cumulative
other
comprehensive
income
and
MSRs
and
therefore,
may
impact
adjustments
from
Basel
I
to
Basel
III,
and
MSRs
subject
to
threshold
deductions,
as
defined
under
Basel
III,
in
future reporting periods.
Tier
1
common
equity
is
a
non-generally
accepted
accounting
principle
(GAAP)
financial
measure
that
is
used
by
investors,
analysts
and
bank
regulatory
agencies
to
assess
the
capital
position
of
financial
services
companies.
Management
reviews
Tier
1
common
equity
along with
other
measures
of
capital
as
part
of
its
financial
analyses
and
has
included
this
non-GAAP
financial
information,
and
the
corresponding
reconciliation
to
total
equity,
because
of
current
interest
in
such
information
on
the
part
of
market
participants.
Wells Fargo & Company and Subsidiaries
TIER
1
COMMON
EQUITY
UNDER
BASEL
III
(ESTIMATED)
(1)(2)
Tier 1 common equity to total risk-weighted assets anticipated under Basel III
: |
| Wells Fargo
2Q12 Supplement 39
Forward-looking statements and additional information
Forward-looking statements:
This Quarterly Supplement and management’s related presentation contain
forward-looking statements about our future financial performance.
These
forward-looking
statements
include
statements
using
words
such
as
“believe,”
“expect,”
“anticipate,”
“estimate,”
“target”, “should,”
“may,”
“can,”
“will,”
“outlook,”
“appears”
or similar expressions. These forward-looking statements may include,
among others, statements about: future credit quality and performance, including our current
expectation of future loan loss reserve releases; mortgage repurchase exposure;
exposure related to mortgage practices, including foreclosures and servicing; our
noninterest
expense
and
efficiency
ratio,
including
our
targeted
efficiency
ratio
range
as
part
of
our
expense
management
initiatives;
the future economic environment; loan growth; our net interest margin; reduction or mitigation
of risk in our loan portfolios; future effects of loan modification programs;
life-of-loan loss estimates; the estimated impact of regulatory reform on our financial results
and business and expectations regarding our efforts to mitigate such impact; and our estimated
Tier 1 common equity ratio as of June
30,
2012,
under
proposed
Basel
III
capital
rules.
Investors
are
urged
to
not
unduly
rely
on
forward-looking
statements
as
actual
results could differ materially from expectations. Forward-looking statements speak only
as of the date made, and we do not undertake
to
update
them
to
reflect
changes
or
events
that
occur
after
that
date.
For
more
information
about
factors
that
could
cause actual results to differ materially from expectations, refer to page 13 of Wells
Fargo’s press release announcing our second quarter 2012 results, as well as Wells
Fargo’s reports filed with the Securities and Exchange Commission, including the discussion
under “Risk Factors”
in our Annual Report on Form 10-K for the year ended December 31, 2011.
Purchased credit-impaired loan portfolio:
Loans that were acquired from Wachovia that were considered credit impaired were written down
at acquisition date in purchase accounting to an amount estimated to be collectible and
the related allowance for loan losses was not carried over to Wells Fargo’s
allowance. In addition, such purchased credit-impaired loans are not classified as
nonaccrual or nonperforming, and are not included in loans that were contractually 90+
days past due and still accruing. Any losses on such loans are charged against the nonaccretable
difference established in purchase accounting and are not reported as charge-offs (until
such difference is fully utilized). As a result of accounting for purchased loans with
evidence of credit deterioration, certain ratios of the combined company are not comparable to a
portfolio that does not include purchased credit-impaired loans.
In certain cases, the purchased credit-impaired loans may affect portfolio credit ratios
and trends. Management believes that the presentation of information adjusted to
exclude the purchased credit-impaired loans provides useful disclosure regarding the credit
quality of the non-impaired loan portfolio. Accordingly, certain of the loan balances and
credit ratios in this Quarterly Supplement have been adjusted to exclude the purchased
credit-impaired loans. References in this Quarterly Supplement to impaired loans mean
the
purchased
credit-impaired
loans.
Please
see
pages
31-33
of
the
press
release
for
additional
information
regarding
the
purchased
credit-impaired loans. |