Attached files
| file | filename |
|---|---|
| 8-K - CURRENT REPORT ON FORM 8-K - Simulations Plus, Inc. | simulations_8k-071212.htm |
Exhibit 99.1
Simulations Plus, Inc. (NASDAQ:SLP) Third Quarter FY 2012 Conference Call and Webinar July 12, 2012
With the exception of historical information, the matters discussed in this presentation are forward looking statements that involve a number of risks and uncertainties. The actual results of the Company could differ significantly from those statements. Factors that could cause or contribute to such differences include, but are not limited to: continuing demand for the Company’s products, competitive factors, the Company’s ability to finance future growth, the Company’s ability to produce and market new products in a timely fashion, the Company’s ability to continue to attract and retain skilled personnel, and the Company’s ability to sustain or improve current levels of productivity. Further information on the Company’s risk factors is contained in the Company’s quarterly and annual reports and filed with the Securities and Exchange Commission. Safe Harbor Statement
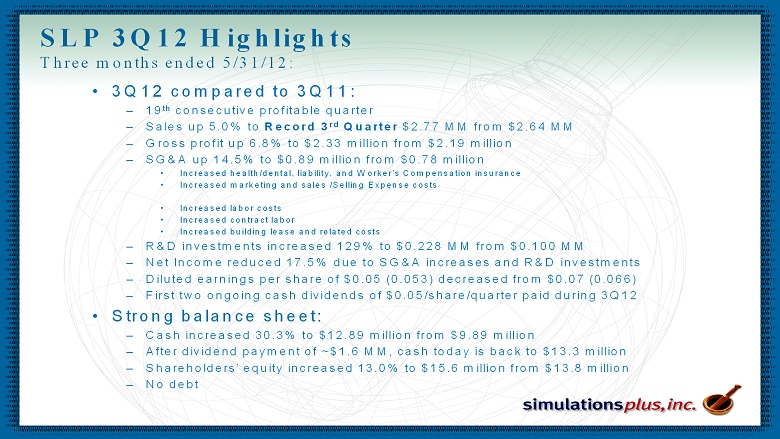
• 3Q12 compared to 3Q11: – 19 th consecutive profitable quarter – Sales up 5.0% to Record 3 rd Quarter$2.77 MM from $2.64 MM – Gross profit up 6.8% to $2.33 million from $2.19 million – SG&A up 14.5% to $0.89 million from $0.78 million • Increased health/dental, liability, and Worker’s Compensation insurance • Increased marketing and sales /Selling Expense costs • Increased labor costs • Increased contract labor • Increased building lease and related costs – R&D investments increased 129% to $0.228 MM from $0.100 MM – Net Income reduced 17.5% due to SG&A increases and R&D investments – Diluted earnings per share of $0.05 (0.053) decreased from $0.07 (0.066) – First two ongoing cash dividends of $0.05/share/quarter paid during 3Q12 • Strong balance sheet: – Cash increased 30.3% to $12.89 million from $9.89 million – After dividend payment of ~$1.6 MM, cash today is back to $13.3 million – Shareholders’ equity increased 13.0% to $15.6 million from $13.8 million – No debt SLP 3Q12 Highlights Three months ended 5/31/12:
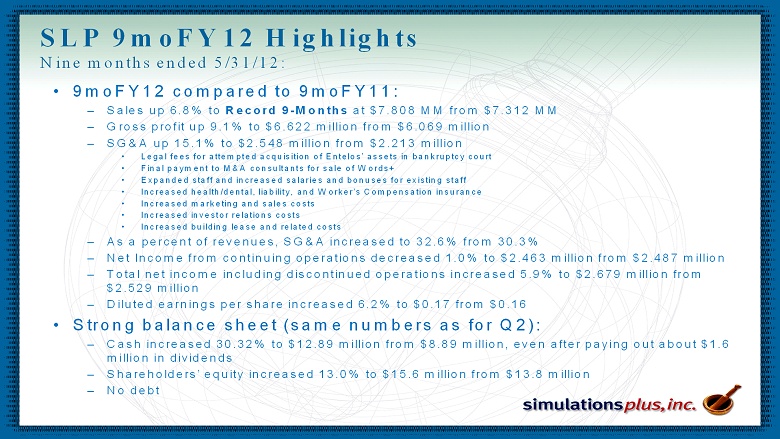
• 9moFY12 compared to 9moFY11: – Sales up 6.8% to Record 9-Monthsat $7.808 MM from $7.312 MM – Gross profit up 9.1% to $6.622 million from $6.069 million – SG&A up 15.1% to $2.548 million from $2.213 million • Legal fees for attempted acquisition of Entelos’ assets in bankruptcy court • Final payment to M&A consultants for sale of Words+ • Expanded staff and increased salaries and bonuses for existing staff • Increased health/dental, liability, and Worker’s Compensation insurance • Increased marketing and sales costs • Increased investor relations costs • Increased building lease and related costs – As a percent of revenues, SG&A increased to 32.6% from 30.3% – Net Income from continuing operations decreased 1.0% to $2.463 million from $2.487 million – Total net income including discontinued operations increased 5.9% to $2.679 million from $2.529 million – Diluted earnings per share increased 6.2% to $0.17 from $0.16 • Strong balance sheet (same numbers as for Q2): – Cash increased 30.32% to $12.89 million from $8.89 million, even after paying out about $1.6 million in dividends – Shareholders’ equity increased 13.0% to $15.6 million from $13.8 million – No debt SLP 9moFY12 Highlights Nine months ended 5/31/12:
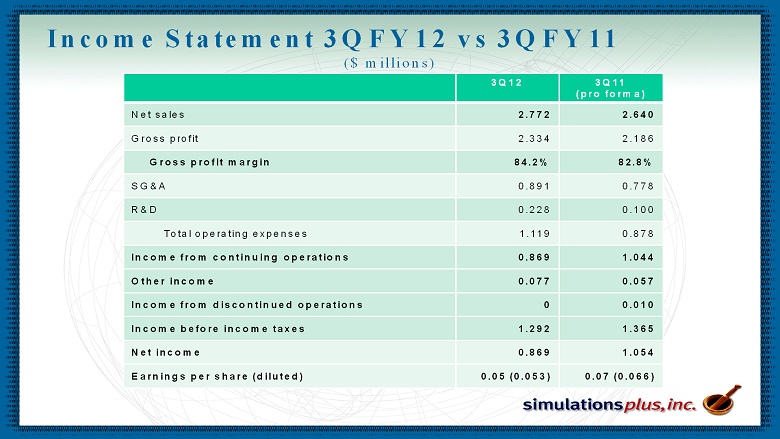
Income Statement 3QFY12 vs3QFY11 ($ millions) 3Q12 3Q11 (pro forma) Net sales 2.772 2.640 Gross profit 2.334 2.186 Gross profit margin 84.2% 82.8% SG&A 0.891 0.778 R&D 0.228 0.100 Total operating expenses 1.119 0.878 Income from continuing operations 0.869 1.044 Other income 0.077 0.057 Income from discontinued operations 0 0.010 Income before income taxes 1.292 1.365 Net income 0.869 1.054 Earnings per share (diluted) 0.05 (0.053) 0.07 (0.066)
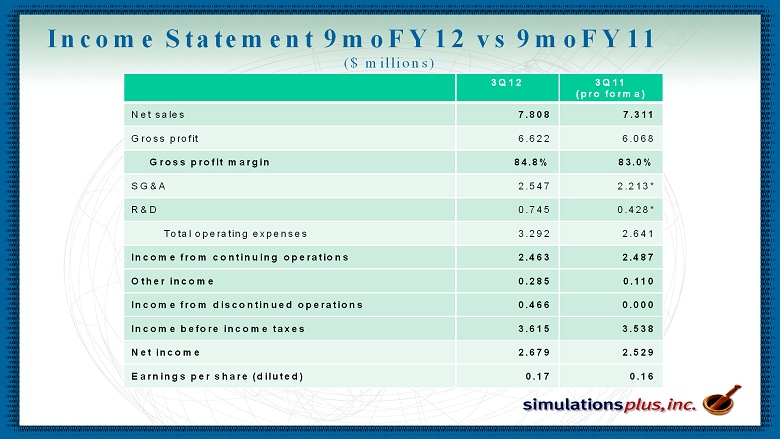
Income Statement 9moFY12 vs9moFY11 ($ millions) 3Q12 3Q11 (pro forma) Net sales 7.808 7.311 Gross profit 6.622 6.068 Gross profit margin 84.8% 83.0% SG&A 2.547 2.213* R&D 0.745 0.428* Total operating expenses 3.292 2.641 Income from continuing operations 2.463 2.487 Other income 0.285 0.110 Income from discontinued operations 0.466 0.000 Income before income taxes 3.615 3.538 Net income 2.679 2.529 Earnings per share (diluted) 0.17 0.16
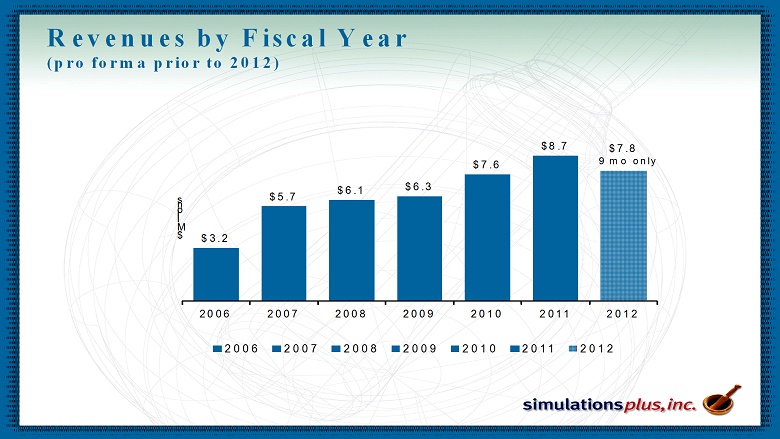
$3.2 $5.7 $6.1 $6.3 $7.6 $8.7 $7.8 2006 2007 2008 2009 2010 2011 2012 $ M i l l i o n s 2006 2007 2008 2009 2010 2011 2012 9 mo only Revenues by Fiscal Year (pro forma prior to 2012)
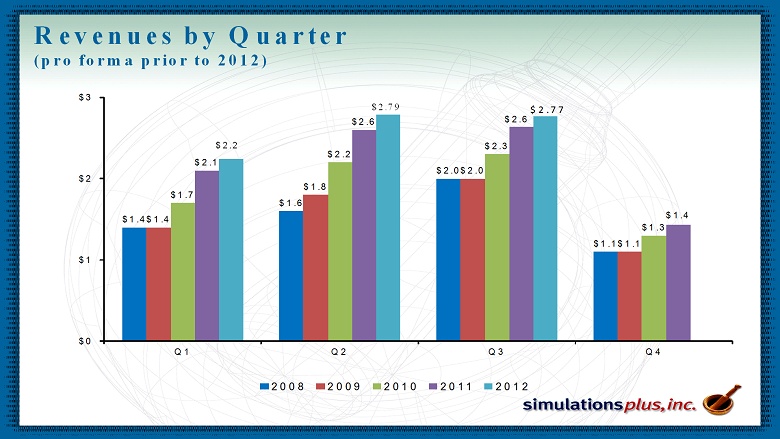
Revenues by Quarter (pro forma prior to 2012) $1.4 $1.6 $2.0 $1.1 $1.4 $1.8 $2.0 $1.1 $1.7 $2.2 $2.3 $1.3 $2.1 $2.6 $2.6 $1.4 $0 $1 $2 $3 Q1 Q2 Q3 Q4 2008 2009 2010 2011 2012 $2.77 $2.2 $2.79
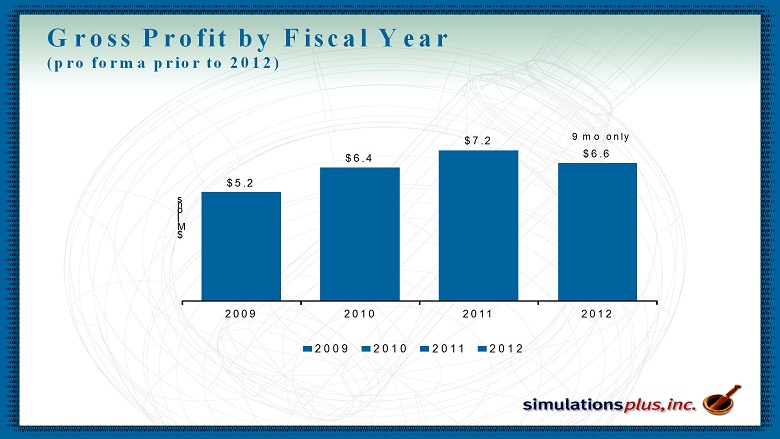
$5.2 $6.4 $7.2 $6.6 2009 2010 2011 2012 $ M i l l i o n s 2009 2010 2011 2012 9 mo only Gross Profit by Fiscal Year (pro forma prior to 2012)
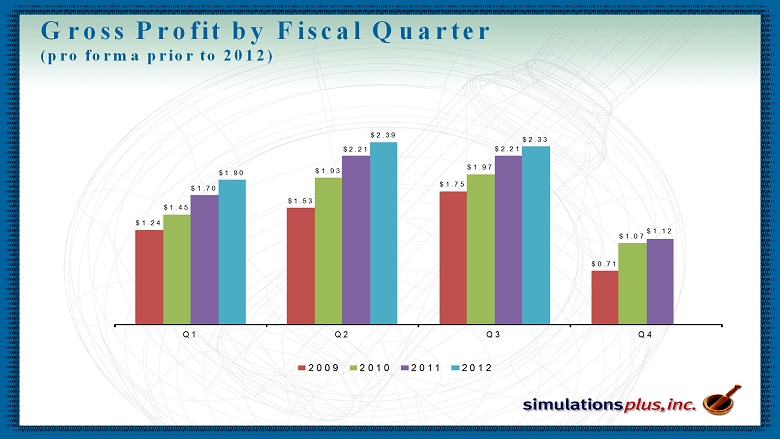
Gross Profit by Fiscal Quarter (pro forma prior to 2012) $1.24 $1.53 $1.75 $0.71 $1.45 $1.93 $1.97 $1.07 $1.70 $2.21 $2.21 $1.12 $1.90 $2.39 $2.33 Q1 Q2 Q3 Q4 2009 2010 2011 2012
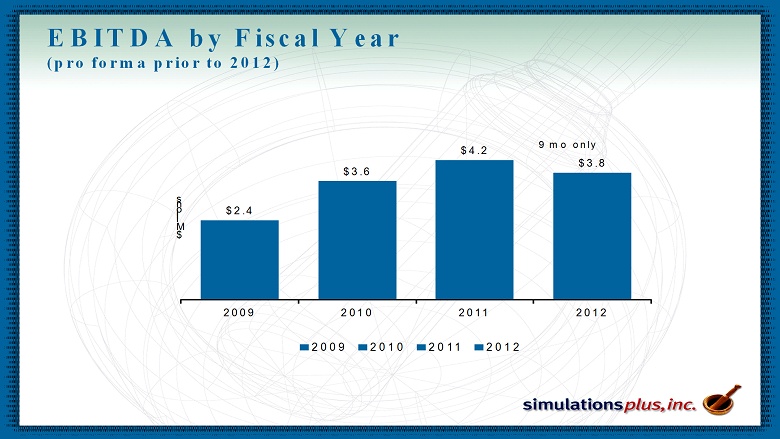
$2.4 $3.6 $4.2 $3.8 2009 2010 2011 2012 $ M i l l i o n s 2009 2010 2011 2012 9 mo only EBITDA by Fiscal Year (pro forma prior to 2012)
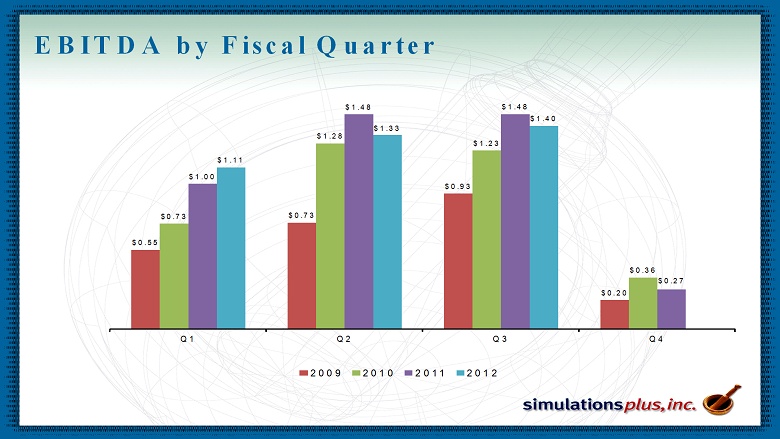
EBITDA by FiscalQuarter $0.55 $0.73 $0.93 $0.20 $0.73 $1.28 $1.23 $0.36 $1.00 $1.48 $1.48 $0.27 $1.11 $1.33 $1.40 Q1 Q2 Q3 Q4 2009 2010 2011 2012
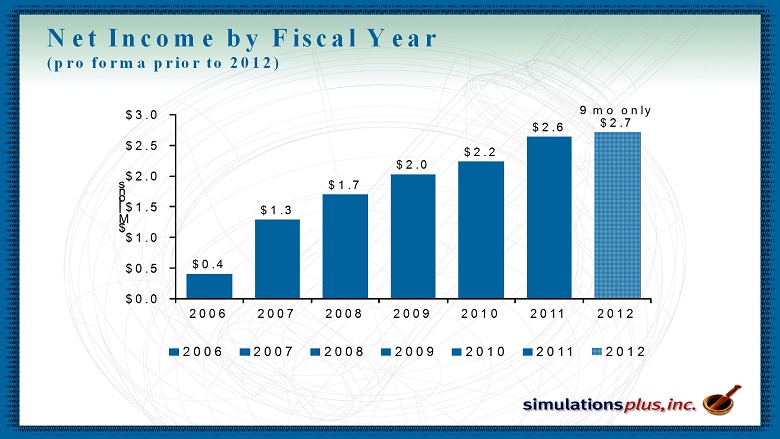
$0.4 $1.3 $1.7 $2.0 $2.2 $2.6 9 mo only $2.7 $0.0 $0.5 $1.0 $1.5 $2.0 $2.5 $3.0 2006 2007 2008 2009 2010 2011 2012 $ M i l l i o n s 2006 2007 2008 2009 2010 2011 2012 Net Income by Fiscal Year (pro forma prior to 2012)
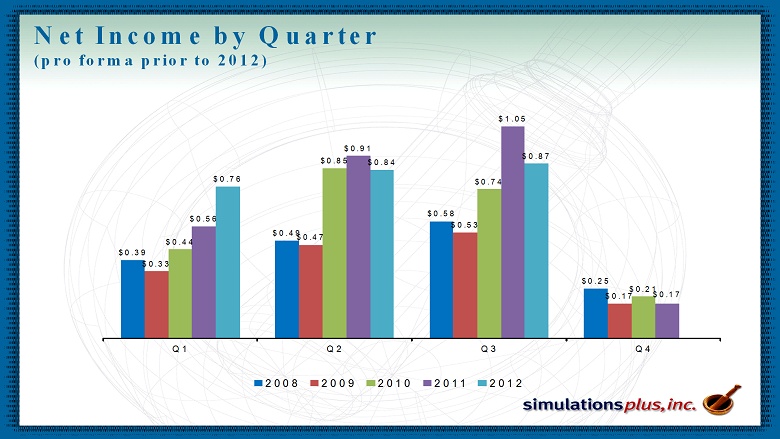
Net Income by Quarter (pro forma prior to 2012) $0.39 $0.49 $0.58 $0.25 $0.33 $0.47 $0.53 $0.17 $0.44 $0.85 $0.74 $0.21 $0.56 $0.91 $1.05 $0.17 $0.76 $0.84 $0.87 Q1 Q2 Q3 Q4 2008 2009 2010 2011 2012
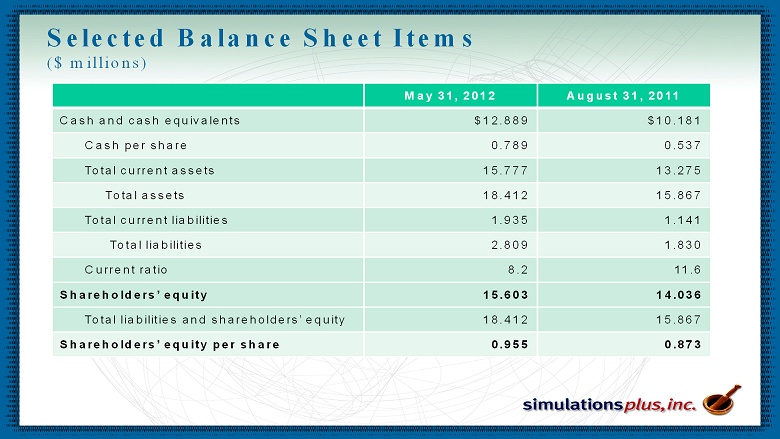
Selected Balance Sheet Items ($ millions) May 31, 2012 August 31, 2011 Cash and cash equivalents $12.889 $10.181 Cash per share 0.789 0.537 Total current assets 15.777 13.275 Total assets 18.412 15.867 Total current liabilities 1.935 1.141 Total liabilities 2.809 1.830 Current ratio 8.2 11.6 Shareholders’ equity 15.603 14.036 Total liabilities and shareholders’ equity 18.412 15.867 Shareholders’ equity per share 0.955 0.873
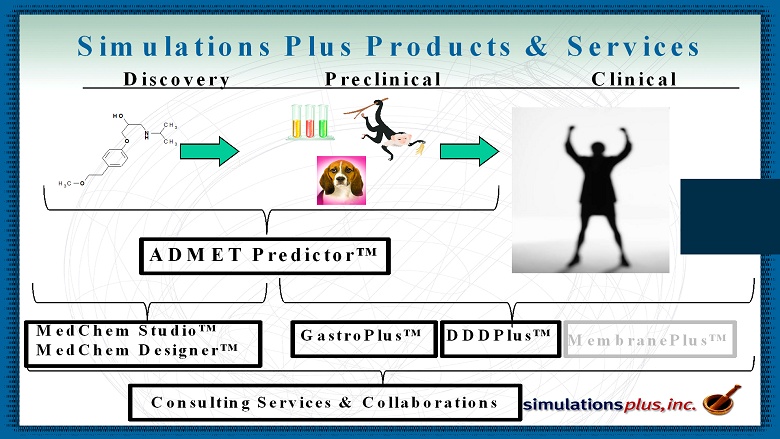
N H O OH O CH 3 CH 3 CH 3 Discovery Preclinical Clinical MedChem Studio™ MedChem Designer™ GastroPlus™ DDDPlus™ ADMET Predictor™ Simulations Plus Products & Services Consulting Services & Collaborations MembranePlus™
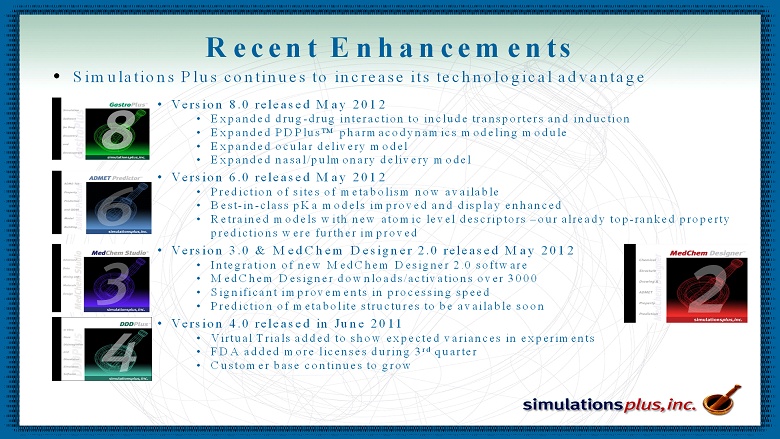
• Simulations Plus continues to increase its technological advantage Recent Enhancements • Version 8.0 released May 2012 • Expanded drug-drug interaction to include transporters and induction • Expanded PDPlus™ pharmacodynamics modeling module • Expanded ocular delivery model • Expanded nasal/pulmonary delivery model • Version 6.0 released May 2012 • Prediction of sites of metabolism now available • Best-in-class pKa models improved and display enhanced • Retrained models with new atomic level descriptors –our already top-ranked property predictions were further improved • Version 3.0 & MedChem Designer 2.0 released May 2012 • Integration of new MedChem Designer 2.0 software • MedChem Designer downloads/activations over 3000 • Significant improvements in processing speed • Prediction of metabolite structures to be available soon • Version 4.0 released in June 2011 • Virtual Trials added to show expected variances in experiments • FDA added more licenses during 3 rd quarter • Customer base continues to grow
Marketing and Sales Program • Added Cheminformatics salesperson July 2012 to increase sales of ADMET Design Suite™ (MedChem Studio™, MedChem Designer™, and ADMET Predictor™) • Conferences/Scientific Meetings continue to be primary source of leads • During Q3 we did 17 meetings in the U.S., Europe, and Asia • Total of 18 posters, presentations, and publications during Q1-Q3 • Training Workshops –Basic GastroPlus and Cheminformatics training workshops added to our Advanced GastroPlus™ training workshops • New Cheminformatics training workshop to be held in November • Strategic Digital Marketing Initiatives • Collaborations/Consulting/Grants – Progressing on our 5-year collaboration with the FDA Center for Food Safety and Applied Nutrition to build many toxicity models with ADMET Predictor/Modeler™ for food additives and contaminants – Consulting studies continue –provides exposure of software to new groups – New funded collaboration announced for enhancement of the GastroPlus oral cavity dosing model – New funded collaboration announced for enhancement of the GastroPlus pulmonary dosing model • We believe fundamental industry shift continues – Software tools are constantly gaining wider acceptance and applications are growing – 13 new customers during 3QFY12 (includes new companies as well as new departments within existing large customers)
FDA Food Safety Research Collaboration • Entered into a 5-year renewable Research Collaboration with Center for Food Safety and Applied Nutrition (CFSAN) to provide model-building capabilities for a large number (>70,000) of substances that can be in foods as additives or contaminants • FDA has data on wide variety of toxicities for small subsets (typically hundreds to a few thousands) of the total molecular data set • Purpose of collaboration: use the data from those molecules that have been tested for a particular toxicity to build predictive models for that toxicity using our ADMET Predictor/Modeler software • Models will then be used to predict the likely toxicity of the molecules that were not tested for that toxicity to see which ones appear to be toxic and should be tested • During the third quarter, we continued working with FDA scientists to model various toxicities, testing various modeling methods and finalizing the code modifications that became a part of ADMET Predictor 6.0, which was released in May. • The first new toxicity model for ADMET Predictor coming from this collaboration was released with Version 6.0. This is a model for predicting rodent carcinogenicity.
NCE (New Chemical Entity) Project • A new molecule that has never existed before is called a new chemical entity (NCE). Drug companies try to design and patent NCEs to treat diseases or to affect lifestyles. • Getting to an approvable drug molecule usually involves making and testing a large number (sometimes millions) of molecules to find good “lead candidates”. • Lead candidates typically bind to a target protein and have some (but not all) acceptable properties. • These molecules are then modified to make slightly different molecules to try to make them meet all requirements. Fixing one property can adversely affect others, so an iterative cycle proceeds until all measured properties are acceptable before going into preclinical development and clinical trials. • Using a public database courtesy of GlaxoSmithKline, and applying MedChem Studio/MedChem Designer/ADMET Predictor, we designed a number of lead candidates to inhibit the malaria parasite and qualified them for acceptable properties using only ADMET Predictor predictions. • Prior to this quarter, five molecules were received from synthesis and were tested against the drug- sensitive strain of the malaria parasite. All five showed potency at less than 1 micromolar concentration, with two below 100 nanomolar concentration. Additional testing was done in the third quarter against the drug-resistant strain and for some limited ADMET properties, and potency was again below 1 micromolar for two of our molecules. • Four new molecules were received from synthesis and were tested in the third quarter. All showed activity against the parasite, although potency was not as good as the best compounds received earlier. • Note that GlaxoSmithKline has a biological product for a malaria vaccine known as RTS,S in Phase III clinical trials, which has been seen to reduce the risk of children experiencing clinical malaria by 39-62% over a 12-month period. Although this is encouraging, there remain those who contracted clinical malaria and for whom an alternative treatment would be needed.
Summary • For 3QFY12 and 9moFY12: - Financial performance continues our profitable trend - Higher SG&A was expected after the sale of Words+, and is being felt - Sale of Words+ has simplified and focused the business - margins increased about 10%, reporting and auditing much simpler • Continuing to Expand our Life Sciences team: - Two new Ph.D.s starting in August, interviews continuing - To promote faster development of new products and services (e.g., MembranePlus) - Strengthens and supports our marketing and sales efforts • Expanding Sales Team and Activities - New field sales manager for cheminformatics products and services started in July - Greater staff time spent on marketing and sales activities (hence SG&A up) - New training workshop for chemistry tools to be held in Boston in October • Simulations Plus is globally recognized as a leader - Outstanding reputation for scientific expertise and innovation - Strong customer support • Strong cash position and no debt - First ongoing quarterly cash dividend of $0.05/share/quarter was paid in March. Cash has recovered to over $13 million as of today. Next dividend will be distributed in August.

Q&A