Attached files
| file | filename |
|---|---|
| EX-4.2 - INVESTOR RIGHTS AGREEMENT - Gigamon Inc. | d342799dex42.htm |
| EX-10.5 - FORM OF UNIT OPTION AGREEMENT - Gigamon Inc. | d342799dex105.htm |
| EX-10.8 - OFFER LETTER, BETWEEN GIGAMON LLC AND MICHAEL C. RUETTGERS - Gigamon Inc. | d342799dex108.htm |
| EX-10.4 - 2012 UNIT OPTION PLAN - Gigamon Inc. | d342799dex104.htm |
| EX-10.2 - 2009 PERFORMANCE UNIT PLAN - Gigamon Inc. | d342799dex102.htm |
| EX-10.3 - FORM OF PERFORMANCE UNIT GRANT NOTICE AND AGREEMENT - Gigamon Inc. | d342799dex103.htm |
| EX-23.1 - CONSENT OF PRICEWATERHOUSECOOPERS LLP - Gigamon Inc. | d342799dex231.htm |
| EX-10.9 - OFFER LETTER, BETWEEN GIGAMON LLC AND KENNETH A. GOLDMAN - Gigamon Inc. | d342799dex109.htm |
| EX-21.1 - LIST OF SUBSIDIARIES OF REGISTRANT - Gigamon Inc. | d342799dex211.htm |
| EX-10.11 - COMMERCIAL/INDUSTRIAL LEASE - Gigamon Inc. | d342799dex1011.htm |
| EX-3.1 - RESTATED LIMITED LIABILITY COMPANY AGREEMENT - Gigamon Inc. | d342799dex31.htm |
| EX-10.10 - OFFER LETTER, BETWEEN GIGAMON LLC AND ANDREW M. MILLER - Gigamon Inc. | d342799dex1010.htm |
Table of Contents
As filed with the Securities and Exchange Commission on July 13, 2012
Registration No. 333-
UNITED STATES
SECURITIES AND EXCHANGE COMMISSION
Washington, D.C. 20549
FORM S-1
REGISTRATION STATEMENT
UNDER
THE SECURITIES ACT OF 1933
GIGAMON LLC
(Exact name of registrant as specified in its charter)
| Delaware | 7372 | 26-3963351 | ||
| (State or other jurisdiction of incorporation or organization) |
(Primary Standard Industrial Classification Code Number) |
(I.R.S. Employer Identification Number) |
598 Gibraltar Drive
Milpitas, California 95035
(408) 263-2022
(Address, including zip code, and telephone number, including area code, of registrant’s principal executive offices)
Ted C. Ho
Chief Executive Officer and Chairman
Gigamon LLC
598 Gibraltar Drive
Milpitas, California 95035
(408) 263-2022
(Name, address, including zip code, and telephone number, including area code, of agent for service)
Copies to:
| Jeffrey D. Saper Rezwan D. Pavri Wilson Sonsini Goodrich & Rosati, P.C. 650 Page Mill Road Palo Alto, California 94304 (650) 493-9300 |
Paul B. Shinn General Counsel Gigamon LLC 598 Gibraltar Drive Milpitas, California 95035 (408) 263-2022 |
Richard A. Kline Anthony J. McCusker Goodwin Procter LLP 135 Commonwealth Drive Menlo Park, California 94025 (650) 752-3100 |
Approximate date of commencement of proposed sale to the public: As soon as practicable after this registration statement becomes effective.
If any of the securities being registered on this Form are to be offered on a delayed or continuous basis pursuant to Rule 415 under the Securities Act, check the following box: ¨
If this Form is filed to register additional securities for an offering pursuant to Rule 462(b) under the Securities Act, please check the following box and list the Securities Act registration statement number of the earlier effective registration statement for the same offering. ¨
If this Form is a post-effective amendment filed pursuant to Rule 462(c) under the Securities Act, check the following box and list the Securities Act registration statement number of the earlier effective registration statement for the same offering. ¨
If this Form is a post-effective amendment filed pursuant to Rule 462(d) under the Securities Act, check the following box and list the Securities Act registration statement number of the earlier effective registration statement for the same offering. ¨
Indicate by check mark whether the registrant is a large accelerated filer, an accelerated filer, a non-accelerated filer, or a smaller reporting company. See the definitions of “large accelerated filer,” “accelerated filer” and “smaller reporting company” in Rule 12b-2 of the Exchange Act. (Check one):
| Large accelerated filer | ¨ | Accelerated filer | ¨ | |||
| Non-accelerated filer | x (Do not check if a smaller reporting company) | Smaller reporting company | ¨ | |||
CALCULATION OF REGISTRATION FEE
|
| ||||
| Title of Each Class of Securities to be Registered | Proposed Maximum Aggregate Offering Price (1)(2) |
Amount of Registration Fee | ||
| Common Stock, $0.0001 par value per share |
$100,000,000 | $11,460 | ||
|
| ||||
|
| ||||
| (1) | Estimated solely for the purpose of computing the amount of the registration fee pursuant to Rule 457(o) under the Securities Act of 1933, as amended. |
| (2) | Includes offering price of shares that the underwriters have the option to purchase to cover over-allotments, if any. |
The registrant hereby amends this registration statement on such date or dates as may be necessary to delay its effective date until the registrant shall file a further amendment which specifically states that this registration statement shall thereafter become effective in accordance with Section 8(a) of the Securities Act of 1933 or until the registration statement shall become effective on such date as the Commission, acting pursuant to said Section 8(a), may determine.
Table of Contents
EXPLANATORY NOTE
Gigamon LLC, the registrant whose name appears on the cover page of this registration statement, is a Delaware limited liability company. Prior to the sale and issuance of any shares of common stock subject to this registration statement, Gigamon LLC will convert into a Delaware corporation and change its name from Gigamon LLC to Gigamon Inc. Shares of the common stock of Gigamon Inc. are being offered by the prospectus that forms a part of this registration statement.
Table of Contents
The information in this preliminary prospectus is not complete and may be changed. These securities may not be sold until the registration statement filed with the Securities and Exchange Commission is effective. This preliminary prospectus is not an offer to sell nor does it seek an offer to buy these securities in any jurisdiction where the offer or sale is not permitted.
Subject To Completion. Dated , 2012.
Shares

Common Stock
This is an initial public offering of shares of common stock of Gigamon Inc.
We are offering of the shares to be sold in this offering. The selling stockholders identified in this prospectus are offering an additional shares. We will not receive any of the proceeds from the sale of the shares being sold by the selling stockholders.
Prior to this offering, there has been no public market for the common stock. It is currently estimated that the initial public offering price per share will be between $ and $ . We intend to apply to list our common stock on under the symbol “GIMO.”
We are an “emerging growth company” as defined under the federal securities laws and are subject to reduced public company reporting requirements.
Investing in our common stock involves risks. See the section titled “Risk Factors” on page 12 to read about factors you should consider before buying shares of the common stock.
Neither the Securities and Exchange Commission nor any other regulatory body has approved or disapproved of these securities or passed upon the accuracy or adequacy of this prospectus. Any representation to the contrary is a criminal offense.
| Per Share | Total | |||
| Initial public offering price |
$ | $ | ||
| Underwriting discount |
$ | $ | ||
| Proceeds, before expenses, to Gigamon |
$ | $ | ||
| Proceeds, before expenses, to selling stockholders |
$ | $ | ||
To the extent that the underwriters sell more than shares of common stock, the underwriters have the option to purchase up to an additional shares from us and shares from the selling stockholders identified in this prospectus at the initial public offering price, in each case, less the underwriting discount.
The underwriters expect to deliver the shares against payment in New York, New York on , 2012.
| Goldman, Sachs & Co. | BofA Merrill Lynch | Credit Suisse | ||
| Barclays | ||||
| Raymond James | ||||
Prospectus dated , 2012
Table of Contents
Prospectus
| Page | ||||
| 1 | ||||
| 12 | ||||
| 37 | ||||
| 39 | ||||
| 40 | ||||
| 41 | ||||
| 42 | ||||
| 44 | ||||
| 47 | ||||
| Management’s Discussion and Analysis of Financial Condition and Results of Operations |
50 | |||
| 79 | ||||
| 97 | ||||
| 104 | ||||
| 111 | ||||
| 116 | ||||
| 118 | ||||
| 123 | ||||
| Material U.S. Federal Income Tax Consequences to Non-U.S. Holders |
126 | |||
| 130 | ||||
| 135 | ||||
| 135 | ||||
| 135 | ||||
| F-1 | ||||
Through and including , 2012 (the 25th day after the date of this prospectus), all dealers effecting transactions in these securities, whether or not participating in this offering, may be required to deliver a prospectus. This is in addition to a dealer’s obligation to deliver a prospectus when acting as an underwriter and with respect to an unsold allotment or subscription.
This prospectus contains statistical data, estimates and forecasts that are based on independent industry publications, other publicly available information and information based on our internal sources.
Neither we, the selling stockholders, nor the underwriters have authorized anyone to provide you with information or to make any representations other than those contained in this prospectus or in any free writing prospectuses we have prepared. We take no responsibility for, and provide no assurance as to the reliability of, any other information that others may give you. This prospectus is an offer to sell only the shares offered hereby, but only under circumstances and in jurisdictions where it is lawful to do so. The information contained in this prospectus is current only as of its date.
For investors outside the United States: Neither we, the selling stockholders, nor any of the underwriters have done anything that would permit this offering or possession or distribution of this prospectus in any jurisdiction where action for that purpose is required, other than in the United States. You are required to inform yourselves about, and to observe any restrictions relating to, this offering and the distribution of this prospectus.
Table of Contents
This summary highlights selected information that is presented in greater detail elsewhere in this prospectus. This summary does not contain all of the information you should consider before investing in our common stock. You should read this entire prospectus carefully, including the sections titled “Risk Factors,” “Selected Consolidated Financial Data,” “Management’s Discussion and Analysis of Financial Condition and Results of Operations” and “Business,” and our consolidated financial statements and the related notes included elsewhere in this prospectus, before making an investment decision. Unless the context otherwise requires, the terms “Gigamon,” “our company,” “we,” “us,” and “our” refer, prior to the conversion discussed below, to Gigamon LLC, and, after the conversion, to Gigamon Inc., in each case together with its consolidated subsidiaries as a combined entity.
Overview
We have developed a new and innovative solution that delivers pervasive and dynamic visibility and control of traffic across networks. Our solution, which we refer to as our Traffic Visibility Fabric, consists of distributed network appliances that provide an advanced level of network traffic intelligence. Our Fabric enables IT organizations to forward traffic from network infrastructure to management, analysis, compliance and security tools in a manner that is optimized for specific uses or locations. At the heart of the Fabric is our patented Flow Mapping™ technology that identifies and directs incoming traffic to single or multiple tools based on user-defined rules implemented from a centralized management console. Our Fabric is designed to help organizations ensure the reliability, performance and security of their network infrastructure, minimize capital investment in management, analysis, compliance and security tools, reduce operating expenses and realize greater value from the existing tools that are deployed throughout their networks.
Virtualization and cloud computing, mobility and big data are reshaping the way enterprises and service providers operate and the way people communicate over IP networks in an increasingly connected world. Organizations increasingly require enhanced visibility and control of their networks through the efficient collection and analysis of network traffic flows without degrading network performance or reliability. Our Fabric provides the pervasive visibility and control over network traffic, including voice, video and data, that organizations need to successfully manage, analyze and secure their network environments.
We sell our products directly through our own sales force and indirectly through our channel partners. As of March 31, 2012, our end-user customers included 43 of the Fortune 100, and we had sold products to over 825 end-user customers across many vertical markets, including four of the top ten U.S. retailers, four of the top five U.S. banks and financial services companies, five of the top ten U.S. integrated telecommunication service providers, three of the top five U.S. managed healthcare providers, five of the top ten U.S. cable and satellite providers and three of the top ten global securities and commodities exchanges.
We were founded in 2004, and have experienced significant growth since inception. Our total revenue increased from $31.4 million in 2009 to $68.1 million in 2011, representing a compound annual growth rate, or CAGR, of 47%. Our total revenue increased from $10.1 million during the three months ended March 31, 2011 to $16.7 million during the three months ended March 31, 2012, representing 66% growth, and we have generated positive cash flows in each of the last six years.
1
Table of Contents
Industry Overview
Powerful forces are transforming the traditional ways that enterprises and service providers design, operate and manage their networks. These forces include:
| Ÿ | Virtualization and Cloud Computing. Enterprises and service providers are seeking to enhance visibility and control over their network traffic as they manage the transition from static physical architectures to dynamic virtual environments. |
| Ÿ | Mobility. Enterprises are looking for ways to improve the productivity of their increasingly mobile workforce by providing enhanced access to their network. Service providers are seeking to monetize new service offerings and improve the satisfaction and retention rates of their customers. |
| Ÿ | Big Data. As the volume of network traffic generated, transmitted and consumed grows rapidly, organizations are increasingly challenged to maintain, analyze, improve and secure the performance and reliability of networks as they scale to meet demand. |
These forces are enabling significant benefits to be realized from IT innovation, but are also presenting significant challenges in how organizations manage, analyze and secure their networks to address growing network traffic volumes, security and compliance, the proliferation of mobile devices, the consumerization of IT and adoption of cloud-based IT.
Limitations of Traditional Approaches
The impact of virtualization and cloud computing, mobility and big data are combining to increase network complexity and introduce new network vulnerabilities while creating new challenges for enterprises and service providers that are struggling to maintain or improve service delivery and limit network downtime. As a result, organizations are seeking to improve visibility and control of their networks through the intelligent collection, modification and analysis of traffic without adversely impacting network performance or reliability. IT organizations have historically had access to a limited range of approaches to address these requirements, including deploying additional management, analysis, compliance and security tools, repurposing Ethernet switches, duplicating traffic via mirroring ports or dividing traffic flows via network TAPs.
Given the performance limitations, cost and complexity of traditional approaches, enterprises and service providers utilizing these approaches struggle to scale and ensure the performance, reliability and integrity of their network infrastructure. Without the ability to scale with network growth and to analyze packet contents, prioritize latency-sensitive data and intelligently direct individual packets to the relevant tools, these approaches fail to deliver a comprehensive solution that offers visibility into and control over network traffic.
Need for a Comprehensive Visibility Solution
We were founded on the belief that organizations need a fundamentally new approach to network traffic visibility to address growing demand for increased efficiency and performance, and to improve quality and breadth of service offerings. We believe a solution that can optimize the efficiency and performance of these tools by delivering pervasive visibility and control over network traffic creates a significant market opportunity. Our belief is supported by the results of an independent survey of IT leaders conducted by the Enterprise Strategy Group, or ESG, in which 78% of respondents indicated that a traffic visibility fabric would be a useful enhancement to their network environment.
2
Table of Contents
Our Solution
The key benefits of our Traffic Visibility Fabric include:
| Ÿ | Providing Pervasive Visibility and Control. Our Fabric inspects and intelligently filters data packets from concurrent traffic streams in accordance with a set of user-defined criteria, which provides IT organizations with pervasive visibility and intelligent control over how traffic flows from the network to management, analysis, compliance and security tools. |
| Ÿ | Enabling Rapid Response to Dynamic Change. Our Fabric significantly improves network flexibility by enabling static tools to connect to virtualized applications, dynamic infrastructure and mobile machines, which allows our end-user customers to efficiently and securely address their business needs. |
| Ÿ | Delivering Scalable, High-Throughput Capacity. Our Fabric provides increased visibility and intelligent traffic filtering without impeding the delivery of traffic to management, analysis, compliance and security tools and can scale as the network grows and performance requirements increase. |
| Ÿ | Improving Network Efficiency and Economy. Our Fabric improves the return on investment of existing tools, reduces capital and operating costs associated with deploying new or more advanced tools, limits the infrastructure footprints in space-constrained data centers and curtails the staff required to monitor and maintain the network. |
| Ÿ | Enhancing Network Reliability. By reducing the need to process non-relevant traffic, our Fabric increases the reliability of tools and the critical business processes running on production networks. Because our Fabric is deployed “out of band,” or in parallel to, the production network, modifications to the Traffic Visibility Fabric do not require network downtime. |
| Ÿ | Ease of Deployment and Use. We have designed our Fabric to be easy to install, configure and maintain. Our Fabric can be controlled remotely, enabling our end-user customers to reduce management and maintenance of unmanned, or dark, data centers. |
Growth Strategy
Key elements of our growth strategy include:
| Ÿ | Continuous Innovation. We intend to enhance the functionality and scalability of our Fabric to address new use cases, tool capabilities, deployment environments and performance levels. |
| Ÿ | Increase Awareness of Our Value Proposition. We plan to invest in our brand and develop awareness of the benefits of our Fabric in order to help us grow our business and market opportunity. |
| Ÿ | Expand Our Relationships with Existing End-User Customers. We intend to increase the depth of our relationships with our end-user customers by offering new products that help them increase the value of their new and existing management, analysis, compliance and security tools, adopt virtualization and cloud technologies and efficiently scale their network environments. |
| Ÿ | Invest in our Global Distribution Network. We plan to continue to invest in strengthening our existing relationships with channel partners and expanding our network by adding new channel partners to broaden our reach and target new end-user customers. |
3
Table of Contents
Risks Affecting Us
Our business is subject to numerous risks and uncertainties, including those highlighted in the section titled “Risk Factors” immediately following this prospectus summary. These risks include, but are not limited to, the following:
| Ÿ | The network traffic visibility market is rapidly evolving and difficult to predict. If the network traffic visibility market does not evolve as we anticipate or if our target end-user customers do not adopt our Traffic Visibility Fabric, our sales will not grow as quickly as anticipated and our stock price could decline; |
| Ÿ | New or existing technologies that are perceived to address network traffic visibility or address the need for network traffic visibility in different ways could gain wide adoption and supplant our products and services, thereby weakening our sales and our financial results; |
| Ÿ | We are dependent on a single product family comprised of a limited number of products; |
| Ÿ | If we are unable to introduce new products successfully and to make enhancements to existing products, our growth rates would likely decline and our business, operating results and competitive position could suffer; |
| Ÿ | If we are unable to increase market awareness of our company and our products, our revenue may not continue to grow, or may decline; |
| Ÿ | Our quarterly and annual operating results may vary significantly and be difficult to predict, which may cause our stock price to fluctuate; |
| Ÿ | We compete in highly competitive markets, and competitive pressures from existing and new companies may adversely impact our business and operating results; |
| Ÿ | If we fail to remediate material weaknesses in our internal control over financial reporting or are unable to implement and maintain effective internal control over financial reporting in the future, the accuracy and timeliness of our financial reporting may be adversely affected; |
| Ÿ | Our limited operating history makes it difficult for you to evaluate our current business and future prospects, and may increase the risk of your investment; and |
| Ÿ | Existing directors, executive officers and principal stockholders will collectively own % of our common stock and continue to have substantial control over us after this offering, which will limit your ability to influence the outcome of key transactions, including a change of control. |
Conversion to a Corporation
We are currently a Delaware limited liability company. Prior to the issuance of common stock in this offering, we will convert into a Delaware corporation and change our name from Gigamon LLC to Gigamon Inc. In connection with the conversion, all of our outstanding common units and preferred units will convert into shares of common stock and preferred stock, respectively. Immediately following our conversion to a corporation, the holder of all of our outstanding common stock, Gigamon Systems LLC, as well as certain entities affiliated with Highland Capital Partners that hold shares of our preferred stock, will be merged with and into us, and the equity holders of Gigamon Systems LLC, and the entities affiliated with Highland Capital Partners that will merge with and into us, will receive our common stock and preferred stock in exchange for their respective equity interests.
In this prospectus, we refer to all of the transactions related to our conversion to a corporation, and the mergers of the holder of our common stock and certain holders of shares of our preferred
4
Table of Contents
stock with and into us, as the “LLC Conversion.” See the section titled “Certain Relationships and Related Party Transactions—LLC Conversion” for additional information.
While our outstanding equity as a limited liability company prior to the LLC Conversion is called “common units” and “preferred units,” unless otherwise indicated in this prospectus, we refer to such common units and preferred units in this prospectus as common stock and preferred stock for the periods prior to the LLC Conversion for ease of comparison.
Distribution to Members
In connection with the LLC Conversion, and as permitted by our Restated Limited Liability Company Agreement, dated as of January 20, 2010, as amended, or the LLC Agreement, we currently intend to distribute an amount of cash to our stockholders as of the date of the LLC Conversion equal to the members’ distribution payable balance on our consolidated financial statements, which was $7.4 million as of March 31, 2012.
Corporate Background and Information
Our business was founded in 2004 and originally operated by a California limited liability company, Gigamon Systems LLC. In January 2009, Gigamon Systems LLC contributed substantially all of its assets and liabilities to us in exchange for all of our common stock. In January 2010, entities affiliated with Highland Capital Partners invested in our company through the purchase of our preferred stock. As of March 31, 2012, Gigamon Systems LLC held all of our outstanding common stock and entities affiliated with Highland Capital Partners held all of our outstanding preferred stock.
Our principal executive offices are located at 598 Gibraltar Drive, Milpitas, California 95035, and our telephone number is (408) 263-2022. Our website address is www.gigamon.com. Information contained on, or that can be accessed through, our website, does not constitute part of this prospectus and the inclusion of our website address in this prospectus is an inactive textual reference only.
5
Table of Contents
| Common stock offered by us |
shares | |
| Common stock offered by the selling stockholders |
shares | |
| Common stock to be outstanding after this offering |
shares | |
| Option to purchase additional shares |
We and the selling stockholders have granted the underwriters an option, exercisable for 30 days after the date of this prospectus, to purchase up to an additional shares from us and up to an additional shares from the selling stockholders. | |
| Use of Proceeds |
We estimate that the net proceeds from the sale of shares of our common stock that we are selling in this offering will be $ million (or $ million if the underwriters’ option to purchase additional shares in this offering is exercised in full), based upon an assumed initial public offering price of $ per share, which is the midpoint of the estimated offering price range set forth on the cover page of this prospectus, after deducting estimated underwriting discounts and commissions and estimated offering expenses payable by us. We will not receive any proceeds from the sale of shares by the selling stockholders.
We currently intend to use the net proceeds that we receive from this offering to satisfy our obligations to holders of performance units under our 2009 Performance Unit Plan, which we estimate will be $ in cash in the aggregate, and the balance for working capital and other general corporate purposes. We may also use a portion of the net proceeds that we receive from this offering to acquire or invest in complementary businesses, products, services, technologies or other assets. See the section titled “Use of Proceeds” for additional information. | |
| Concentration of Ownership |
Upon completion of this offering, the executive officers, directors and 5% stockholders of our company and their affiliates will beneficially own, in the aggregate, approximately % of our outstanding capital stock. | |
| Proposed trading symbol |
“GIMO” | |
6
Table of Contents
The number of shares of common stock that will be outstanding after this offering is based on 73,632,640 shares outstanding as of March 31, 2012 after giving effect to the LLC Conversion described under the section titled “Certain Relationships and Related Party Transactions—LLC Conversion,” and excludes:
| Ÿ | 2,596,920 shares of common stock issuable upon the exercise of options to purchase common stock, consisting of options to be assumed from Gigamon Systems LLC in connection with the LLC Conversion, with a weighted-average exercise price of $0.01 per share; and |
| Ÿ | additional shares of common stock, subject to increase on an annual basis, reserved for future issuance under our 2012 Equity Incentive Plan, which will become effective in connection with the completion of this offering, consisting of: |
| ¡ | shares of common stock reserved for future grant or issuance under our 2012 Equity Incentive Plan, which will become effective in connection with the completion of this offering; and |
| ¡ | 5,901,516 shares of common stock reserved for future issuance under our 2012 Unit Option Plan, which shares will be added to the shares of common stock to be reserved under our 2012 Equity Incentive Plan upon its effectiveness. |
Except as otherwise indicated, all information in this prospectus assumes:
| Ÿ | the consummation of the LLC Conversion described under the section titled “Certain Relationships and Related Party Transactions—LLC Conversion” prior to the completion of this offering; |
| Ÿ | the conversion of all outstanding shares of preferred stock into an aggregate of 24,329,545 shares of common stock, which will occur in connection with the completion of this offering; |
| Ÿ | the filing and effectiveness of our amended and restated certificate of incorporation in Delaware and the adoption of our amended and restated bylaws, each of which will occur in connection with the completion of this offering; and |
| Ÿ | no exercise by the underwriters of their option to purchase up to an additional shares of common stock from us and shares of common stock from the selling stockholders in this offering. |
7
Table of Contents
SUMMARY CONSOLIDATED FINANCIAL AND OTHER DATA
The following tables summarize our historical consolidated financial and other data. We have derived the summary consolidated statement of operations data for the years ended December 31, 2009, 2010 and 2011 from our audited consolidated financial statements included elsewhere in this prospectus. We have derived the summary consolidated statement of operations data for the three months ended March 31, 2011 and 2012, and the consolidated balance sheet data as of March 31, 2012, from our unaudited consolidated interim financial statements included elsewhere in this prospectus. The unaudited interim consolidated financial statements have been prepared on the same basis as the audited consolidated financial statements and, in the opinion of management, reflect all adjustments, consisting only of normal recurring adjustments that are necessary for the fair statement of our unaudited interim consolidated financial statements. Our historical results are not necessarily indicative of the results that may be expected in the future, and the results in the three months ended March 31, 2012 are not necessarily indicative of the results to be expected for the full year or any other period. The following summary consolidated financial and other data should be read in conjunction with the sections titled “Selected Consolidated Financial Data” and “Management’s Discussion and Analysis of Financial Condition and Results of Operations” and our consolidated financial statements and related notes included elsewhere in this prospectus.
We have restated our audited consolidated financial statements as of December 31, 2011 and for the year then ended to (i) correct errors in our provision for excess and obsolete inventory and non-cancelable future inventory purchase commitments, (ii) correct errors in our accounting for, and tax treatment of, equity award grants to certain employees in prior years, (iii) correct other errors which were not material individually or in the aggregate and (iv) adjust the members’ distribution payable and founders’ bonus pursuant to the LLC Agreement to reflect the amounts owed based on the revised financial results.
The impact of the corrections to the 2011 consolidated financial statements was a decrease in inventory by $0.6 million, an increase in prepaid expenses and other current assets by $1.4 million, a decrease in accounts payable and members’ distribution payable by $0.7 million and $3.3 million, respectively, and an increase in accrued liabilities by $4.7 million as of December 31, 2011. Additionally, the restatement resulted in an increase to cost of revenue by $2.2 million, a decrease in product revenue of $0.1 million and an increase in operating expenses by $0.8 million for the year ended December 31, 2011. The net impact of these adjustments to the 2011 consolidated financial statements was a decrease in net income of $3.1 million.
We have also restated our audited consolidated financial statements as of December 31, 2009 and 2010, and for the years then ended to (i) correct errors in our accounting for, and tax treatment of, equity award grants to certain employees in prior years, (ii) correct errors which were not material individually or in the aggregate and (iii) adjust the members’ distribution payable and founders’ bonus pursuant to the LLC Agreement to reflect the amounts owed based on the revised financial results. The net impact of these corrections was a decrease in net income of $0.2 million in each of 2009 and 2010.
8
Table of Contents
| Year Ended December 31, | Three Months Ended March 31, |
|||||||||||||||||||
| 2009 | 2010 | 2011 | 2011 | 2012 | ||||||||||||||||
| (restated) | (restated) | (restated) | (unaudited) |
|||||||||||||||||
| (in thousands, except per share amounts) | ||||||||||||||||||||
| Consolidated Statement of Operations Data: |
||||||||||||||||||||
| Revenue: |
||||||||||||||||||||
| Product |
$ | 24,664 | $ | 35,577 | $ | 51,308 | $ | 6,720 | $ | 10,893 | ||||||||||
| Services |
6,723 | 10,909 | 16,797 | 3,353 | 5,809 | |||||||||||||||
|
|
|
|
|
|
|
|
|
|
|
|||||||||||
| Total revenue |
31,387 | 46,486 | 68,105 | 10,073 | 16,702 | |||||||||||||||
|
|
|
|
|
|
|
|
|
|
|
|||||||||||
| Cost of revenue: |
||||||||||||||||||||
| Product |
4,826 | 6,122 | 12,528 | 1,569 | 3,365 | |||||||||||||||
| Services (1) |
665 | 2,239 | 1,900 | 306 | 492 | |||||||||||||||
|
|
|
|
|
|
|
|
|
|
|
|||||||||||
| Total cost of revenue |
5,491 | 8,361 | 14,428 | 1,875 | 3,857 | |||||||||||||||
|
|
|
|
|
|
|
|
|
|
|
|||||||||||
| Gross profit |
25,896 | 38,125 | 53,677 | 8,198 | 12,845 | |||||||||||||||
|
|
|
|
|
|
|
|
|
|
|
|||||||||||
| Operating expenses: |
||||||||||||||||||||
| Research and development (1) |
4,977 | 12,283 | 12,530 | 2,103 | 3,945 | |||||||||||||||
| Sales and marketing (1) |
5,209 | 12,522 | 19,358 | 3,543 | 8,223 | |||||||||||||||
| General and administrative (1) |
2,506 | 6,610 | 4,766 | 893 | 1,306 | |||||||||||||||
|
|
|
|
|
|
|
|
|
|
|
|||||||||||
| Total operating expenses |
12,692 | 31,415 | 36,654 | 6,539 | 13,474 | |||||||||||||||
|
|
|
|
|
|
|
|
|
|
|
|||||||||||
| Income (loss) from operations |
13,204 | 6,710 | 17,023 | 1,659 | (629 | ) | ||||||||||||||
| Interest income |
65 | 9 | 4 | 2 | 3 | |||||||||||||||
| Other income (expense), net |
(7 | ) | (7 | ) | (16 | ) | (1 | ) | (26 | ) | ||||||||||
|
|
|
|
|
|
|
|
|
|
|
|||||||||||
| Income (loss) before provision for income taxes |
13,262 | 6,712 | 17,011 | 1,660 | (652 | ) | ||||||||||||||
| Provision for income taxes |
(122 | ) | (75 | ) | (80 | ) | — | (63 | ) | |||||||||||
|
|
|
|
|
|
|
|
|
|
|
|||||||||||
| Net income (loss) |
13,140 | 6,637 | 16,931 | 1,660 | (715 | ) | ||||||||||||||
| Accretion of preferred stock to redemption value and issuance costs |
— | (1,834 | ) | (2,078 | ) | (505 | ) | (544 | ) | |||||||||||
| (Earnings) loss distributed to preferred shares |
— | (1,350 | ) | (4,741 | ) | (369 | ) | 402 | ||||||||||||
|
|
|
|
|
|
|
|
|
|
|
|||||||||||
| Net income (loss) attributable to common stockholders |
$ | 13,140 | $ | 3,453 | $ | 10,112 | $ | 786 | $ | (857 | ) | |||||||||
|
|
|
|
|
|
|
|
|
|
|
|||||||||||
| Net income (loss) per common share attributable to common stockholders: |
||||||||||||||||||||
| Basic and Diluted (2) |
$ | 0.17 | $ | 0.06 | $ | 0.19 | $ | 0.02 | $ | (0.02 | ) | |||||||||
|
|
|
|
|
|
|
|
|
|
|
|||||||||||
| Weighted average shares used in computing net income (loss) per common share attributable to common stockholders: |
||||||||||||||||||||
| Basic and Diluted (2) |
76,230 | 53,587 | 51,900 | 51,900 | 51,900 | |||||||||||||||
|
|
|
|
|
|
|
|
|
|
|
|||||||||||
|
Pro forma net income (loss) per common share: |
||||||||||||||||||||
| Basic and Diluted (2) |
$ | $ | ||||||||||||||||||
|
|
|
|
|
|||||||||||||||||
| Weighted average shares of common stock used in computing pro forma net income (loss) per common share: |
||||||||||||||||||||
| Basic and Diluted (2) |
||||||||||||||||||||
|
|
|
|
|
|||||||||||||||||
9
Table of Contents
| (1) | The following table presents stock-based compensation expense included in each expense category: |
| Year Ended December 31, | Three Months Ended March 31, |
|||||||||||||||||||
| 2009 | 2010 | 2011 | 2011 | 2012 | ||||||||||||||||
| (restated) | (restated) | (restated) | (unaudited) | |||||||||||||||||
| (in thousands) | ||||||||||||||||||||
| Cost of revenue |
$ | 8 | $ | 1,086 | $ | — | $ | — | $ | — | ||||||||||
| Research and development |
64 | 4,692 | 8 | 8 | — | |||||||||||||||
| Sales and marketing |
25 | 2,377 | 2 | 2 | — | |||||||||||||||
| General and administrative |
13 | 2,212 | 2 | 2 | — | |||||||||||||||
|
|
|
|
|
|
|
|
|
|
|
|||||||||||
| Total stock-based compensation expense |
$ | 110 | $ | 10,367 | $ | 12 | $ | 12 | $ | — | ||||||||||
|
|
|
|
|
|
|
|
|
|
|
|||||||||||
| (2) | See Notes 2 and 11 to our audited consolidated financial statements for an explanation of the calculations of our basic and diluted net income (loss) per share of common stock, and pro forma net income (loss) per share of common stock. |
The pro forma as adjusted information set forth in the table below is illustrative only and will be adjusted based on the actual initial public offering price and other terms of this offering determined at pricing.
| As of March 31, 2012 | ||||||||||
| Actual | Pro Forma(1) | Pro
Forma As Adjusted(2)(3) | ||||||||
| (unaudited) | ||||||||||
| (in thousands) | ||||||||||
| Consolidated Balance Sheet Data: |
||||||||||
| Cash and cash equivalents |
$ | 16,366 | $ | |||||||
| Working capital |
336 | |||||||||
| Total assets |
41,266 | |||||||||
| Redeemable convertible preferred stock |
26,652 | |||||||||
| Total stockholders’ equity (deficit) |
(28,353 | ) | ||||||||
| (1) | The pro forma column reflects (i) the LLC Conversion, (ii) the conversion of all outstanding preferred stock into common stock and (iii) the distribution of an amount of cash to our stockholders as of the date of the LLC Conversion equal to the members’ distribution payable balance on our consolidated financial statements, which was $7.4 million as of March 31, 2012. |
| (2) | The pro forma as adjusted column gives effect to the pro forma adjustments set forth above and (i) the receipt of $ in proceeds from the sale and issuance by us of shares of common stock in this offering, based on an assumed initial public offering price of $ per share, which is the midpoint of the estimated offering price range set forth on the cover page of this prospectus, after deducting estimated underwriting discounts and commissions and estimated offering expenses payable by us and (ii) a $ increase in accumulated deficit associated with compensation expense related to the vesting of performance units in connection with the completion of this offering. |
| (3) | Each $1.00 increase or decrease in the assumed initial public offering price of $ per share, which is the midpoint of the estimated offering price range set forth on the cover page of this prospectus, would increase or decrease, as applicable, our cash and cash equivalents, additional paid-in capital, total stockholders’ equity (deficit) and total capitalization by $ million, assuming that the number of shares offered by us, as set forth on the cover page of this prospectus, remains the same, after deducting estimated underwriting discounts and commissions payable by us. An increase or decrease of one million shares of common stock offered by us would increase or decrease the cash and cash equivalents, additional paid-in capital, total stockholders’ equity (deficit) and total capitalization by $ , assuming an initial public offering price of $ per share, which is the midpoint of the estimated offering price range set forth on the cover page of this prospectus, after deducting the estimated underwriting discounts and commissions payable by us. |
10
Table of Contents
Key Performance Indicators
We monitor the key performance indicators set forth below to help us evaluate growth trends, establish budgets, measure the effectiveness of our sales and marketing efforts and assess operational efficiencies.
| Year Ended December 31, | Three Months Ended March 31, |
|||||||||||||||||||
| 2009 | 2010 | 2011 | 2011 | 2012 | ||||||||||||||||
| (restated) | (restated) | (restated) | ||||||||||||||||||
| (dollars in thousands) | ||||||||||||||||||||
| Key Performance Indicators: |
||||||||||||||||||||
| Total revenue |
$ | 31,387 | $ | 46,486 | $ | 68,105 | $ | 10,073 | $ | 16,702 | ||||||||||
| Gross margin |
83% | 82% | 79% | 81% | 77% | |||||||||||||||
| Operating income (loss) |
$ | 13,204 | $ | 6,710 | $ | 17,023 | $ | 1,659 | $ | (629 | ) | |||||||||
| Deferred revenue |
$ | 7,133 | $ | 11,121 | $ | 21,962 | $ | 12,100 | $ | 22,289 | ||||||||||
Total revenue. We monitor our total revenue to assess the acceptance of our products by our end-user customers and growth in the markets we serve. We discuss our total revenue further below under the section titled “Management’s Discussion and Analysis of Financial Condition and Results of Operations.”
Gross margin. We monitor our gross margin to assess the impact on our current and forecasted financial results from any changes to the pricing and mix of products we are selling to our end-user customers.
Operating income (loss). We monitor our operating income (loss) to assess how effectively we are conducting our operations as well as controlling our operating expenses, which are primarily driven by headcount. We discuss our operating expenses further below under the section titled “Management’s Discussion and Analysis of Financial Condition and Results of Operations.”
Deferred revenue. Our deferred revenue consists of amounts that have been invoiced but that have not yet been recognized as revenue. The majority of our deferred revenue balance consists of the unamortized portion of services revenue from maintenance and support contracts. We also defer revenue, and the related costs of product revenue, on sales of products to a distributor who stocks inventory until that distributor reports to us that it has sold the product to an end-user customer. We monitor our deferred revenue balance because it represents a significant portion of the revenue that we will recognize in future periods. We assess the change in our deferred revenue balance which, taken together with revenue, is an indication of sales activity in a given period.
11
Table of Contents
Investing in our common stock involves a high degree of risk. You should carefully consider the risks and uncertainties described below, together with all of the other information in this prospectus, before making a decision to invest in our common stock. If any of the risks actually occurs, our business, financial condition, operating results and prospects could be materially and adversely affected. In that event, the trading price of our common stock could decline, and you could lose part or all of your investment.
Risks Related to Our Business
The network traffic visibility market is rapidly evolving and difficult to predict. If the network traffic visibility market does not evolve as we anticipate or if our target end-user customers do not adopt our Traffic Visibility Fabric, our sales will not grow as quickly as anticipated and our stock price could decline.
We are in a new, rapidly evolving category within the network infrastructure industry that focuses on providing organizations with enhanced visibility and control over their networks through the efficient collection and analysis of network traffic. As such, it is difficult to predict important market trends, including how large the network traffic visibility market will be or when and what products end-user customers will adopt. For example, organizations that currently use traditional approaches may believe that these approaches already provide them with sufficient network traffic visibility. Therefore, they may continue spending their network infrastructure budgets on these products and may not adopt our Traffic Visibility Fabric in addition to or in place of such products.
If the market for network traffic visibility does not evolve in the way we anticipate, if organizations do not recognize the benefit our Traffic Visibility Fabric offers in addition to or in place of existing network traffic visibility products, or if we are unable to sell our family of products to end-user customers, then our revenue may not grow as expected or may decline, and our stock price could decline.
New or existing technologies that are perceived to address network traffic visibility or address the need for network traffic visibility in different ways could gain wide adoption and supplant our products, thereby weakening our sales and our financial results.
The introduction of products and services embodying new technologies could render our existing products obsolete or less attractive to end-user customers. Other network traffic visibility technologies exist or could be developed in the future, and our business could be materially negatively affected if such technologies are widely adopted. We may not be able to successfully anticipate or adapt to changing technology or customer requirements on a timely basis, or at all. If we fail to keep up with technological changes or to convince our end-user customers and potential end-user customers of the value of our solutions even in light of new technologies, our business, operating results and financial condition could be materially and adversely affected.
We are dependent on a single product family comprised of a limited number of products.
Our product offering is limited to a single product family comprised of our GigaVUE, GigaSECURE, GigaSMART and GigaTAP products. Historically, we have derived a substantial portion of our revenue from sales of our GigaVUE appliances and related services, and we expect to continue to derive a significant portion of our product revenue from sales of our GigaVUE appliances and related services for the foreseeable future. A decline in the price of these products and related services, whether due to competition or otherwise, or our inability to increase sales of these products, would harm our business and operating results more seriously than it would if we derived significant revenue from a variety of product lines and services. GigaSECURE, GigaSMART, GigaTAP and related support
12
Table of Contents
services represent additional sources of revenue, however, collectively they accounted for a small portion of total revenue for 2011. We expect that this concentration of revenue from a single product family comprised of a limited number of products will continue for the foreseeable future. As a result, our future growth and financial performance will depend heavily on our ability to develop and sell enhanced versions of our GigaVUE appliances. If we fail to deliver product enhancements, new releases or new products that end-user customers want, it will be more difficult for us to succeed.
If we are unable to introduce new products successfully and to make enhancements to existing products, our growth rates would likely decline and our business, operating results and competitive position could suffer.
Our continued success depends on our ability to identify and develop new products and to enhance and improve our existing products, and the acceptance of those products by our existing and target end-user customers. Our growth would likely be adversely affected if:
| Ÿ | we fail to introduce these new products or enhancements; |
| Ÿ | we fail to successfully manage the transition to new products from the products they are replacing; |
| Ÿ | we do not invest our development efforts in appropriate products or enhancements for markets in which we now compete and expect to compete; |
| Ÿ | we fail to predict the demand for new products following their introduction to market; or |
| Ÿ | these new products or enhancements do not attain market acceptance. |
We invest substantial amounts of time and resources in researching and developing new products and enhancing existing products by incorporating additional features, improving functionality and adding other improvements to meet end-user customers’ rapidly evolving demands in our highly competitive industry. Our research and development expenses were $3.9 million, or 24% of our revenue in the three months ended March 31, 2012, $12.5 million, or 18% of our total revenue in 2011, $12.3 million, or approximately 27% of our total revenue in 2010 and $5.0 million, or approximately 16% of our total revenue in 2009.
Our future plans contemplate significant investments in research and development and related product opportunities. We believe that we must continue to dedicate a significant amount of resources to our research and development efforts to maintain our competitive position. However, we often make these investments without being certain that they will result in products or enhancements that the markets will accept or that they will expand our share of those markets.
The introduction of new products or product enhancements may shorten the life cycle of our existing products, or replace sales of some of our current products, thereby offsetting the benefit of even a successful product introduction, and may cause end-user customers to defer purchasing our existing products in anticipation of the new products. This could harm our operating results by decreasing sales, increasing our inventory levels of older products and exposing us to greater risk of product obsolescence. We have also experienced, and may in the future experience, delays in developing and releasing new products and product enhancements. This has led to, and may in the future lead to, delayed sales, increased expenses and lower than anticipated quarterly revenue. In addition, complexity and difficulties in managing product transitions at the end-of-life stage of a product can create excess inventory of components associated with the outgoing products that can lead to increased expenses. Any or all of the above problems could materially harm our business and operating results.
13
Table of Contents
If we are unable to increase market awareness of our company and our products, our revenue may not continue to grow, or may decline.
The network traffic visibility market is nascent and we believe that we have not yet established broad market awareness of our products and services. Market awareness of our value proposition and products and services will be essential to our continued growth and our success, particularly for the service provider and large enterprise markets. If our marketing efforts are unsuccessful in creating market awareness of our company and our products and services, then our business, financial condition and operating results will be adversely affected, and we will not be able to achieve sustained growth.
Our quarterly and annual operating results may vary significantly and be difficult to predict, which may cause our stock price to fluctuate.
Our quarterly and annual operating results have varied historically from period to period, and we expect that they will continue to fluctuate due to a variety of factors, many of which are outside of our control, including:
| Ÿ | fluctuations in demand for our products and services, and the timing of orders from our channel partners and end-user customers; |
| Ÿ | the timing of shipments of products, which may depend on many factors such as inventory and logistics and our ability to ship new products on schedule and accurately forecast inventory requirements; |
| Ÿ | the budgeting cycles and internal purchasing priorities of our end-user customers; |
| Ÿ | seasonal buying patterns of our end-user customers; |
| Ÿ | changes in end-user customer or channel partner requirements or market needs; |
| Ÿ | the mix of products sold and the mix of revenue between products and services; |
| Ÿ | changes in the growth rate of the network traffic visibility market and related markets, such as the network infrastructure market, and the market for network management, analysis, compliance and security tools; |
| Ÿ | our ability to control costs, including operating expenses, the costs of hardware and software components, and other manufacturing costs; |
| Ÿ | our ability to timely develop, introduce and gain market acceptance for new products, technologies and services; |
| Ÿ | price competition; |
| Ÿ | any significant changes in the competitive environment, including the entry of new competitors, and any related discounting of products or services; |
| Ÿ | the timing and execution of product transitions or new product introductions, and related inventory costs; |
| Ÿ | deferral of orders from end-user customers in anticipation of new products or product enhancements announced by us or our competitors; |
| Ÿ | decisions by potential end-user customers to purchase alternative network traffic visibility solutions from their existing network infrastructure vendors or other third parties; |
| Ÿ | our ability to establish and manage our distribution channels, and the effectiveness of any changes we make to our distribution model; |
| Ÿ | the ability of our suppliers and contract manufacturers to provide component parts and finished products in a timely manner; |
14
Table of Contents
| Ÿ | changes in end-user customer renewal rates for our services and our ability to up-sell additional products; |
| Ÿ | general economic conditions, both domestically and in our foreign markets; |
| Ÿ | the timing of revenue recognition for our sales, which may be affected by the mix of sales by our channel partners; and |
| Ÿ | future accounting pronouncements or changes in our accounting policies. |
Any one of the factors above or the cumulative effect of some of the factors referred to above may result in significant fluctuations in our quarterly and annual operating results, including fluctuations in our key metrics. This variability and unpredictability could result in our failure to meet our internal operating plan or the expectations of securities analysts or investors for any period. In addition, a significant percentage of our operating expenses are fixed in nature and based on forecasted revenue trends. Accordingly, in the event of revenue shortfalls, we are generally unable to mitigate the negative impact on margins in the short term. If we fail to meet or exceed such expectations for these or any other reasons, the market price of our shares could fall substantially and we could face costly lawsuits, including securities class action suits.
We compete in highly competitive markets, and competitive pressures from existing and new companies may adversely impact our business and operating results.
The markets in which we compete are highly competitive. We expect competition to intensify in the future as existing competitors bundle new and more competitive offerings with their existing products and services, and as new market entrants introduce new products into our markets. This competition could result in increased pricing pressure, reduced profit margins, increased sales and marketing expenses and our failure to increase, or the loss of, market share, any of which would likely seriously harm our business, operating results and financial condition. If we do not keep pace with product and technology advances and otherwise keep our product offerings competitive, there could be a material and adverse effect on our competitive position, revenue and prospects for growth.
We compete either directly or indirectly with large Ethernet switch vendors, such as Cisco Systems, Inc. and Juniper Networks, Inc., and network management, analysis, compliance and security tool vendors that offer point solutions that address a portion of the issues that we solve. The principal competitive factors in our markets include functionality and performance, price and total cost of ownership, ease of use, flexibility and scalability of deployment, brand awareness, breadth of portfolio, product reliability and quality, interoperability with other products, the extent and speed of user adoption and quality of service, support and fulfillment.
Many of our current and potential competitors are substantially larger and have greater financial, technical, research and development, sales and marketing, manufacturing, distribution and other resources and greater name recognition. We could also face competition from new market entrants, including our joint-development partners or other current technology partners. In addition, many of our existing and potential competitors enjoy substantial competitive advantages, such as:
| Ÿ | longer operating histories; |
| Ÿ | the capacity to leverage their sales efforts and marketing expenditures across a broader portfolio of products; |
| Ÿ | broader distribution and established relationships with channel partners; |
| Ÿ | access to larger customer bases; |
| Ÿ | greater customer support; |
15
Table of Contents
| Ÿ | greater resources to make acquisitions; |
| Ÿ | larger intellectual property portfolios; and |
| Ÿ | the ability to bundle competitive offerings with other products and services. |
As a result, increased competition could result in fewer customer orders, price reductions, reduced operating margins and loss of market share. Our competitors also may be able to provide end-user customers with capabilities or benefits different from or greater than those we can provide in areas such as technical qualifications or geographic presence, or to provide end-user customers a broader range of products, services and prices. In addition, some of our larger potential competitors have substantially broader product offerings and could leverage their relationships based on other products or incorporate functionality into existing products to gain business in a manner that discourages users from purchasing our products, including through selling at zero or negative margins, product bundling or closed technology platforms. These larger potential competitors may also have more extensive relationships within existing and potential end-user customers that provide them with an advantage in competing for business with those end-user customers. In addition, to the extent that one of our competitors establishes or strengthens a cooperative relationship with, or acquires one or more of the network management, analysis, compliance and security tool vendors that we have active and ongoing joint-development relationships with, it could adversely affect our ability to compete. Our ability to compete will depend upon our ability to provide a better solution than our competitors at a competitive price. We may be required to make substantial additional investments in research, development, marketing and sales in order to respond to competition, and there is no assurance that these investments will achieve any returns for us or that we will be able to compete successfully in the future.
We also expect increased competition if our market continues to expand. Conditions in our market could change rapidly and significantly as a result of technological advancements or other factors. In addition, current or potential competitors may be acquired by third parties that have greater resources available. As a result of these acquisitions, our current or potential competitors might take advantage of the greater resources of the larger organization to compete more vigorously or broadly with us.
If we fail to remediate material weaknesses in our internal control over financial reporting or are unable to implement and maintain effective internal control over financial reporting in the future, the accuracy and timeliness of our financial reporting may be adversely affected.
As of March 31, 2012, four material weaknesses existed in our internal control over financial reporting. A material weakness is a deficiency, or a combination of deficiencies, that creates a reasonable possibility that a material misstatement of a company’s annual or interim financial statements will not be prevented or detected on a timely basis.
In connection with the preparation of our interim unaudited consolidated financial statements for the three months ended March 31, 2012, we identified two material weaknesses in our internal control over financial reporting: (i) the lack of adequate controls surrounding the inputs used in assessing the excess and obsolete inventory and (ii) the lack of adequate controls in our contract review process led to a failure to appropriately identify and account for certain provisions within the equity compensation agreements of certain employees for stock options granted to them during the years ended December 31, 2007 and 2008. The first material weakness resulted in an error in our accounting for excess inventory write-downs, and the second resulted in an error related to our accounting for, and income tax treatment of, equity award grants for certain employees in prior periods. We concluded that each of these errors was individually material to the audited consolidated financial statements for the years ended December 31, 2009, 2010 and 2011, and thus restated our 2009, 2010 and 2011 consolidated financial statements to correct for the aforementioned errors.
16
Table of Contents
Furthermore, in connection with the audits of our consolidated financial statements for 2009 and 2010, our independent registered public accounting firm identified two additional material weaknesses: (i) our lack of technically experienced accounting personnel to perform non-routine and complex transactions and (ii) our lack of adequate segregation of duties among the accounting personnel. These two additional material weaknesses continued to exist at December 31, 2011 and March 31, 2012.
We are working to remediate the material weaknesses identified above. We have begun taking steps and plan to take additional steps to remediate the underlying causes of these material weaknesses, primarily through formalizing and enhancing our review procedures. We have hired a number of individuals with appropriate knowledge and ability to fulfill our obligations to comply with the accounting and reporting requirements applicable to public companies, including a new chief financial officer in March 2012, a corporate controller in April 2012 and a general counsel in May 2012. The actions that we are taking are subject to ongoing senior management review, as well as oversight by our audit committee and board of directors. Although we plan to complete this remediation process as quickly as possible, we cannot at this time estimate how long it will take, and our initiatives may not prove to be successful in remediating these material weaknesses.
If we fail to effectively remediate deficiencies in our control environment or are unable to implement and maintain effective internal control over financial reporting to meet the demands that will be placed upon us as a public company, including the requirements of the Sarbanes-Oxley Act, we may be unable to accurately report our financial results, or report them within the timeframes required by law or exchange regulations.
Even if we are able to report our financial statements accurately and in a timely manner, or if we do not make all necessary improvements to address these material weaknesses, continued disclosure of these material weaknesses will be required in future filings with the SEC, which could cause our reputation to be harmed and our stock price to decline.
We have not performed an evaluation of our internal control over financial reporting, such as required by Section 404 of the Sarbanes-Oxley Act, or Section 404, nor have we engaged our independent registered public accounting firm to perform an audit of our internal control over financial reporting as of any balance sheet date reported in our financial statements. Had we performed such an evaluation or had our independent registered public accounting firm performed an audit of our internal control over financial reporting, control deficiencies, including material weaknesses and significant deficiencies, in addition to those discussed above, may have been identified.
Our limited operating history makes it difficult for you to evaluate our current business and future prospects, and may increase the risk of your investment.
We were founded in 2004 and sold our first products commercially in 2005. We have experienced rapid growth since our inception, and we have been increasing the breadth and scope of our product offerings. The majority of our revenue growth, however, has occurred over the past three years. In addition, some of the members of our current management team have only been working together for a short period of time. This limited operating history, as well as the early stage of our relationships with many of our channel partners, makes financial forecasting and evaluation of our business difficult. Furthermore, because we depend in part on the market’s acceptance of our products, it is difficult to evaluate trends that may affect our business. We have encountered and will continue to encounter risks and difficulties frequently experienced by growing companies in rapidly changing industries, such as the risks described in this prospectus. If we do not address these risks successfully, our business and operating results would be adversely affected, and our stock price could decline.
17
Table of Contents
Some of the components and technologies used in our products are purchased and licensed from a single source or a limited number of sources. The loss of any of these suppliers might cause us to incur additional transition costs, result in delays in the manufacturing and delivery of our products, or cause us to carry excess or obsolete inventory and could require us to redesign our products.
Although supplies of our components are generally available from a variety of sources, we currently depend on a single source or a limited number of sources for most components included in our products. For example, the processors and connectors that we use in the products manufactured by Broadcom Corp., Freescale Semiconductor, Ltd. and Molex Inc. are currently available only from a limited number of sources, and neither we nor, to our knowledge, these manufacturers have entered into supply agreements with such sources. We have also entered into license agreements with some of our suppliers for technologies that are used in our products.
As there are no other sources for identical components and technologies, if we lost any of these suppliers, we might not be able to sell our products for a significant period of time, and we could incur significant costs to redesign our hardware and software to incorporate components or technologies from alternative sources or to qualify alternative suppliers. Our reliance on a single source or a limited number of suppliers involves a number of additional risks, including risks related to:
| Ÿ | supplier capacity constraints; |
| Ÿ | price increases; |
| Ÿ | timely delivery; |
| Ÿ | component quality; |
| Ÿ | failure of a key supplier to remain in business and adjust to market conditions; |
| Ÿ | delays in, or the inability to execute on, a supplier roadmap for components and technologies; and |
| Ÿ | natural disasters. |
In addition, for certain components for which there are multiple sources, we are subject to potential price increases and limited availability as a result of market demand for these components. In the past, unexpected demand for computer and network products has caused worldwide shortages of certain electronic parts. If similar shortages occur in the future, our business would be adversely affected. We carry very little inventory of our products, and we and our manufacturer rely on our suppliers to deliver necessary components in a timely manner. We and our manufacturer rely on purchase orders rather than long-term contracts with these suppliers, and as a result we or our manufacturer might not be able to secure sufficient components, even if they were available, at reasonable prices or of acceptable quality to build products in a timely manner and, therefore, might not be able to meet end-user customer demands for our products, which would have a material and adverse effect on our business, operating results and financial condition.
We rely on third-party channel partners to generate a substantial portion of our revenue. If our partners fail to perform, our ability to sell our products and services would be limited, and if we fail to optimize our channel partner model going forward, our operating results would be harmed.
A substantial portion of our revenue is generated through sales by our channel partners, which include distributors and resellers. We depend upon our channel partners to generate most of our sales opportunities and manage the sales process, and in North America we rely on a single distributor, Interlink Communications Systems, Inc. To the extent our channel partners are unsuccessful in selling our products, or we are unable to enter into arrangements with, and retain, a sufficient number of high quality channel partners in each of the regions in which we sell products, and keep them motivated to sell our products, our ability to sell our products and operating results would be harmed. The
18
Table of Contents
termination of our relationship with any significant channel partner may adversely impact our sales and operating results.
We provide sales channel partners with specific programs to assist them in selling our products, but there can be no assurance that these programs will be effective. Our channel partners may be unsuccessful in marketing, selling and supporting our products and services. Our channel partners generally do not have minimum purchase requirements. Our agreements with our channel partners are generally non-exclusive and so they may also market, sell and support products and services that are competitive with ours, and may devote more resources to the marketing, sales and support of such products. They may have incentives to promote our competitors’ products to the detriment of our own. As is typical in our industry, our channel partners have the ability to terminate their respective relationships with us with limited notice and with limited or no penalty and may cease selling our products altogether. We cannot assure you that we will retain these channel partners or that we will be able to secure additional or replacement channel partners. The loss of one or more of our significant channel partners could harm our operating results.
As we add additional channel partners, particularly in North America where we currently rely on a single distributor, we may not be able enter into arrangements on as favorable terms, including with respect to pricing, which could have a negative impact on our margins. In addition, any new channel partner would require comprehensive training and may take several months or more to achieve productivity. Our channel partner sales structure could subject us to lawsuits, potential liability and reputational harm if, for example, any of our channel partners misrepresents the functionality of our products or services to end-user customers or our channel partners violate laws or our corporate policies. If we fail to optimize our channel partner model or fail to manage existing sales channels, our business and operating results would be materially and adversely affected.
We currently rely on contract manufacturers to manufacture our products, and our failure to manage our relationship with our contract manufacturers successfully could negatively impact our business.
We rely on a limited number of contract manufacturers to manufacture substantially all of our products, and rely on a sole-source manufacturer for certain of our product modules. Our reliance on these contract manufacturers reduces our control over the assembly process, exposing us to risks, including reduced control over quality assurance, production costs and product supply. If we fail to manage our relationship with these contract manufacturers effectively, or if these contract manufacturers experience delays, disruptions, capacity constraints or quality control problems in their operations, our ability to ship products to our end-user customers could be impaired and our competitive position and reputation could be harmed. In addition, any adverse change in our manufacturers’ financial or business condition could disrupt our ability to supply quality products to our end-user customers. If we are required to change contract manufacturers or assume internal manufacturing operations, we may lose revenue, incur increased costs and damage our customer relationships. In addition, qualifying a new contract manufacturer and commencing production can be an expensive and lengthy process. If we experience increased demand that our contract manufacturers are unable to fulfill, or if they are unable to provide us with adequate supplies of high-quality products for any other reason, we could experience a delay in our order fulfillment, and our business, operating results and financial condition would be adversely affected.
We rely on the availability of licenses to third-party software and other intellectual property.
Many of our products and services include software or other intellectual property licensed from third parties, and we otherwise use software and other intellectual property licensed from third parties in our business. This exposes us to risks over which we may have little or no control. For example, a licensor may have difficulties keeping up with technological changes or may stop supporting the
19
Table of Contents
software or other intellectual property that it licenses to us. Also, it will be necessary in the future to renew licenses, expand the scope of existing licenses or seek new licenses, relating to various aspects of these products and services, or otherwise relating to our business, which may result in increased license fees. There can be no assurance that the necessary licenses will be available on acceptable terms, if at all. In addition, a third party may assert that we or our end-user customers are in breach of the terms of a license, which could, among other things, give such third party the right to terminate a license or seek damages from us, or both. The inability to obtain or maintain certain licenses or other rights or to obtain or maintain such licenses or rights on favorable terms, or the need to engage in litigation regarding these matters, could result in delays in releases of products and services, and could otherwise disrupt our business, until equivalent technology can be identified, licensed or developed, if at all, and integrated into our products and services or otherwise in the conduct of our business. Any of these events could have a material adverse effect on our business, operating results and financial condition. Moreover, the inclusion in our products and services of software or other intellectual property licensed from third parties on a nonexclusive basis may limit our ability to differentiate our products from those of our competitors.
Failure to protect our proprietary technology and intellectual property rights could substantially harm our business and operating results.
The success of our business depends on our ability to protect and enforce our trade secrets, trademarks, copyrights, patents and other intellectual property rights. We attempt to protect our intellectual property under patent, trademark, copyright and trade secret laws, and through a combination of confidentiality procedures, contractual provisions and other methods, all of which offer only limited protection.
We currently have eight issued patents in the United States, but this number is relatively small in comparison to some of our competitors and potential competitors. As of March 31, 2012, we had 18 pending U.S. patent applications, and may file additional patent applications in the future. The process of obtaining patent protection is expensive and time-consuming, and we may not be able to prosecute all necessary or desirable patent applications at a reasonable cost or in a timely manner. We may choose not to seek patent protection for certain innovations and may choose not to pursue patent protection in certain jurisdictions. Furthermore, it is possible that our patent applications may not issue as granted patents, that the scope of our issued patents will be insufficient or not have the coverage originally sought, that our issued patents will not provide us with any competitive advantages, and that our patents and other intellectual property rights may be challenged by others or invalidated through administrative process or litigation. In addition, issuance of a patent does not guarantee that we have an absolute right to practice the patented invention, or that we have the right to exclude others from practicing the claimed invention. As a result, we may not be able to obtain adequate patent protection or to enforce our issued patents effectively.
In addition to patented technology, we rely on our unpatented proprietary technology and trade secrets. Despite our efforts to protect our proprietary technology and trade secrets, unauthorized parties may attempt to misappropriate, reverse engineer or otherwise obtain and use them. The contractual provisions that we enter into with employees, consultants, partners, vendors and customers may not prevent unauthorized use or disclosure of our proprietary technology or intellectual property rights and may not provide an adequate remedy in the event of unauthorized use or disclosure of our proprietary technology or intellectual property rights. Moreover, policing unauthorized use of our technologies, products and intellectual property is difficult, expensive and time-consuming, particularly in foreign countries where the laws may not be as protective of intellectual property rights as those in the United States and where mechanisms for enforcement of intellectual property rights may be weak. We may be unable to determine the extent of any unauthorized use or infringement of our products, technologies or intellectual property rights.
20
Table of Contents
From time to time, legal action by us may be necessary to enforce our patents and other intellectual property rights, to protect our trade secrets, to determine the validity and scope of the intellectual property rights of others or to defend against claims of infringement or invalidity. Such litigation could result in substantial costs and diversion of resources and could negatively affect our business, operating results, financial condition and cash flows. If we are unable to protect our intellectual property rights, we may find ourselves at a competitive disadvantage to others who need not incur the additional expense, time and effort required to create the innovative products that have enabled us to be successful to date.
Assertions by third parties of infringement or other violations by us of their intellectual property rights, or other lawsuits asserted against us, could result in significant costs and substantially harm our business and operating results.
Patent and other intellectual property disputes are common in the network infrastructure industry. Some companies in the network infrastructure industry, including some of our competitors, own large numbers of patents, copyrights, trademarks and trade secrets, which they may use to assert claims against us. Third parties may in the future assert claims of infringement, misappropriation or other violations of intellectual property rights against us. They may also assert such claims against our end-user customers or channel partners whom we typically indemnify against claims that our products infringe, misappropriate or otherwise violate the intellectual property rights of third parties. As the number of products and competitors in our market increase and overlaps occur, claims of infringement, misappropriation and other violations of intellectual property rights may increase. Any claim of infringement, misappropriation or other violation of intellectual property rights by a third party, even those without merit, could cause us to incur substantial costs defending against the claim and could distract our management from our business.
The patent portfolios of our most significant competitors and potential competitors are larger than ours. This disparity between our patent portfolio and the patent portfolios of our most significant competitors may increase the risk that they may sue us for patent infringement and may limit our ability to counterclaim for patent infringement or settle through patent cross-licenses. In addition, future assertions of patent rights by third parties, and any resulting litigation, may involve patent holding companies or other adverse patent owners who have no relevant product revenue and against whom our own patents may therefore provide little or no deterrence or protection. We cannot assure you that we are not infringing or otherwise violating any third-party intellectual property rights.
An adverse outcome of a dispute may require us to pay substantial damages including treble damages if we are found to have willfully infringed a third party’s patents or copyrights; cease making, licensing or using solutions that are alleged to infringe or misappropriate the intellectual property of others; expend additional development resources to attempt to redesign our products or services or otherwise to develop non-infringing technology, which may not be successful; enter into potentially unfavorable royalty or license agreements in order to obtain the right to use necessary technologies or intellectual property rights; and indemnify our partners and other third parties. Royalty or licensing agreements, if required or desirable, may be unavailable on terms acceptable to us, or at all, and may require significant royalty payments and other expenditures. In addition, some licenses may be non-exclusive, and therefore our competitors may have access to the same technology licensed to us. Any of these events could seriously harm our business, financial condition and operating results.
In addition, we may, from time to time, be a party to other lawsuits in the normal course of our business. Litigation in general, and intellectual property and securities litigation in particular, can be expensive, lengthy and disruptive to normal business operations. Moreover, the results of complex legal proceedings are difficult to predict. Responding to lawsuits is likely to be expensive and time consuming for us, and could divert our management’s attention from our business. An unfavorable resolution of any lawsuit could adversely affect our business, operating results or financial condition.
21
Table of Contents
Our use of open source and third-party technology could impose limitations on our ability to commercialize our software.
We use open source software in our products, and although we monitor our use of open source software to avoid subjecting our products to conditions we do not intend, the terms of many open source licenses have not been interpreted by U.S. courts. As a result, there is a risk that these licenses could be construed in a way that could impose unanticipated conditions or restrictions on our ability to commercialize our products. In such an event, we could be required to seek licenses from third parties to continue offering our products, to make our proprietary code generally available in source code form, to re-engineer our products or to discontinue the sale of our products if re-engineering could not be accomplished on a timely basis, any of which could adversely affect our business, operating results and financial condition.
Adverse economic conditions or reduced information technology and network infrastructure spending may adversely impact our business and operating results.
Our business depends on the overall demand for information technology, network infrastructure and the market for network analysis, compliance and security tools. In addition, the purchase of our products and services is often discretionary and may involve a significant commitment of capital and other resources. Weak global economic conditions, or a reduction in information technology and network infrastructure spending even if economic conditions improve, could adversely impact our business, financial condition and operating results in a number of ways, including longer sales cycles, lower prices for our products and services, higher default rates among our distributors, reduced unit sales and lower or no growth.
We depend on growth in markets relating to network security, management and analysis, and lack of growth or contraction in one or more of these markets could have a material adverse effect on our sales and financial condition.
Demand for our products is linked to, among other things, growth in the size and complexity of network infrastructures and the demand for networking technologies addressing the security, management and analysis of such infrastructures. If this demand declines, our sales, profitability and financial condition would be materially adversely affected. Segments of the network infrastructure industry have in the past experienced significant economic downturns. The occurrence of any of these factors in the markets relating to network security, management and analysis could materially adversely affect our sales, profitability and financial condition. Furthermore, these markets are dynamic and evolving. Our future financial performance will depend in large part on continued growth in the number of organizations investing in their network infrastructure and the amount they commit to such investments. The market for network infrastructure may not continue to grow at historic rates, or at all. If this market fails to grow, or grows more slowly than we currently anticipate, our sales and profitability could be adversely affected.
The average selling price of our products has decreased from time to time, and may decrease in the future, which may negatively impact gross profits.
From time to time, the average selling price of our products has decreased. In the future, it is possible that the average selling prices of our products will decrease in response to competitive pricing pressures, increased sales discounts, new product introductions by us or our competitors or other factors. Such pricing pressures may also be dependent upon the mix of products sold, the mix of revenue between products and services and the degree to which products and services are bundled and sold together for a package price. Therefore, in order to maintain our profitability, we must develop and introduce new products and product enhancements on a timely basis and continually reduce our product costs. Our failure to do so would cause our net revenue and gross profits to decline, which
22
Table of Contents
would harm our business and operating results. In addition, we may experience substantial period-to-period fluctuations in future operating results in the event we experience an erosion of our average selling prices.
Managing inventory of our products and product components is complex. Insufficient inventory may result in lost sales opportunities or delayed revenue, while excess inventory may harm our gross margins.
Our channel partners may increase orders during periods of product shortages, cancel orders if their inventory is too high, return product or take advantage of price protection (if any) or delay orders in anticipation of new products. They also may adjust their orders in response to the supply of our products and the products of our competitors that are available to them and in response to seasonal fluctuations in customer demand. Furthermore, if the time required to manufacture certain products or ship products increases for any reason, this could result in inventory shortfalls. In addition, for those channel partners that have rights of return, inventory held by such channel partners affects our operating results. Our inventory management systems and related supply chain visibility tools may be inadequate to enable us to effectively manage inventory. Inventory management remains an area of focus as we balance the need to maintain inventory levels that are sufficient to ensure competitive lead times against the risk of inventory obsolescence because of rapidly changing technology and customer requirements. For example, we identified a lack of adequate controls over the process for accounting for inventory write-downs and inventory purchase commitments as of December 31, 2011 and March 31, 2012, and as we adopted new processes to review our inventory reserves in May 2012, we identified that our inventory balances were overstated as of December 31, 2011. If we ultimately determine that we have excess inventory, we may have to reduce our prices and write-down inventory, which in turn could result in lower gross margins. Alternatively, insufficient inventory levels may lead to shortages that result in delayed revenue or loss of sales opportunities altogether as potential end-user customers turn to competitors’ products that are readily available. If we are unable to effectively manage our inventory and that of our distribution partners, our operating results could be adversely affected.
We rely on revenue from support services which may decline, and because we recognize revenue from support services over the term of the relevant service period, downturns or upturns in sales of support services are not immediately reflected in full in our operating results.
Although our services revenue has historically accounted for a small percentage of our total revenue, it may become a more meaningful part of revenue over time. Sales of new or renewal services contracts may decline and fluctuate as a result of a number of factors, including end-user customers’ level of satisfaction with our products and services, the prices of our products and services, the prices of products and services offered by our competitors or reductions in our end-user customers’ spending levels. If our sales of new or renewal services contracts decline, our revenue and revenue growth may decline and our business will suffer. In addition, we recognize services revenue over the term of the relevant service period, which is typically twelve months. As a result, some of the revenue we report each quarter is the recognition of deferred revenue from services contracts entered into during previous quarters. Consequently, a decline in new or renewed service contracts in any one quarter will not be fully reflected in revenue in that quarter but will negatively affect our revenue in future quarters. Accordingly, the effect of significant downturns in new or renewed sales of our services is not reflected in full in our operating results until future periods. Our services revenue also makes it difficult for us to rapidly increase our revenue through additional service sales in any period, as revenue from new and renewal service contracts must be recognized over the applicable service period. Furthermore, increases in the average term of services contracts would result in revenue for services contracts being recognized over longer periods of time.
23
Table of Contents
Our sales cycles can be long and unpredictable, and our sales efforts require considerable time and expense.
Our sales efforts involve educating our end-user customers about the use and benefits of our products, including their technical capabilities. End-user customers often undertake an evaluation and testing process that can result in a lengthy sales cycle. Also, as our distribution strategy has evolved into more of a channel model, utilizing distributors, the level of variability in the length of sales cycle across transactions has increased and made it more difficult to predict the timing of many of our sales transactions. We spend substantial time and resources on our sales efforts without any assurance that our efforts will produce any sales. In addition, product purchases are frequently subject to budget constraints, multiple approvals and unplanned administrative, processing and other delays. These factors, among others, could result in long and unpredictable sales cycles. We sell our Traffic Visibility Fabric primarily to enterprise IT departments and service providers. The length of our products’ sales cycles typically ranges from three to six months but can be more than six months, with sales cycles involving service providers taking significantly longer to complete. To the extent that the mix of our future sales shifts in the direction of service providers, the average length of our sales cycles will increase. As a result of these lengthy and uncertain sales cycles of our products, it is difficult for us to predict when end-user customers may purchase and accept products from us and as a result, our operating results may vary significantly and may be adversely affected.
Our business and operations have experienced rapid growth, and if we do not appropriately manage any future growth, or are unable to improve our systems and processes, our operating results will be negatively affected.
We have experienced rapid growth over the last several years, which has placed a strain on our management, administrative, operational and financial infrastructure. In addition, some of the members of our current management team have only been working together for a short period of time. We also anticipate that additional investments in key channel partnerships and direct-sales personnel, as well as infrastructure and research and development spending, will be required to:
| Ÿ | scale our operations and increase productivity; |
| Ÿ | address the needs of our end-user customers; |
| Ÿ | further develop and enhance our products and services; |
| Ÿ | develop new technology; and |
| Ÿ | expend our markets and opportunity under management, including into new industry verticals and geographic areas. |
Our success will depend in part upon our ability to manage our growth effectively. To do so, we must continue to increase the productivity of our existing employees and to hire, train and manage new employees as needed. To manage domestic and international growth of our operations and personnel, we will need to continue to improve our operational, financial and management controls and our reporting processes and procedures, and implement more extensive and integrated financial and business information systems. These additional investments will increase our operating costs, which will make it more difficult for us to offset any future revenue shortfalls by reducing expenses in the short term. Moreover, if we fail to scale our operations successfully, our business and operating results could be materially and adversely affected.
We are dependent on the continued services and performance of our senior management and other key employees, the loss of any of whom could adversely affect our business, operating results and financial condition.
Our future performance depends on the continued services and contributions of our senior management and other key employees to execute on our business plan, and to identify and
24
Table of Contents
pursue new opportunities and product innovations. The loss of services of senior management or other key employees, particularly Ted C. Ho, one of our founders and our chief executive officer, could significantly delay or prevent the achievement of our development and strategic objectives. In addition, some of the members of our current management team have only been working together for a short period of time. The loss of the services of our senior management or other key employees for any reason could adversely affect our business, financial condition and operating results.
If we are unable to hire, retain and motivate qualified personnel, our business would suffer.
Our future success depends, in part, on our ability to continue to attract and retain highly skilled personnel. The loss of the services of any of our key personnel, the inability to attract or retain qualified personnel or delays in hiring required personnel, particularly in engineering and sales, may seriously harm our business, financial condition and operating results. None of our key employees has an employment agreement for a specific term, and any of our employees may terminate their employment at any time. Our ability to continue to attract and retain highly skilled personnel will be critical to our future success. Competition for highly skilled personnel is frequently intense, especially in the San Francisco Bay Area, the location in which we have a substantial presence and need for highly-skilled personnel. In addition, a large portion of our employee base is substantially vested in significant stock option grants and performance units under our 2009 Performance Unit Plan. The ability to either exercise those options and sell their stock in a public market after the completion of this offering, or the fact that the performance units will be paid out following the closing of the offering, may lead to a larger than normal turnover rate. We intend to issue stock options as a key component of our overall compensation and employee attraction and retention efforts. In addition, we are required under U.S. generally accepted accounting principles, or GAAP, to recognize compensation expense in our operating results for employee stock-based compensation under our equity grant programs, which may negatively impact our operating results and may increase the pressure to limit share-based compensation. We may not be successful in attracting, assimilating or retaining qualified personnel to fulfill our current or future needs. Also, to the extent we hire personnel from competitors, we may be subject to allegations that they have been improperly solicited or divulged proprietary or other confidential information.
Defects in our products could harm our reputation and business.
Our products are complex and have contained and may contain undetected defects or errors, especially when first introduced or when new versions are released. Defects in our products may impede or block network traffic or cause our products to fail to provide network traffic visibility as intended. Further, defects in our products may lead to the impairment of tools that rely on data. Defects in our products may lead to product returns and require us to implement design changes or software updates.
Any defects or errors in our products, or the perception of such defects or errors, could result in:
| Ÿ | expenditure of significant financial and product development resources in efforts to analyze, correct, eliminate or work around errors or defects; |
| Ÿ | loss of existing or potential end-user customers or channel partners; |
| Ÿ | delayed or lost revenue; |
| Ÿ | delay or failure to attain market acceptance; |
| Ÿ | delay in the development or release of new products or services; |
| Ÿ | negative publicity, which will harm our reputation; |
| Ÿ | warranty claims against us, which could result in an increase in our provision for doubtful accounts; |
25
Table of Contents
| Ÿ | an increase in collection cycles for accounts receivable or the expense and risk of litigation; and |
| Ÿ | harm to our operating results. |
Although we have limitation of liability provisions in our standard terms and conditions of sale, they may not fully or effectively protect us from claims as a result of federal, state or local laws or ordinances or unfavorable judicial decisions in the United States or other countries. The sale and support of our products also entail the risk of product liability claims. We maintain insurance to protect against certain claims associated with the use of our products, but our insurance coverage may not adequately cover any claim asserted against us. In addition, even claims that ultimately are unsuccessful could result in our expenditure of funds in litigation and divert management’s time and other resources.
Our long-term success depends, in part, on our ability to expand the sales of our products to end-user customers located outside of the United States, and therefore our business will be susceptible to risks associated with international operations.
While we currently maintain limited operations outside of the United States, we intend to expand these operations in the future. We have limited experience operating in foreign jurisdictions. Our inexperience in operating our business outside of the United States increases the risk that any international expansion efforts we may undertake will not be successful. In addition, conducting and expanding international operations subjects us to new risks that we have not generally faced in the United States. These include:
| Ÿ | exposure to foreign currency exchange rate risk; |
| Ÿ | difficulties in managing and staffing international operations; |
| Ÿ | the increased travel, infrastructure and legal compliance costs associated with multiple international locations; |
| Ÿ | potentially adverse tax consequences; |
| Ÿ | the burdens of complying with a wide variety of foreign laws, including trade barriers, and different legal standards; |
| Ÿ | increased financial accounting and reporting burdens and complexities; |
| Ÿ | political, social and economic instability abroad, terrorist attacks and security concerns in general; and |
| Ÿ | reduced or varied protection for intellectual property rights in some countries. |
The occurrence of any one of these risks could negatively affect our international business and, consequently, our business, operating results and financial condition generally.
We are dependent on various IT systems, and failures of or interruptions to those systems could harm our business.
Many of our business processes depend upon our IT systems, the systems and processes of third parties and on interfaces with the systems of third parties. For example, we rely on Salesforce.com, Inc. for our customer relationship management system. If those systems fail or are interrupted, or if our ability to connect to or interact with one or more networks is interrupted, our processes may function at a diminished level or not at all. This would harm our ability to ship products, and our financial results would likely be harmed.
In addition, reconfiguring our IT systems or other business processes in response to changing business needs may be time consuming and costly. To the extent this impacted our ability to react timely to specific market or business opportunities, our financial results would likely be harmed.
26
Table of Contents
Failure to comply with laws and regulations could harm our business.
Our business is subject to regulation by various federal, state, local and foreign governmental agencies, including agencies responsible for monitoring and enforcing employment and labor laws, workplace safety, product safety, environmental laws, consumer protection laws, anti-bribery laws, import/export controls, federal securities laws and tax laws and regulations. In certain jurisdictions, these regulatory requirements may be more stringent than in the United States. Noncompliance with applicable regulations or requirements could subject us to investigations, sanctions, mandatory product recalls, enforcement actions, disgorgement of profits, fines, damages, civil and criminal penalties or injunctions. If any governmental sanctions are imposed, or if we do not prevail in any possible civil or criminal litigation, our business, operating results and financial condition could be materially adversely affected. In addition, responding to any action will likely result in a significant diversion of management’s attention and resources and an increase in professional fees. Enforcement actions and sanctions could harm our business, operating results and financial condition.
Governmental regulations affecting the import or export of products could negatively affect our revenue.
The U.S. and various foreign governments have imposed controls, export license requirements and restrictions on the import or export of some technologies, especially encryption technology. In addition, from time to time, governmental agencies have proposed additional regulation of encryption technology, such as requiring the escrow and governmental recovery of private encryption keys. Governmental regulation of encryption technology and regulation of imports or exports, or our failure to obtain required import or export approval for our products, could harm our international and domestic sales and adversely affect our revenue. In addition, failure to comply with such regulations could result in penalties, costs and restrictions on export privileges, which would harm our operating results.
Due to the global nature of our business, we could be adversely affected by violations of the U.S. Foreign Corrupt Practices Act, the U.K. Bribery Act, or similar anti-bribery laws in other jurisdictions in which we operate, and various international trade and export laws.
The global nature of our business creates various domestic and local regulatory challenges. The U.S. Foreign Corrupt Practices Act, or the FCPA, the U.K. Bribery Act 2010, or the U.K. Bribery Act, and similar anti-bribery laws in other jurisdictions generally prohibit U.S.-based companies and their intermediaries from making improper payments to non-U.S. officials for the purpose of obtaining or retaining business. In addition, U.S. based companies are required to maintain records that accurately and fairly represent their transactions and have an adequate system of internal accounting controls. We operate in areas of the world that experience corruption by government officials to some degree and, in certain circumstances, compliance with anti-bribery laws may conflict with local customs and practices. Our global operations require us to import and export to and from several countries, which geographically stretches our compliance obligations. In addition, changes in such laws could result in increased regulatory requirements and compliance costs which could adversely affect our business, financial condition and results of operations. We cannot assure that our employees or other agents will not engage in prohibited conduct and render us responsible under the FCPA or the U.K. Bribery Act. If we are found to be in violation of the FCPA, the U.K. Bribery Act or other anti-bribery laws (either due to acts or inadvertence of our employees, or due to the acts or inadvertence of others), we could suffer criminal or civil penalties or other sanctions, which could have a material adverse effect on our business.
We may expand through acquisitions of, or investments in, other companies, each of which may divert our management’s attention, resulting in additional dilution to our stockholders and consumption of resources that are necessary to sustain and grow our business.
Our business strategy may, from time to time, include acquiring complementary products, technologies or businesses. We also may enter into relationships with other businesses in order to expand our product offerings, which could involve preferred or exclusive licenses, additional channels
27
Table of Contents
of distribution or discount pricing or investments in other companies. Negotiating these transactions can be time consuming, difficult and expensive, and our ability to close these transactions may be subject to third-party approvals, such as government regulation, which are beyond our control. Consequently, we can make no assurance that these transactions, once undertaken and announced, will close.
An acquisition or investment may result in unforeseen operating difficulties and expenditures. In particular, we may encounter difficulties assimilating or integrating the businesses, technologies, products, personnel or operations of the acquired companies, particularly if the key personnel of the acquired business choose not to work for us, and we may have difficulty retaining the customers of any acquired business. Acquisitions may also disrupt our ongoing business, divert our resources and require significant management attention that would otherwise be available for development of our business. Any acquisition or investment could expose us to unknown liabilities. Moreover, we cannot assure you that the anticipated benefits of any acquisition or investment would be realized or that we would not be exposed to unknown liabilities. An acquisition could also result in dilutive issuances of our equity securities, the incurrence of debt, contingent liabilities, amortization expenses or the write-off of goodwill. These challenges related to acquisitions or investments could adversely affect our business, operating results and financial condition.
If our estimates or judgments relating to our critical accounting policies are based on assumptions that change or prove to be incorrect, our operating results could fall below expectations of securities analysts and investors, resulting in a decline in our stock price.
The preparation of financial statements in conformity with GAAP requires management to make estimates and assumptions that affect the amounts reported in the consolidated financial statements and accompanying notes. We base our estimates on historical experience and on various other assumptions that we believe to be reasonable under the circumstances, as provided in the section titled “Management’s Discussion and Analysis of Financial Condition and Results of Operations,” the results of which form the basis for making judgments about the carrying values of assets, liabilities and equity, and the amount of revenue and expenses that are not readily apparent from other sources. Our operating results may be adversely affected if our assumptions change or if actual circumstances differ from those in our assumptions, which could cause our operating results to fall below the expectations of securities analysts and investors, resulting in a decline in our stock price. Significant assumptions and estimates used in preparing our consolidated financial statements include those related to revenue recognition, stock-based compensation expense, long-lived assets, excess and obsolete inventory write-downs, warranty reserves and accounting for income taxes.
If we fail to comply with environmental requirements, our business, financial condition, operating results and reputation could be adversely affected.
We are subject to various environmental laws and regulations including laws governing the hazardous material content of our products and laws relating to the collection of and recycling of electrical and electronic equipment. Examples of these laws and regulations include the European Union, or EU, Restrictions of Hazardous Substances Directive, or RoHS, and the EU Waste Electrical and Electronic Equipment Directive, or WEEE, as well as the implementing legislation of the EU member states. Similar laws and regulations have been passed or are pending in China, South Korea, Norway and Japan and may be enacted in other regions, including in the United States, and we are, or may in the future be, subject to these laws and regulations.
The EU RoHS and the similar laws of other jurisdictions ban the use of certain hazardous materials such as lead, mercury and cadmium in the manufacture of electrical equipment, including our products. We do not currently have the policies and procedures in place to ensure that the manufacturer of our physical appliances and major component part suppliers comply with the EU RoHS requirements. In addition, if there are changes to this or other laws (or their interpretation) or if new similar laws are passed in other jurisdictions, we may be required to reengineer our products to
28
Table of Contents
use components compatible with these regulations. This reengineering and component substitution could result in additional costs to us or disrupt our operations or logistics.
The WEEE Directive requires electronic goods producers to be responsible for the collection, recycling and treatment of such products. Changes in interpretation of the directive may cause us to incur costs or have additional regulatory requirements to meet in the future in order to comply with this directive, or with any similar laws adopted in other jurisdictions.
Our failure to comply with past, present and future similar laws could result in reduced sales of our products, substantial product inventory write-offs, reputational damage, penalties and other sanctions, which could harm our business and financial condition. We also expect that our products will be affected by new environmental laws and regulations on an ongoing basis. To date, our expenditures for environmental compliance have not had a material impact on our results of operations or cash flows and, although we cannot predict the future impact of such laws or regulations, they will likely result in additional costs and may increase penalties associated with violations or require us to change the content of our products or how they are manufactured, which could have a material adverse effect on our business, operating results and financial condition.
Our business is subject to the risks of earthquakes, fire, power outages, floods and other catastrophic events, and to interruption by manmade problems such as terrorism.
A significant natural disaster, such as an earthquake, fire or a flood, or a significant power outage could have a material adverse impact on our business, operating results and financial condition. Our corporate headquarters are located in the San Francisco Bay Area, a region known for seismic activity. In addition, natural disasters could affect our manufacturing vendors or logistics providers’ ability to perform services such as manufacturing products on a timely basis and assisting with shipments on a timely basis. In the event our service providers’ information technology systems or manufacturing or logistics abilities are hindered by any of the events discussed above, shipments could be delayed, resulting in missing financial targets, such as revenue and shipment targets, for a particular quarter. Further, if a natural disaster occurs in a region from which we derive a significant portion of our revenue, end-user customers in that region may delay or forego purchases of our products, which may materially and adversely impact our operating results for a particular period. In addition, acts of terrorism could cause disruptions in our business or the business of our manufacturer, logistics providers, partners, end-user customers or the economy as a whole. Given our typical concentration of sales at each quarter end, any disruption in the business of our manufacturer, logistics providers, partners or customers that impacts sales at the end of our quarter could have a significant adverse impact on our quarterly results. All of the aforementioned risks may be augmented if the disaster recovery plans for us and our suppliers prove to be inadequate. To the extent that any of the above results in delays or cancellations of customer orders, or delays in the manufacture, deployment or shipment of our products, our business, financial condition and operating results would be adversely affected.
If our end-user customers are not satisfied with our technical support or professional services, they may choose not to purchase our products and services or to renew service contracts, either of which would adversely impact our business and operating results.
Our business relies, in part, on our end-user customers’ satisfaction with the technical support and professional consulting services we provide to support our products. If we fail to provide technical support services that are responsive, satisfy our end-user customers’ expectations and resolve issues that they encounter with our products and services, then they may elect not to purchase or renew annual maintenance and support contracts and they may choose not to purchase additional products and services from us. Accordingly, our failure to provide satisfactory technical support or professional services could have a material and adverse effect on our business and operating results.
29
Table of Contents
Risks Relating to Owning Our Common Stock and this Offering
An active trading market for our common stock may never develop or be sustained.
We have submitted an application to have our common stock listed on the under the symbol “GIMO.” However, we cannot assure you that our common stock will be approved for listing on the or, if approved, that an active trading market for our common stock will develop on that exchange or elsewhere or, if developed, that any market will be sustained. Accordingly, we cannot assure you of the likelihood that an active trading market for our common stock will develop or be maintained, the liquidity of any trading market, your ability to sell your shares of common stock when desired or the prices that you may obtain for your shares.
Our share price may be volatile, and you may be unable to sell your shares at or above the offering price.
Technology stocks have historically experienced high levels of volatility. The trading price of our common stock is likely to be highly volatile and could be subject to wide fluctuations in response to various factors, some of which are beyond our control and may not be related to our operating performance. These fluctuations could cause you to lose all or part of your investment in our common stock. Factors that may cause the market price of our common stock to fluctuate include:
| Ÿ | price and volume fluctuations in the overall stock market from time to time; |
| Ÿ | significant volatility in the market price and trading volume of technology companies in general, and of companies in our industry; |
| Ÿ | actual or anticipated changes in our results of operations or fluctuations in our operating results; |
| Ÿ | whether our operating results meet the expectations of securities analysts or investors; |
| Ÿ | actual or anticipated changes in the expectations of investors or securities analysts; |
| Ÿ | actual or anticipated developments in our competitors’ businesses or the competitive landscape generally; |
| Ÿ | litigation involving us, our industry or both; |
| Ÿ | regulatory developments in the United States, foreign countries or both; |
| Ÿ | general economic conditions and trends; |
| Ÿ | major catastrophic events; |
| Ÿ | sales of large blocks of our stock; or |
| Ÿ | departures of key personnel. |
In addition, if the market for technology stocks or the stock market in general experience a loss of investor confidence, the trading price of our common stock could decline for reasons unrelated to our business, operating results or financial condition. The trading price of our common stock might also decline in reaction to events that affect other companies in our industry even if these events do not directly affect us.
In the past, following periods of volatility in the market price of a company’s securities, securities class action litigation has often been brought against that company. If our stock price is volatile, we may become the target of securities litigation. Securities litigation could result in substantial costs and divert our management’s attention and resources from our business, and this could have a material adverse effect on our business, operating results and financial condition.
30
Table of Contents
Sales of outstanding shares of our common stock into the market in the future could cause the market price of our common stock to drop significantly.
If our existing stockholders sell, or indicate an intent to sell, substantial amounts of our common stock in the public market after the contractual lock-up and other legal restrictions on resale lapse, the trading price of our common stock could decline. After this offering, approximately shares of common stock will be outstanding. Of these shares, the shares of our common stock to be sold in this offering will be freely tradable, unless such shares are held by “affiliates,” as that term is defined in Rule 144 of the Securities Act of 1933, as amended, or the Securities Act.
Our directors, officers and holders of substantially all of our capital stock and securities convertible into capital stock are subject to a 180-day contractual lock-up that prevents them from selling their shares prior to the expiration of this lock-up period. Goldman, Sachs & Co. may, in its sole discretion, permit shares subject to this lock-up to be sold prior to its expiration. See the section titled “Shares Eligible for Future Sale — Lock-Up Agreements” for additional information.
At various times after the lock-up agreements pertaining to this offering expire, up to an additional shares will be eligible for sale in the public market, of which are, based on the number of shares outstanding as of March 31, 2012 and after giving effect to the exercise of options and the sale of shares by the selling stockholders in connection with the completion of this offering, held by directors, executive officers and other affiliates and will be subject to volume limitations under Rule 144 under the Securities Act, as amended, and various vesting agreements.
In addition, as of March 31, 2012, 5,901,516 shares of common stock were reserved for future issuance under our stock plan and upon the consummation of this offering options to purchase approximately shares of our common stock will be reserved for future issuance under our 2012 Equity Incentive Plan. If these additional shares are sold, or if it is perceived that they will be sold, in the public market, the trading price of our common stock could decline. See the section titled “Shares Eligible for Future Sale” for additional information.
If you purchase shares of our common stock in this offering, you will experience substantial and immediate dilution.
If you purchase shares of our common stock in this offering, you will experience substantial and immediate dilution of $ per share, based on an assumed initial public offering price of $ per share, which is the midpoint of the range as reflected on the cover page of this prospectus, because the price that you pay will be substantially greater than the net tangible book value per share of the common stock that you acquire. This dilution is due in large part to the fact that our founders and earlier investors paid substantially less than the initial public offering price when they purchased their shares of our capital stock. In addition, investors who purchase shares in this offering will contribute approximately % of the total amount of equity capital raised by us through the date of this offering, but will only own approximately % of our outstanding shares. In addition, we have issued options to acquire our common stock at prices significantly below the initial public offering price. To the extent outstanding options are ultimately exercised, there will be further dilution to investors in this offering.
If securities analysts do not publish research or reports about our business, or if they downgrade our stock, the price of our stock could decline.
The trading market for our common stock could be influenced by any research and reports that securities or industry analysts publish about us or our business. We do not currently have, and may never obtain research coverage by securities and industry analysts. If no securities or industry analysts commence coverage of our company, the trading price for our stock would be negatively impacted. In
31
Table of Contents
the event securities or industry analysts cover our company and one or more of these analysts downgrade our stock or publish inaccurate or unfavorable research about our business, our stock price would likely decline. If one or more of these analysts cease coverage of our company or fail to publish reports on us regularly, demand for our stock could decrease, which could cause our stock price and trading volume to decline.
The concentration of ownership among our existing directors, executive officers and principal stockholders will provide them, collectively, with substantial control over us after this offering, which could limit your ability to influence the outcome of key transactions, including a change of control.
Our directors, executive officers and each of our stockholders who own greater than 5% of our outstanding common stock and their affiliates, in the aggregate, will own approximately % of the outstanding shares of our common stock after this offering, based on the number of shares outstanding as of March 31, 2012 and after giving effect to the exercise of options and the sale of shares by the selling stockholders in connection with this offering. As a result, these stockholders, if acting together, will be able to influence or control matters requiring approval by our stockholders, including the election of directors and the approval of mergers, acquisitions or other extraordinary transactions. They may also have interests that differ from yours and may vote in a way with which you disagree and which may be adverse to your interests. This concentration of ownership may have the effect of delaying, preventing or deterring a change of control of our company, could deprive our stockholders of an opportunity to receive a premium for their common stock as part of a sale of our company and might ultimately affect the market price of our common stock.
We have broad discretion in the use of the net proceeds that we receive in this offering.
The principal purposes of this offering are to raise additional capital, to create a public market for our common stock and to facilitate our future access to the public equity markets. We have not yet determined the specific allocation of the net proceeds that we receive in this offering. Rather, we intend to use the net proceeds that we receive in this offering for working capital and general corporate purposes, including to satisfy our obligations to holders of performance units under our 2009 Performance Unit Plan, expansion of our sales organization, further development and expansion of our product offerings and possible acquisitions of, or investments in, businesses, technologies or other assets. Accordingly, our management will have broad discretion over the specific use of the net proceeds that we receive in this offering and might not be able to obtain a significant return, if any, on investment of these net proceeds. Investors in this offering will need to rely upon the judgment of our management with respect to the use of proceeds. If we do not use the net proceeds that we receive in this offering effectively, our business, operating results and financial condition could be harmed.
The requirements of being a public company may strain our resources, divert management’s attention and affect our ability to attract and retain executive management and qualified board members.
As a public company, we will be subject to the reporting requirements of the Securities Exchange Act of 1934, as amended, or the Exchange Act, the Sarbanes-Oxley Act, the Dodd-Frank Act, the listing requirements of and other applicable securities rules and regulations. Compliance with these rules and regulations will increase our legal and financial compliance costs, make some activities more difficult, time-consuming or costly and increase demand on our systems and resources, particularly after we are no longer an “emerging growth company,” as defined in the Jumpstart our Business Startups Act, or the JOBS Act. The Exchange Act requires, among other things, that we file annual, quarterly and current reports with respect to our business and operating results. The Sarbanes-Oxley Act requires, among other things, that we maintain effective disclosure controls and procedures and internal control over financial reporting. In order to maintain and, if required, improve our disclosure controls and procedures and internal control over financial reporting to meet this standard, significant resources and management oversight may be required. As a result, management’s attention may be diverted from other business concerns, which could adversely affect
32
Table of Contents
our business and operating results. Although we have already hired additional employees to comply with these requirements, we may need to hire more employees in the future or engage outside consultants, which will increase our costs and expenses.
In addition, changing laws, regulations and standards relating to corporate governance and public disclosure are creating uncertainty for public companies, increasing legal and financial compliance costs and making some activities more time consuming. These laws, regulations and standards are subject to varying interpretations, in many cases due to their lack of specificity, and, as a result, their application in practice may evolve over time as new guidance is provided by regulatory and governing bodies. This could result in continuing uncertainty regarding compliance matters and higher costs necessitated by ongoing revisions to disclosure and governance practices. We intend to invest resources to comply with evolving laws, regulations and standards, and this investment may result in increased general and administrative expenses and a diversion of management’s time and attention from revenue-generating activities to compliance activities. If our efforts to comply with new laws, regulations and standards differ from the activities intended by regulatory or governing bodies due to ambiguities related to their application and practice, regulatory authorities may initiate legal proceedings against us and our business may be adversely affected.
However, for as long as we remain an “emerging growth company,” we may take advantage of certain exemptions from various reporting requirements that are applicable to public companies that are not “emerging growth companies” including, but not limited to, not being required to comply with the auditor attestation requirements of Section 404, reduced disclosure obligations regarding executive compensation in our periodic reports and proxy statements, and exemptions from the requirements of holding a nonbinding advisory vote on executive compensation and shareholder approval of any golden parachute payments not previously approved. We may take advantage of these reporting exemptions until we are no longer an “emerging growth company.”
We would cease to be an “emerging growth company” upon the earliest of: (i) the first fiscal year following the fifth anniversary of this offering, (ii) the first fiscal year after our annual gross revenues are $1.0 billion or more, (iii) the date on which we have, during the previous three-year period, issued more than $1.0 billion in non-convertible debt securities or (iv) as of the end of any fiscal year in which the market value of our common stock held by non-affiliates exceeded $700 million as of the end of the second quarter of that fiscal year.
We also expect that being a public company and these new rules and regulations will make it more expensive for us to obtain director and officer liability insurance, and we may be required to accept reduced coverage or incur substantially higher costs to obtain coverage. These factors could also make it more difficult for us to attract and retain qualified members of our board of directors, particularly to serve on our audit committee and compensation committee, and qualified executive officers.
As a result of disclosure of information in this prospectus and in filings required of a public company, our business and financial condition will become more visible, which we believe may result in threatened or actual litigation, including by competitors and other third parties. If such claims are successful, our business and operating results could be adversely affected, and even if the claims do not result in litigation or are resolved in our favor, these claims, and the time and resources necessary to resolve them, could divert the resources of our management and adversely affect our business and operating results.
33
Table of Contents
As a result of becoming a public company, we will be obligated to develop and maintain proper and effective internal control over financial reporting. We may not complete our analysis of our internal control over financial reporting in a timely manner, or these internal controls may not be determined to be effective, which may adversely affect investor confidence in our company and, as a result, the value of our common stock.
We may be required, pursuant to Section 404 to furnish a report by management on, among other things, the effectiveness of our internal control over financial reporting for the first fiscal year beginning after the completion of this offering. This assessment will need to include disclosure of any material weaknesses identified by our management in our internal control over financial reporting.
We are in the very early stages of the costly and challenging process of compiling the system and processing documentation necessary to perform the evaluation needed to comply with Section 404. We may not be able to complete our evaluation, testing and any required remediation in a timely fashion. During the evaluation and testing process, if we identify one or more material weaknesses in our internal control over financial reporting, we will be unable to assert that our internal controls are effective.
If we are unable to assert that our internal control over financial reporting is effective, we could lose investor confidence in the accuracy and completeness of our financial reports, which would cause the price of our common stock to decline, and we may be subject to investigation or sanctions by the SEC.
We will be required to disclose changes made in our internal control and procedures on a quarterly basis. However, our independent registered public accounting firm will not be required to report on the effectiveness of our internal control over financial reporting pursuant to Section 404 until the later of the year following our first annual report required to be filed with the SEC, or the date we are no longer an “emerging growth company” as defined in the JOBS Act, if we take advantage of the exemptions contained in the JOBS Act. To comply with the requirements of being a public company, we may need to undertake various actions, such as implementing new internal controls and procedures and hiring accounting or internal audit staff.
Our independent registered public accounting firm is not required to report on the effectiveness of our internal control over financial reporting until the later of the year following our first annual report required to be filed with the SEC, or the date we are no longer an “emerging growth company.” At such time, our independent registered public accounting firm may issue a report that is adverse in the event it is not satisfied with the level at which our controls are documented, designed or operating. Our remediation efforts may not enable us to avoid a material weakness in the future.
We are an “emerging growth company” and we cannot be certain if the reduced disclosure requirements applicable to emerging growth companies will make our common stock less attractive to investors.
We are an “emerging growth company,” as defined in the JOBS Act, and we may take advantage of certain exemptions from various reporting requirements that are applicable to public companies that are not “emerging growth companies” including, but not limited to, not being required to comply with the auditor attestation requirements of Section 404, reduced disclosure obligations regarding executive compensation in our periodic reports and proxy statements, and exemptions from the requirements of holding a nonbinding advisory vote on executive compensation and shareholder approval of any golden parachute payments not previously approved. We cannot predict if investors will find our common stock less attractive because we may rely on these exemptions. If some investors find our common stock less attractive as a result, there may be a less active trading market for our common stock and our stock price may be more volatile.
34
Table of Contents
In addition, Section 107 of the JOBS Act also provides that an “emerging growth company” can take advantage of the extended transition period provided in Section 7(a)(2)(B) of the Securities Act for complying with new or revised accounting standards. In other words, an “emerging growth company” can delay the adoption of certain accounting standards until those standards would otherwise apply to private companies. However, we are choosing to “opt out” of such extended transition period, and as a result, we will comply with new or revised accounting standards on the relevant dates on which adoption of such standards is required for non-emerging growth companies. Section 107 of the JOBS Act provides that our decision to opt out of the extended transition period for complying with new or revised accounting standards is irrevocable.
We do not intend to pay dividends following the completion of this offering.
Historically, we have made tax distributions to our stockholders to the extent we have had taxable net income attributable to our stockholders. In addition, to the extent we have had sufficient cash and cash equivalents, we have made distributions to our stockholders equal to our adjusted net income for the preceding year, less amounts previously distributed as tax distributions for the applicable year. In addition, upon the completion of this offering, we intend to distribute an amount of cash to our stockholders as of the date of the LLC Conversion equal to the members’ distribution payable balance on our consolidated financial statements. See the section titled “Management’s Discussion and Analysis of Financial Condition and Results of Operations — Liquidity and Capital Resources” for additional information.
Following the completion of this offering, we intend to retain any earnings to finance the operation and expansion of our business, and we do not anticipate paying any cash dividends on our common stock for the foreseeable future. In addition, our revolving line of credit restricts our ability to pay dividends. As a result, you may only receive a return on your investment in our common stock if the market price of our common stock increases.
We will incur increased costs as a result of being a public company.
As a public company, we will incur significant legal, accounting and other expenses that we did not incur as a private company. In addition, rules implemented by the SEC and the require changes in corporate governance practices of public companies. We expect these rules and regulations to increase our legal and financial compliance costs and to make some activities more time-consuming and costly. We will also incur additional costs associated with our public company reporting requirements. We expect these rules and regulations to make it more difficult and more expensive for us to obtain director and officer liability insurance, and we may be required to accept reduced policy limits and coverage or incur substantially higher costs to obtain the same or similar coverage. As a result, it may be more difficult for us to attract and retain qualified people to serve on our board of directors or as executive officers.
Provisions in our certificate of incorporation and bylaws and under Delaware law might discourage, delay or prevent a change of control of our company or changes in our management and, therefore, depress the trading price of our common stock.
Our certificate of incorporation and bylaws contain provisions that could depress the trading price of our common stock by acting to discourage, delay or prevent a change of control of our company or changes in our management that the stockholders of our company may deem advantageous. These provisions:
| Ÿ | establish a classified board of directors so that not all members of our board of directors are elected at one time; |
| Ÿ | authorize the issuance of “blank check” preferred stock that our board of directors could issue to increase the number of outstanding shares to discourage a takeover attempt; |
35
Table of Contents
| Ÿ | prohibit stockholder action by written consent, which requires all stockholder actions to be taken at a meeting of our stockholders; |
| Ÿ | prohibit stockholders from calling a special meeting of our stockholders; |
| Ÿ | provide that the board of directors is expressly authorized to make, alter or repeal our bylaws; and |
| Ÿ | establish advance notice requirements for nominations for elections to our board of directors or for proposing matters that can be acted upon by stockholders at stockholder meetings. |
Additionally, we are subject to Section 203 of the Delaware General Corporation Law, which generally prohibits a Delaware corporation from engaging in any of a broad range of business combinations with any “interested” stockholder for a period of three years following the date on which the stockholder became an “interested” stockholder and which may discourage, delay or prevent a change of control of our company.
Any provision of our certificate of incorporation or bylaws or Delaware law that has the effect of delaying or deterring a change in control could limit the opportunity for our stockholders to receive a premium for their shares of our common stock, and could also affect the price that some investors are willing to pay for our common stock.
36
Table of Contents
SPECIAL NOTE REGARDING FORWARD-LOOKING STATEMENTS
This prospectus contains forward-looking statements within the meaning of the federal securities laws, which statements involve substantial risks and uncertainties. Forward-looking statements generally relate to future events or our future financial or operating performance. In some cases you can identify forward-looking statements because they contain words such as “may,” “will,” “should,” “expects,” “plans,” “anticipates,” “could,” “intends,” “target,” “projects,” “contemplates,” “believes,” “estimates,” “predicts,” “potential” or “continue” or the negative of these words or other similar terms or expressions that concern our expectations, strategy, plans or intentions. Forward-looking statements contained in this prospectus include, but are not limited to, statements about:
| Ÿ | our expectations regarding our results of operations and financial condition; |
| Ÿ | anticipated trends and challenges in our business and in the markets in which we operate; |
| Ÿ | the impact of seasonality on our business; |
| Ÿ | our anticipated growth strategies; |
| Ÿ | maintaining and expanding our end-user customer base and our relationships with our channel partners; |
| Ÿ | our ability to anticipate market needs and develop new and enhanced products and services to meet those needs; |
| Ÿ | our reliance on third-party manufacturers; |
| Ÿ | the evolution of technology affecting our products, services and markets; |
| Ÿ | our ability to retain and hire necessary employees and to staff our operations appropriately; |
| Ÿ | our liquidity and working capital requirements; |
| Ÿ | our need to obtain additional funding and our ability to obtain future funding on acceptable terms; |
| Ÿ | management compensation and the methodology for its determination; |
| Ÿ | our ability to stay abreast of new or modified laws and regulations that currently apply or become applicable to our business both in the United States and internationally; |
| Ÿ | the estimates and estimate methodologies used in preparing our consolidated financial statements and determining option exercise prices; and |
| Ÿ | the future trading prices of our common stock and the impact of securities analysts’ reports on these prices. |
We caution you that the foregoing list may not contain all of the forward-looking statements made in this prospectus.
You should not rely upon forward-looking statements as predictions of future events. We have based the forward-looking statements contained in this prospectus primarily on our current expectations and projections about future events and trends that we believe may affect our business, financial condition, results of operations and prospects. The outcome of the events described in these forward-looking statements is subject to risks, uncertainties and other factors described in the section titled “Risk Factors” and elsewhere in this prospectus. Moreover, we operate in a very competitive and rapidly changing environment. New risks and uncertainties emerge from time to time, and it is not possible for us to predict all risks and uncertainties that could have an impact on the forward-looking statements contained in this prospectus. We cannot assure you that the results, events and
37
Table of Contents
circumstances reflected in the forward-looking statements will be achieved or occur, and actual results, events or circumstances could differ materially from those described in the forward-looking statements.
The forward-looking statements made in this prospectus relate only to events as of the date on which the statements are made. We undertake no obligation to update any forward-looking statements made in this prospectus to reflect events or circumstances after the date of this prospectus or to reflect new information or the occurrence of unanticipated events, except as required by law. We may not actually achieve the plans, intentions or expectations disclosed in our forward-looking statements and you should not place undue reliance on our forward-looking statements. Our forward-looking statements do not reflect the potential impact of any future acquisitions, mergers, dispositions, joint ventures or investments we may make.
38
Table of Contents
This prospectus contains statistical data, estimates and forecasts that are based on independent industry publications, including reports from Gartner, Inc., the Enterprise Strategy Group and International Data Corporation, or other publicly available information, while other information is based on our internal sources. While we are not aware of any misstatements regarding any third party information presented in this prospectus, their estimates, in particular, as they relate to projections, involve numerous assumptions, are subject to risks and uncertainties, and are subject to change based on various factors, including those discussed under the section titled “Risk Factors” and elsewhere in this prospectus.
The reports from Gartner described herein represent data, research opinions or viewpoints published as part of a syndicated subscription service, by Gartner, and are not representations of fact. Each of the Gartner reports described herein, “Security Management Strategy Planning Best Practices,” dated January 26, 2012, by Tom Scholtz, and “SWOT: Google’s Android Business, Worldwide,” dated January 25, 2012, by Roberta Cozza, speaks as of its original publication date (and not as of the date of this prospectus) and the opinions expressed in the Gartner reports are subject to change without notice.
39
Table of Contents
We estimate that the net proceeds to us from the sale of shares of our common stock in this offering will be $ million, based on an assumed initial public offering price of $ per share, which is the midpoint of the estimated offering price range set forth on the cover page of this prospectus, after deducting estimated underwriting discounts and commissions and estimated offering expenses payable by us. If the underwriters’ option to purchase additional shares from us is exercised in full, we estimate that our net proceeds would be $ million, after deducting estimated underwriting discounts and commissions and estimated offering expenses payable by us. We will not receive any proceeds from the sale of shares of our common stock by the selling stockholders.
Each $1.00 increase or decrease in the assumed initial public offering price of $ per share would increase or decrease the net proceeds that we receive from this offering by $ million, assuming that the number of shares offered by us, as set forth on the cover page of this prospectus, remains the same, after deducting estimated underwriting discounts and commissions payable by us. Similarly, each increase or decrease of one million in the number of shares of common stock offered by us would increase or decrease the net proceeds that we receive from this offering by $ million, assuming the assumed initial public offering price remains the same and after deducting estimated underwriting discounts and commissions payable by us.
The principal purposes of this offering are to increase our financial flexibility, to create a public market for our common stock and to facilitate our future access to the public equity markets.
We currently intend to use the net proceeds that we will receive from this offering to satisfy our obligations to holders of performance units under our 2009 Performance Unit Plan, who are primarily our employees, which we estimate will be $ in cash in the aggregate, based on an assumed initial public offering price of $ per share, which is the midpoint of the estimated offering price range set forth on the cover page of this prospectus. Payments pursuant to our 2009 Performance Unit Plan will be recorded as compensation charges. We currently intend to use the balance of the net proceeds that we will receive from this offering for working capital and other general corporate purposes. We may also use a portion of the net proceeds that we receive to acquire or invest in complementary businesses, products, services, technologies or other assets. We have not entered into any agreements or commitments with respect to any acquisitions or investments at this time.
We cannot specify with certainty all of the particular uses of the net proceeds that we will receive from this offering. Accordingly, we will have broad discretion in using these proceeds. Furthermore, the amount and timing of our actual expenditures will depend on numerous factors, including the cash used in or generated by our operations, the status of our development, the level of our sales and marketing activities and our investments and acquisitions. Pending the use of proceeds from this offering as described above, we plan to invest the net proceeds that we receive in this offering in short-term and intermediate-term interest-bearing obligations, investment-grade investments, certificates of deposit or direct or guaranteed obligations of the U.S. government. We cannot predict whether the invested proceeds will yield a favorable return.
40
Table of Contents
We currently intend to retain any future earnings and do not anticipate paying any cash dividends on our common stock in the foreseeable future following the completion of this offering. Any future determination to declare cash dividends following the completion of this offering will be made at the discretion of our board of directors, subject to applicable laws, and will depend on our financial condition, results of operations, capital requirements, general business conditions and other factors that our board of directors may deem relevant. In addition, the terms of our revolving line of credit with Silicon Valley Bank limit our ability to pay cash dividends on our capital stock.
Historically, we have made tax distributions to our stockholders to the extent we have had taxable net income attributable to our stockholders. In addition, to the extent we have had sufficient cash and cash equivalents, we have made distributions to our stockholders equal to our adjusted net income for the preceding year, less amounts previously distributed as tax distributions for the applicable year. See the section titled “Capitalization” for additional information. In addition, upon the completion of this offering, we intend to distribute an amount of cash to our stockholders as of the date of the LLC Conversion equal to the members’ distribution payable balance on our consolidated financial statements as of that date. See the section titled “Management’s Discussion and Analysis of Financial Condition and Results of Operations—Liquidity and Capital Resources” for additional information.
41
Table of Contents
The following table sets forth our cash and cash equivalents, as well as our capitalization, as of March 31, 2012 as follows:
| Ÿ | on an actual basis; |
| Ÿ | on a pro forma basis, giving effect to (i) the LLC Conversion, (ii) the conversion of all outstanding shares of preferred stock into shares of common stock and (iii) the distribution of an amount of cash to our stockholders as of the date of the LLC Conversion equal to the members’ distribution payable balance on our consolidated financial statements, which was $7.4 million as of March 31, 2012; and |
| Ÿ | on a pro forma as adjusted basis, giving effect to the pro forma adjustments set forth above and (i) the receipt of $ in net proceeds from the sale and issuance by us of shares of common stock in this offering, based on an assumed initial public offering price of $ per share, which is the midpoint of the estimated offering price range set forth on the cover page of this prospectus, after deducting estimated underwriting discounts and commissions and estimated offering expenses payable by us, (ii) a $ million increase in accumulated deficit and increase to additional paid-in capital associated with stock-based compensation expense due to the vesting of performance units in connection with the completion of this offering and (iii) the filing and effectiveness of our amended and restated certificate of incorporation in connection with the completion of this offering. |
The pro forma as adjusted information set forth in the table below is illustrative only and will be adjusted based on the actual initial public offering price and other final terms of this offering. You should read this table together with our consolidated financial statements and related notes, and the sections titled “Selected Consolidated Financial Data” and “Management’s Discussion and Analysis of Financial Condition and Results of Operations” that are included elsewhere in this prospectus.
| As of March 31, 2012 | ||||||||||||
| Actual | Pro Forma (1) | Pro Forma as Adjusted (1)(2) |
||||||||||
| (unaudited) |
||||||||||||
| (in thousands, except unit/share and per unit/share data) |
||||||||||||
| Cash and cash equivalents |
$ | 16,366 | $ | $ | ||||||||
|
|
|
|
|
|
|
|||||||
| Redeemable convertible Series A preferred units—$0.94 per unit value: 24,329,545 units authorized, 24,329,545 issued and outstanding, actual; no units authorized, issued and outstanding, pro forma and pro forma as adjusted |
$ | 26,652 | $ | $ | ||||||||
| Members/Stockholders’ equity (deficit): |
||||||||||||
| Common units—no par value per unit, 100,000,000 units authorized, 51,900,015 units issued and outstanding, actual; no units authorized, issued or outstanding, pro forma and pro forma as adjusted |
1,625 | — | — | |||||||||
| Preferred stock—$0.0001 par value; no shares authorized, issued or outstanding, actual or pro forma; shares authorized, no shares issued or outstanding, pro forma as adjusted |
— | — | — | |||||||||
| Common stock—$0.0001 par value; no shares authorized, issued or outstanding, actual; shares authorized, shares issued and outstanding, pro forma; and shares authorized, shares issued and outstanding, pro forma as adjusted |
— | |||||||||||
| Treasury shares |
(12,469 | ) | ||||||||||
| Additional paid-in capital |
159 | |||||||||||
| Accumulated deficit |
(17,668 | ) | ||||||||||
|
|
|
|
|
|
|
|||||||
| Total members/stockholders’ equity (deficit) |
(28,353 | ) | ||||||||||
|
|
|
|
|
|
|
|||||||
| Total capitalization |
$ | (1,701 | ) | $ | $ | |||||||
|
|
|
|
|
|
|
|||||||
42
Table of Contents
| (1) | This column gives effect to the LLC Conversion, specifically: (i) the reclassification of the balance of members’ interests in common units to common stock and additional paid-in capital upon a conversion from a Delaware limited liability company to a Delaware corporation and the conversion of common units into common stock, (ii) a net adjustment of $ million to retained earnings in connection with deferred income tax assets and liabilities assumed to be recognized in connection with the LLC Conversion and (iii) an assumed contribution of $ million to additional paid-in capital in connection with the merger of Gigamon Systems LLC with and into us as a part of the LLC Conversion, all presented as if these events had occurred on March 31, 2012. This information should not be considered representative of our future consolidated financial position. |
| (2) | Each $1.00 increase or decrease in the assumed initial public offering price of $ per share, which is the midpoint of the estimated offering price range set forth on the cover page of this prospectus, would increase or decrease, as applicable, our cash and cash equivalents, additional paid-in capital, total stockholders’ equity (deficit) and total capitalization by $ million, assuming that the number of shares offered by us, as set forth on the cover page of this prospectus remains the same, after deducting estimated underwriting discounts and commissions payable by us. An increase or decrease of one million shares of common stock offered by us would increase or decrease the cash and cash equivalents, additional paid-in capital, total stockholders’ equity (deficit) and total capitalization by $ , assuming an initial public offering price of $ per share, which is the midpoint of the estimated offering price range set forth on the cover page of this prospectus, after deducting the estimated underwriting discounts and commissions payable by us. |
The number of shares of our common stock set forth in the table above is based on the number of shares outstanding as of March 31, 2012 after giving effect to the LLC Conversion described under the section titled “Certain Relationships and Related Party Transactions—LLC Conversion,” and excludes:
| Ÿ | 2,596,920 shares of common stock issuable upon the exercise of options to purchase common stock, consisting of options to be assumed from Gigamon Systems LLC in connection with the LLC Conversion, with a weighted-average exercise price of $0.01 per share; and |
| Ÿ | additional shares of common stock, subject to increase on an annual basis, reserved for future issuance under our 2012 Equity Incentive Plan, which will become effective in connection with the completion of this offering, consisting of: |
| ¡ | shares of common stock reserved for future grant or issuance under our 2012 Equity Incentive Plan, which will become effective in connection with the completion of this offering; and |
| ¡ | 5,901,516 shares of common stock reserved for future issuance under our 2012 Unit Option Plan, which shares will be added to the shares of common stock to be reserved under our 2012 Equity Incentive Plan upon its effectiveness. |
Pursuant to our Restated Limited Liability Company Agreement, dated January 20, 2010, as amended, or the LLC Agreement, we are required to make tax distributions to our stockholders to the extent we have taxable net income attributable to our stockholders. In addition, to the extent we have had sufficient cash and cash equivalents, we have made distributions to our stockholders equal to our adjusted net income for the preceding year, less amounts previously distributed as tax distributions for the applicable year. Accordingly, we paid distributions to our stockholders in 2010, 2011 and in the three months ended March 31, 2012, in aggregate amounts equal to $13.9 million, $12.2 million and $4.7 million, respectively. In addition, we currently intend to distribute an amount of cash to our stockholders as of the date of the LLC Conversion equal to the members’ distribution payable balance on our consolidated financial statements as of that date. As of March 31, 2012, the members’ distribution payable balance was $7.4 million.
43
Table of Contents
If you invest in our common stock in this offering, your interest will be diluted to the extent of the difference between the initial public offering price per share of our common stock and the pro forma as adjusted net tangible book value per share of our common stock immediately after this offering. Net tangible book value dilution per share to new investors represents the difference between the amount per share paid by purchasers of shares of common stock in this offering and the pro forma as adjusted net tangible book value per share of common stock immediately after completion of this offering.
Net tangible book value per share is determined by dividing our total tangible assets less our total liabilities by the number of shares of common stock outstanding. Our historical net tangible book value as of March 31, 2012 was $ , or $ per share. Our pro forma net tangible book value as of March 31, 2012 was $ , or $ per share, based on the total number of shares of our common stock outstanding as of March 31, 2012, after giving effect to (i) the LLC Conversion and (ii) the conversion of all outstanding shares of preferred stock into shares of common stock, which will occur in connection with the completion of this offering.
After giving effect to the sale by us of shares of our common stock in this offering at the assumed initial public offering price of $ per share, which is the midpoint of the estimated offering price range set forth on the cover page of this prospectus, after deducting estimated underwriting discounts and commissions and estimated offering expenses payable by us, our pro forma as adjusted net tangible book value as of March 31, 2012 would have been approximately $ million, or $ per share. This represents an immediate increase in pro forma net tangible book value of $ per share to our existing stockholders and an immediate dilution of $ per share to investors purchasing shares of common stock in this offering at the assumed initial public offering price.
The following table illustrates this dilution:
| Assumed initial public offering price per share |
$ | |||||||
| Pro forma net tangible book value per share as of March 31, 2012 |
$ | |||||||
| Increase in pro forma net tangible book value per share attributable to new investors in this offering |
||||||||
|
|
|
|||||||
| Pro forma as adjusted net tangible book value per share immediately after this offering |
$ | |||||||
|
|
|
|||||||
| Dilution in pro forma net tangible book value per share to new investors in this offering |
$ | |||||||
|
|
|
Each $1.00 increase or decrease in the assumed initial public offering price of $ per share, which is the midpoint of the estimated offering price range set forth on the cover page of this prospectus, would increase or decrease, as applicable, our pro forma as adjusted net tangible book value per share to new investors by $ , and would increase or decrease, as applicable, dilution per share to new investors in this offering by $ , assuming that the number of shares offered by us, as set forth on the cover page of this prospectus, remains the same, after deducting estimated underwriting discounts and commissions payable by us. In addition, to the extent any outstanding options to purchase common stock are exercised, new investors will experience further dilution.
If the underwriters exercise their option to purchase additional shares from us in full, the pro forma as adjusted net tangible book value per share of our common stock immediately after this
44
Table of Contents
offering would be $ per share, and the dilution in pro forma net tangible book value per share to new investors in this offering would be $ per share.
The following table presents on a pro forma as adjusted basis as of March 31, 2012, after giving effect to (i) the LLC Conversion and (ii) the conversion of all outstanding shares of preferred stock into shares of common stock in connection with the completion of this offering, the differences between the existing stockholders and the new investors purchasing shares of our common stock in this offering, with respect to the number of shares purchased from us, the total consideration paid or to be paid to us, which includes net proceeds received from the issuance of common stock and convertible preferred stock, cash received from the exercise of stock options and the average price per share paid or to be paid to us at an assumed initial public offering price of $ per share, which is the midpoint of the estimated offering price range set forth on the cover page of this prospectus, before deducting estimated underwriting discounts and commissions and estimated offering expenses payable by us.
| Shares Purchased |
Total Consideration |
Average Price Per Share |
||||||||||||||||
| Number | Percent | Amount | Percent | |||||||||||||||
| Existing stockholders |
% | $ | % | $ | ||||||||||||||
| New investors |
||||||||||||||||||
|
|
|
|
|
|
|
|
||||||||||||
| Total |
100.0 | % | $ | 100.0 | % | |||||||||||||
|
|
|
|
|
|
|
|
||||||||||||
Each $1.00 increase or decrease in the assumed initial public offering price of $ per share would increase or decrease the total consideration paid by new investors and total consideration paid by all stockholders by approximately $ million, assuming that the number of shares offered by us, as set forth on the cover page of this prospectus, remains the same, after deducting estimated underwriting discounts and commissions and estimated offering expenses payable by us. In addition, to the extent any outstanding options to purchase common stock are exercised, new investors will experience further dilution.
If the underwriters exercise their option to purchase additional shares from us and the selling stockholders in full, our existing stockholders would own % and our new investors would own % of the total number of shares of our common stock outstanding upon the completion of this offering.
The number of shares of common stock that will be outstanding after this offering is based on 73,632,640 shares outstanding as of March 31, 2012 after giving effect to the LLC Conversion described under the section titled “Certain Relationships and Related Party Transactions—LLC Conversion,” and excludes:
| Ÿ | 2,596,920 shares of common stock issuable upon the exercise of options to purchase common stock, consisting of options to be assumed from Gigamon Systems LLC in connection with the LLC Conversion, with a weighted-average exercise price of $0.01 per share; and |
45
Table of Contents
| Ÿ | additional shares of common stock, subject to increase on an annual basis, reserved for future issuance under our 2012 Equity Incentive Plan, which will become effective in connection with the completion of this offering, consisting of: |
| o | shares of common stock reserved for future grant or issuance under our 2012 Equity Incentive Plan, which will become effective in connection with the completion of this offering; and |
| o | 5,901,516 shares of common stock reserved for future issuance under our 2012 Unit Option Plan, which shares will be added to the shares of common stock to be reserved under our 2012 Equity Incentive Plan upon its effectiveness. |
46
Table of Contents
SELECTED CONSOLIDATED FINANCIAL DATA
We have derived the following selected consolidated statement of operations data for the years ended December 31, 2009, 2010 and 2011 and the selected consolidated balance sheet data as of December 31, 2010 and 2011 from our audited consolidated financial statements included elsewhere in this prospectus. We have derived the selected consolidated statement of operations data for the years ended December 31, 2007 and 2008 and the selected consolidated balance sheet data as of December 31, 2007, 2008 and 2009 from our audited consolidated financial statements which are not included in this prospectus. We have derived the selected unaudited consolidated statement of operations data for the three months ended March 31, 2011 and 2012 and the selected unaudited consolidated balance sheet data as of March 31, 2012 from our unaudited consolidated financial statements included elsewhere in this prospectus. The unaudited consolidated interim financial statements have been prepared on the same basis as the audited consolidated financial statements and, in the opinion of management, reflect all adjustments, consisting only of normal recurring adjustments that are necessary for the fair statement of our financial statements. Our historical results are not necessarily indicative of the results that may be expected in the future, and the results in the three months ended March 31, 2012 are not necessarily indicative of the results to be expected for the full year ending December 31, 2012 or any other period. You should read the following selected consolidated financial and other data in conjunction with the section titled “Management’s Discussion and Analysis of Financial Condition and Results of Operations” and our consolidated financial statements and related notes included elsewhere in this prospectus.
We have restated our audited consolidated financial statements as of December 31, 2011 and for the year then ended to (i) correct errors in our provision for excess and obsolete inventory and non-cancelable future inventory purchase commitments, (ii) correct errors in our accounting for, and tax treatment of, equity award grants to certain employees in prior years, (iii) correct other errors which were not material individually or in the aggregate and (iv) adjust the members’ distribution payable and founders’ bonus pursuant to the LLC Agreement to reflect the amounts owed based on the revised financial results.
The impact of the corrections to the 2011 consolidated financial statements was a decrease in inventory by $0.6 million, an increase in prepaid expenses and other current assets by $1.4 million, a decrease in accounts payable and members’ distribution payable by $0.7 million and $3.3 million, respectively, and an increase in accrued liabilities by $4.7 million as of December 31, 2011. Additionally, the restatement resulted in an increase to cost of revenue by $2.2 million, a decrease in product revenue of $0.1 million and an increase in operating expenses by $0.8 million for the year ended December 31, 2011. The net impact of these adjustments to the 2011 consolidated financial statements was a decrease in net income of $3.1 million.
We have also restated our audited consolidated financial statements as of December 31, 2009 and 2010, and for the years then ended to (i) correct errors in our accounting for, and tax treatment of, equity award grants to certain employees in prior years, (ii) correct errors which were not material individually or in the aggregate and (iii) adjust the members’ distribution payable and founders’ bonus pursuant to the LLC Agreement to reflect the amounts owed based on the revised financial results. The net impact of these corrections was a decrease in net income of $0.2 million in each of 2009 and 2010.
47
Table of Contents
| Year Ended December 31, | Three Months Ended March 31, |
|||||||||||||||||||||||||||
| 2007 | 2008 | 2009 | 2010 | 2011 | 2011 | 2012 | ||||||||||||||||||||||
| (restated) | (restated) | (restated) | ||||||||||||||||||||||||||
| (in thousands, except per share amounts) | ||||||||||||||||||||||||||||
| Consolidated Statement of Operations Data: |
||||||||||||||||||||||||||||
| Revenue: |
||||||||||||||||||||||||||||
| Product |
$ | 10,359 | $ | 16,365 | $ | 24,664 | $ | 35,577 | $ | 51,308 | $ | 6,720 | $ | 10,893 | ||||||||||||||
| Services |
1,987 | 3,881 | 6,723 | 10,909 | 16,797 | 3,353 | 5,809 | |||||||||||||||||||||
|
|
|
|
|
|
|
|
|
|
|
|
|
|
|
|||||||||||||||
| Total revenue |
12,346 | 20,246 | 31,387 | 46,486 | 68,105 | 10,073 | 16,702 | |||||||||||||||||||||
| Cost of revenue: |
||||||||||||||||||||||||||||
| Product |
2,625 | 3,840 | 4,826 | 6,122 | 12,528 | 1,569 | 3,365 | |||||||||||||||||||||
| Services (1) |
195 | 473 | 665 | 2,239 | 1,900 | 306 | 492 | |||||||||||||||||||||
|
|
|
|
|
|
|
|
|
|
|
|
|
|
|
|||||||||||||||
| Total cost of revenue |
2,820 | 4,313 | 5,491 | 8,361 | 14,428 | 1,875 | 3,857 | |||||||||||||||||||||
|
|
|
|
|
|
|
|
|
|
|
|
|
|
|
|||||||||||||||
| Gross profit |
9,526 | 15,933 | 25,896 | 38,125 | 53,677 | 8,198 | 12,845 | |||||||||||||||||||||
|
|
|
|
|
|
|
|
|
|
|
|
|
|
|
|||||||||||||||
| Operating expenses: |
||||||||||||||||||||||||||||
| Research and development (1) |
1,415 | 3,456 | 4,977 | 12,283 | 12,530 | 2,103 | 3,945 | |||||||||||||||||||||
| Sales and marketing (1) |
1,629 | 2,767 | 5,209 | 12,522 | 19,358 | 3,543 | 8,223 | |||||||||||||||||||||
| General and administrative (1) |
1,095 | 1,960 | 2,506 | 6,610 | 4,766 | 893 | 1,306 | |||||||||||||||||||||
|
|
|
|
|
|
|
|
|
|
|
|
|
|
|
|||||||||||||||
| Total operating expenses |
4,139 | 8,183 | 12,692 | 31,415 | 36,654 | 6,539 | 13,474 | |||||||||||||||||||||
|
|
|
|
|
|
|
|
|
|
|
|
|
|
|
|||||||||||||||
| Income (loss) from operations |
5,387 | 7,750 | 13,204 | 6,710 | 17,023 | 1,659 | (629 | ) | ||||||||||||||||||||
| Interest income |
52 | 140 | 65 | 9 | 4 | 2 | 3 | |||||||||||||||||||||
| Other income (expense), net |
(47 | ) | (6 | ) | (7 | ) | (7 | ) | (16 | ) | (1 | ) | (26 | ) | ||||||||||||||
|
|
|
|
|
|
|
|
|
|
|
|
|
|
|
|||||||||||||||
| Income (loss) before provision for income taxes |
5,392 | 7,884 | 13,262 | 6,712 | 17,011 | 1,660 | (652 | ) | ||||||||||||||||||||
| Provision for income taxes |
— | (174 | ) | (122 | ) | (75 | ) | (80 | ) | — | (63 | ) | ||||||||||||||||
|
|
|
|
|
|
|
|
|
|
|
|
|
|
|
|||||||||||||||
| Net income (loss) |
5,392 | 7,710 | 13,140 | 6,637 | 16,931 | 1,660 | (715 | ) | ||||||||||||||||||||
| Accretion of preferred shares to redemption value and issuance costs |
— | — | — | (1,834 | ) | (2,078 | ) | (505 | ) | (544 | ) | |||||||||||||||||
| (Earnings) loss distributed to preferred stock |
— | — | — | (1,350 | ) | (4,741 | ) | (369 | ) | 402 | ||||||||||||||||||
|
|
|
|
|
|
|
|
|
|
|
|
|
|
|
|||||||||||||||
| Net income (loss) attributable to common stockholders |
$ | 5,392 | $ | 7,710 | $ | 13,140 | $ | 3,453 | $ | 10,112 | $ | 786 | $ | (857 | ) | |||||||||||||
|
|
|
|
|
|
|
|
|
|
|
|
|
|
|
|||||||||||||||
| Net income (loss) per share attributable to common stockholders: |
||||||||||||||||||||||||||||
| Basic and Diluted (2) |
$ | 0.07 | $ | 0.10 | $ | 0.17 | $ | 0.06 | $ | 0.19 | $ | 0.02 | $ | (0.02 | ) | |||||||||||||
|
|
|
|
|
|
|
|
|
|
|
|
|
|
|
|||||||||||||||
| Weighted average shares of common stock outstanding used in computing net income (loss) per share attributable to common stockholders: |
||||||||||||||||||||||||||||
| Basic (2) |
75,127 | 75,659 | 76,230 | 53,587 | 51,900 | 51,900 | 51,900 | |||||||||||||||||||||
|
|
|
|
|
|
|
|
|
|
|
|
|
|
|
|||||||||||||||
| Diluted (2) |
79,138 | 79,217 | 76,230 | 53,587 | 51,900 | 51,900 | 51,900 | |||||||||||||||||||||
|
|
|
|
|
|
|
|
|
|
|
|
|
|
|
|||||||||||||||
| Pro forma net income (loss) per common share: |
||||||||||||||||||||||||||||
| Basic and Diluted (2) |
$ | $ | ||||||||||||||||||||||||||
|
|
|
|
|
|||||||||||||||||||||||||
| Weighted average shares of common stock used in computing pro forma net income (loss) per common share: |
||||||||||||||||||||||||||||
| Basic and Diluted (2) |
||||||||||||||||||||||||||||
|
|
|
|
|
|||||||||||||||||||||||||
48
Table of Contents
| (1) | The following table presents stock-based compensation expense included in each expense category: |
| Year Ended December 31, | Three months ended March 31, |
|||||||||||||||||||||||||||
| 2007 | 2008 | 2009 | 2010 | 2011 | 2011 | 2012 | ||||||||||||||||||||||
| (restated) | (restated) | (restated) | ||||||||||||||||||||||||||
| (in thousands) |
||||||||||||||||||||||||||||
| Cost of revenue |
$ | 31 | $ | 12 | $ | 8 | $ | 1,086 | $ | — | $ | — | $ | — | ||||||||||||||
| Research and development |
234 | 114 | 64 | 4,692 | 8 | 8 | — | |||||||||||||||||||||
| Sales and marketing |
73 | 105 | 25 | 2,377 | 2 | 2 | — | |||||||||||||||||||||
| General and administrative |
67 | 18 | 13 | 2,212 | 2 | 2 | — | |||||||||||||||||||||
|
|
|
|
|
|
|
|
|
|
|
|
|
|
|
|||||||||||||||
| Total stock-based compensation expense |
$ | 405 | $ | 249 | $ | 110 | $ | 10,367 | $ | 12 | $ | 12 | $ | — | ||||||||||||||
|
|
|
|
|
|
|
|
|
|
|
|
|
|
|
|||||||||||||||
| (2) | See Notes 2 and 11 to our audited consolidated financial statements for an explanation of the calculations of our basic and diluted net income (loss) per share of common stock and pro forma net income (loss) per share of common stock. |
| December 31, | March 31, |
|||||||||||||||||||||||
| 2007 | 2008 | 2009 | 2010 | 2011 | ||||||||||||||||||||
| (restated) |
(restated) | (restated) | ||||||||||||||||||||||
| Consolidated Balance Sheet Data: |
(in thousands) | |||||||||||||||||||||||
| Cash and cash equivalents |
$ | 2,186 | $ | 2,648 | $ | 3,122 | $ | 5,804 | $ | 13,102 | $ | 16,366 | ||||||||||||
| Working capital (deficit) |
1,191 | 60 | (96 | ) | (555 | ) | 91 | 336 | ||||||||||||||||
| Total assets |
5,201 | 7,075 | 12,809 | 20,876 | 43,995 | 41,266 | ||||||||||||||||||
| Redeemable convertible preferred stock |
— | — | — | 24,030 | 26,108 | 26,652 | ||||||||||||||||||
| Total members’ deficit/stockholders’ equity |
580 | (847 | ) | (1,097 | ) | (25,731 | ) | (27,809 | ) | (28,353 | ) | |||||||||||||
49
Table of Contents
MANAGEMENT’S DISCUSSION AND ANALYSIS OF
FINANCIAL CONDITION AND RESULTS OF OPERATIONS
The following discussion and analysis of our financial condition and results of operations should be read in conjunction with the section titled “Selected Financial and Other Data” and our consolidated financial statements and related notes included elsewhere in this prospectus. This discussion contains forward-looking statements that involve risks and uncertainties. Our actual results could differ materially from those forward-looking statements. Factors that could cause or contribute to those differences include, but are not limited to, those identified below and those discussed above in the section titled “Risk Factors” and elsewhere in this prospectus.
Overview
We have developed a new and innovative solution that delivers pervasive and dynamic visibility and control of traffic across networks. Our solution, which we refer to as our Traffic Visibility Fabric, consists of distributed network appliances that provide an advanced level of network traffic intelligence. Our Fabric enables IT organizations to forward traffic from network infrastructure to management, analysis, compliance and security tools in a manner that is optimized for specific uses or locations. At the heart of the Fabric is our patented Flow Mapping™ technology that identifies and directs incoming traffic to single or multiple tools based on user-defined rules implemented from a centralized management console. Our Fabric is designed to help organizations ensure the reliability, performance and security of their network infrastructure, minimize capital investment in management, analysis, compliance and security tools, reduce operating expenses and realize greater value from the existing tools that are deployed throughout their networks.
In 2005, we introduced GigaVUE-MP, which offers powerful, intelligent traffic filtration and management capabilities. In 2007, we launched enhancements to these capabilities and introduced our broader Flow Mapping technology. In 2008, we began shipping a 10 Gigabit Fabric solution. In 2010, we introduced next generation packet inspection to enable improved Fabric performance. In addition, in 2011, we launched a 1 Terabit chassis Fabric solution, the GigaVUE H Series chassis, which was the first Terabit capacity Traffic Visibility Fabric appliance for high throughput environments.
We generate product revenue primarily from sales of perpetual software licenses installed on physical appliances for our Traffic Visibility Fabric solutions to channel partners, including distributors and resellers, as well as directly to end-user customers. We market and sell our products through a hybrid sales model, which combines a high-touch sales organization and an overlay channel sales team that actively assists our extensive network of channel partners throughout the sales process. We also provide our channel partners with marketing assistance, technical training and support.
We generate services revenue primarily from the sale of maintenance and support services for our products. A one-year contract for our maintenance and support services is bundled with the initial contract to purchase our products. Following expiration of this one-year contract, our end-user customers typically purchase maintenance and support contracts that generally have one-year terms.
As of March 31, 2012, our end-user customers included 43 of the Fortune 100, and we had sold products to over 825 end-user customers across many vertical markets, including four of the top ten U.S. retailers, four of the top five U.S. banks and financial services companies, five of the top ten U.S. integrated telecommunication service providers, three of the top five U.S. managed healthcare providers, five of the top ten U.S. cable and satellite providers and three of the top ten global securities and commodities exchanges. The loyalty of our customer base is evidenced by the fact that many of our end-user customers purchase additional products from us within six month periods of their initial deployments and continue with similar frequency.
50
Table of Contents
We were founded in 2004, and have experienced significant growth since inception. Our total revenue increased from $31.4 million in 2009 to $68.1 million in 2011, representing a compound annual growth rate, or CAGR, of 47%. Our revenue increased from $10.1 million during the three months ended March 31, 2011 to $16.7 million during the three months ended March 31, 2012, representing 66% growth, and we have generated positive cash flows in each of the last six years.
We have restated our previously issued consolidated financial statements as of December 31, 2009, 2010 and 2011 and for the years then ended. The determination to restate these financial statements was made by us upon identification of errors after the issuance of those financial statements. See Note 3 to our consolidated financial statements, which are included elsewhere in this prospectus.
Opportunities, Challenges and Risks
The growth of our business and our future success are dependent upon many factors, including our ability to maintain our technology leadership, up-sell to our growing customer base, add new end-user customers, leverage our channel partners and participate in the continued growth in the network traffic visibility market. While these areas represent significant opportunities for us, they also represent notable challenges and risks that we must successfully address in order to continue the growth of our business and improve our results of operations.
Increasing Need for Network Traffic Visibility. We believe that the impact of virtualization and cloud computing, mobility and big data are combining to increase network complexity and potentially introduce new network vulnerabilities. The combination of these factors is creating new challenges for enterprises and service providers who are struggling to maintain or improve service delivery and limit network downtime, including growing traffic volumes, increasing security and compliance initiatives, proliferation of connected devices, the consumerization of IT and adoption of cloud-based IT. We expect that our Traffic Visibility Fabric will continue to replace traditional approaches to collecting and analyzing network traffic in order to improve the visibility and control of their networks.
Need for Continued Innovation. We are a pioneer and leader in the market for intelligent traffic visibility solutions, and we believe we will benefit from the expected growth in this market. We principally rely on a single product family comprised of our GigaVUE, GigaSECURE, GigaSMART and GigaTAP products. If we fail to continue to innovate and diversify our product offerings, our market position, our gross margin and our revenue growth rate may decline. Accordingly, we expect to continue to invest heavily in research and development in order to expand the capabilities of our solution and to develop additional products.
Up-Selling to Our Growing End-User Customer Base. We expect that a substantial portion of our future sales will be follow-on sales to existing end-user customers. One of our sales strategies is to target new end-user customers with initial deployments of our solution so that they can experience the operational and economic benefits of our Fabric, thereby building internal support and demand to allow us to up-sell additional products and significant follow-on purchases. Our future growth will depend on our ability to sell additional products to our growing base of end-user customers.
Adding New End-User Customers. We intend to target new end-user customers by continuing to invest in our sales force and extending the relationships with our channel partners. We also plan to increase the awareness of our technology leadership and the value proposition of our Traffic Visibility Fabric among potential end-user customers. Our business and results of operations will depend on our ability to continually add new end-user customers.
51
Table of Contents
Leveraging Channel Partners. We expect to continue to derive the majority of our sales through our channel partners. Our channel partners will play a significant role in our growth as they develop new end-user customers and expand our sales to existing end-user customers. We plan to continue to invest in our network of channel partners to increase sales to existing end-user customers, empower them to reach new end-user customers, and provide services and support effectively. We believe that leveraging our channel partners could help us grow revenue more quickly and reduce our sales and support costs as a percentage of revenue.
Relying on Continued Growth in Network Traffic Visibility Market. We believe that the market for Traffic Visibility Fabric solutions is still in its infancy, and we expect that this market will grow as organizations identify the need for increased visibility and control over the traffic traversing their networks. If we successfully execute our growth strategies, we expect to benefit from the anticipated increased spending in the market for traffic visibility fabric solutions. Our results of operations will be substantially dependent on the pace of growth in this market, if any.
Key Performance Indicators of Our Business
We monitor a variety of key performance indicators to help us evaluate growth trends, establish budgets, measure the effectiveness of our sales and marketing efforts and assess operational efficiencies. These key performance indicators include the following:
| Year Ended December 31, | Three Months Ended March 31, |
|||||||||||||||||||
| 2009 | 2010 | 2011 | 2011 | 2012 | ||||||||||||||||
| (restated) | (restated) | (restated) | (unaudited) | |||||||||||||||||
| (dollars in thousands) | ||||||||||||||||||||
| Key Performance Indicators: |
||||||||||||||||||||
| Total revenue |
$ | 31,387 | $ | 46,486 | $ | 68,105 | $ | 10,073 | $ | 16,702 | ||||||||||
| Gross margin |
83% | 82% | 79% | 81% | 77% | |||||||||||||||
| Operating income (loss) |
$ | 13,204 | $ | 6,710 | $ | 17,023 | $ | 1,659 | $ | (629 | ) | |||||||||
| Deferred revenue |
$ | 7,133 | $ | 11,121 | $ | 21,962 | $ | 12,100 | $ | 22,289 | ||||||||||
Total revenue. We monitor our total revenue to assess the acceptance of our products by our end-user customers and growth in the markets we serve. We discuss our total revenue further below under the section titled “Management’s Discussion and Analysis of Financial Condition and Results of Operations.”
Gross margin. We monitor our gross margin to assess the impact on our current and forecasted financial results from any changes to the pricing and mix of products we are selling to our end-user customers.
Operating income (loss). We monitor our operating income (loss) to assess how effectively we are conducting our operations as well as controlling our operating expenses, which are primarily driven by headcount. We discuss our operating expenses further below under the section titled “Management’s Discussion and Analysis of Financial Condition and Results of Operations.”
Deferred revenue. Our deferred revenue consists of amounts that have been invoiced but that have not yet been recognized as revenue. The majority of our deferred revenue balance consists of the unamortized portion of services revenue from maintenance and support contracts. We also defer revenue, and the related costs of product revenue, on sales of products to a distributor who stocks inventory until that distributor reports to us that it has sold the product to an end-user customer. We monitor our deferred revenue balance because it represents a significant portion of the revenue that
52
Table of Contents
we will recognize in future periods. We assess the change in our deferred revenue balance which, taken together with revenue, is an indication of sales activity in a given period.
Financial Overview
Revenue
We generate revenue from the sale of products and related services, including maintenance and support. Our revenue is comprised of the following:
Product revenue. We generate product revenue primarily from sales of perpetual software licenses installed on physical appliances for our Traffic Visibility Fabric solutions. We generally recognize product revenue at the time of product delivery, provided all other revenue recognition criteria have been met. As a percentage of revenue, we expect our product revenue to vary from quarter-to-quarter based on, among other things, the timing of orders and delivery of products, seasonal and cyclical factors discussed under the section titled “—Quarterly Results of Operations.” We expect our product revenue to increase in absolute dollars as we continue to add new channel partners and end-user customers, expand the volume of shipments to our current end-user customers and introduce new products.
Services revenue. We generate service revenue from sales of maintenance and support contracts, which are bundled with sales of products, and from subsequent renewals of those contracts. We offer tiered maintenance and support services under our renewable, fee-based maintenance and support contracts, which includes technical support, hardware repair and replacement parts, bug fixes, patches and unspecified upgrades on a when-and-if-available basis. We recognize services revenue over the duration of the contract; as a result, the impact on services revenue will lag any shift in product revenue. We expect our services revenue to increase in absolute dollars as we sell more products and add more end-user customers.
Cost of revenue
Our cost of revenue is comprised of the following:
Cost of product revenue. Cost of product revenue is comprised primarily of the cost associated with manufacturing our products, including third-party hardware manufacturing costs, as well as personnel costs for salary, benefits, bonuses and stock-based compensation expense, shipping costs, allocated costs of facilities and information technology, and warranty costs and other related expenses. We expect cost of product revenue to increase in absolute dollars in connection with the anticipated increase in product revenue.
Cost of services revenue. Cost of services revenue is comprised primarily of personnel costs for salary, benefits, bonuses and stock-based compensation expense related to our customer support organization, as well as allocated costs of facilities and information technology. We expect cost of services revenue to increase with the anticipated increase in services revenue.
Gross profit and gross margin
Gross profit has been and will continue to be affected by a variety of factors including shipment volumes, changes in the mix of products and services sold, new product introductions and upgrades to existing products, changes in customer mix, changes in pricing, the extent of customer rebates and incentive programs and changes in our product costs including any excess inventory write-offs. We expect our gross margin to fluctuate over time depending on a variety of factors, including those described above.
53
Table of Contents
Operating expenses
Operating expenses consist of research and development, sales and marketing and general and administrative expenses. Personnel costs comprise a significant component of our operating expenses, and consist of salary, benefits, bonuses and stock-based compensation expense; and with respect to our sales organization, personnel costs also include sales commissions. During the periods from January 1, 2009 through December 31, 2011, we increased the number of our employees from 25 to 149. We expect to continue to hire new employees to support our anticipated growth. We expect operating expenses to increase in absolute dollars as we continue to grow.
Research and development. Our research and development efforts are focused on new product development and on developing additional functionality for our existing products. Research and development expenses consist primarily of personnel costs, and to a lesser extent, prototype materials, allocated costs of facilities and information technology and product certification. We expense research and development costs as incurred, except for certain software development costs, which have been insignificant to date. We expect our research and development expenses to increase in absolute dollars as we continue to develop new products and enhance our existing products.
Sales and marketing. Sales and marketing expenses are the largest component of our operating expenses and consist primarily of personnel costs, as well as travel expenses, trade shows, marketing and promotional activities, and allocated costs of facilities and information technology. We sell our products through our global sales organization, which is divided into three geographic regions: North America, Europe and Asia Pacific. We expect our sales and marketing expenses to increase in absolute dollars as we expand our sales and marketing efforts domestically and internationally to help drive increased revenue.
General and administrative. General and administrative expenses consist of personnel costs and allocated costs of facilities and information technology related to our executive, finance, human resources and legal functions, as well as professional services costs. Professional services costs consist primarily of outside legal and accounting services. Following the completion of this offering, we expect to incur additional expenses as a result of operating as a public company, including costs to comply with the rules and regulations applicable to companies listed on a national securities exchange and costs related to compliance and reporting obligations pursuant to the rules and regulations of the SEC. In addition, as a public company, we expect to incur increased expenses such as insurance, investor relations and professional services.
Interest income and Other income (expense), net
Interest income consists primarily of income earned on our invested cash balances. We expect interest income will vary each reporting period depending on our average invested balances during the period and market interest rates.
Other income (expense), net consists primarily of foreign currency exchange gains (losses) related to transactions denominated in currencies other than the U.S. dollar, which have not been material to date.
Provision for income taxes
For all periods presented, we have conducted our U.S. operations through Gigamon LLC, a pass through entity for tax purposes that files its income tax return as a partnership for federal and state income tax purposes. As a result, we have not been subject to U.S. federal or state income taxes as the related tax consequences have been reported by our individual members. We may be subject to
54
Table of Contents
state taxes in certain states that may assess capital taxes or taxes based on gross receipts. We also have a subsidiary in a foreign jurisdiction, which is subject to local income taxes.
In connection with the offering and as a result of the LLC Conversion, we will change our status from a limited liability company to a corporation, and accordingly, we will become taxable as a corporation for U.S. federal and state tax purposes.
Stock-based compensation expense and other compensation charges
Prior to the formation of our company in 2009, our majority stockholder, Gigamon Systems LLC, issued options to purchase its common units to some of its employees. As these employees became our employees upon the contribution of all of the assets and liabilities of Gigamon Systems LLC to us in January 2009, we assumed all of the necessary tax obligations and recorded a relatively small stock-based compensation expense related to these options in our consolidated statement of operations. Between January 1, 2009 and December 31, 2011, instead of granting stock options to our employees, we granted performance units under our 2009 Performance Unit Plan to our employees. These performance units vest and will be satisfied by us with a cash payment to the holders of performance units in connection with the completion of our initial public offering. Accordingly, the grant of performance units has not resulted in historical stock-based compensation expense nor compensation charges, but the cash payments we expect to make to the holders of performance units in connection with the completion of this offering will be recorded as compensation charges upon the completion of the offering. We estimate that the aggregate amount of these cash payments will be $ , based on an assumed initial public offering price of $ per share, which is the midpoint of the estimated offering price range set forth on the cover page of this prospectus.
Notwithstanding the fact that, prior to April 2012, we did not grant stock options to our employees, our consolidated statement of operations for 2010 reflects a stock-based compensation expense of $10.3 million related to the repurchase of shares of common stock from Gigamon Systems LLC, and the related repurchase by Gigamon Systems LLC of its membership interests from certain of our employees. In January 2010, we repurchased 24,329,545 shares of our common stock from Gigamon Systems LLC at a purchase price of $0.94 per share. Gigamon Systems LLC then used the proceeds from this transaction to repurchase common units from its equity holders, who, with the exception of one investor, were employees of our company. The January 2010 repurchase of shares of common stock held by Gigamon Systems LLC, and the repurchase by Gigamon Systems LLC of its common units is referred to in this prospectus as the “Repurchase.” Because the price paid by us for shares of common stock held by Gigamon Systems LLC, and the price paid by Gigamon Systems LLC for common units held by its equity holders, exceeded the fair value of one share of our common stock, and one common unit of Gigamon Systems LLC, respectively, the amount paid in excess of estimated fair value was accounted for as compensation expense. As a result, we recorded stock-based compensation expense, which is included in our 2010 consolidated statement of operations.
55
Table of Contents
Results of Operations
The following tables set forth our results of operations for the periods presented in dollars and as a percentage of our revenue:
| Year Ended December 31, | Three Months Ended March 31, |
|||||||||||||||||||
| 2009 | 2010 | 2011 | 2011 | 2012 | ||||||||||||||||
| (restated) |
(restated) | (restated) | (unaudited) | |||||||||||||||||
| (in thousands) | ||||||||||||||||||||
| Consolidated Statement of Operations Data: |
||||||||||||||||||||
| Revenue: |
||||||||||||||||||||
| Product |
$ | 24,664 | $ | 35,577 | $ | 51,308 | $ | 6,720 | $ | 10,893 | ||||||||||
| Services |
6,723 | 10,909 | 16,797 | 3,353 | 5,809 | |||||||||||||||
|
|
|
|
|
|
|
|
|
|
|
|||||||||||
| Total revenue |
31,387 | 46,486 | 68,105 | 10,073 | 16,702 | |||||||||||||||
|
|
|
|
|
|
|
|
|
|
|
|||||||||||
| Cost of revenue: |
||||||||||||||||||||
| Product |
4,826 | 6,122 | 12,528 | 1,569 | 3,365 | |||||||||||||||
| Services |
665 | 2,239 | 1,900 | 306 | 492 | |||||||||||||||
|
|
|
|
|
|
|
|
|
|
|
|||||||||||
| Total cost of revenue |
5,491 | 8,361 | 14,428 | 1,875 | 3,857 | |||||||||||||||
|
|
|
|
|
|
|
|
|
|
|
|||||||||||
| Gross profit |
25,896 | 38,125 | 53,677 | 8,198 | 12,845 | |||||||||||||||
|
|
|
|
|
|
|
|
|
|
|
|||||||||||
| Operating expenses: |
||||||||||||||||||||
| Research and development |
4,977 | 12,283 | 12,530 | 2,103 | 3,945 | |||||||||||||||
| Sales and marketing |
5,209 | 12,522 | 19,358 | 3,543 | 8,223 | |||||||||||||||
| General and administrative |
2,506 | 6,610 | 4,766 | 893 | 1,306 | |||||||||||||||
|
|
|
|
|
|
|
|
|
|
|
|||||||||||
| Total operating expenses |
12,692 | 31,415 | 36,654 | 6,539 | 13,474 | |||||||||||||||
|
|
|
|
|
|
|
|
|
|
|
|||||||||||
| Income (loss) from operations |
13,204 | 6,710 | 17,023 | 1,659 | (629 | ) | ||||||||||||||
| Interest income |
65 | 9 | 4 | 2 | 3 | |||||||||||||||
| Other expense, net |
(7 | ) | (7 | ) | (16 | ) | (1 | ) | (26 | ) | ||||||||||
|
|
|
|
|
|
|
|
|
|
|
|||||||||||
| Income (loss) before provision for income taxes |
13,262 | 6,712 | 17,011 | 1,660 | (652 | ) | ||||||||||||||
| Provision for income taxes |
(122 | ) | (75 | ) | (80 | ) | — | (63 | ) | |||||||||||
|
|
|
|
|
|
|
|
|
|
|
|||||||||||
| Net income (loss) |
$ | 13,140 | $ | 6,637 | $ | 16,931 | $ | 1,660 | $ | (715 | ) | |||||||||
|
|
|
|
|
|
|
|
|
|
|
|||||||||||
| Net income (loss) includes stock-based compensation expense allocated as follows: |
||||||||||||||||||||
| Cost of revenue |
$ | 8 | $ | 1,086 | $ | — | $ | — | $ | — | ||||||||||
| Research and development |
64 | 4,692 | 8 | 8 | — | |||||||||||||||
| Sales and marketing |
25 | 2,377 | 2 | 2 | — | |||||||||||||||
| General and administrative |
13 | 2,212 | 2 | 2 | — | |||||||||||||||
|
|
|
|
|
|
|
|
|
|
|
|||||||||||
| Total stock-based compensation expense |
$ | 110 | $ | 10,367 | $ | 12 | $ | 12 | $ | — | ||||||||||
|
|
|
|
|
|
|
|
|
|
|
|||||||||||
56
Table of Contents
| Year Ended December 31, | Three Months Ended March 31, |
|||||||||||||||||||
| 2009 | 2010 | 2011 | 2011 | 2012 | ||||||||||||||||
| (restated) |
(restated) | (restated) | (unaudited) | |||||||||||||||||
| Percentage of Revenue: |
||||||||||||||||||||
| Revenue: |
||||||||||||||||||||
| Product |
79 | % | 77 | % | 75 | % | 67 | % | 65 | % | ||||||||||
| Services |
21 | 23 | 25 | 33 | 35 | |||||||||||||||
|
|
|
|
|
|
|
|
|
|
|
|||||||||||
| Total revenue |
100 | 100 | 100 | 100 | 100 | |||||||||||||||
| Cost of revenue |
17 | 18 | 21 | 19 | 23 | |||||||||||||||
|
|
|
|
|
|
|
|
|
|
|
|||||||||||
| Gross margin |
83 | 82 | 79 | 81 | 77 | |||||||||||||||
|
|
|
|
|
|
|
|
|
|
|
|||||||||||
| Operating expenses: |
||||||||||||||||||||
| Research and development |
16 | 27 | 18 | 21 | 24 | |||||||||||||||
| Sales and marketing |
17 | 27 | 29 | 35 | 49 | |||||||||||||||
| General and administrative |
8 | 14 | 7 | 9 | 8 | |||||||||||||||
|
|
|
|
|
|
|
|
|
|
|
|||||||||||
| Total operating expenses |
41 | 68 | 54 | 65 | 81 | |||||||||||||||
| Income (loss) from operations |
42 | 14 | 25 | 16 | (4 | ) | ||||||||||||||
| Interest income |
— | — | — | — | — | |||||||||||||||
| Other income (expense), net |
— | — | — | — | — | |||||||||||||||
|
|
|
|
|
|
|
|
|
|
|
|||||||||||
| Income (loss) before provision for income taxes |
42 | 14 | 25 | 16 | (4 | ) | ||||||||||||||
| Provision for income taxes |
— | — | — | — | — | |||||||||||||||
|
|
|
|
|
|
|
|
|
|
|
|||||||||||
| Net income (loss) |
42 | % | 14 | % | 25 | % | 16 | % | (4 | )% | ||||||||||
|
|
|
|
|
|
|
|
|
|
|
|||||||||||
Comparison of the Three Months Ended March 31, 2011 and March 31, 2012
Revenue
| Three Months Ended March 31, |
Increase/ (Decrease) |
% Increase/ (Decrease) |
||||||||||||||
| 2011 | 2012 | |||||||||||||||
| (dollars in thousands) | ||||||||||||||||
| Revenue: |
||||||||||||||||
| Product |
$ | 6,720 | $ | 10,893 | $ | 4,173 | 62 | % | ||||||||
| Services |
3,353 | 5,809 | 2,456 | 73 | ||||||||||||
|
|
|
|
|
|
|
|||||||||||
| Total revenue |
$ | 10,073 | $ | 16,702 | $ | 6,629 | 66 | % | ||||||||
|
|
|
|
|
|
|
|||||||||||
Product revenue increased $4.2 million in the three months ended March 31, 2012 compared to the same period in 2011 primarily due to the introduction of our new high-density product, the impact of which was partially offset by lower unit sales.
Services revenue increased $2.5 million in the three months ended March 31, 2012 compared to the same period in 2011, primarily due to an increase in the total number of end-user customers under maintenance and support contracts, which was driven by higher sales of our products.
57
Table of Contents
Cost of revenue and gross margin
| Three Months Ended March 31, |
Increase / (Decrease) |
% Increase
/ (Decrease) |
||||||||||||||
| 2011 | 2012 | |||||||||||||||
| (dollars in thousands) | ||||||||||||||||
| Cost of revenue: |
||||||||||||||||
| Product |
$ | 1,569 | $ | 3,365 | $ | 1,796 | 114 | % | ||||||||
| Services |
306 | 492 | 186 | 61 | ||||||||||||
|
|
|
|
|
|
|
|||||||||||
| Total cost of revenue |
$ | 1,875 | $ | 3,857 | $ | 1,982 | 106 | % | ||||||||
|
|
|
|
|
|
|
|||||||||||
| Gross margin: |
||||||||||||||||
| Product |
77 | % | 69 | % | ||||||||||||
| Services |
91 | % | 92 | % | ||||||||||||
| Total gross margin |
81 | % | 77 | % | ||||||||||||
Total gross margin decreased to 77% for the three months ended March 31, 2012 from 81% for the same period in 2011 due to lower product gross margin. Product gross margin decreased to 69% for the three months ended March 31, 2012 from 77% for the same period in 2011, primarily due to a $1.0 million excess inventory write-off during the three months ended March 31, 2012, as compared to a $0.3 million excess inventory write-off for the same period in 2011; partially offset by a change in product mix.
Services gross margin increased to 92% for the three months ended March 31, 2012 from 91% for the same period in 2011, primarily due to the utilization of our existing cost infrastructure to manage a higher number of maintenance and support contracts.
Operating expenses
| Three Months Ended March 31, |
Increase / (Decrease) |
% Increase
/ (Decrease) |
||||||||||||||
| 2011 | 2012 | |||||||||||||||
| (dollars in thousands) | ||||||||||||||||
| Operating expenses: |
||||||||||||||||
| Research and development |
$ | 2,103 | $ | 3,945 | $ | 1,842 | 88 | % | ||||||||
| Sales and marketing |
3,543 | 8,223 | 4,680 | 132 | ||||||||||||
| General and administrative |
893 | 1,306 | 413 | 46 | ||||||||||||
|
|
|
|
|
|
|
|||||||||||
| Total operating expenses |
$ | 6,539 | $ | 13,474 | $ | 6,935 | 106 | % | ||||||||
|
|
|
|
|
|
|
|||||||||||
Research and development expenses increased $1.8 million in the three months ended March 31, 2012 compared to the same period in 2011. The increase in research and development expenses in absolute dollars for the three months ended March 31, 2012 compared to the same period in 2011 was primarily due to a $1.0 million increase in personnel costs primarily as a result of increased headcount, a $0.5 million increase in allocated costs of facilities associated with our move to our new corporate headquarters and a $0.3 million increase in prototype expenses.
58
Table of Contents
Sales and marketing expenses increased $4.7 million in the three months ended March 31, 2012 compared to the same period in 2011. The increase in sales and marketing expenses in absolute dollars for the three months ended March 31, 2012 compared to the same period in 2011 was primarily due to a $3.2 million increase in personnel costs, partially as a result of increased headcount and additional commissions related to higher sales of our products and services, a $0.5 million increase in travel-related expenses and a $0.5 million increase in trade show, marketing and promotional activities.
General and administrative expenses increased $0.4 million in the three months ended March 31, 2012 compared to the same period in 2011. The increase in general and administrative expenses in absolute dollars for the three months ended March 31, 2012 compared to the same period in 2011 was primarily due to increases in personnel costs of $0.3 million, partially as a result of increased headcount and a $0.2 million increase in professional services costs.
Comparison of the Years Ended December 31, 2010 and 2011
Revenue
| Year Ended December 31, |
Increase / (Decrease) |
% Increase
/ (Decrease) |
||||||||||||||
| 2010 | 2011 | |||||||||||||||
| (dollars in thousands) | ||||||||||||||||
| Revenue: |
||||||||||||||||
| Product |
$ | 35,577 | $ | 51,308 | $ | 15,731 | 44 | % | ||||||||
| Services |
10,909 | 16,797 | 5,888 | 54 | ||||||||||||
|
|
|
|
|
|
|
|||||||||||
| Total revenue |
$ | 46,486 | $ | 68,105 | $ | 21,619 | 47 | % | ||||||||
|
|
|
|
|
|
|
|||||||||||
Product revenue increased $15.7 million in 2011 compared to 2010. Product revenue increased in 2011 compared to 2010 primarily due to larger shipment volumes across our existing product portfolio and the introduction of a new high-density product.
Services revenue increased $5.9 million in 2011 compared to 2010. Services revenue increased in 2011 compared to 2010 primarily due to an increase in the total number of end-user customers under maintenance and support contracts, which was driven by higher sales of our products.
Cost of revenue and gross margin
| Year Ended December 31, |
Increase / (Decrease) |
% Increase
/ (Decrease) |
||||||||||||||
| 2010 | 2011 | |||||||||||||||
| (dollars in thousands) | ||||||||||||||||
| Cost of revenue: |
||||||||||||||||
| Product |
$ | 6,122 | $ | 12,528 | $ | 6,406 | 105 | % | ||||||||
| Services |
2,239 | 1,900 | (339 | ) | (15 | ) | ||||||||||
|
|
|
|
|
|
|
|||||||||||
| Total cost of revenue |
$ | 8,361 | $ | 14,428 | $ | 6,067 | 73 | % | ||||||||
|
|
|
|
|
|
|
|||||||||||
| Gross margin: |
||||||||||||||||
| Product |
83 | % | 76 | % | ||||||||||||
| Services |
79 | % | 89 | % | ||||||||||||
| Total gross margin |
82 | % | 79 | % | ||||||||||||
| Stock-based compensation expense included in: |
||||||||||||||||
| Cost of services revenue |
$ | 1,086 | $ | — | $ | (1,086 | ) | (100 | )% | |||||||
59
Table of Contents
Total gross margin decreased to 79% for 2011 from 82% in 2010 due to lower product gross margin. The decrease in product gross margin for 2011 to 76% from 83% in 2010 was primarily due to a $3.2 million excess inventory charge during 2011 that increased our cost of product revenue. The excess inventory charge in 2011 reduced our product gross margin by six percentage points.
The increase in the services gross margin for 2011 to 89% from 79% for 2010 was primarily due to a decrease of $1.1 million in stock-based compensation expense related to the Repurchase; partially offset by higher personnel costs of $0.5 million as we increased headcount to meet the support requirements of our larger installed base of end-user customers and increases in other related expenses of $0.3 million.
Operating expenses
| Year Ended December 31, | Increase / (Decrease) |
% Increase
/ (Decrease) |
||||||||||||||
| 2010 | 2011 | |||||||||||||||
| (dollars in thousands) | ||||||||||||||||
| Operating expenses: |
||||||||||||||||
| Research and development |
$ | 12,283 | $ | 12,530 | $ | 247 | 2 | % | ||||||||
| Sales and marketing |
12,522 | 19,358 | 6,836 | 55 | ||||||||||||
| General and administrative |
6,610 | 4,766 | (1,844 | ) | (28 | ) | ||||||||||
|
|
|
|
|
|
|
|||||||||||
| Total operating expenses |
$ | 31,415 | $ | 36,654 | $ | 5,239 | 17 | % | ||||||||
|
|
|
|
|
|
|
|||||||||||
| Stock-based compensation expense included in: |
||||||||||||||||
| Research and development |
$ | 4,692 | $ | 8 | $ | (4,684 | ) | (100 | )% | |||||||
| Sales and marketing |
2,377 | 2 | (2,375 | ) | (100 | ) | ||||||||||
| General and administrative |
2,212 | 2 | (2,210 | ) | (100 | ) | ||||||||||
|
|
|
|
|
|
|
|||||||||||
| Total stock-based compensation expense |
$ | 9,281 | $ | 12 | $ | (9,269 | ) | (100 | )% | |||||||
|
|
|
|
|
|
|
|||||||||||
Research and development expenses increased $0.2 million in 2011 compared to 2010. The increase in research and development expenses in absolute dollars for 2011 compared to 2010 reflects increases in personnel costs of $2.0 million primarily as a result of increased headcount, a $1.5 million increase in allocated costs of facilities as we experienced a full year of expenses associated with our move to our new corporate headquarters, a $0.9 million increase in prototype materials and a $0.3 million increase in product certification expenses. These increases were substantially offset by a decrease in stock-based compensation expense of $4.7 million in connection with the Repurchase in 2010 that did not recur in 2011.
Sales and marketing expenses increased $6.8 million in 2011 compared to 2010. The increase in sales and marketing expenses in absolute dollars for 2011 compared to 2010 was primarily due to a $6.2 million increase in personnel costs partially as a result of increased headcount, commissions and travel expenses, a $1.4 million increase in allocated costs of facilities as we experienced a full year of expenses associated with our move to our new corporate headquarters and a $1.1 million increase in tradeshow, marketing and promotional activities. These increases were partially offset by a reduction in stock-based compensation expense of $2.4 million in connection with the Repurchase in 2010 that did not recur in 2011.
General and administrative expenses decreased $1.8 million in 2011 compared to 2010. The decrease in general and administrative expenses in absolute dollars for 2011 compared to 2010 was primarily due to a decrease in stock-based compensation expense of $2.2 million in connection with the Repurchase in 2010 that did not recur in 2011; partially offset by increases in personnel costs of $0.5 million primarily as a result of increased headcount.
60
Table of Contents
Stock-based compensation expense for 2010 reflects a charge of $10.3 million, including $1.1 million included within cost of services revenue, related to the Repurchase.
Comparison of the Years Ended December 31, 2009 and 2010
Revenue
| Year Ended December 31, | Increase / (Decrease) |
% Increase
/ (Decrease) |
||||||||||||||
| 2009 | 2010 | |||||||||||||||
| (dollars in thousands) | ||||||||||||||||
| Revenue: |
||||||||||||||||
| Product |
$ | 24,664 | $ | 35,577 | $ | 10,913 | 44 | % | ||||||||
| Services |
6,723 | 10,909 | 4,186 | 62 | ||||||||||||
|
|
|
|
|
|
|
|||||||||||
| Total revenue |
$ | 31,387 | $ | 46,486 | $ | 15,099 | 48 | % | ||||||||
|
|
|
|
|
|
|
|||||||||||
Product revenue increased $10.9 million in 2010 compared to 2009 primarily due to larger shipment volumes across our existing product portfolio.
Services revenue increased $4.2 million in 2010 compared to 2009, due to an increase in the total number of end-user customers under maintenance and support contracts, which was driven by higher sales of our products.
Cost of revenue and gross margin
| Year Ended December 31, | Increase / (Decrease) |
% Increase
/ (Decrease) |
||||||||||||||
| 2009 | 2010 | |||||||||||||||
| (dollars in thousands) | ||||||||||||||||
| Cost of revenue: |
||||||||||||||||
| Product |
$ | 4,826 | $ | 6,122 | $ | 1,296 | 27 | % | ||||||||
| Services |
665 | 2,239 | 1,574 | 237 | ||||||||||||
|
|
|
|
|
|
|
|||||||||||
| Total cost of revenue |
$ | 5,491 | $ | 8,361 | $ | 2,870 | 52 | % | ||||||||
|
|
|
|
|
|
|
|||||||||||
| Gross margin: |
||||||||||||||||
| Product |
80 | % | 83 | % | ||||||||||||
| Services |
90 | % | 79 | % | ||||||||||||
| Total gross margin |
83 | % | 82 | % | ||||||||||||
| Stock-based compensation expense included in: |
||||||||||||||||
| Cost of service revenue |
$ | 8 | $ | 1,086 | $ | 1,078 | * | |||||||||
* Not meaningful
Total gross margin decreased to 82% for 2010 from 83% in 2009 as services gross margin was impacted by stock-based compensation expense related to the Repurchase.
Product gross margins increased to 83% in 2010 from 80% in 2009 due to higher volumes of product shipments and better cost containment of related costs.
Services gross margin decreased to 79% in 2010 from 90% in 2009, primarily due to a $1.1 million charge for stock-based compensation expense related to the Repurchase in 2010 and a $0.4 million increase in personnel costs as we increased headcount to meet the support requirements of our larger installed base of end-user customers.
61
Table of Contents
Operating expenses
| Year Ended December 31, | Increase / (Decrease) |
% Increase
/ (Decrease) |
||||||||||||||
| 2009 | 2010 | |||||||||||||||
| (dollars in thousands) | ||||||||||||||||
| Operating expenses: |
||||||||||||||||
| Research and development |
$ | 4,977 | $ | 12,283 | $ | 7,306 | 147 | % | ||||||||
| Sales and marketing |
5,209 | 12,522 | 7,313 | 140 | ||||||||||||
| General and administrative |
2,506 | 6,610 | 4,104 | 164 | ||||||||||||
|
|
|
|
|
|
|
|||||||||||
| Total operating expenses |
$ | 12,692 | $ | 31,415 | $ | 18,723 | 148 | % | ||||||||
|
|
|
|
|
|
|
|||||||||||
| Stock-based compensation expense included in: |
||||||||||||||||
| Research and development |
$ | 64 | $ | 4,692 | $ | 4,628 | * | |||||||||
| Sales and marketing |
25 | 2,377 | 2,352 | * | ||||||||||||
| General and administrative |
13 | 2,212 | 2,199 | * | ||||||||||||
|
|
|
|
|
|
|
|||||||||||
| Total stock-based compensation expense |
$ | 102 | $ | 9,281 | $ | 9,179 | * | |||||||||
|
|
|
|
|
|
|
|||||||||||
* Not meaningful
Research and development expenses increased $7.3 million in 2010 compared to 2009. The increase in research and development expenses in absolute dollars for 2010 compared to 2009 was primarily due to a $6.8 million increase in personnel costs as we increased headcount, including a $4.7 million increase in stock-based compensation expense incurred in connection with the Repurchase, and a $0.3 million increase in prototype materials.
Sales and marketing expenses increased $7.3 million in 2010 compared to 2009. The increase in sales and marketing expenses in absolute dollars for 2010 compared to 2009 was primarily due to a $4.0 million increase in personnel costs, including commissions, as well as travel expenses, a $2.4 million increase in stock-based compensation expense incurred in connection with the Repurchase and a $0.7 million increase in tradeshow, marketing and promotional activities.
General and administrative expenses increased $4.1 million in 2010 compared to 2009. The increase in general and administrative expenses in absolute dollars for 2010 compared to 2009 was primarily due to a $2.2 million increase in stock-based compensation expense incurred in connection with the Repurchase, a $1.2 million increase in personnel costs as we increased headcount, a $0.3 million increase in legal and accounting fees and a $0.3 million increase in allocated costs of facilities as we experienced a partial year of expenses associated with our move to our new corporate headquarters.
Stock-based compensation expense for 2010 reflects a total charge of $10.3 million, including $1.1 million included in cost of services revenue, related to the Repurchase.
62
Table of Contents
Quarterly Results of Operations
The following table sets forth our unaudited consolidated statement of operations data for each of the five quarters in the period ended March 31, 2012. The unaudited consolidated statement of operations data set forth below have been prepared on the same basis as our audited consolidated financial statements and, in the opinion of management, reflect all adjustments, consisting only of normal recurring adjustments, that are necessary for the fair statement of such data. Our historical results are not necessarily indicative of the results that may be expected for the full year or any other period. You should read this unaudited consolidated statement of operations data in conjunction with our consolidated financial statements and the related notes included elsewhere in this prospectus.
| Three Months Ended | ||||||||||||||||||||
| March 31, 2011 |
June 30, 2011 |
September 30, 2011 |
December 31, 2011 |
March 31, 2012 |
||||||||||||||||
| (in thousands) | ||||||||||||||||||||
| Consolidated Statement of Operations Data: |
||||||||||||||||||||
| Revenue: |
||||||||||||||||||||
| Product |
$ | 6,720 | $ | 11,573 | $ | 16,099 | $ | 16,916 | $ | 10,893 | ||||||||||
| Services |
3,353 | 3,988 | 4,275 | 5,181 | 5,809 | |||||||||||||||
|
|
|
|
|
|
|
|
|
|
|
|||||||||||
| Total revenue |
10,073 | 15,561 | 20,374 | 22,097 | 16,702 | |||||||||||||||
|
|
|
|
|
|
|
|
|
|
|
|||||||||||
| Cost of revenue: |
||||||||||||||||||||
| Product |
1,569 | 2,819 | 4,260 | 3,880 | 3,365 | |||||||||||||||
| Services |
306 | 432 | 523 | 639 | 492 | |||||||||||||||
|
|
|
|
|
|
|
|
|
|
|
|||||||||||
| Total cost of revenue |
1,875 | 3,251 | 4,783 | 4,519 | 3,857 | |||||||||||||||
|
|
|
|
|
|
|
|
|
|
|
|||||||||||
| Gross profit |
8,198 | 12,310 | 15,591 | 17,578 | 12,845 | |||||||||||||||
|
|
|
|
|
|
|
|
|
|
|
|||||||||||
| Research and development |
2,103 | 2,920 | 3,253 | 4,254 | 3,945 | |||||||||||||||
| Sales and marketing |
3,543 | 4,091 | 5,406 | 6,318 | 8,223 | |||||||||||||||
| General and administrative |
893 | 1,167 | 1,286 | 1,420 | 1,306 | |||||||||||||||
|
|
|
|
|
|
|
|
|
|
|
|||||||||||
| Total operating expenses |
6,539 | 8,178 | 9,945 | 11,992 | 13,474 | |||||||||||||||
|
|
|
|
|
|
|
|
|
|
|
|||||||||||
| Income (loss) from operations |
1,659 | 4,132 | 5,646 | 5,586 | (629 | ) | ||||||||||||||
| Interest income |
2 | — | — | 2 | 3 | |||||||||||||||
| Other income (expense), net |
(1 | ) | 16 | (23 | ) | (8 | ) | (26 | ) | |||||||||||
|
|
|
|
|
|
|
|
|
|
|
|||||||||||
| Income (loss) before provision for income |
1,660 | 4,148 | 5,623 | 5,580 | (652 | ) | ||||||||||||||
| Provision for income taxes |
— | (38 | ) | (27 | ) | (15 | ) | (63 | ) | |||||||||||
|
|
|
|
|
|
|
|
|
|
|
|||||||||||
| Net income (loss) |
$ | 1,660 | $ | 4,110 | $ | 5,596 | $ | 5,565 | $ | (715 | ) | |||||||||
|
|
|
|
|
|
|
|
|
|
|
|||||||||||
63
Table of Contents
The following table presents the unaudited consolidated statement of operations data as a percentage of revenue:
| Three Months Ended | ||||||||||||||||||||
| March 31, 2011 |
June 30, 2011 |
September 30, 2011 |
December 31, 2011 |
March 31, 2012 |
||||||||||||||||
| Revenue: |
||||||||||||||||||||
| Product |
67 | % | 74 | % | 79 | % | 77 | % | 65 | % | ||||||||||
| Services |
33 | 26 | 21 | 23 | 35 | |||||||||||||||
|
|
|
|
|
|
|
|
|
|
|
|||||||||||
| Total revenue |
100 | 100 | 100 | 100 | 100 | |||||||||||||||
|
|
|
|
|
|
|
|
|
|
|
|||||||||||
| Total cost of revenue |
19 | 21 | 23 | 20 | 23 | |||||||||||||||
|
|
|
|
|
|
|
|
|
|
|
|||||||||||
| Gross margin |
81 | 79 | 77 | 80 | 77 | |||||||||||||||
|
|
|
|
|
|
|
|
|
|
|
|||||||||||
| Operating expenses: |
||||||||||||||||||||
| Research and development |
21 | 19 | 16 | 19 | 24 | |||||||||||||||
| Sales and marketing |
35 | 26 | 27 | 29 | 49 | |||||||||||||||
| General and administrative |
9 | 8 | 7 | 7 | 8 | |||||||||||||||
|
|
|
|
|
|
|
|
|
|
|
|||||||||||
| Total operating expenses |
65 | 53 | 50 | 55 | 81 | |||||||||||||||
|
|
|
|
|
|
|
|
|
|
|
|||||||||||
| Income (loss) from operations |
16 | 26 | 27 | 25 | (4 | ) | ||||||||||||||
| Interest income |
— | — | — | — | — | |||||||||||||||
| Other income (expense), net |
— | — | — | — | — | |||||||||||||||
|
|
|
|
|
|
|
|
|
|
|
|||||||||||
| Income (loss) before provision for income taxes |
16 | 26 | 27 | 25 | (4 | ) | ||||||||||||||
| Provision for income taxes |
— | — | — | — | — | |||||||||||||||
|
|
|
|
|
|
|
|
|
|
|
|||||||||||
| Net income (loss) |
16 | % | 26 | % | 27 | % | 25 | % | (4 | )% | ||||||||||
|
|
|
|
|
|
|
|
|
|
|
|||||||||||
Quarterly Trends
Revenue
Our revenue increased sequentially in absolute dollars in all quarters presented, except for the first quarter of 2012, as end-user customer demand for our products continued to increase. Over the quarters presented, we continued to sell products to new end-user customers and also increased sales to our existing installed base of end-user customers, which drove sequential increases in product revenue in all quarters presented except the first quarter of 2012. Services revenue increased sequentially in all quarters presented as we expanded our installed base of end-user customers.
The first quarter of each year is usually our lowest revenue quarter during the year and product revenue typically declines sequentially from the prior fourth quarter. We believe that comparisons of our year-over-year quarterly revenue are more meaningful than comparisons of our sequential quarterly revenue due to seasonality in the sale of our products and services. We generally expect an increase in sales in the second half of the year, primarily due to the buying habits of many of our end-user customers as budgets for annual capital purchases are being fully utilized.
Gross Profit and Gross Margin
Our gross profit has generally increased quarter over quarter, except for the first quarter of 2012 as a result of the impact of seasonality, and our gross margin has remained relatively consistent over the quarters presented. Fluctuations in gross margin are primarily the result of changes in volume of products and services sold, changes in the mix of products sold, new product introductions and any excess and obsolete inventory write-offs.
64
Table of Contents
Operating Expenses
To support the growth of our business, we have continued to add employees across all functional areas, with the increase in headcount and the resulting increase in personnel costs as the primary contributing factor to the sequential increases in our operating expenses for the quarters presented. Headcount attributable to our operating expenses increased from 71 as of December 31, 2010 to 153 as of March 31, 2012.
Liquidity and Capital Resources
As of March 31, 2012, our principal sources of liquidity were our cash and cash equivalents of $16.4 million, all of which was held in the United States, and amounts available under our revolving line of credit with Silicon Valley Bank of up to $10.0 million. Our liquidity requirements are primarily to fund our working capital and operating expenses. As of March 31, 2012, we had no material commitments for capital expenditures.
As permitted by the LLC Agreement, we currently intend to distribute an amount of cash to our stockholders as of the date of the LLC Conversion equal to the members’ distribution payable balance on our consolidated financial statements, which was $7.4 million as of March 31, 2012. The actual amount we will distribute to our stockholders will depend on the amount of the members’ distribution payable as of such date. Following the completion of this offering, we intend to retain any future earnings to finance the operations and expansion of our business, and we do not anticipate paying any cash dividends on our common stock in the future.
We currently intend to use a portion of the net proceeds that we will receive from this offering to satisfy our obligations to holders of performance units under our 2009 Performance Unit Plan, which we estimate will be $ in cash in the aggregate, based on an assumed initial public offering price of $ per share, which is the midpoint of the estimated offering price range. Each $1.00 increase or decrease in the assumed initial public offering price of $ per share would increase or decrease the amount that we will pay to the holders of performance units by approximately $ million. This payment will be made within 60 days following the completion of this offering.
Our future capital requirements will depend on many factors, including our results of operations and the expansion of our research and development, sales and marketing and general and administrative functions. Based on our current operating plan, we believe our existing cash and cash equivalents and amounts available under our revolving line of credit, combined with cash generated from operations, will be sufficient to fund our working capital and operating expenses for at least the next 12 months. If we require additional capital resources to grow our business internally or to acquire complementary technologies and businesses at any time in the future, we may seek to sell additional equity, or raise funds through debt financing or other sources. The sale of additional equity could result in additional dilution to our stockholders. If we raise additional funds by obtaining loans from third parties, the terms of those financing arrangements may include negative covenants or other restrictions on our business that could impair our operating flexibility, and would also require us to incur interest expense. We can provide no assurance that additional financing will be available at all or, if available, that we would be able to obtain financing on terms favorable to us.
Our revolving line of credit is governed by a Loan and Security Agreement, as amended, with Silicon Valley Bank, under which we may, from time to time, borrow up to $10.0 million due April 2013 at a floating annual interest rate equal to the greater of 3.5% or the prime rate plus 0.25%. Borrowings under the revolving line of credit are secured by a first priority security interest in all of our assets granted to Silicon Valley Bank. To borrow amounts under the revolving line of credit, we must be in compliance with certain negative and affirmative covenants, including financial covenants, and covenants relating to our ability to incur other indebtedness, material adverse changes to our company,
65
Table of Contents
our maintenance of depository accounts with Silicon Valley Bank, our selling assets or entering into change of control transactions, liens on our assets and our ability to pay dividends to our stockholders. As of March 31, 2012, no balance was outstanding under the revolving line of credit and we were in compliance with all covenants.
Cash flows
The following table summarizes our cash flows for the periods indicated:
| Year Ended December 31, | Three Months Ended March 31, |
|||||||||||||||||||
| 2009 | 2010 | 2011 | 2011 | 2012 | ||||||||||||||||
| (unaudited) | ||||||||||||||||||||
| (in thousands) | ||||||||||||||||||||
| Cash provided by operating activities |
$ | 11,908 | $ | 7,674 | $ | 21,617 | $ | 5,036 | $ | 8,476 | ||||||||||
| Cash used in investing activities |
$ | (414 | ) | $ | (832 | ) | $ | (2,124 | ) | $ | (363 | ) | $ | (562 | ) | |||||
| Cash used in financing activities |
$ | (11,020 | ) | $ | (4,160 | ) | $ | (12,195 | ) | $ | — | $ | (4,650 | ) | ||||||
Cash flows from operating activities
Our cash provided by operating activities is generated from sales of our products and sales of maintenance and support contracts. Our primary uses of cash from operating activities have been for personnel costs and costs related to marketing and promotional activities. Our cash flows from operating activities will continue to be affected principally by our working capital requirements and increased spending on personnel to meet our anticipated business growth.
For the three months ended March 31, 2012, operating activities provided cash of $8.5 million as a result of a reduction in accounts receivable of $7.8 million due to the seasonality of sales in the first quarter of each year, coupled with a reduction of our days sales outstanding to 51 days from 68 days as of December 31, 2011, an increase of accrued liabilities of $2.1 million due to an increase in employee related costs related to equity compensation agreements with certain employees in prior years; partially offset by an increase in inventory of $1.5 million to support the growth in our product sales and our net loss of $0.7 million.
For the three months ended March 31, 2011, operating activities provided cash of $5.0 million as a result of our net income of $1.7 million, a $1.1 million reduction in our accounts receivable on lower sequential quarterly revenues due to the seasonality of sales in the first quarter of the year, a $1.0 million increase in deferred revenue due to higher service business billings as we added new end-user customers and increased our installed base, and a $1.3 million increase in accrued and other liabilities primarily due to an accrual for year end bonuses and sales commissions.
For the year ended December 31, 2011, operating activities provided cash of $21.6 million as a result of our net income of $16.9 million and non-cash charges of $4.0 million for provision of inventory reserve and depreciation and amortization, a $10.8 million increase in deferred revenue due to higher service business billings as we added new end-user customers and increased our installed base, and a $7.5 million increase in accrued and other liabilities and accounts payable primarily due to an accrual for non-cancelable future commitments related to excess inventories; partially offset by higher accounts receivable of $10.2 million due to higher sales and an increase in our days sales outstanding to 69 days from 49 days as compared to December 31, 2010, a $2.7 million increase in prepaid expenses and other current assets primarily due to an increase in employee receivables related to equity compensation agreements with certain employees in prior years, and a $4.8 million increase in inventory to support the growth in our product sales.
66
Table of Contents
For the year ended December 31, 2010, operating activities provided cash of $7.7 million as a result of our net income of $6.6 million and a $3.7 million increase in deferred revenue due to higher service business billings as we added new end-user customers and increased our installed base; partially offset by a $3.3 million increase in inventory to support the growth in our product sales and a $1.3 million increase in accounts receivable as revenue increased year over year.
For the year ended December 31, 2009, operating activities provided cash of $11.9 million as a result of our net income of $13.1 million and a $2.6 million increase in deferred revenue due to higher service business billings as we added new end-user customers and increased our installed base; partially offset by a $2.9 million increase in accounts receivable as fourth quarter revenue increased year over year and a $1.4 million increase in inventory to support the growth in our product sales.
Cash flows from investing activities
Cash used in investing activities for the three months ended March 31, 2011 and 2012 was $0.4 million and $0.6 million, respectively, and for the years ended December 31, 2009, 2010 and 2011 was $0.4 million, $0.8 million and $2.1 million, respectively, and was for capital expenditures for property and equipment to support the growth of our business.
Cash flows from financing activities
For the three months ended March 31, 2012, cash used in financing activities was $4.7 million as a result of distributions to our stockholders, compared to zero for the three months ended March 31, 2011.
For the year ended December 31, 2011, cash used in financing activities was $12.2 million as a result of distributions to our stockholders.
For the year ended December 31, 2010, cash used in financing activities was $4.2 million as a result of a $13.9 million cash distribution to our stockholders and a $12.5 million redemption of our common units from our stockholders; partially offset by the net proceeds received from the issuance of $22.2 million of shares of preferred stock.
For the year ended December 31, 2009, cash used in financing activities was $11.0 million as a result of distributions to our stockholders.
Contractual Obligations
The following summarizes our contractual obligations as of December 31, 2011:
| Payments Due by Period | ||||||||||||||||||||
| Less than 1 year |
1 to 3 years |
4 to 5 years |
More than 5 years |
Total | ||||||||||||||||
| (in thousands) | ||||||||||||||||||||
| Operating lease obligations (1) |
$ | 478 | $ | 1,410 | $ | 257 | $ | — | $ | 2,145 | ||||||||||
| Purchase commitments (2) |
7,092 | — | — | — | 7,092 | |||||||||||||||
|
|
|
|
|
|
|
|
|
|
|
|||||||||||
| Total |
$ | 7,570 | $ | 1,410 | $ | 257 | $ | — | $ | 9,237 | ||||||||||
|
|
|
|
|
|
|
|
|
|
|
|||||||||||
| (1) | Operating lease obligations represent our obligations to make payments under the lease agreements for our facilities and office equipment leases. |
| (2) | Purchase commitments primarily represent our obligations to purchase inventory and related components. $1.3 million of these purchase commitments are included within accrued liabilities on our 2011 consolidated balance sheet. |
67
Table of Contents
We have excluded from the table above the amount of our members’ distribution payable balance on our consolidated financial statements, which was $7.4 million as of March 31, 2012. As permitted by the LLC Agreement, we currently intend to distribute the members’ distribution payable balance on our consolidated financial statements to our stockholders as of the date of the LLC Conversion in connection with the completion of this offering. The actual amount we will distribute to our stockholders will depend on the amount of the members’ distribution payable balance as of such date.
Off-Balance Sheet Arrangements
We do not have any relationships with unconsolidated entities or financial partnerships, such as entities often referred to as structured finance or special purpose entities, which would have been established for the purpose of facilitating off-balance sheet arrangements or other contractually narrow or limited purposes.
Quantitative and Qualitative Disclosures about Market Risk
We are exposed to market risks in the ordinary course of our business. These risks primarily include risk related to interest rate and foreign currency exchange rate sensitivities.
Interest rate sensitivity
We had cash and cash equivalents of $13.1 million and $16.4 million as of December 31, 2011 and March 31, 2012, respectively. These amounts were held primarily in cash deposits and money market funds and are held for working capital purposes. Our primary exposure to market risk is interest rate sensitivity, which is affected by changes in the general level of the interest rates in the United States. Due to the short-term nature of these instruments, a sudden change in market interest rates would not be expected to have a material impact on our financial condition or our results of operations.
Foreign currency exchange rate sensitivity
The U.S. dollar is the functional currency for our subsidiaries and our sales to international customers are denominated in U.S. dollars. Because the U.S. dollar is our functional currency, monetary accounts denominated in non-U.S. currencies, such as cash or payables to vendors, are remeasured to U.S. dollars and all gains and losses resulting from remeasurement are recorded in other income (expense), net in our consolidated statements of operations. Non-monetary assets and liabilities are translated at historical rates. To date, our operating costs have been denominated primarily in U.S. dollars, although we incur a limited amount of operating expenses in British pounds, Euros and Hong Kong dollars. As a result, we have limited exposure to foreign currency exchange rates, and therefore we do not currently enter into foreign currency hedging transactions. If our international operations increase, our exposure to foreign currency exchange rate fluctuations may increase.
Internal Control Over Financial Reporting
As of March 31, 2012, four material weaknesses existed in our internal control over financial reporting. A material weakness is a deficiency, or a combination of deficiencies, that creates a reasonable possibility that a material misstatement of a company’s annual or interim financial statements will not be prevented or detected on a timely basis.
In connection with the preparation of our interim unaudited consolidated financial statements for the three months ended March 31, 2012, we identified two material weaknesses in our internal control over financial reporting: (i) the lack of adequate controls surrounding the inputs used in assessing the excess and obsolete inventory and (ii) the lack of adequate control in our contract review process led to a failure to appropriately identify and account for certain provisions within the equity compensation agreements of certain employees for stock options granted to them during the years ended
68
Table of Contents
December 31, 2007 and 2008. The first material weakness resulted in an error in our accounting for excess inventory write-downs, and the second resulted in an error related to our accounting for, and income tax treatment of, equity award grants for certain employees in prior periods. Having identified the errors resulting from these material weaknesses and having concluded that each of these errors was individually material to the audited consolidated financial statements for the years ended December 31, 2009, 2010 and 2011, we restated our 2009, 2010 and 2011 consolidated financial statements to correct for the aforementioned errors.
Furthermore, in connection with the audits of our consolidated financial statements for 2009 and 2010, our independent registered public accounting firm identified two additional material weaknesses: (i) our lack of technically experienced accounting personnel to perform non-routine and complex transactions, and (ii) our lack of adequate segregation of duties among the accounting personnel. These two additional material weaknesses continued to exist at December 31, 2011 and March 31, 2012.
We are working to remediate the material weaknesses identified above. We have begun taking steps and plan to take additional steps to remediate the underlying causes of these material weaknesses, primarily through formalizing and enhancing our review procedures. We have hired a number of individuals with appropriate knowledge and ability to fulfill our obligations to comply with the accounting and reporting requirements applicable to public companies, including a new chief financial officer in March 2012, a corporate controller in April 2012 and a general counsel in May 2012. The actions that we are taking are subject to ongoing senior management review, as well as oversight by our audit committee and board of directors. Although we plan to complete this remediation process as quickly as possible, we cannot at this time estimate how long it will take, and our initiatives may not prove to be successful in remediating these material weaknesses.
Assessing our procedures to improve our internal control over financial reporting is an ongoing process. We are currently not required to comply with Section 404 of the Sarbanes-Oxley Act, or Section 404, and are therefore not required to make an assessment of the effectiveness of our internal control over financial reporting. As a result, our management did not perform an evaluation of our internal control over financial reporting as of December 31, 2011. Further, our independent registered public accounting firm has not been engaged to express, nor has it expressed, an opinion on the effectiveness of our internal control over financial reporting.
For the year ending December 31, 2013, pursuant to Section 404, our management will be required to deliver a report that assesses the effectiveness of our internal control over financial reporting. In addition, under current SEC rules, when we are no longer an emerging growth company, our independent registered public accounting firm will be required to report on the effectiveness of our internal control over financial reporting.
Critical Accounting Policies
Our financial statements are prepared in accordance with generally accepted accounting principles in the United States. The preparation of these financial statements requires us to make estimates and assumptions that affect the reported amounts of assets, liabilities, revenue, operating expenses and related disclosures. We base our estimates on historical experience and on various other assumptions that we believe to be reasonable under the circumstances. In many instances, we could have reasonably used different accounting estimates. Accordingly, actual results could differ significantly from the estimates made by our management. To the extent that there are material differences between our estimates and actual results, our future financial statement presentation, financial condition, results of operations and cash flows would be affected.
We believe that of our significant accounting policies, which are described in the notes to our consolidated financial statements, the accounting policies discussed below involve the greatest degree
69
Table of Contents
of judgment and complexity and have the most significant impact on our consolidated financial statements. Accordingly, these are the policies we believe are most critical to aid in understanding and evaluating our financial condition and results of operations.
Revenue recognition
We generate revenue from sales of traffic visibility solutions to resellers and directly to end-user customers, or product revenue, as well as sales of maintenance and support contracts and other billable services, or services revenue. Our solution consists of hardware and software components that function together to deliver the essential functionality of the solution. Revenue is reported net of rebates, discounts and any other sales incentives. We recognize revenue when all of the following criteria are met:
| Ÿ | persuasive evidence of an arrangement exists; |
| Ÿ | delivery has occurred or services have been rendered; |
| Ÿ | the price is fixed or determinable; and |
| Ÿ | collectability is reasonably assured. |
We typically deliver products and services in a single transaction. The deliverables consist of traffic visibility products, maintenance and support and other billable services. Our typical arrangement includes a sale of one or multiple products that include first year maintenance and support as well as a standard warranty. Other arrangements typically consist of a sale of products bundled with additional maintenance and support or a renewal of maintenance and support contracts. Billable services are billed in advance or when service is provided and performed as requested by our end-user customers. Under maintenance and support contracts, services are provided as needed by end-user customers over the term of the contracts. As part of our standard offering, we include first year support and maintenance for no additional charge, which is accounted for as a separate deliverable. Revenue related to sales of products is recognized when title and risk of loss has transferred and all other revenue recognition criteria are met. Billable services revenue is recognized when services are rendered, and maintenance and support revenue is amortized on a straight-line basis over the service term.
For all transactions entered into prior to January 1, 2011, we allocated revenue to each element of multiple element arrangements based on each element’s fair value as determined by vendor specific objective evidence, or VSOE. VSOE of fair value of an arrangement is based upon the normal pricing and discounting practices for those products and services when sold separately, and for software updates and product support services, by the renewal rate offered to the end-user customer. We deferred revenue for any undelivered elements and recognized revenue when the product was delivered or over the period during which the service was performed, in accordance with its revenue recognition policy for each element. If we could not objectively determine the fair value of any undelivered element included in the bundled arrangements, the revenue was deferred until all elements had been delivered and services had been performed or until the fair value could be objectively determined for any remaining undelivered elements. We used the residual method to allocate revenue in multiple element arrangements as we were able to establish VSOE for the fair value for the undelivered maintenance and support arrangements based on stated renewal rates.
Effective January 1, 2011, we adopted the new accounting guidance on whether multiple deliverables exist, how the arrangement should be separated, and how the consideration should be allocated. It also requires us to allocate revenue in an arrangement using estimated selling prices of deliverables if a vendor does not have VSOE or third-party evidence, or TPE, of the selling price. The guidance eliminates the use of the residual method, and instead, requires entities to allocate revenue using a relative standalone selling price and significantly expands the disclosure requirements for
70
Table of Contents
multiple deliverable revenue arrangements. In addition, the new guidance modifies the scope of software revenue recognition to remove tangible products from the scope of the software revenue guidance. Under the new guidance, tangible products containing both software and non-software components that function together to deliver the product’s essential functionality, are excluded from the scope of software revenue recognition guidance.
The new guidance provided updates on determining whether multiple units of accounting exist, how the arrangement should be separated, and how the consideration should be allocated. The amended guidance for multiple deliverable arrangements did not change the units of accounting for our revenue transactions. Also, there is no impact on timing of revenue recognized from each deliverable in multiple element arrangements. The new guidance established a hierarchy of evidence to determine the standalone selling price of a deliverable based on VSOE, TPE or best estimated selling price, or BESP.
When we enter into arrangements to provide more than one product or service (multiple deliverables), these arrangements are evaluated to determine if the multiple elements consist of more than one unit of accounting and can be separated accordingly. Based on separation criteria under the applicable accounting guidance, deliverables in a multiple-element arrangement can be segregated into separate units of accounting if they have value to the end-user customer on a standalone basis. If deliverables can be separated into individual units of accounting, then the arrangement consideration is allocated among deliverables based on their relative selling price. Revenue from each deliverable is recognized when all requirements are met for that specific deliverable. If deliverables cannot be separated into separate units of accounting, then the arrangement will be accounted for as a single unit of accounting and revenue will be recognized when all requirements are met for all deliverables within the arrangement. We have established VSOE for maintenance and support contracts since the majority of selling prices fall within a narrow range when sold separately. For deliverables with no established VSOE, we established BESP to determine the standalone selling price for such deliverables. TPE is not used since this information is not widely available in the market. We have established a process for developing BESP, which incorporates historical selling prices, the effect of market conditions, gross margin objectives, pricing practices, as well as entity specific factors. We monitor and evaluate BESP on a regular basis to ensure that changes in circumstances are accounted for in a timely manner.
Due to the adoption of the amended guidance for multiple deliverable arrangements as of January 1, 2011, we recorded $860,000 of incremental revenue in the first quarter of 2011. We are not able to reasonably estimate the effect of adopting these standards on future periods as the impact will vary if we modify or develop new go-to-market strategies or pricing practices, which could impact VSOE and BESP, resulting in a different allocation of revenue to the deliverables in multiple element arrangements.
Inventory
Our inventories are stated at the lower of cost or market value on a first-in, first-out basis. We record inventory write-downs for the valuation of inventory at the lower of cost or net realizable value by analyzing market conditions and estimates of future sales prices as compared to inventory costs and inventory balances. Net realizable value is based upon an estimated average market value reduced by estimated completion and selling costs.
We have established procedures to evaluate inventory balances for excess quantities and obsolescence by analyzing inventory on hand, historical sales levels, estimated future demand and other known factors, and reduce inventory balances to net realizable value for excess and obsolete inventory based on this analysis. Unanticipated changes in technology or customer demand could result in a decrease in demand for our products, which may require a write-down of inventory that
71
Table of Contents
could materially affect our results of operations. Write-downs, once established, are not reversed until the related inventory has been subsequently sold or disposed.
Warranty
Prior to February 2011, we provided a one year warranty on hardware. Beginning in February 2011, we provided a five year warranty on hardware. We accrue for potential warranty claims as a component of cost of product revenue based on historical experience and other data. Accrued warranty is recorded in accrued liabilities on our consolidated balance sheets and is reviewed periodically for adequacy. If we experience an increase in warranty claims compared with our historical experience, or if the cost of servicing warranty claims is greater than expected, our gross margin and results of operations could be adversely affected. To date, we have not incurred any significant costs associated with our warranty.
Stock-based compensation expense
In April 2012, we began granting our employees and directors options to purchase shares of our common stock under our 2012 Unit Option Plan, or stock options. We recognize compensation costs related to stock options granted to employees based on the estimated fair value of the awards on the date of grant, net of estimated forfeitures. We estimate the grant date fair value, and the resulting stock-based compensation expense, using the Black-Scholes option-pricing model. The grant date fair value of the stock-based awards is recognized on the graded vesting method over the requisite service period, which is generally the vesting period of the respective awards. Stock-based compensation expense is classified in the statements of operations based on the functional area to which the related recipient belongs.
The Black-Scholes option-pricing model requires the use of highly subjective and complex assumptions which determine the fair value of stock-based awards, including the option’s expected term and the price volatility of the underlying stock. These assumptions include:
| Ÿ | Expected term. The expected term represents the period that our stock-based awards are expected to be outstanding. The expected life of options is estimated based on an average of expected lives from a peer group of publicly traded companies. |
| Ÿ | Risk-free interest rate. The risk-free interest rate for the period covering the expected life of the option is based on the U.S. Treasury yield curve in effect at the time of grant. |
| Ÿ | Expected volatility. As there is no public market for our common stock prior to our initial public offering, we have limited information on the volatility of our common stock. The expected volatility is determined based on historical volatility of the common stock of a peer group of publicly traded companies. When making the selections of our industry peer companies to be used in the volatility calculation, we considered the size, operational and economic similarities to our principle business operations. |
| Ÿ | Expected dividend. The expected dividend yield assumption is based on our future expected dividend payouts. |
In addition to assumptions used in the Black-Scholes option-pricing model, we must also estimate a forfeiture rate to calculate the stock-based compensation expense for our awards. Our forfeiture rate is based on an analysis of our actual forfeitures. We will continue to evaluate the appropriateness of the forfeiture rate based on actual forfeiture experience, analysis of employee turnover and other factors. Quarterly changes in the estimated forfeiture rate can have a significant impact on our stock-based compensation expense as the cumulative effect of adjusting the rate is recognized in the period the forfeiture estimate is changed. If a revised forfeiture rate is higher than the previously estimated forfeiture
72
Table of Contents
rate, an adjustment is made that will result in a decrease to the stock-based compensation expense recognized in our consolidated financial statements. If a revised forfeiture rate is lower than the previously estimated forfeiture rate, an adjustment is made that will result in an increase to the stock-based compensation expense recognized in our consolidated financial statements.
We will continue to use judgment in evaluating the expected term, expected volatility and forfeiture rate related to our stock-based compensation expense on a prospective basis. As we continue to accumulate additional data related to our common stock, we may have refinements to the estimates of our expected volatility, expected terms and forfeiture rates, which could materially impact our future stock-based compensation expense.
Significant factors, assumptions and methodologies used in determining fair value of shares of common stock
We are also required to estimate the fair value of the common stock underlying our stock-based awards when performing the fair value calculations with the Black-Scholes option-pricing model. The fair values of the shares of common stock underlying our stock-based awards were estimated on each grant date by our board of directors. We believe that our board of directors has the relevant experience and expertise to determine a fair value of our shares of common stock on each respective grant date. Given the absence of a public trading market of our common stock, and in accordance with the American Institute of Certified Public Accountants Practice Guide, Valuation of Privately-Held-Company Equity Securities Issued as Compensation, our board of directors exercised reasonable judgment and considered numerous objective and subjective factors to determine the best estimate of the fair value of our common stock including:
| Ÿ | rights, preferences and privileges of our convertible preferred stock relative to those of our common stock; |
| Ÿ | actual operating and financial performance; |
| Ÿ | current business conditions and projections; |
| Ÿ | trends in the technology industry; |
| Ÿ | hiring of key personnel and the experience of our management; |
| Ÿ | the value of companies we consider peers based on a number of factors, including, but not limited to, similarity to us with respect to industry, business model, stage of growth, geographic diversification, profitability, company size, financial risk or other factors; |
| Ÿ | likelihood of achieving a liquidity event, such as an initial public offering or a merger or acquisition of our company given prevailing market conditions; |
| Ÿ | illiquidity of stock-based awards involving securities in a private company; |
| Ÿ | industry information such as market size and growth; and |
| Ÿ | the U.S. and global capital market conditions. |
To determine the fair value of our common stock, our board of directors determined the equity value of our company using a weighted combination of various methodologies, each of which can be categorized under either of the following two valuation approaches: the income approach and the market approach.
Income Approach. The income approach estimates the value of our company based on our expected future cash flows discounted to present value at a rate of return commensurate with the risks associated with the cash flows. Cash flows are estimated for future periods based on projected revenue and costs. These future cash flows are discounted to their present values using a risk
73
Table of Contents
adjusted discount rate. Because the cash flows are only projected over a limited number of years, it is also necessary under the income approach to compute a terminal value as of the last period for which discrete cash flows are projected. This terminal value capitalizes the future cash flows beyond the projection period and is determined by taking the projected revenue for the final year of the projection and applying a terminal exit multiple. This amount is then discounted to its present value using a discount rate to arrive at the present value of the terminal value. The discounted projected cash flows and terminal value are summed together to arrive at an indicated aggregate equity value under the income approach. In applying the income approach, we derived the discount rate from an analysis of the cost of capital of our comparable industry peer companies as of each valuation date and adjusted it to reflect the risks inherent in our business cash flows. We derived the terminal exit multiple from an analysis of the revenue multiples of our comparable industry peer companies as of each valuation date. We then used the implied long-term growth rate of our company to assess the reasonableness of the selected terminal exit multiple.
Market Approach. The market approach incorporates various methodologies to estimate the equity value of a company: (i) the guideline public company method which utilizes market multiples of comparable companies that are publicly traded, (ii) the guideline merged and acquired company method which utilizes multiples achieved in comparable industry mergers and acquisition transactions, and (iii) preliminary IPO valuation analysis measures the value of a company through the analysis of trailing and forward trading multiples of public companies which are then applied to the subject company to develop an indication of value. We selected comparable companies and transactions, on the basis of operational and economic similarity to our business at the time of the valuation. We then calculated a multiple of key metrics implied by the enterprise values or acquisition values of these comparable companies. Based on our historical and expected performance as compared to the comparable companies and transactions, we selected appropriate multiples and applied them to our metrics to derive an indication of equity value. The resulting estimated fair value of our equity at each valuation date reflected a non-marketability discount in recognition that our stockholders cannot freely trade our common stock in the public markets.
For each valuation, we prepared a financial forecast to be used in the computation of the value of invested capital for both the market approach and income approach. The financial forecast took into account our past results and expected future financial performance. The discount rate is related generally to market required rates of return observed in the venture capital industry as well as the specific perceived risks of achieving the forecasted financial performance. There is inherent uncertainty in these estimates as the assumptions used are highly subjective and subject to changes as a result of new operating data and economic and other conditions that impact our business.
We estimated the fair value of our shares of common stock under two scenarios: an IPO scenario and a sale or merger, or M&A, scenario. Given our current stage of development and the exit strategy of our investors, we made the determination that the probabilities of a dissolution or a stay-private scenario were nominal and no indication of common stock value under these two scenarios was explicitly considered. The growth and expansion of our business in 2010 and 2011, combined with a continuing trend of general improvement in the capital markets during the same period, provided us better visibility into the likelihood of achieving a liquidity event in the next one to two years.
The IPO scenario considers ranges of future equity values based on pricing multiples of comparable public companies and allocates value to our equity securities at the time of that future liquidity event, then discounts those future common stock values at an appropriate discount rate to the valuation date. For the M&A scenario, the valuation involved a two-step process. First, a current enterprise value was determined based on the income approach, the comparable public company approach and the comparable transaction approach. Second, the equity value was allocated to the securities comprising our capital structure using the Option Pricing Method, as described in the AICPA Practice Aid titled Valuation of Privately-Held-Company Equity Securities Issued as Compensation.
74
Table of Contents
We also prepared financial forecasts for each valuation report date used in the computation of the enterprise value for both the market-comparable approach and the income approach. The financial forecasts were based on assumed revenue growth rates that took into account our past experience and contemporaneous future expectations of revenue from new and existing engagements. The risks associated with achieving these forecasts were assessed in selecting the appropriate cost of capital, which ranged from 22% to 26%.
In future periods, our stock-based compensation expense is expected to increase as we issue additional stock-based awards to attract and retain employees. In addition, as discussed below, we expect that stock-based compensation expense will increase in connection with the completion of our initial public offering.
We did not grant any stock options during the year ended December 31, 2011. We grant stock options periodically and assign an exercise price based upon the most recent common stock valuation available to us at the time of grant. The following table summarizes, by grant date, the number of stock options awarded since January 1, 2012 and the associated fair value of our common stock:
| Grant Date |
Number of Options Granted |
Exercise Price |
Fair Value Per Share of Common Stock(1) |
|||||||||
| April 5, 2012 |
4,640,800 | $ | 2.03 | $ | 3.88 | |||||||
| May 9, 2012 |
432,000 | $ | 2.03 | $ | 3.88 | |||||||
| June 19, 2012 |
791,500 | $ | 3.88 | $ | 3.88 | |||||||
| (1) | Fair value determined for financial reporting purposes in connection with a retrospective valuation. See the section titled “—March 31, 2012 Valuation” for additional information. |
December 31, 2011 Valuation
As of December 31, 2011, our board of directors determined the fair value of our common stock to be $2.03 per share. A December 31, 2011 valuation was prepared on a minority, non-marketable interest basis. Our aggregate equity value was determined using the income and market approaches. We determined that we had equal confidence in both approaches and, therefore, weighted them equally to determine the aggregate equity value before factoring in any discounts or allocations. We applied a discount rate of 22% to the values derived from the income approach, which we believed to be reasonable and appropriate to apply to the cash flow forecast given our stage of development and inherent risks. Our common stock value also reflected a discount for lack of marketability of 30%. The probability weighted expected return method, or PWERM, was used to perform an equity allocation. Our considerations of the form, timing and probability of a particular future liquidity event or outcome were based on the business outlook at the time of the valuation date. We estimated a 40% probability of an initial public offering, a 40% probability of a sale or merger and a 20% probability that we would continue as a private company. A bankruptcy scenario was deemed not probable and was assigned a 0% probability. This valuation indicated a fair value per share of our common stock of $2.03. Our board of directors used this fair value determination to set the exercise price for option grants in April and May 2012.
March 31, 2012 Valuation
In June 2012, our board of directors determined the fair value of the our common stock as of March 31, 2012 to be $3.88 per share. A June 2012 retrospective valuation was completed in which it was determined that the fair value per share of our common stock as of March 31, 2012 was $3.88 for financial reporting purposes. The retrospective March 31, 2012 valuation was prepared on a minority, non-marketable interest basis. Our aggregate equity value was determined using the income and
75
Table of Contents
market approaches. We determined that we had equal confidence in both approaches and, therefore, weighted them equally to determine the aggregate equity value before factoring in any discounts or allocations. We applied a discount rate of 25% to the values derived from the income approach, which we believed to be reasonable and appropriate to apply to the cash flow forecast given our stage of development and inherent risks. The PWERM approach scenario probabilities used in the valuation report were based on our business outlook. We estimated a 60% probability of an initial public offering and a 40% probability of a sale or merger. A bankruptcy scenario was deemed not probable and was assigned a 0% probability. Our common stock value also reflected a discount for lack of marketability of 14% for the IPO scenario and 26.1% for the M&A scenario. This valuation indicated a fair value per share of our common stock of $3.88. Our board of directors used this fair value determination to set the exercise price and fair value with respect to option grants in June 2012, and for financial reporting purposes to retrospectively set the fair value with respect to the option grants in April and May 2012.
The following discussion relates primarily to our determination of the fair value per share of our common stock for purposes of calculating stock-based compensation expense. No single event caused the valuation of our common stock to increase or decrease through June 19, 2012. Instead, a combination of the factors described below in each period led to the changes in the fair value of our common stock. Notwithstanding the fair value reassessments described below, we believe our board of directors applied a reasonable valuation methodology to determine the stock option exercise prices on the respective stock option grant dates.
April and May 2012 Stock Option Grants
The factors our board of directors considered in determining the estimated fair value of our common stock in connection with the grant of stock options in April and May 2012 primarily included the most recent valuation. The exercise price of the stock options was established to be $2.03 per share, which was based on the December 31, 2011 valuation and other available information. In June 2012, the March 31, 2012 retrospective valuation was issued that indicated the fair value had increased to $3.88 per unit. Our board of directors reassessed the fair value of our common stock for financial statement reporting purposes, taking into consideration the new valuation report. Accordingly, our board of directors assigned an estimated fair value of $3.88 per share to the April and May 2012 grants for financial reporting purposes. As the exercise price of the April and May 2012 grants was $2.03 per share, we will recognize the additional stock-based compensation expense due to the fair value reassessment over the vesting period of these stock options.
June 2012 Stock Option Grants
In June 2012, we granted stock option awards with an exercise price of $3.88 per unit. Throughout June 2012, there was no change to our financial forecast or any other significant events impacting the fair value of our common stock. Based on the March 31, 2012 retrospective valuation, we determined the estimated fair value of our common stock for awards granted in June 2012 to be $3.88 per unit.
The intrinsic value of all outstanding stock options as of , 2012 was $ million based on the estimated fair value of our common stock of $ per share, which is the midpoint of the estimated offering price range set forth on the cover page of this prospectus. As of , 2012, we had $ of unrecognized stock-based compensation expense, net of estimated forfeitures, that is expected to be recognized over a weighted-average period of years. In future periods, we expect our stock-based compensation expense to increase in absolute dollars as a result of our existing stock-based compensation to be recognized as these options vest and as we issue additional stock-based awards to attract and retain employees.
76
Table of Contents
Performance Unit Plan
In 2009, we adopted the 2009 Performance Unit Plan, or the 2009 Plan. The 2009 Plan is designed to motivate, reward and retain our key contributors such as certain employees, third–party consultants and members of our board of directors by providing a special incentive, or performance unit, based on the appreciation in our company’s value at the time of its sale or initial public offering. The distributable amount for a Change of Control (as defined below) that is a merger or acquisition is defined as the difference between the cash value of the units received by equity holders at the time of the Change of Control and the base value, which is the value assigned to the performance unit by our company’s board of directors at the time the performance unit is awarded, minus any applicable transaction expenses and amounts placed in escrow as a result of the Change of Control. The distributable amount for a Change of Control that is an initial public offering is defined as the difference between the monetary value assigned to each vested performance unit as determined by our company’s board of directors, and the base value, which is the value assigned to the performance unit by our company’s board of directors, in its sole discretion, at the time the performance unit is awarded. Although the 2009 Plan allows for the participants’ distribution in connection with an initial public offering to be settled in cash or an equity award, we have elected to pay the distributable amount in cash. Performance units do not constitute ownership units or interests of our company. Performance units will vest upon the satisfaction of both a service-based condition and a liquidity event. Performance units granted under the 2009 Plan may vest over a four-year period with 25% vesting on the first anniversary from the grant date and the remainder vesting ratably each month over the ensuing 36-month period, or, in the case of awards of performance units to our sales personnel, vesting is based upon the achievement of specified objectives of product bookings. In addition, performance units will only vest upon the following occurrences, which are referred to as a “Change of Control:”
| Ÿ | The acquisition by any person, or more than one person acting as a group, of shares of capital stock of our company that, together with shares held by such person or group, constitutes more than 50% of the total fair market value or of the total voting power represented by our then outstanding capital stock; |
| Ÿ | The acquisition by any person, or more than one person acting as a group, of all or substantially all of our assets, provided that such assets have at least a total gross fair market value equal to or more than 90% of the total gross fair market value of all of our assets immediately before such acquisition, except that no Change of Control shall occur if the assets are transferred to an entity that is controlled by the equity holders of our company immediately after the transfer; or |
| Ÿ | an initial public offering. |
In the event a participant’s continuous status as an employee or consultant terminates for any reason (including death or disability of participant) prior to the redemption date, vesting shall cease and all rights to receive distributions with respect to unvested performance units granted under the 2009 Plan shall cease and be terminated as of the date of such termination of employment or consultancy. Upon a Change of Control, all unvested performance units shall be terminated.
Under existing accounting pronouncements, expense associated with the performance units are not required to be reflected in the financial statements until a Change of Control is deemed probable. Accordingly, we have not recorded any compensation expense associated with the performance units.
As of December 31, 2011 and March 31, 2012, there were 4,659,258 and 4,593,215 performance units outstanding, and 1,379,083 and 1,633,244 vested performance units outstanding, respectively. Based upon a base value of $0.05 for each performance unit and the fair value of our common stock at December 31, 2011 and March 31, 2012 of $2.03 and $3.88 per share, the aggregate distributable
77
Table of Contents
amount for vested performance units outstanding as of December 31, 2011 and March 31, 2012 was $2.7 million and $6.3 million, respectively.
Recent Accounting Pronouncements
Under the Jumpstart Our Business Startups Act, or the JOBS Act, we meet the definition of an “emerging growth company.” We have irrevocably elected to opt out of the extended transition period for complying with new or revised accounting standards pursuant to Section 107(b) of the JOBS Act. As a result, we will comply with new or revised accounting standards on the relevant dates on which adoption of such standards is required for non- emerging growth companies.
In May 2011, the FASB further amended its guidance related to fair value measurements in order to achieve common fair value measurements between U.S. GAAP and International Financial Reporting Standards. The amendments in the updated guidance explain how to measure fair value. They do not require additional fair value measurements and are not intended to establish valuation standards or affect valuation practices outside of financial reporting. The amendments change the wording used to describe many of the requirements in U.S. GAAP for measuring fair value and for disclosing information about fair value measurements. For many of the requirements, the updated guidance should not result in a change in the application of previous fair value measurement guidance. The updated guidance is effective during interim and annual periods beginning after December 15, 2011. The adoption of this guidance on January 1, 2012 did not have a significant impact on our consolidated financial statements.
In June 2011, the FASB updated its guidance related to the presentation of comprehensive income. Under the updated guidance, an entity has the option to present the total of comprehensive income, the components of net income, and the components of other comprehensive income either in a single continuous statement of comprehensive income or in two separate but consecutive statements. In both choices, an entity is required to present each component of net income along with total net income, each component of other comprehensive income along with a total for other comprehensive income, and a total amount for comprehensive income. The updated guidance eliminates the option to present the components of other comprehensive income as part of the statement of changes in stockholders’ equity. The amendments in the updated guidance do not change the items that must be reported in other comprehensive income or when an item of other comprehensive income must be reclassified to net income. In December 2011, the FASB further amended its guidance to defer changes related to the presentation of reclassification adjustments indefinitely as a result of concerns raised by stakeholders that the new presentation requirements would be difficult for preparers and add unnecessary complexity to financial statements. The updated guidance, other than the portion related to the presentation of reclassification adjustments, will be effective for fiscal years, and interim periods within those fiscal years, beginning after December 15, 2011, with early adoption permitted. The updated guidance must be applied retrospectively. The adoption of this guidance on January 1, 2012 did not have an impact on our consolidated financial statements.
78
Table of Contents
Overview
We have developed a new and innovative solution that delivers pervasive and dynamic visibility and control of traffic across networks. Our solution, which we refer to as our Traffic Visibility Fabric, consists of distributed network appliances that provide an advanced level of network traffic intelligence. Our Fabric enables IT organizations to forward traffic from network infrastructure to management, analysis, compliance and security tools in a manner that is optimized for specific uses or locations. At the heart of the Fabric is our patented Flow Mapping™ technology that identifies and directs incoming traffic to single or multiple tools based on user-defined rules implemented from a centralized management console. Our Fabric is designed to help organizations ensure the reliability, performance and security of their network infrastructure, minimize capital investment in management, analysis, compliance and security tools, reduce operating expenses and realize greater value from the existing tools that are deployed throughout their networks.
Virtualization and cloud computing, mobility and big data are reshaping the way enterprises and service providers operate and the way people communicate over IP networks in an increasingly connected world. As these forces combine to enable significant benefits to be realized from IT innovation, they also create major challenges in how enterprises and service providers design, operate and manage their networks. As a result, organizations increasingly require enhanced visibility and control of their networks through the efficient collection and analysis of network traffic flows without degrading network performance or reliability. These challenges have forced organizations to deploy a range of traditional approaches and related network hardware, which are costly and can often lead to increased operational complexity without delivering the intelligent filtering capabilities required by managers and operators of network infrastructure. Our Fabric provides the pervasive visibility and control over network traffic, including voice, video and data, that organizations need to successfully manage, analyze and secure their environments. We believe that the market opportunity for this type of solution is large, commensurate with the significant expenditures that enterprises and service providers have and will continue to make deploying network management, analysis, compliance and security tools and hardware.
Our Traffic Visibility Fabric is deployed by enterprises and service providers as a highly scalable infrastructure layer that operates “out of band,” or in parallel to, the production network that is supporting primary business activities, and facilitates the transmission of network traffic between the network infrastructure and one or more network management, analysis, compliance or security tools. Our Traffic Visibility Fabric is built on the GigaVUE family of products. GigaVUE products are purpose-built physical appliances that are integrated with our proprietary software and enable our end-user customers to design Traffic Visibility Fabric architectures optimized for a range of scale and performance requirements from 1 Gigabit appliances to 1 Terabit chassis-based solutions. Our GigaVUE products are modular and extensible, enabling our Fabric to be deployed on any size network and to scale as the network grows.
We were founded in 2004 with the vision of developing a new approach to providing visibility and control over network traffic that would enable enterprises and service providers to significantly improve the performance, availability and value of the increasing breadth of tools designed to manage, analyze and secure networks. In 2005, we introduced our patented Flow Mapping technology in combination with the launch of our first product, the GigaVUE-MP. Since then we have continued to expand our product portfolio including adding the GigaVUE H Series chassis, the first Terabit scale Traffic Visibility Fabric for high-throughput environments, which we launched in 2011.
79
Table of Contents
We sell our products directly through our own sales force and indirectly through our channel partners. As of March 31, 2012, our end-user customers included 43 of the Fortune 100, and we had sold products to over 825 end-user customers across many vertical markets, including four of the top ten U.S. retailers, four of the top five U.S. banks and financial services companies, five of the top ten U.S. integrated telecommunication service providers, three of the top five U.S. managed healthcare providers, five of the top ten U.S. cable and satellite providers and three of the top ten global securities and commodities exchanges.
We were founded in 2004, and have experienced significant growth since inception. Our total revenue increased from $31.4 million in 2009 to $68.1 million in 2011, representing a compound annual growth rate, or CAGR, of 47%. Our revenue increased from $10.1 million during the three months ended March 31, 2011 to $16.7 million during the three months ended March 31, 2012, representing 66% growth, and we have generated positive cash flows in each of the last six years.
Industry Background
As IP communication networks have become increasingly critical to enterprises and service providers, these organizations are continuing to invest in network infrastructure that includes a variety of tools to manage, analyze and secure their networks. However, powerful forces are transforming the traditional ways that enterprises and service providers design, operate and manage their networks. These forces include:
| Ÿ | Virtualization and Cloud Computing. Organizations are rapidly adopting virtualization and cloud computing technologies that enable them to scale their infrastructure on demand, drive increasing resource utilization, consolidate physical infrastructure and potentially reduce costs. Applications and computing resources that were formerly stationary in a physical network environment can now move dynamically between servers or data centers, through automated requests or resource-balancing decisions in a virtualized model. Enterprises and service providers are seeking to enhance visibility and control over their network traffic as they manage the transition from static physical architectures to dynamic virtual environments. |
| Ÿ | Mobility. The rapid increase in the reach and performance of mobile access networks – ranging from wireless local area networks to national cellular networks – has increased user expectations of high quality, “always on” and “anywhere” connectivity. Enterprises are looking for ways to improve the productivity of their increasingly mobile workforce by providing enhanced access to their network and workplace applications regardless of the physical location of their workers, while maintaining control over valuable corporate data in accordance with corporate policies. Service providers are seeking to balance increased access demands with the significant capital investment required to deliver their services, and are attempting to monetize new service offerings and improve the satisfaction and retention rates of their customers. |
| Ÿ | Big Data. As enterprises and consumers increase their usage of data-rich systems and bandwidth intensive applications from multiple connected devices, the volume of network traffic continues to grow significantly. According to IDC, the volume of digital information created and replicated will grow from 1.8 trillion Gigabytes in 2011 to 7.9 trillion Gigabytes in 2015. Organizations are increasingly challenged to scale their networks to meet the demand of network traffic being generated, manipulated and stored. As a result, enterprises and service providers are seeking the capability to intelligently select and deliver traffic optimized for their management, analysis, compliance and security tools in order to improve the performance and reliability of their networks. |
80
Table of Contents
Collectively, virtualization and cloud computing, mobility and big data are not only driving significant benefits from IT innovation but also creating and intensifying significant challenges in how organizations manage, analyze and secure their networks. These challenges include:
| Ÿ | Growing Network Traffic Volumes. As organizations experience significant growth in network traffic, and users demand access to more bandwidth intensive and latency-sensitive applications and services, enterprises and service providers are being forced to upgrade their networks to improve their performance, visibility and control. Enterprises are upgrading their networks from 1 Gigabit to 10 Gigabit today with a move from 10 Gigabit to 40 Gigabit and 100 Gigabit on the horizon. At the same time, service providers are facing intense competitive pressure to make capital investments to ensure their regional, national or global networking infrastructure can handle the volume and distribution of traffic required to deliver the services demanded by their subscribers. Existing management, analysis, compliance and security tools can become oversubscribed by large volumes of non-relevant network traffic, leading to dropped packets, the potential loss of critical information and associated management implications. In order for these tools to remain useful amid increasing data volumes on the production network, enterprises and service providers must find a way to intelligently select, sort and direct relevant traffic flows to the appropriate tools. |
| Ÿ | Security and Compliance. Organizations today are increasingly focused on IT security threats as the frequency and severity of cyber attacks continue to rise. Hackers and malicious insiders have become more organized and motivated for financial gain, leading to the use of new advanced attack techniques for the theft of valuable data. Many large organizations have recently been the victims of highly publicized, sophisticated attacks that have resulted in costly data breaches and reputational harm. The regulatory landscape has continued to evolve for enterprises across various industries and service providers to adhere to strict design, implementation, documentation, analysis, data protection, reporting standards and controls. As a result, organizations are investing greater resources and increasing their focus on security and compliance initiatives. Gartner predicts that by 2014, 70% of IT risk and security officers in the Global 2000 will be required to report at least annually to their board of directors on the state of IT security within their organization. |
| Ÿ | Proliferation of Connected Devices. Mobile users are increasingly accessing networks from multiple devices, such as laptops, tablets and smart phones from both within and outside physical enterprise network perimeters through wireless networks. Enterprises and service providers are seeking new approaches to gain visibility into the traffic destined for different end-point devices as a first step to enable the optimization of service delivery depending upon the type of device and user activity. Understanding device capabilities permits accurate profiling and tuning of traffic flows to optimize network efficiency in a variety of ways. For example, service providers can provide latency-sensitive or bandwidth-intensive applications, like video, transmission priority over latency-tolerant applications sharing the same communications path. As a result, enterprises and service providers must invest in enhancing their visibility and control over network traffic in order to improve the productivity and efficiency of their production networks. |
| Ÿ | Consumerization of IT. Enterprise employees are increasingly accessing corporate networks and applications in ways that have diminished the IT organization’s control over the devices, applications and services interacting on the network. Employees adopting technology for personal use and extending that use to the enterprise is often referred to as the “consumerization of IT.” Gartner forecasts that by 2014, 90% of organizations will support enterprise applications on personal devices. With less control over devices, applications, services and vendors, IT organizations need an alternative strategy to manage network operations, analyze performance and maintain the security and compliance of the network. In this evolving landscape, increased visibility and control of network traffic between applications |
81
Table of Contents
| and devices is becoming more critical for the IT organization to ensure the security, performance and reliability of their networks. |
| Ÿ | Adoption of Cloud-Based IT. An increasing number of organizations are replacing traditional on-premise infrastructure, development platforms and applications with a variety of Software-as-a-Service, Platform-as-a-Service and Infrastructure-as-a-Service technologies in order to decrease the upfront cost and time associated with traditional implementations. With these types of cloud-based technologies, IT departments work to integrate their existing “internal” environment with the cloud infrastructure of third-party providers. These changes can amplify security or network reliability risks as more corporate data is being managed by third parties on increasingly dynamic network infrastructure. Although the IT organization may sanction these cloud-based technologies and applications, they must still actively manage and analyze the traffic flows across their networks for performance issues, access rights and potential data vulnerabilities. |
Limitations of Traditional Approaches
The impact of virtualization and cloud computing, mobility and big data are combining to increase network complexity and potentially introduce new network vulnerabilities while creating new challenges for enterprises and service providers who are struggling to maintain or improve service delivery and limit network downtime. As a result, organizations are seeking to improve visibility and control of their networks through the intelligent collection, modification and analysis of traffic without adversely impacting network performance or reliability. The process of capturing and analyzing network traffic is, in itself, complex as it requires the extraction of the traffic, classification to determine appropriate priority of the traffic, and delivery to the relevant tool or tools for analysis. IT organizations have historically had access to a limited range of traditional approaches to address these requirements, including:
| Ÿ | Proliferation of Management, Analysis, Compliance and Security Tools. IT organizations typically deploy management, analysis, compliance and security tools to ensure the performance, reliability and integrity of expanding network infrastructure. Examples of these tools include application and network performance management, customer experience management, data loss prevention, intrusion detection and prevention systems, security information and event management, firewalls, web security devices and data recording devices. As networks scale, IT organizations often respond by deploying multiple editions of the same tool or their proxies in an effort to provide comprehensive network coverage. However, this approach increases capital and operating expenses, infrastructure complexity and associated management challenges. |
| Ÿ | Repurposing Ethernet Switches. Organizations can establish a separate layer of infrastructure using incremental repurposed Ethernet switches to supplement the core production network and deliver traffic to various tools. However, because Ethernet switches are not specifically designed to intelligently select and modify network traffic, configuring these switches can be very complex, maintaining them can be resource demanding and these configurations are fundamentally static in nature. Any change to the underlying network switching topology or the traffic flow across the network requires a series of additional and complex changes to be made to the configuration of these Ethernet switches. Furthermore, this approach does not offer the flexibility to easily or dynamically accommodate new tools, new applications and virtualized environments. |
82
Table of Contents
| Ÿ | Duplicating Traffic via a Mirroring Port. Organizations often utilize mirror ports that allow for duplication of a subset of network traffic traversing a particular Ethernet switch to be forwarded to specific tools. Although industry standard Ethernet switches typically include mirror ports, these ports are not designed to intelligently select specific traffic for capture, duplication or forwarding, and have limited capacity to handle high traffic volumes. Attempting to select traffic beyond basic levels of intelligence places additional burden on the processing resources of the switch itself resulting in either a degradation to the flow of production network traffic through the switch, failure of the mirror port to select and forward all the traffic, or both. As the process to modify the traffic selection criteria of a mirror port typically involves a reconfiguration of the production network, the change can only occur during scheduled maintenance windows. With the increased pressure to deliver enhanced service level agreements, and potentially maintain 99.999% uptime, maintenance windows are required to be short and infrequent (potentially monthly) leading to a notable delay before the configuration change can be made. |
| Ÿ | Dividing Traffic Flows via Network TAPs. An alternative to the mirror port is the network Test Access Point, or TAP, which is deployed directly in-line of the traffic flow in the production network, and is designed to create a replica of all network traffic passing that point. However, TAPs are primarily passive devices that have significant limitations in that they lack the intelligence to filter packets and instead oversubscribe analysis and management tools with superfluous packets. For example, TAPs can introduce performance and reliability issues, with copper versions potentially impacting the network when power is lost, and fiber-optic versions causing signal degradation as light is deflected to create the traffic replica. |
These traditional approaches fail to provide a comprehensive solution that enables enterprises and service providers to more effectively manage, analyze and secure their networks. In particular these traditional approaches:
| Ÿ | provide limited visibility and control because they lack intelligent traffic filtration and centralized control over network traffic flows; |
| Ÿ | constrain tool flexibility to respond to and simplify changing network architectures including dynamic virtual environments; |
| Ÿ | delay the deployment of network upgrades to respond to increased traffic demands as existing tools may not be able to scale to increased network throughput and performance requirements; |
| Ÿ | increase the cost and complexity of deploying and managing new and existing tools; and |
| Ÿ | reduce reliability of management, analysis, compliance and security tools supporting the business processes running on the network. |
Given the performance limitations, cost and complexity of traditional approaches, enterprises and service providers utilizing these alternatives struggle to scale and ensure the performance, reliability and integrity of their network infrastructure. Without the ability to scale with network growth and to analyze packet contents, prioritize latency-sensitive data and intelligently direct individual packets to the relevant tools, these approaches fail to deliver a comprehensive solution that offers visibility into and control over network traffic.
The following diagram shows a network that utilizes the various traditional approaches that fail to offer pervasive visibility and control over network traffic.
83
Table of Contents
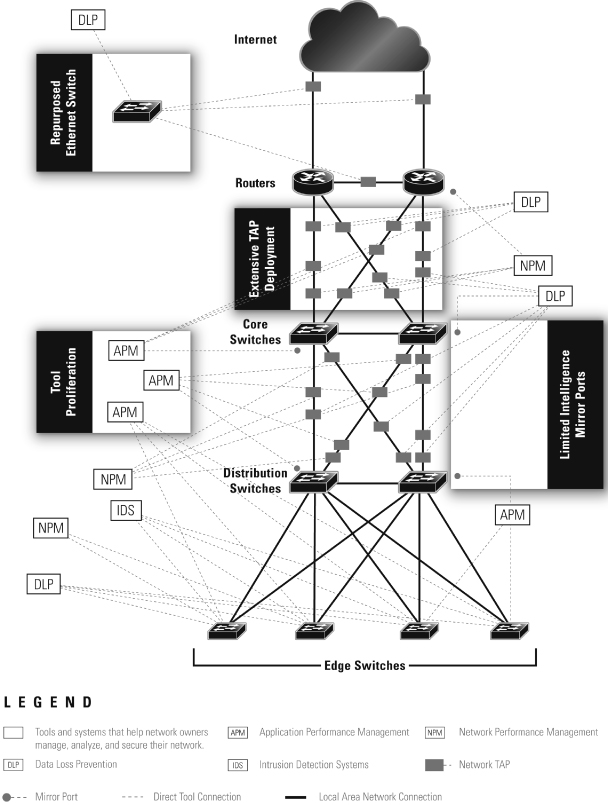
84
Table of Contents
Need for a Comprehensive Visibility Solution
We were founded on the belief that organizations need a fundamentally new approach to network traffic visibility to address growing demand for increased efficiency and performance, and to improve quality and breadth of service offerings. Our belief continues to be validated by the growth in the market for network traffic visibility solutions, and is supported by the results of an independent survey of IT leaders, conducted by the Enterprise Strategy Group, or ESG. Although the market for a traffic visibility fabric is still developing, the ESG survey refers to a variety of drivers that both identify the shortcomings of current alternatives and support the need for a new approach. Of the respondents surveyed by ESG:
| Ÿ | 78% indicated that a traffic visibility fabric would be a useful enhancement to their environment; |
| Ÿ | 48% indicated that network monitoring today requires too many collection points distributed throughout the network; |
| Ÿ | 44% have found that SPAN ports are unreliable for monitoring purposes due to frequent dropped packets; and |
| Ÿ | 38% think that their suite of monitoring and security tools cannot keep pace with network growth. |
Organizations continue to incur significant capital and operational expenses to acquire and maintain tools that monitor, analyze and secure their networks. We believe a solution that can optimize the efficiency and performance of these tools by delivering pervasive visibility and control over network traffic creates a significant market opportunity. Furthermore, we believe the market for a traffic visibility fabric is under-penetrated and expect spending on this type of solution to grow significantly as networks continue to increase in size, throughput and complexity and to deliver new services in response to the powerful forces of virtualization and cloud computing, mobility and big data.
Our Solution
We have developed a new and innovative solution that delivers pervasive and dynamic visibility and control of traffic across networks. Our Traffic Visibility Fabric consists of distributed network appliances that provide an advanced level of network traffic intelligence including proprietary traffic forwarding, manipulation, modification and de-duplication capabilities. Our solution enables IT organizations to forward traffic from network infrastructure to management, analysis, compliance and security tools in a manner that is optimized for specific uses or locations. At the heart of the Fabric is our patented Flow Mapping™ technology that identifies and directs incoming traffic to single or multiple tools based on user-defined rules implemented from a centralized management console. Our Fabric helps organizations ensure the reliability, performance and security of their network infrastructure, minimize capital investment in management, analysis, compliance and security tools, reduce operating expenses and realize greater value from the existing tools that are deployed throughout their networks.
We offer purpose-built physical appliances that are integrated with our proprietary software and enable our end-user customers to design Traffic Visibility Fabric architectures optimized for a range of scale and performance requirements from 1 Gigabit appliances to 1 Terabit chassis-based solutions. Our GigaVUE products are modular and extensible, enabling our Fabric to be deployed on any size network and to scale as the network grows. The key benefits of our solution are:
| Ÿ | Providing Pervasive Visibility and Control. Our Fabric inspects and intelligently filters data packets from concurrent traffic streams in accordance with a set of user-defined criteria before delivering the traffic to management, analysis, compliance and security tools. This provides IT organizations with pervasive visibility and intelligent control over how traffic flows from the |
85
Table of Contents
| network to management, analysis, compliance and security tools, and what modification or manipulation of the traffic is required to improve the performance of the management, analysis, compliance or security tools. |
| Ÿ | Enabling Rapid Response to Dynamic Change. Our Fabric significantly improves network flexibility by enabling static tools to connect to virtualized applications, dynamic infrastructure and mobile machines, which allows our end-user customers to efficiently and securely address their business needs. Our Fabric is designed to have full interoperability with a broad range of tools, allowing IT organizations maximum architectural flexibility in the design, modification and evolution of their infrastructure. |
| Ÿ | Delivering Scalable, High-Throughput Capacity. Our Fabric provides increased visibility and intelligent traffic filtering without impeding the delivery of traffic to management, analysis, compliance or security tools. At the top end of our GigaVUE family of products, we offer modular chassis products that deliver a Terabit of capacity enabling the Fabric to effectively extend to networks of significant scale and performance requirements. |
| Ÿ | Improving Network Efficiency and Economy. Our Fabric improves the longevity and associated return on investment of existing tools by both obviating their need to examine all network traffic and increasing their network coverage. Our Fabric mitigates the need to purchase more tools or to upgrade older tools to accommodate network growth. Our solution reduces capital and operating costs by decreasing the necessary outlays associated with new or more advanced tools, limiting the infrastructure footprints in space-constrained data centers and curtailing the staff required to monitor and maintain the network. |
| Ÿ | Enhancing Network Reliability. By reducing the need for tools to process non-relevant traffic, which can lead to dropped packets and compromised analysis, our Fabric increases the reliability of attached tools and the critical business processes running on production networks. In addition, because our Fabric is deployed “out of band,” modifications to the configuration of the Traffic Visibility Fabric do not require network downtime while changes are implemented, which helps organizations achieve or maintain 99.999% uptime. |
| Ÿ | Ease of Deployment and Use. We have designed our Fabric to be easy to install, configure and maintain. Our Fabric can be composed of a single appliance or multiple appliances controlled remotely from a simple centralized interface, enabling our end-user customers to reduce management and maintenance of unmanned, or dark, data centers. |
The following diagram highlights the improved architectural simplicity based upon a solution utilizing our Fabric.
86
Table of Contents
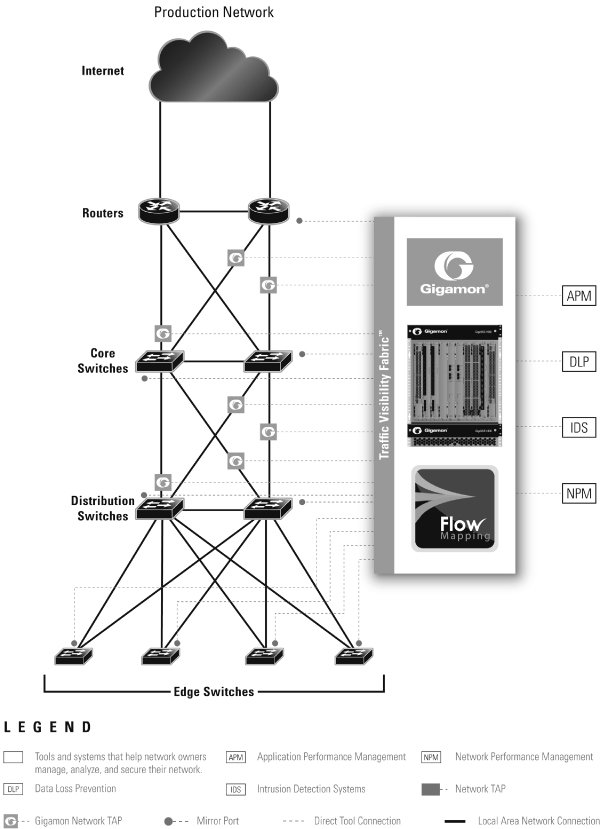
87
Table of Contents
Growth Strategy
Our goal is to continue to develop the nascent market for network traffic visibility solutions, extend our market leadership position and support the ongoing adoption of our innovative Traffic Visibility Fabric by enterprises and service providers. Key elements of our growth strategy include:
| Ÿ | Continuous Innovation. We intend to enhance the functionality and scalability of our Fabric to address new use cases, tool capabilities, deployment environments and performance levels. We will continue to invest in our technology to maintain our competitive advantage and market leadership, and we will build on our consistent track record of technical innovation. Examples of our prior technical innovations are: |
| • | In 2005, we introduced GigaVUE-MP, which offered powerful, intelligent traffic filtering and management; |
| • | In 2007, we launched enhancements to these capabilities and introduced our broader Flow Mapping technology; In 2008, we began shipping a 10 Gigabit fabric solution; |
| • | In 2010, we introduced next generation packet inspection to enable improved fabric performance; |
| • | In 2011, we became the first to market with a 1 Terabit chassis Traffic Visibility Fabric solution, the GigaVUE H Series; and |
| • | In 2012, we launched the virtual implementation of the GigaVUE. |
| Ÿ | Increase Awareness of Our Value Proposition. We believe awareness of the value proposition of our Traffic Visibility Fabric and its technological capabilities in this emerging market is critical to our success and will help us grow our business and market opportunity. We plan to invest in our brand and develop awareness of the benefits of our Fabric by expanding our presence at major trade events, extending our relationship with industry analysts and increasing investment in our channel-partner marketing efforts. |
| Ÿ | Expand Our Relationships with Existing End-User Customers. We have over 825 end-user customers and intend to increase the depth of these existing relationships by offering new products that help them increase the value of their new and existing management, analysis, compliance and security tools, adopt virtualization and cloud technologies and efficiently scale their network environments. |
| Ÿ | Invest in our Global Distribution Network. Our sales and marketing strategy consists of a hybrid, two-tier sales model that combines a high-touch direct sales force with fulfillment handled by over 150 active channel partners that distribute or resell our products. We will continue to invest in our sales and marketing strategy both domestically and internationally to further strengthen our existing relationships with channel partners and expand our network by adding new channel partners to broaden our reach and target new end-user customers, with specific focus on increasing international sales in the near term and building greater awareness of our Traffic Visibility Fabric. |
Technology
Our Traffic Visibility Fabric combines purpose-built hardware with proprietary software that together provide an advanced level of network traffic intelligence, including proprietary traffic forwarding, manipulation, modification and de-duplication capabilities. We design physical appliances based upon a combination of commercially available hardware components, processing resources and storage devices. The vast majority of our intellectual property is found in our proprietary software that provides the full benefits of our Fabric including centralized control over our appliance, through both a powerful Command-Line Interface, or CLI, and a web enabled Graphic User Interface, or GUI.
88
Table of Contents
Our core technology is built around the following primary elements:
| Ÿ | Traffic Control. At the core of our Fabric is our patented traffic selecting and filtering technology called, Flow Mapping™. Flow Mapping allows incoming traffic to be forwarded to single or multiple egress ports based on a set of user-defined map rules. Each map rule consists of packet selection criteria that can include certain protocol fields or packet “bit patterns” in ISO layer 2, 3 or 4 of the packet, and a required action to be performed on the packet. This allows the replication of traffic to a second egress port even though the traffic has been selected and forwarded to another egress port. Actions can include the forwarding of the packet, the duplication of the packet or, in some cases, the intentional discarding of the packet. The Fabric, and the associated appliances, can support many complex and concurrent maps that all execute when ingress traffic is received into any port on the Fabric. One primary value of Flow Mapping is that it enables management and analysis tools that have lower packet processing capacity to monitor higher bandwidth network connections through the intelligent selection of the traffic that is forwarded to the tool. For example, a 10 Gigabit network can be monitored by a collection of 1 Gigabit tools through the segregation of traffic based upon a range of criteria and forwarding of traffic to different tools depending on those criteria. |
Our end-user customers can also purchase additional traffic control technology via our GigaStream products that provide a traffic-distribution capability enabling traffic to be spread across a number of egress ports based on an operator-selected distribution algorithm. There are two primary GigaStream products: Stack GigaStream that distributes traffic across an intra-fabric connection between two appliances, allowing multiple 10 Gigabit connections to be bundled to form a single higher bandwidth stacking connection; and Tool GigaStream that allows traffic to be distributed between a number of tools. Furthermore, an inter-site traffic ‘tunneling’ capability is available to allow traffic to be captured at a remote location, and then tunneled to a central location for analysis, inspection and/or monitoring.
| Ÿ | Packet Processing. Our GigaSMART packet processing technology extends the intelligence and value of the Traffic Visibility Fabric by allowing packets to be modified during transit through the Fabric. The modifications include: |
| • | Time stamping, which adds a precise measurement to a packet that is an essential component to any latency measurement and, together with ingress port labeling, it allows a snapshot to be taken the moment the packet ingresses to any GigaVUE appliance in the Fabric, enabling deeper analysis by network tools. |
| • | Slicing, which reduces the size of a packet by trimming out those portions of a packet that are not relevant to the management analysis, compliance or security tool. |
| • | De-Duplication, which establishes a time window during which any duplicates of a packet that ingress the fabric are discarded. By eliminating packets not relevant to the analysis being completed, an organization can significantly reduce wasted bandwidth, storage capacity and associated processing resources. |
| • | Masking, which allows for specific portions of the traffic to be replaced or modified, thus masking the contents from any tools or employees reviewing or analyzing the traffic. With the increasing focus and compliance demand for credit card and personal records to be protected, masking allows for sensitive data to be protected while still allowing for full analysis to be undertaken. |
| • | Header removal, which enables proprietary packet headers to be removed for tools that are unable to interpret these format headers so that the packets can be appropriately processed by the tools. Furthermore, GigaSMART has the ability to replace removed headers with non-proprietary fields to enable subsequent analysis by network tools. |
89
Table of Contents
Our GigaSMART technology is tightly integrated into the Flow Mapping capability allowing for a specific subset of the incoming traffic to be selected for additional processing and modification. We believe that we will expand the number of packet modifications over time as more innovative tools and applications are delivered to address specific new requirements as the reach, scale and demands of the network increase.
| Ÿ | Fabric Performance. Our appliances are designed around a core of packet-forwarding hardware components. When forwarding traffic through the Fabric and depending upon the configuration, topology and requirements, packets can move from an ingress network port to an egress tool port at line rate through the hardware even when complex selection and filtering is applied during the transit process. Our GigaVUE products support packet ingress and egress at speeds of 10Mb, 100Mb, 1 Gigabit, 10 Gigabit and 40 Gigabit concurrently, and the GigaVUE H Series have a back-plane design allowing concurrent non-blocking traffic packet transfer from any line card to any other line card at up to 1 Terabit per second. |
Our GigaVUE products are designed to achieve carrier grade uptime. Failover protection mechanisms, including dual power-supplies and dual fan trays, are available within the GigaVUE family as is back-to-front airflow to comply with data center cooling design requirements.
| Ÿ | Fabric Scalability. Our proprietary software provides the foundation by which multiple appliances in the Fabric can be combined to form a larger scale deployment while maintaining line rate processing performance of all traffic flowing through the Fabric. Traffic can enter at any ingress port on one of our appliances and be forwarded to one or more egress ports on the Fabric. Our software allows a master-subordinate control architecture to be configured, where one fabric appliance is designated as the “master” and all other appliances assume the role of “subordinate.” The fabric can be configured and managed by the operator through the “master” using either a CLI, or via the web-enabled GUI. This architecture assures the ability to add additional subordinates, or appliances, in order to scale the fabric, without needing complex configuration changes. |
| Ÿ | Access and Reporting. Our Fabric provides granular access controls that can be applied to support compliance with applicable regulations such as the Sarbanes-Oxley Act. Our solution enables network segmentation, segregation of duties, auditing of network activities and the tracking of access rights and privileges associated with individual users. |
Products
Our GigaVUE product family provides end-user customers with multiple performance and port density configurations in order to design a Traffic Visibility Fabric optimized for a range of size and performance requirements. Our appliances range from a single rack unit appliance to a modular multi-slot chassis that accommodates a range of our line cards.
The GigaVUE product family is comprised of the original G Series and the higher density and higher performance H Series of products. Both the G and H Series incorporate our patented Flow Mapping technology and can be used to either establish a visibility fabric as standalone appliances or to create a multi-appliance fabric architecture. Although many of our end-user customers’ need for a visibility fabric can be satisfied by our G Series appliances as standalone solutions, some of our end-user customers were seeking higher density, higher capacity solutions as the breadth of the Fabric started to span higher-density and higher-bandwidth environments. As a result, we developed the H Series.
| Ÿ | The G Series. The GigaVUE G Series was introduced in 2005. The series is comprised of a range of purpose-built, small form-factor traffic visibility appliances with some having NEBS certification. The complete G Series has achieved the industry recognized Common Criteria EAL2 certification. Each chassis is modular, providing support for optional line cards (port |
90
Table of Contents
| modules), TAP modules or advanced traffic manipulation or modification blades (the GigaSMART and GigaSECURE modules). The GigaSMART optional card offers de-duplication, tunneling, masking, slicing, time stamping and header stripping capabilities that are enabled through software licenses. Our GigaSMART technology was introduced in 2010 and improves the efficiency of attached network management, analysis, compliance and security tools by off-loading certain processing-intense functions. Our GigaSECURE products were introduced in 2011 and provide in-line packet distribution specifically designed for use with security-based tools such as Intrusion Prevention Systems, or IPS. The GigaSECURE products are designed to support two-way traffic communications and provide “bypass” protection allowing packets to be distributed to multiple IPS devices where they are screened, and then aggregated back together for entry back to the network. These appliances are frequently deployed in 10 Gigabit networks that need to be protected by lower-cost 1 Gigabit tools. Avoiding the need to purchase high cost 10 Gigabit IPS tools more than offsets the cost to our end-user customers of purchasing the GigaVUE and GigaSECURE products. The GigaSECURE products are available in both blade and standalone configurations. |
The following table outlines our G Series products:
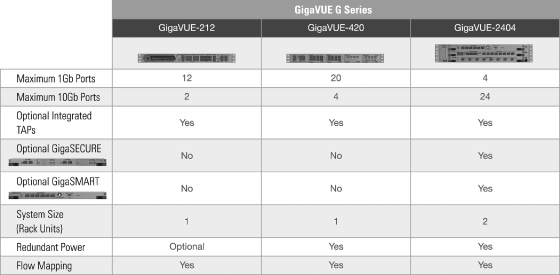
| Ÿ | The H Series. The GigaVUE H Series was introduced in 2011 and utilizes a robust Linux-based operating platform enabling high-density, high-scale configurations. The series includes both large blade-based chassis configurations and a high-density fixed configuration product specifically designed to cost-effectively aggregate 10 Gigabit traffic links together. Modular appliances share control and line cards providing flexibility across systems. Line cards come in multiple variants including a range of physical media (copper and fiber optic) and a range of connection speeds from 1 Gigabit to 40 Gigabit. The H Series support hundreds of network port connections and multiple appliances that can be clustered together creating a fabric of more than a thousand network and tool connections. With the backplane capacity of the GigaVUE-HD8 exceeding 1 Terabit, recent line cards have delivered multiple 10 Gigabit and 40 Gigabit connections on a single card offering total bandwidth of 320 Gigabit and also a hardware-based nano-second accurate time stamping line card. |
91
Table of Contents
The following table outlines our H Series products:
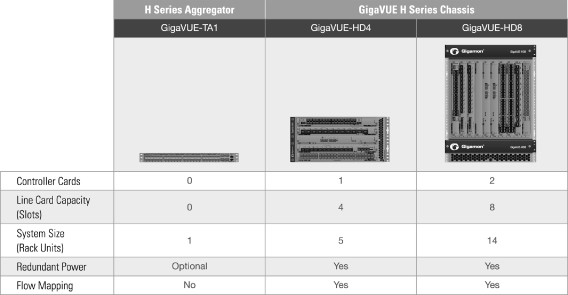
The following table outlines the H Series line cards that are designed to work with both the GigaVUE-HD8 and GigaVUE-HD4 modular chassis products:
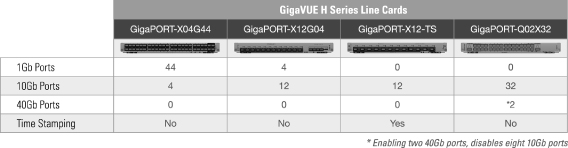
To complement the G and H Series products, we offer a range of supplemental components and accessories including modules, cables and transceivers. The GigaTAP products provide a range of traditional network TAPs to allow our end-user customers to feed traffic into the Visibility Fabric. The GigaTAP products were introduced in July 2005 and can be integrated into the GigaVUE products or provided as standalone offerings. Other complementary products include transceivers we sell, including a variety of form factors—SFP, SFP+, and QSFP+.
Customer Support
We offer ongoing technical support with our hardware and software products, including those sold directly to our end-user customers and through our channel partners. Our primary support offering, SupportCARE, provides two-tiered support levels, including premium-level support coverage. Certain channel partners offer their own additional brand of support services to the end-user customer and then rely on our support organization for more complex support requests. We offer our end-user customers ongoing maintenance services for both hardware and software, which enables them to receive ongoing software updates, upgrades, bug fixes and repairs. These services are typically sold to end-user customers for a one-year term at the time of the initial product sale and typically renew for successive
92
Table of Contents
annual or multi-year periods. We also provide end-user customers with expedited replacement for any defective hardware. All of our hardware products are sold with limited 5-year warranty service.
We also offer DesignCARE in the North America region, which provides end-user customers with professional services that range from the architectural design of a Traffic Visibility Fabric for their customized requirements to the complete implementation and configuration of GigaVUE appliances across multiple locations. Our support personnel are based in Milpitas, California and Reading, United Kingdom. As we expand internationally, we expect to continue to hire additional support personnel to service our global customer base.
End-User Customers
As of March 31, 2012, we had over 825 end-user customers, including 43 of the Fortune 100. Our Fabric can be used in a broad range of applications and has been adopted across many vertical markets including finance, high-speed trading, insurance, healthcare, higher education, government, local state, e-commerce, technology, telecom and service providers. For example, our end-user customers include:
| Ÿ | four of the top ten U.S. retailers; |
| Ÿ | four of the top five U.S. banks and diversified financial services companies; |
| Ÿ | five of the top ten U.S. integrated telecommunication service providers; |
| Ÿ | three of the top five U.S. managed healthcare providers; |
| Ÿ | five of the top ten U.S. cable and satellite providers; and |
| Ÿ | three of the top ten global securities and commodities exchanges. |
Sales and Marketing
We sell our products through a network of channel partners and our direct sales force.
We market and sell our products through a hybrid sales model, which combines a high-touch sales organization and an overlay channel sales team that actively assists our extensive network of channel partners throughout the sales process. We also provide our channel partners with marketing assistance, technical training and support. Our direct sales teams are typically comprised of a combination of a field sales representative and a systems engineer. These teams also have access to a pool of shared inside sales and telemarketing representatives. Each sales team is responsible for a geographical territory, has responsibility for a number of major direct end-user customer accounts or has assigned accounts in a specific vertical market.
Our demand generation activities are focused primarily on Fortune 1000 organizations, large service providers and large and mid-sized enterprises where we continue to see increased demand for our Traffic Visibility Fabric. We also focus on ongoing account management for existing end-user customers and the development of follow-on sales as our existing end-user customers continue to expand and enhance their network infrastructure, increasing their demand for our Fabric. The majority of our North American sales are fulfilled by one of our existing channel partners, Interlink Communications Systems, Inc.
To access potential end-user customers worldwide, our direct sales force is distributed across our offices in California, New York, the United Kingdom, Singapore, Hong Kong and through a localized presence in many countries. We are increasingly focused on building our sales presence outside of the United States.
Our marketing strategy is focused on increasing the awareness of, and driving end-user customer demand for, our Traffic Visibility Fabric. We execute on this strategy by leveraging a combination of internal marketing professionals and a network of channel partners to effectively communicate the value proposition, differentiation and advantages of our Traffic Visibility Fabric, thereby generating
93
Table of Contents
qualified leads for our sales force and channel partners. We focus our resources on a variety of marketing vehicles, including trade shows, advertising, public relations, industry research, our website and collaborative relationships with technology vendors.
Technology Partners
We have ongoing non-exclusive relationships with a number of leading vendors of network management, analysis, compliance and security tools, including recent arrangements with Compuware Corporation, OPNET Technologies, Inc., Riverbed Technology, Inc. and TeaLeaf Technology, Inc. (a subsidiary of International Business Machines Corporation), some of which include the joint development of use-case and reference architectures that enhance the performance and efficiency of the end-user customer’s network. We expect to continue adding more technology partners and to publish joint case studies with these partners following end-user deployment and approval. In addition to joint development of reference designs and case studies, we have undertaken various joint-marketing activities and events to drive interest and awareness of the combined solution as well as the Visibility Fabric itself. As our Fabric helps optimize the efficiency of our tool partners’ management, analysis, compliance and security tools, we believe these vendors improve awareness at end-user customers of our Fabric and create new deployment opportunities.
Research and Development
We believe continued investment in research and development is critical to our business. Our research and development efforts focus primarily on improving and enhancing our existing products and services, as well as developing new products, features and functionality. We believe that our proprietary software is critical to expanding our leadership position within the traffic visibility market. As a result, we devote the majority of our research and development resources to software development. Our engineering team has deep expertise in key areas related to our research and development efforts, including network analysis and management technologies, network protocol and Ethernet system design. We work closely with our end-user customers to understand their current and future needs and have designed a product development process that captures and integrates feedback from our end-user customers.
We believe the timely development of new products is essential to maintaining our competitive position. As of March 31, 2012, we had 50 employees in our research and development organization, substantially all of whom were located at our headquarters in Milpitas, California. We also test our products to certify and ensure interoperability with third-party hardware and software products. We plan to prioritize and dedicate significant resources to these continued research and development efforts.
Our research and development expenses were $3.9 million, or 24% of our revenue, in the three months ended March 31, 2012, $12.5 million, or 18% of our revenue, in 2011, $12.3 million, or 27% of our revenue, in 2010 and $5.0 million, or 16% of our revenue in 2009.
Manufacturing and Suppliers
We outsource the manufacturing of our hardware products to our contract manufacturers, NBS Design, Inc. and United Manufacturing Assembly, Inc. Our hardware products are manufactured and assembled primarily in the San Francisco Bay Area, and are then delivered to us for final-stage assembly and in-house quality control inspection and testing, which we conduct at our Milpitas facilities, to monitor and ensure the quality and reliability of all products.
We utilize components from many suppliers. Whenever possible, we strive to have multiple sources for these components to ensure continuous supply. However, we have limited sources of supply for certain components that are technically unique or in high demand, and we have not entered
94
Table of Contents
into supply agreements with any of these suppliers. In such cases, we seek to maintain a close direct relationship with the suppliers to ensure supply is adequate and that the components meet our quality requirements. In certain instances, we have entered into license agreements with sole-source suppliers, allowing us to incorporate certain of their components into our hardware products.
Competition
The markets in which we compete are highly competitive. We expect competition to intensify in the future as existing competitors bundle new and more competitive offerings with their existing products and services, and as new market entrants introduce new products into our markets.
We compete either directly or indirectly with large Ethernet switch vendors, such as Cisco Systems, Inc. and Juniper Networks, Inc., and network management, analysis, compliance and security tool vendors that offer point solutions that address a portion of the issues that we solve. In the future, we expect to compete with new market entrants, which may include our joint-development partners or other current technology partners.
The principal competitive factors applicable to our products include:
| Ÿ | functionality and performance; |
| Ÿ | price and total cost of ownership; |
| Ÿ | ease of use; |
| Ÿ | flexibility and scalability of deployment; |
| Ÿ | brand awareness; |
| Ÿ | breadth of portfolio; |
| Ÿ | product reliability and quality; |
| Ÿ | interoperability with other products; |
| Ÿ | the extent and speed of user adoption; and |
| Ÿ | quality of service, support and fulfillment. |
Although we believe that we compete favorably with respect to the above factors, we believe that other competitors will emerge that may have greater name recognition, longer operating histories, well-established relationships with end-user customers or channel partners in our markets and substantially greater financial, technical, personnel and other resources than we have. We expect competition and competitive pressure, from both new and existing competitors, to increase in the future.
Intellectual Property
To protect our intellectual property, we rely primarily on patent, trademark, copyright and trade secret laws. As of March 31, 2012, we had eight issued patents that expire between 2024 to 2029, and eighteen pending patent applications in the United States and at least three corresponding Patent Cooperation Treaty patent applications. The claims for which we have sought patent protection relate primarily to system architecture, traffic visibility technology, traffic control and management, and filtering technology we have developed. We also license software from third parties for integration into our products, including open source software and other commercially available software.
As part of our strategy to protect our proprietary technologies and our intellectual property rights from unauthorized parties that may attempt to copy aspects of our products or obtain and use our trade secrets or other confidential information, we generally enter into confidentiality agreements with our employees, consultants, channel partners and end-user customers, and generally limit access to and distribution of our proprietary information and proprietary technology.
95
Table of Contents
Employees
As of March 31, 2012, our total headcount was 166 employees, including 50 primarily engaged in research and development, 86 in sales and marketing, 13 in manufacturing and support and 17 in general and administrative activities. None of our employees is represented by a labor union or is a party to any collective bargaining arrangement in connection with his or her employment with us. We have never experienced any work stoppages, and we consider our relations with our employees to be good.
Facilities
Our headquarters occupy approximately 45,000 square feet in Milpitas, California under a lease that expires in June 2016. We have an early termination option which allows us to terminate this lease effective June 2014 as well as an option to extend this lease to June 2019. We have an additional research and development location in New York, New York. We lease space in various international locations for operations and sales personnel. Our current facilities are adequate to meet our existing needs. However, to the extent we meet our current growth expectations, we will need to expand our facilities. We believe that we will be able to obtain additional or substitute facilities on commercially reasonable terms.
Legal Proceedings
We may, from time to time, be subject to legal proceedings and claims arising from the normal course of business activities, and an unfavorable resolution of any of these matters could materially affect our future business, results of operations, financial condition or cash flows.
96
Table of Contents
Executive Officers, Directors and Key Employees
The following table provides information regarding our executive officers and directors as of May 31, 2012:
| Name |
Age | Position(s) | ||||
| Executive Officers: |
||||||
| Ted C. Ho |
53 | Chief Executive Officer and Chairman | ||||
| Duston M. Williams |
53 | Chief Financial Officer | ||||
| Thomas K.Y. Cheung |
40 | Vice President of Engineering | ||||
| Michael T. Hoffman |
43 | Vice President of Worldwide Sales | ||||
| Paul A. Hooper |
49 | Vice President of Marketing | ||||
| Patrick P. Leong |
45 | Chief Technology Officer and Director | ||||
| Paul B. Shinn |
42 | General Counsel | ||||
| Other Directors: |
||||||
| Kenneth A. Goldman(1) |
62 | Director | ||||
| Andrew M. Miller(1) |
52 | Director | ||||
| Corey M. Mulloy(1)(2) |
40 | Director | ||||
| Michael C. Ruettgers(2) |
69 | Director | ||||
| (1) | Member of our audit committee |
| (2) | Member of our compensation committee |
Ted C. Ho co-founded our company in 2004 and has served as a member of our board of directors since inception. Mr. Ho has served as our chief executive officer since February 2008. Prior to founding our company, he served as vice president of engineering at McAfee, Inc., from January 2001 to May 2003. From May 1998 to January 2001, Mr. Ho served as a director of engineering at McAfee. Mr. Ho holds a B.S. degree in Civil Engineering from the National Cheung-Kung University in Taiwan and an M.S. degree in structural engineering and computer engineering from the University of Southern California.
We believe that Mr. Ho is qualified to serve as a member of our board of directors because of the perspective and experience he brings as our co-founder and chief executive officer, as well as his perspective as one of our largest stockholders.
Duston M. Williams has served as our chief financial officer since March 2012. Prior to joining our company, he served as chief financial officer for SandForce, Inc., a data storage company, from March 2011 through its sale to LSI Corporation in January 2012. From June 2006 to June 2010, Mr. Williams served as vice president and chief financial officer of Infinera Corporation. From December 2004 to June 2006, Mr. Williams served as executive vice president and chief financial officer of Maxtor Corporation. From July 2003 to November 2004, Mr. Williams served as chief financial officer of Aruba Wireless Networks. From July 2001 to February 2003, Mr. Williams served as the chief financial officer of Rhapsody Networks Inc., a data storage networking company. From January 2000 to June 2001, Mr. Williams served as chief financial officer of Netigy Corporation, an infrastructure consulting and services company. From July 1986 to December 1999, Mr. Williams served in a variety of accounting and finance positions at Western Digital Corporation, including as its senior vice president and chief financial officer. Mr. Williams holds a B.S. degree in accounting from Bentley College and an M.B.A. degree from the University of Southern California.
97
Table of Contents
Patrick P. Leong co-founded our company in 2004 and has served as a member of our board of directors since inception. Mr. Leong has served as our chief technology officer since October 2005. Prior to founding our company, he served as a principal engineer at Ciena Corporation from March 2001 to August 2004, which he joined in connection with Ciena’s acquisition of Cyras Systems, Inc. in March 2001, where he served in a similar capacity from August 2000. From December 1996 to July 2000, Mr. Leong served in various roles, including manager of high speed products, at the Sniffer Division of McAfee, Inc. Mr. Leong holds a B.S. degree in physics from John Carroll University, an M.S. degree in computer science from the University of New Mexico, and a Ph.D. degree in applied physics from Columbia University.
We believe that Mr. Leong is qualified to serve as a member of our board of directors because of his technical acumen and the experience he brings as our co-founder and chief technology officer, as well as his perspective as one of our largest stockholders.
Thomas K.Y. Cheung co-founded our company in 2004 and has served as a member of our board of directors since inception. Mr. Cheung has served as our vice president of engineering since May 2010, and as principal hardware engineer since inception. Prior to founding our company, he served as an engineer at Ciena Corporation from March 2002 to May 2004, which he joined in connection with Ciena’s acquisition of Cyras in March 2001, where he served in a similar capacity from June 2000. Mr. Cheung holds a B.S. degree in electrical engineering from San Jose State University.
Michael T. Hoffman joined our company in June 2008 and has served as our vice president of worldwide sales since August 2011. Mr. Hoffman also served as our vice president of North American sales from July 2009 until August 2011, and as a regional sales manager from June 2008 to July 2009. Prior to joining our company, he served as the vice president of enterprise sales at MRV Communications, Inc., a telecommunications networking equipment and services company, from January 2006 to June 2008. From November 1999 to January 2006, Mr. Hoffman served as regional director at Fluke Corporation, a network, security and software company. From July 1999 to November 1999, Mr. Hoffman served as an account manager at Quest Media and Supplies, Inc., an IT distributor and consulting company. From March 1996 to July 1999, Mr. Hoffman served as a sales engineer at Ward/Davis Associates, a manufacturer’s representative firm specializing in network test and measurement. From September 1995 to March 1996, Mr. Hoffman served as an account manager at Pitney Bowes Inc. From September 1987 to September 1995, Mr. Hoffman served in the U.S. Navy’s Advanced Electronics Field. Mr. Hoffman holds a B.A. degree in management and an M.B.A. degree from St. Mary’s College.
Paul A. Hooper has served as our vice president of marketing since July 2011. Prior to joining our company, he served in several positions at Extreme Networks, Inc., including the chief marketing officer, vice president and general manager for the volume products group, and chief information officer, from August 2002 to July 2011. From November 1999 to August 2002, Mr. Hooper served in several positions, including vice president of information technology, at myCFO, Inc., a financial services and advisory company. From March 1998 to November 1999, Mr. Hooper served as senior director of information technology at JDS Uniphase Corporation, a telecommunications networking company. From August 1996 to March 1998, Mr. Hooper served as senior director of networking and telecommunications at Netscape Communications Corporation, a software and services company.
Paul B. Shinn has served as our general counsel since May 2012. Prior to joining our company, he served in several positions, including vice president and associate general counsel of the Enterprise Group, at Hewlett-Packard Company from March 2007 through May 2012. From March 1997 to February 2007, Mr. Shinn was an attorney at Wilson Sonsini Goodrich & Rosati, P.C., a law firm. Mr. Shinn holds B.A. degrees in government and philosophy from the University of Notre Dame and a J.D. degree from Santa Clara University School of Law.
98
Table of Contents
Non-Employee Directors
Kenneth A. Goldman has served as a member of our board of directors since January 2011. Since September 2007, he has served as the senior vice president, finance and administration, and chief financial officer, of Fortinet Inc. From November 2006 to August 2007, Mr. Goldman served as executive vice president and chief financial officer of Dexterra, Inc., a mobile platform and application provider. From August 2000 until March 2006, Mr. Goldman served as senior vice president, finance and administration, and chief financial officer of Siebel Systems, Inc. Mr. Goldman has also served as senior vice president and chief financial officer of Excite@Home Corporation and Sybase, Inc., and has served as chief financial officer of Cypress Semiconductor Corporation, and VLSI Technology, Inc. Mr. Goldman currently serves on the boards of directors of Infinera Corporation and NXP Semiconductors N.V., as well as several private companies. Mr. Goldman is also a member of the board of trustees of Cornell University. From December 1999 to December 2003, Mr. Goldman served as an advisory council member of the Financial Accounting Standards Board Advisory Council. Mr. Goldman holds a B.S. degree in electrical engineering from Cornell University and an M.B.A. degree from Harvard Business School.
We believe that Mr. Goldman is qualified to serve as a member of our board of directors because of his financial and accounting expertise, his experience serving as the chief financial officer of numerous public companies in the technology industry, and his experience serving on the boards of directors of several public companies and as a member of the Financial Accounting Standards Board Advisory Council.
Corey M. Mulloy has served as a member of our board of directors since January 2010. Since 1997, he has served in several roles at Highland Capital Partners, a venture capital firm, and has been a general partner since 2005. From 1995 to 1997, Mr. Mulloy served as a financial analyst in the investment banking group at Robertson, Stephens & Co., L.L.C., an investment bank. Mr. Mulloy also serves as a director of a number of private companies. Mr. Mulloy holds a B.A. degree in economics from Swarthmore College and an M.B.A. degree from Harvard Business School.
We believe that Mr. Mulloy is qualified to serve as a member of our board of directors because of his experience in the venture capital industry analyzing, investing in and serving on the boards of directors of technology companies, as well as his perspective as a representative of one of our largest stockholders.
Andrew M. Miller has served as a member of our board of directors since May 2012. Since May 2010, he has served as the president, chief executive officer and a member of the board of directors of Polycom, Inc. From July 2009 to May 2010, Mr. Miller served as the executive vice president of global field operations of Polycom. From December 2007 to June 2009, Mr. Miller served as the global president of IPC Information Systems, LLC, a trading technology and network connectivity provider. From June 2006 to August 2007, Mr. Miller served as senior vice president of North America for Monster Worldwide Inc. From January 2002 to June 2006, Mr. Miller served as chief executive officer of Tandberg ASA, a video solutions provider. Mr. Miller currently serves on the boards of directors of Polycom and Bridgepoint Education, Inc., and previously served on the board of directors of BroadSoft, Inc. Mr. Miller was formerly chairperson of the Young Presidents’ Organization/Stanford Executive Education Program, and also served as a member of the board of visitors of the Smeal School of Business at The Pennsylvania State University, and as a member of the Society of Fellows at the Aspen Institute. Mr. Miller holds a B.S. in business administration from the University of South Carolina.
We believe that Mr. Miller is qualified to serve as a member of our board of directors because of his experience in senior management positions at several technology companies, his knowledge of
99
Table of Contents
strategic and operational issues facing technology companies and his experience serving on the boards of directors of several public companies.
Michael C. Ruettgers has served as a member of our board of directors since December 2010. In December 2005, he retired from his position at EMC Corporation, where he served as chairman from 2004 to December 2005, executive chairman from 2001 to 2004, and chief executive officer from 1992 to 2001. From 1988 to 1992, Mr. Ruettgers served in various senior executive positions at EMC. Mr. Ruettgers currently serves on the boards of directors of Raytheon Corporation and Wolfson Microelectronics plc. Mr. Ruettgers holds a B.S. degree in business administration from Idaho State University and an M.B.A. degree from Harvard Business School.
We believe that Mr. Ruettgers is qualified to serve as a member of our board of directors because of his extensive business experience, skills and acumen developed as a senior executive at a large public company operating in the technology industry, as well as his experience serving on the boards of directors of public companies.
Each officer serves at the discretion of our board of directors and holds office until his or her successor is duly elected and qualified or until his or her earlier resignation or removal. There are no family relationships among any of our directors or executive officers.
Codes of Business Conduct and Ethics
Prior to the completion of this offering, our board of directors will adopt a code of business conduct and ethics that applies to all of our employees, officers and directors, including our chief executive officer, chief financial officer and other principal executive and senior financial officers.
Board of Directors
Our business and affairs are managed under the direction of our board of directors. The number of directors will be fixed by our board of directors, subject to the terms of our amended and restated certificate of incorporation and amended and restated bylaws that will become effective immediately prior to the completion of this offering. Upon the completion of this offering, our board of directors will consist of six directors, four of whom will qualify as “independent” under the listing standards.
In accordance with our amended and restated certificate of incorporation and our amended and restated bylaws, immediately after the completion of this offering our board of directors will be divided into three classes with staggered three-year terms. Only one class of directors will be elected at each annual meeting of our stockholders, with the other classes continuing for the remainder of their respective three-year terms. Our directors will be divided among the three classes as follows:
| Ÿ | the Class I directors will be and , and their terms will expire at the annual meeting of stockholders to be held in 2013; |
| Ÿ | the Class II directors will be and , and their terms will expire at the annual meeting of stockholders to be held in 2014; and |
| Ÿ | the Class III directors will be and , and their terms will expire at the annual meeting of stockholders to be held in 2015. |
Any increase or decrease in the number of directors will be distributed among the three classes so that, as nearly as possible, each class will consist of one-third of the directors.
100
Table of Contents
This classification of our board of directors may have the effect of delaying or preventing changes in control of our company.
Director Independence
Our board of directors has undertaken a review of the independence of each director. Based on information provided by each director concerning his background, employment and affiliations, our board of directors determined that Messrs. Goldman, Miller, Mulloy and Ruettgers do not have a relationship that would interfere with the exercise of independent judgment in carrying out the responsibilities of a director and that each of these directors is “independent” as that term is defined under the applicable rules and regulations of the SEC and the listing requirements and rules of . In making these determinations, our board of directors considered the current and prior relationships that each non-employee director has with our company and all other facts and circumstances our board of directors deemed relevant in determining their independence, including the beneficial ownership of our capital stock by each non-employee director, and the transactions involving them described in the section titled “Certain Relationships and Related Party Transactions.”
Committees of the Board of Directors
Our board of directors has established an audit committee and a compensation committee and, effective prior to the completion of this offering, will establish a nominating and governance committee. The composition and responsibilities of each of the committees of our board of directors is described below. Members will serve on these committees until their resignation or until otherwise determined by our board of directors.
Audit Committee
Since May 2012, our audit committee has been comprised of Messrs. Goldman, Miller and Mulloy, with Mr. Goldman serving as chairman. Messrs. Goldman and Miller meet the requirements for independence of audit committee members under current listing standards and SEC rules and regulations. Each member of our audit committee meets the financial literacy requirements of the current listing standards. We expect to satisfy the member independence requirements for the audit committee prior to the end of the transition period provided under current listing standards and SEC rules and regulations for companies completing their initial public offering. In addition, our board of directors has determined that Mr. Goldman is an audit committee financial expert within the meaning of Item 407(d) of Regulation S-K under the Securities Act. Our audit committee will, among other things:
| Ÿ | select a qualified firm to serve as the independent registered public accounting firm to audit our financial statements; |
| Ÿ | help to ensure the independence and performance of the independent registered public accounting firm; |
| Ÿ | discuss the scope and results of the audit with the independent registered public accounting firm, and review with management and the independent accountants, our interim and year end operating results; |
| Ÿ | develop procedures for employees to submit concerns anonymously about questionable accounting or audit matters; |
| Ÿ | review our policies on risk assessment and risk management; |
| Ÿ | review related party transactions; |
101
Table of Contents
| Ÿ | obtain and review a report by the independent registered public accounting firm at least annually, that describes our internal quality-control procedures, any material issues with such procedures, and any steps taken to deal with such issues; and |
| Ÿ | approve (or, as permitted, pre-approve) all audit and all permissible non-audit services, other than de minimis non-audit services, to be performed by the independent registered public accounting firm. |
Our audit committee will operate under a written charter, to be effective prior to the completion of this offering, that satisfies the applicable rules of the SEC and the listing standards of the .
Compensation Committee
Since May 2012, our compensation committee has been comprised of Messrs. Mulloy and Ruettgers, with Mr. Mulloy serving as chairman. The composition of our compensation committee meets the requirements for independence under current listing standards and SEC rules and regulations. Each member of the compensation committee is also a non-employee director, as defined pursuant to Rule 16b-3 promulgated under the Exchange Act, and an outside director, as defined pursuant to Section 162(m) of the Internal Revenue Code, as amended, or the Code. The purpose of our compensation committee is to discharge the responsibilities of our board of directors relating to compensation of our executive officers. Our compensation committee will, among other things:
| Ÿ | review, approve and determine, or make recommendations to our board of directors regarding, the compensation of our executive officers; |
| Ÿ | administer our stock and equity incentive plans; |
| Ÿ | review and approve and make recommendations to our board of directors regarding incentive compensation and equity plans; and |
| Ÿ | establish and review general policies relating to compensation and benefits of our employees. |
Our compensation committee will operate under a written charter, to be effective prior to the completion of this offering, that satisfies the applicable rules of the SEC and the listing standards of the .
Nominating and Governance Committee
Immediately following the completion of this offering, our nominating and governance committee will consist of and , with serving as chairman. The composition of our nominating and governance committee meets the requirements for independence under current listing standards and SEC rules and regulations. Our nominating and governance committee will, among other things:
| Ÿ | identify, evaluate and select, or make recommendations to our board of directors regarding nominees for election to our board of directors and its committees; |
| Ÿ | evaluate the performance of our board of directors and of individual directors; |
| Ÿ | consider and make recommendations to our board of directors regarding the composition of our board of directors and its committees; |
| Ÿ | review developments in corporate governance practices; |
| Ÿ | evaluate the adequacy of our corporate governance practices and reporting; and |
| Ÿ | develop and make recommendations to our board of directors regarding corporate governance guidelines and matters. |
102
Table of Contents
The nominating and governance committee will operate under a written charter to be effective prior to the completion of this offering that satisfies the applicable listing requirements and rules of .
Compensation Committee Interlocks and Insider Participation
None of our executive officers currently serves, or in the past year has served, as a member of the board of directors or compensation committee of any entity that has one or more executive officers serving on our board of directors or compensation committee.
Non-Employee Director Compensation
Prior to this offering, we had not implemented a formal policy with respect to compensation payable to our non-employee directors for service as directors. In 2011, we paid cash director fees to Messrs. Goldman and Ruettgers in the amounts set forth below. In addition, we granted an award of performance units under our 2009 Plan to Mr. Goldman in 2011. In addition to the foregoing amounts, we reimburse our directors for expenses associated with attending meetings of our board of directors and committees of our board of directors. The following table provides information regarding compensation of our non-employee directors for 2011.
| Name |
Fees Earned or Paid in Cash($) (1) |
All Other Compensation($) |
Total($) | |||||||||
| Kenneth A. Goldman (2) |
8,000 | 0 | 8,000 | |||||||||
| Michael C. Ruettgers |
9,000 | 0 | 9,000 | |||||||||
| Corey M. Mulloy |
0 | 0 | 0 | |||||||||
| Peter W. Bell (3) |
0 | 0 | 0 | |||||||||
| (1) | Represents 2011 director fees paid in cash. |
| (2) | Mr. Goldman was granted an award of 210,000 performance units under our 2009 Plan on March 31, 2011. Because the performance units do not vest prior to a “Change of Control,” as defined in the 2009 Plan, we have not incurred stock-based compensation expense nor compensation charges as a result of the grant of performance units to Mr. Goldman. Each performance unit represents a contractual right to receive a payment upon a “Change of Control,” which will include the completion of this offering, based on the value of consideration received by a holder of one share of our common stock, less a per-unit base price of $0.05. Assuming vesting of the award through the completion of this offering and a per unit cash payment equal to our assumed initial public offering price of $ per share, which is the midpoint of the estimated offering price range set forth on the cover page of this prospectus, less the $0.05 base price, the payment to Mr. Goldman for the performance units in connection with this offering would be $ . The cash payment we make to Mr. Goldman in satisfaction of his performance units in connection with the completion of this offering will be recorded as a compensation charge when such payment is made. |
| (3) | Mr. Bell resigned from our board of directors effective May 2012. |
In connection with this offering, we intend to implement a formal policy pursuant to which our non-employee directors will be eligible to receive equity awards and annual cash retainers as compensation for service on our board of directors and committees of our board of directors. Under this policy, we intend to grant non-employee directors an annual stock option grant having a Black-Scholes value on the date of grant equal to $ . We intend that the date of grant for these stock options will be of each year, beginning .
103
Table of Contents
2011 Summary Compensation Table
The following table and narrative summarizes and explains the compensation that we paid to, or that was earned by, our principal executive officer and each of the named officers referred to by Item 402(m)(2) of Regulation S-K during our fiscal year ended December 31, 2011. We refer to these officers in this prospectus as our named executive officers.
| Name and Principal Position |
Year | Salary($) | Non-Equity Incentive Plan Compensation($)(1) |
All Other Compensation($) |
Total($) | |||||||||||||||
| Ted C. Ho Chief Executive Officer |
2011 | 326,919 | 1,140,591 | 331 | (2) | 1,467,841 | ||||||||||||||
| Patrick P. Leong Chief Technology Officer |
2011 | 360,000 | 1,260,700 | 331 | (2) | 1,621,031 | ||||||||||||||
| Thomas K.Y. Cheung Vice President of Engineering |
2011 | 373,846 | 1,578,593 | 331 | (2) | 1,952,770 | ||||||||||||||
| (1) | The amounts included in the “Non-Equity Incentive Plan Compensation” column represent the amounts earned and payable pursuant to the founders’ bonus for 2011. See the section titled “—Annual Performance-Based Cash Bonus” for additional information. |
| (2) | Represents the dollar value of life insurance premiums paid by us. |
Annual Performance-Based Cash Bonus
In addition to base salary, we provide each of our named executive officers with the opportunity to earn annual cash performance bonuses under our senior manager bonus program, or the founders’ bonus. The founders’ bonus was established under the LLC Agreement and provides that each of our named executive officers may earn a bonus in each of 2010, 2011 and 2012 of up to 5% of our net income before allowances for interest, taxes, depreciation and amortization, or our EBITDA, to the extent that our EBITDA exceeds a threshold amount. In 2011, we paid the named executive officers cash bonuses pursuant to the founders’ bonus designed to result in each of our named executive officers (together with our other two founders) receiving the same cash earnings during 2011 when taking into account their base salary, their portion of the founders’ bonus, their other compensation and the amount of their cash distributions. Each of the named executive officers received a portion of the distributions made to our stockholders based on their indirect pro rata ownership of us through their ownership of equity interests in Gigamon Systems LLC, the holder of all of our outstanding common stock. See the section titled “Capitalization” for additional information regarding distributions to our stockholders.
Outstanding Equity Awards at Fiscal Year End
There were no equity awards outstanding as of December 31, 2011 with respect to our named executive officers.
Other Employee Benefits and Perquisites
Our historic compensation program reflects our startup origins and form of organization. We have generally not offered extensive benefits, severance or other compensation programs to the named executive officers, apart from cash compensation described above and employee benefits made available generally to our employees, including 401(k) plan matching contributions. See the section titled “—Retirement Plan” for additional information.
104
Table of Contents
Employee Benefit Plans
2012 Equity Incentive Plan
We expect that our board of directors and our stockholders will adopt and approve our 2012 Equity Incentive Plan, or our 2012 Plan, prior to the completion of this offering. Subject to stockholder approval, the 2012 Plan will be effective upon its adoption by our board of directors, but we do not expect to utilize our 2012 Plan until after the completion of this offering. Our 2012 Plan permits the grant of incentive stock options, within the meaning of Section 422 of the Code, to our employees and any of our parent and subsidiary corporations’ employees, and the grant of nonstatutory stock options, stock appreciation rights, restricted stock, restricted stock units, performance units and performance shares to our employees, directors and consultants and our parent and subsidiary corporations’ employees and consultants.
Authorized Shares
The maximum aggregate number of shares issuable under the 2012 Plan is shares of our common stock, plus (i) any shares that as of the completion of this offering, have been reserved but not issued pursuant to any awards granted under our 2012 Unit Option Plan and are not subject to any awards granted thereunder, and (ii) any shares subject to stock options or similar awards granted under the 2012 Unit Option Plan that expire or terminate without having been exercised in full and shares issued pursuant to awards granted under the 2012 Unit Option Plan that are forfeited to or repurchased by us, with the maximum number of shares to be added to the 2012 Plan from the 2012 Unit Option Plan equal to shares. In addition, the number of shares available for issuance under the 2012 Plan will be annually increased on the first day of each of our fiscal years beginning with 2014, by an amount equal to the least of:
| Ÿ | shares; |
| Ÿ | % of the outstanding shares of our common stock as of the last day of our immediately preceding fiscal year; or |
| Ÿ | such other amount as our board of directors may determine. |
Shares issued pursuant to awards under the 2012 Plan that we repurchase or that expire become unexercisable or are forfeited. Shares that are surrendered pursuant to an exchange program, as well as shares used to pay the exercise price of an award or to satisfy the tax withholding obligations related to an award, will become available for future grant under the 2012 Plan. In addition, to the extent that an award is paid out in cash rather than shares, such cash payment will not reduce the number of shares available for issuance under the 2012 Plan. With respect to stock appreciation rights, only shares actually issued pursuant to the award cease to be available under the 2012 Plan.
Plan Administration
Our board of directors or one or more committees appointed by our board of directors will administer the 2012 Plan. In the case of awards intended to qualify as “performance-based compensation” within the meaning of Section 162(m) of the Code, the compensation committee will consist of two or more “outside directors” within the meaning of Section 162(m) of the Code.
Subject to the provisions of our 2012 Plan, the administrator has the power to determine the terms of awards, including the recipients, the exercise price, if any, the number of shares covering each award, the fair market value of a share of our common stock, the vesting schedule applicable to the awards, together with any vesting acceleration, the form of consideration, if any, payable upon exercise of the award, and the terms of the award agreement for use under the 2012 Plan. The administrator also has the authority, subject to the terms of the 2012 Plan, to amend existing awards to
105
Table of Contents
reduce or increase their exercise price, to allow participants the opportunity to transfer outstanding awards to a financial institution or other person or entity selected by the administrator, to institute an exchange program by which outstanding awards may be surrendered in exchange for awards that may have different exercise prices and terms, to prescribe rules and to construe and interpret the 2012 Plan and awards granted under the 2012 Plan.
Stock Options
The administrator may grant incentive and/or nonstatutory stock options under our 2012 Plan, provided that incentive stock options are only granted to employees. The exercise price of such options must equal at least the fair market value of our common stock on the date of grant. The term of an incentive stock option may not exceed 10 years; provided, however, that an incentive stock option held by a participant who owns more than 10% of the total combined voting power of all classes of our stock, or of certain of our parent or subsidiary corporations, may not have a term in excess of five years and must have an exercise price of at least 110% of the fair market value of our common stock on the grant date. The administrator will determine the methods of payment of the exercise price of an option, which may include cash, shares or other property acceptable to the administrator, as well as other types of consideration permitted by applicable law. Subject to the provisions of our 2012 Plan, the administrator determines the remaining terms of the options. After the termination of service of an employee, director or consultant, the participant may exercise his or her option, to the extent vested as of such date of termination, for the period of time stated in his or her option agreement. However, in no event may an option be exercised later than the expiration of its term.
Stock Appreciation Rights
Stock appreciation rights may be granted under our 2012 Plan. Stock appreciation rights allow the recipient to receive the appreciation in the fair market value of our common stock between the exercise date and the date of grant. Subject to the provisions of our 2012 Plan, the administrator determines the terms of stock appreciation rights, including when such rights vest and become exercisable and whether to settle such awards in cash or with shares of our common stock, or a combination thereof, except that the per share exercise price for the shares to be issued pursuant to the exercise of a stock appreciation right will be no less than 100% of the fair market value per share on the date of grant. The specific terms of any grant of stock appreciation rights will be set forth in an award agreement between us and the recipient.
Restricted Stock
Restricted stock may be granted under our 2012 Plan. Restricted stock awards are grants of shares of our common stock that are subject to various restrictions, including restrictions on transferability and forfeiture provisions. Shares of restricted stock will vest and the restrictions on such shares will lapse, in accordance with terms and conditions established by the administrator. Such terms may include, among other things, vesting upon the achievement of specific performance goals determined by the administrator and/or continued service to us. The administrator, in its sole discretion, may accelerate the time at which any restrictions will lapse or be removed. Recipients of restricted stock awards generally will have voting and dividend rights with respect to such shares upon grant without regard to vesting, unless the administrator provides otherwise. Shares of restricted stock that do not vest for any reason will be forfeited by the recipient and will revert to us. The specific terms of any grant of restricted stock will be set forth in an award agreement between us and the recipient.
Restricted Stock Units
Restricted stock units may be granted under our 2012 Plan. Each restricted stock unit granted is a bookkeeping entry representing an amount equal to the fair market value of one share of our common stock. The administrator determines the terms and conditions of restricted stock units
106
Table of Contents
including the vesting criteria, which may include achievement of specified performance criteria or continued service to us, and the form and timing of payment. The administrator, in its sole discretion, may accelerate the time at which any restrictions will lapse or be removed. The administrator determines in its sole discretion whether an award will be settled in stock, cash or a combination of both. The specific terms of any grant of restricted stock units will be set forth in an award agreement between us and the recipient.
Performance Units/Performance Shares
Performance units and performance shares may be granted under our 2012 Plan. Performance units and performance shares are awards that will result in a payment to a participant only if performance goals established by the administrator are achieved or the awards otherwise vest. The administrator will establish organizational or individual performance goals in its discretion, which, depending on the extent to which they are met, will determine the number and/or the value of performance units and performance shares to be paid out to participants. After the grant of a performance unit or performance share, the administrator, in its sole discretion, may reduce or waive any performance objectives or other vesting provisions for such performance units or performance shares. Performance units shall have an initial dollar value established by the administrator prior to the grant date. Performance shares will have an initial value equal to the fair market value of our common stock on the grant date. The administrator, in its sole discretion, may pay earned performance units or performance shares in the form of cash, in shares or in some combination thereof. The specific terms of any grant of performance units and performance shares will be set forth in an award agreement between us and the recipient.
Transferability of Awards
Unless the administrator provides otherwise, our 2012 Plan generally does not allow for the transfer of awards and only the recipient of an award may exercise such an award during his or her lifetime.
Certain Adjustments
In the event of certain changes in our capitalization, to prevent diminution or enlargement of the benefits or potential benefits available under the 2012 Plan, the administrator will make adjustments to one or more of the number and class of shares that may be delivered under the plan and/or the number, class and price of shares covered by each outstanding award and the numerical share limits contained in the 2012 Plan. In the event of our proposed liquidation or dissolution, the administrator will notify participants as soon as practicable and all awards will terminate immediately prior to the consummation of such proposed transaction.
Merger or Change of Control
Our 2012 Plan provides that in the event of a merger or change of control, as defined under the 2012 Plan, each outstanding award will be treated as the administrator determines, except that if a successor corporation or its parent or subsidiary does not assume or substitute an equivalent award for any outstanding award, then such award will fully vest, all restrictions on such award will lapse, all performance goals or other vesting criteria applicable to such award will be deemed achieved at 100% of target levels and such award will become fully exercisable, if applicable, for a specified period prior to the transaction. The award will then terminate upon the expiration of the specified period of time. If the service of an outside director is terminated on or following a change of control, other than pursuant to a voluntary resignation, his or her awards will become fully vested and exercisable, and all performance goals or other vesting requirements will be deemed achieved at 100% of target levels.
Plan Amendment, Termination
The administrator has the authority to amend, suspend or terminate the 2012 Plan provided such action does not impair the existing rights of any participant. Our 2012 Plan will automatically terminate in 2022, unless we terminate it sooner.
107
Table of Contents
2012 Unit Option Plan
Our 2012 Unit Option Plan, or our 2012 Option Plan, was adopted by our board of directors on March 21, 2012 and approved by our stockholders on March 22, 2012. The 2012 Option Plan provides for the grant of options to purchase shares of our common stock to certain of our employees, consultants, and stockholders, as determined by the plan administrator. As of the effective date of the registration statement of which this prospectus forms a part, the 2012 Option Plan will be terminated and we will not grant any additional awards under the 2012 Option Plan. However, the 2012 Option Plan will continue to govern the terms and conditions of outstanding awards granted thereunder.
Authorized Shares
We have reserved a total of 5,901,516 shares of our common stock pursuant to the 2012 Option Plan.
Plan Administration
Our board of directors or compensation committee administers the 2012 Option Plan. Subject to the provisions of our 2012 Option Plan, the administrator has the power to determine the fair market value of the common stock; select the individuals to whom the options under the 2012 Option Plan may be granted; determine the number of shares to be covered in each option; approve form option agreements; determine the terms of awards (including any vesting acceleration or waiver of forfeiture restrictions); set the exercise price of options based on fair market value; institute an exchange program; prescribe, amend, and rescind rules and regulations relating to the 2012 Option Plan; construe and interpret the terms of the 2012 Option Plan and the options granted under the 2012 Option Plan; modify or amend each option granted under the 2012 Option Plan; authorize any person to execute on our behalf any instrument required to effect the grant of an option previously granted by the plan administrator; and to make all other determinations deemed necessary or advisable for administering the 2012 Option Plan.
With the consent of affected option holders, the administrator may institute a program under which outstanding options are cancelled in exchange for new options covering the same or a different number of shares of our common stock but with an exercise price per share based on the fair market value per share of our common stock on the new option grant date.
Stock Options
The exercise price of the option to purchase common stock must equal at least 100% of the fair market value of our common stock on the date of grant. The term of an option may not exceed ten years. Subject to the provisions of our 2012 Option Plan, the administrator determines the remaining terms of the options. After the termination of employment or other service, the participant may exercise his or her option, to the extent vested as of such date of termination, within thirty days of termination. However, in no event may an option be exercised later than the expiration of its term. Additionally, if a recipient’s service is terminated for misconduct, the recipient’s outstanding options immediately terminate.
Transferability of Options
The 2012 Option Plan generally does not allow for the transfer of options other than by will or the laws of descent and distribution and only the recipient of an option may exercise the award during his or her lifetime. The administrator may, in its sole discretion, make an option transferrable. If this occurs, the option may only be transferred by will, by the laws of descent and distribution, to a revocable trust, or as permitted by Rule 701 of the Securities Act.
108
Table of Contents
Certain Adjustments
If any change is made in our common stock subject to the 2012 Option Plan, such as through a stock split, stock dividend, recapitalization, combination of shares, exchange of shares or other change affecting the outstanding common stock as a class without the receipt of consideration by us, the administrator will adjust the number and class of shares that may be covered by each outstanding option. Any adjustments will be consistent with Section 409A of the Code, as applicable.
Trigger Event or Corporate Transaction
In the event of a trigger event, as defined under our 2012 Option Plan, or a merger or other reorganization, all options granted under the 2012 Option Plan shall be exchanged for or converted into options to acquire shares of the resulting corporation’s common stock with terms substantially equivalent to the terms of the options they are intended to replace.
Sale Event
In the event of a sale event, as defined under our 2012 Option Plan, the administrator shall determine how the options will be treated, including, without limitation, that options shall be assumed or substantially equivalent options will be substituted by the acquiring or succeeding corporation; options will terminate on or immediately prior to the consummation of the sale event; outstanding options will vest and become exercisable, in whole or in part, upon or immediately prior to the consummation to such sale event; or the options shall be terminated in exchange for cash and/or property. The administrator is not required to treat all optionees equally in the event of such an occurrence.
Plan Amendment, Termination
The administrator has the authority to amend, suspend, or terminate the 2012 Option Plan at any time, provided such action does not impair the rights of any optionee.
2009 Performance Unit Plan
Our 2009 Performance Unit Plan, or our 2009 Plan, provides for the grant of performance units as incentives to certain of our employees, consultants, and directors upon a change of control or initial public offering. We discontinued issuing awards under our 2009 Plan as of December 31, 2011.
Authorized Units
Under the 2009 Plan, 4,868,924 performance units are authorized to be distributed.
Plan Administration
Our board of directors, or a committee appointed by our board of directors, administers the 2009 Plan. Subject to the provisions of our 2009 Plan, the administrator has the power to determine the individuals to whom the performance units under the 2009 Plan shall be granted, determine when performance units shall be granted, determine the number of performance units to be granted to each individual, determine the base value of the performance units granted, determine the terms and provisions of each grant of performance units including the vesting schedule and other conditions to the grant of performance units, make any such rules and regulations as the administrator deems necessary for the proper administration of the 2009 Plan, determine the forms of agreement for use under the 2009 Plan, to make any other determinations with the 2009 Plan as the administrator deems appropriate, and to authorize any officer to execute on our behalf any instrument required to effectuate the grant of performance units.
Performance Units
The 2009 Plan permits the grant of performance units to our eligible employees, consultants, and directors, as determined by the administrator. The administrator must provide a base value of all performance units, which shall be listed in the performance unit grant awarded to each grantee.
109
Table of Contents
Distributions
The 2009 Plan provides that upon a triggering event (a change of control or initial public offering), holders of vested performance units shall be distributed a sum based on the base value attributed to the performance units listed in each grantee’s performance unit grant. If the triggering event is a change of control, the redemption value for each performance unit shall be equal to the base value attributable to each share of common stock received by the stockholders in connection with the change of control, minus any applicable transaction expenses and amounts paid in escrow. If the triggering event is an initial public offering, the redemption value per performance unit shall be equal to the monetary value assigned to each vested performance unit as determined by our board of directors in its sole discretion. Such monetary value may be paid in cash or in the form of an equity award following the initial public offering. We intend to settle outstanding awards under our 2009 Plan in cash in connection with the completion of this offering.
We shall distribute the amounts payable under the 2009 Plan within sixty days of the date of the change of control or the close of business on the first day of an initial public offering. Distributions shall be paid from our general assets.
Transferability of Awards
The 2009 Plan generally does not allow for the transfer of awards other than by will or the laws of descent and distribution.
Plan Amendment, Termination
Our board of directors has the authority to amend, alter, suspend, or discontinue the 2009 Plan at any time, provided such action does not impair the rights of any performance unit grantee. Such consent shall be deemed to have been given if a then-outstanding majority of the then-outstanding performance units agree in writing to such amendment, alteration, suspension, or discontinuation.
Gigamon Systems LLC Option Grants
Gigamon Systems LLC has granted options to certain employees to purchase common stock pursuant to individual option agreements, which we refer to as the Systems Options. The Systems Options have terms of ten years and are subject to vesting based upon continued service or upon the attainment of performance objectives determined at the time of grant. In connection with the LLC Conversion, the Systems Options that remain outstanding will become options to acquire our common stock.
Retirement Plans
We maintain a 401(k) plan which is intended to be a tax qualified plan under Section 401(k) of the Code. All of our U.S. employees are eligible to participate on the first day of the month following the date of hire. The 401(k) plan includes a salary deferral arrangement pursuant to which participants may elect to reduce their current compensation up to the statutorily prescribed limit, which was equal to $16,500 in 2011 and is equal to $17,000 in 2012 (catch up contributions for employees over 50 allow an additional deferral of $5,500 each year), and have the amount of their compensation reduction contributed to the 401(k) plan. In addition, the 401(k) plan permits discretionary company matching contributions. In 2011, we provided a contribution equal to 3% of each participant’s compensation subject to applicable tax rules.
110
Table of Contents
CERTAIN RELATIONSHIPS AND RELATED PARTY TRANSACTIONS
In addition to the compensation arrangements and indemnification arrangements, discussed, when required, above in the sections titled “Management” and “Executive Compensation” and the registration rights described below in the section titled “Description of Capital Stock—Registration Rights,” the following is a description of each transaction since January 1, 2009 and each currently proposed transaction in which:
| Ÿ | we have been or are to be a participant; |
| Ÿ | the amounts involved exceeded or will exceed $120,000; and |
| Ÿ | any of our directors, executive officers, or stockholders who own greater than 5% of our outstanding capital stock and their affiliates had or will have a direct or indirect material interest. |
Contribution of Assets from Gigamon Systems LLC to Gigamon LLC
Our business was originally operated by a California limited liability company, Gigamon Systems LLC. In January 2009, Gigamon Systems LLC contributed substantially all of its assets and liabilities to us in exchange for all of our common stock. Our founders and certain early employees of, and investors in, our company currently hold membership interests or options to purchase membership interests in Gigamon Systems LLC, and do not own any of our shares of capital stock directly.
LLC Conversion
We are currently a Delaware limited liability company. Prior to the issuance of our shares of common stock in this offering, we will convert into a Delaware corporation and change our name from Gigamon LLC to Gigamon Inc. In connection with the conversion, all of our outstanding common units and preferred units will convert into shares of common stock and preferred stock. Immediately following our conversion to a corporation, the holder of all of our outstanding common units, Gigamon Systems LLC, as well as certain entities affiliated with Highland Capital Partners that hold our preferred units, will be merged with and into us, and the equity holders of Gigamon Systems LLC, and the entities affiliated with Highland Capital Partners, that will merge with and into us will receive our common stock and preferred stock in exchange for their equity interests of Gigamon Systems LLC and the affiliates of Highland Capital Partners.
In addition, in connection with the merger of Gigamon Systems LLC with and into us, the holders of outstanding options to purchase common units of Gigamon Systems LLC will receive options to purchase our common stock in exchange for such options.
In this prospectus, we refer to all of the transactions related to our conversion to a corporation, and the merger of certain of the holders of our common units and preferred units with and into us, as the “LLC Conversion.”
Historical Transactions
LLC Agreement
On January 20, 2010, our stockholders entered into a Restated Limited Liability Company Agreement, as amended, or the LLC Agreement, which governs our operations and the rights and preferences of our stockholders. In connection with the LLC Conversion, the LLC Agreement will be terminated and will no longer govern our operations and will not govern the rights of our stockholders, other than certain provisions relating to certain pre-termination tax matters and liabilities.
111
Table of Contents
We currently have a board of managers, which we refer to in this prospectus as our board of directors, that manages our business affairs, consisting of up to nine members. The holders of a majority of our common stock are entitled to designate up to four members of our board of directors, the holders of our preferred stock are entitled to designate up to three members of our board of directors, one of which is an independent director with relevant industry expertise not affiliated with our company, and the holders of a majority of our common stock and preferred stock, on an as-converted basis, are entitled to designate up to two members of our board of directors. The LLC Agreement provides that the board of directors has the power and discretion to manage and control the business, property and affairs of our company but that certain actions require the consent of the holders of a majority of our preferred stock.
Pursuant to the LLC Agreement, each share of preferred stock is convertible into one share of common stock (subject to certain adjustments in the event of dilutive issuances by us) at the holder’s election. Each share of common stock and preferred stock is entitled to one vote for each share held.
The LLC Agreement also provides that the holders of shares of preferred stock have the right after January 20, 2015 to require our company to purchase their shares of preferred stock for their original issue price plus an 8% annual yield on such shares. Additionally, the LLC Agreement provides that if the board of directors determines to facilitate our initial public offering, then the board of directors has the power to cause our company to be reorganized as a Delaware corporation.
The LLC Agreement also establishes the salary for each founder serving as an executive officer of our company as well as the establishment of the Bonus Plan and the administration thereof. See the section titled “Executive Compensation” for additional information.
Loans to our Founders
On each of the dates set forth below, we entered into loan agreements with our founders, Ted C. Ho, Thomas L. Gallatin, Patrick P. Leong, Thomas K.Y. Cheung and King L. Won, under which we loaned to each individual the amounts set forth below, at an interest rate of 2.4% per annum for the loans made in 2009, and 1.25% for the loans made in 2010. These loans represented advances of distributions to each founder. Upon the date of the respective distribution, the outstanding balance under each loan was deemed to be repaid in full in lieu of the founder receiving the applicable cash distribution, and none of these loans are currently outstanding. The following table presents the date and principal amount of each loan:
| Date of Loan |
Principal Amount |
|||
| March 30, 2009 |
$ | 180,000 | ||
| May 11, 2009 |
$ | 460,000 | ||
| September 4, 2009 |
$ | 360,000 | ||
| October 15, 2009 |
$ | 500,000 | ||
| July 28, 2010 |
$ | 400,000 | ||
112
Table of Contents
Preferred Stock Financing
On January 20, 2010, we issued and sold an aggregate of 24,329,545 shares of preferred stock at a per share purchase price of $0.94, for aggregate consideration of $22.8 million. The participants in our preferred stock financing were entities affiliated with Highland Capital Partners. Corey M. Mulloy, a member of our board of directors, is a general partner of Highland Capital Partners. The following table presents the number of shares and the total purchase price paid by these entities:
| Investor |
Shares of Preferred Stock |
Total Purchase Price |
||||||
| Highland Capital Partners VII Limited Partnership |
14,957,783 | $ | 14,017,421 | |||||
| Highland Subfund VII-B GGM Limited Partnership |
3,624,562 | $ | 3,396,693 | |||||
| Highland Subfund VII-C GGM Limited Partnership |
5,278,506 | $ | 4,946,658 | |||||
| Highland Entrepreneurs’ Fund VII Limited Partnership |
468,694 | $ | 439,228 | |||||
Redemption of Common Stock
Immediately following the preferred stock financing, we redeemed 24,329,545 shares of our common stock from our majority stockholder, Gigamon Systems LLC, for $22.8 million, which in turn repurchased membership interests from certain of our founders, investors and employees that hold units in Gigamon Systems LLC. In connection with such repurchase, the following directors, executive officers and equity holders of Gigamon Systems LLC, and their affiliates, received the payments listed below:
| Directors, Executive Officers |
Total Repurchase Price |
|||
| Thomas L. Gallatin |
$ | 4,106,982 | ||
| King L. Won |
$ | 4,103,514 | ||
| Ted C. Ho |
$ | 3,948,400 | ||
| Patrick P. Leong |
$ | 3,700,904 | ||
| Thomas K.Y. Cheung |
$ | 3,115,327 | ||
| Wei-Yan Sandy Chau |
$ | 2,986,247 | ||
Investor Rights Agreement
We are party to an Investor Rights Agreement, dated as of January 20, 2010, with our founders Ted C. Ho, Thomas L. Gallatin, King L. Won, Patrick P. Leong and Thomas K.Y. Cheung, and the entities affiliated with Highland Capital Partners who hold shares of our preferred stock, which provides, among other things, that certain holders of our common stock and preferred stock have certain rights relating to the registration of their shares of common stock. See the section titled “Description of Capital Stock—Registration Rights” for additional information.
Severance Arrangements
We have entered into offer letters with our chief financial officer, Duston M. Williams, and our general counsel, Paul B. Shinn, which provide for severance compensation. Each offer letter provides for cash severance of six months base salary, plus six months accelerated vesting of their outstanding equity award upon a termination of employment without cause or resignation for good reason. If a qualifying termination occurs within 12 months following a change of control of our company, then Messrs. Williams and Shinn are entitled to full accelerated vesting, and twenty four months of accelerated vesting, respectively, of their then outstanding equity awards in addition to the cash payment described above.
113
Table of Contents
Other Transactions
We have paid annual cash performance bonuses as part of the founders’ bonus to certain of our key employees, including the named executive officers, during 2010 and 2011 and intend to do so in 2012. See the section titled “Executive Compensation—Annual Performance-Based Cash Bonus” for additional information.
We have paid distributions to our stockholders. See the section titled “Capitalization” for additional information.
We have granted performance units to certain of our directors. See the section titled “Management—Non-Employee Director Compensation” for additional information.
We have entered into offer letters with board members Kenneth A. Goldman, Michael C. Ruettgers and Andrew M. Miller, which provide that each of Messrs. Goldman, Ruettgers and Miller will receive a cash meeting fee of $1,000 for each board meeting that they attend in person or via telephone, and that they will be reimbursed for all travel and out-of-pocket expenses in connection with their attending board meetings in person. The offer letters with Messrs. Goldman and Ruettgers provide that they will be granted 210,000 performance units and 410,000 performance units, respectively, under our 2009 Plan. The offer letter with Mr. Miller provides that he will be granted an option to purchase 120,000 shares of common stock under our 2012 Option Plan.
Other than as described above under this section titled “Certain Relationships and Related Person Transactions,” since January 1, 2009, we have not entered into any transactions, nor are there any currently proposed transactions, between us and a related party where the amount involved exceeds, or would exceed, $120,000, and in which any related person had or will have a direct or indirect material interest. We believe the terms of the transactions described above were comparable to terms we could have obtained in arm’s-length dealings with unrelated third parties.
Limitation of Liability and Indemnification of Officers and Directors
Our amended and restated certificate of incorporation and amended and restated bylaws, each to be effective upon the completion of this offering, will provide that we will indemnify our directors and officers, and may indemnify our employees and other agents, to the fullest extent permitted by the Delaware General Corporation Law, which prohibits our amended and restated certificate of incorporation from limiting the liability of our directors for the following:
| Ÿ | any breach of the director’s duty of loyalty to us or to our stockholders; |
| Ÿ | acts or omissions not in good faith or that involve intentional misconduct or a knowing violation of law; |
| Ÿ | unlawful payment of dividends or unlawful stock repurchases or redemptions; and |
| Ÿ | any transaction from which the director derived an improper personal benefit. |
If Delaware law is amended to authorize corporate action further eliminating or limiting the personal liability of a director, then the liability of our directors will be eliminated or limited to the fullest extent permitted by Delaware law, as so amended. Our amended and restated certificate of incorporation does not eliminate a director’s duty of care and, in appropriate circumstances, equitable remedies, such as injunctive or other forms of non-monetary relief, remain available under Delaware law. This provision also does not affect a director’s responsibilities under any other laws, such as the federal securities laws or other state or federal laws. Under our amended and restated bylaws, we will also be empowered to purchase insurance on behalf of any person whom we are required or permitted to indemnify.
114
Table of Contents
In addition to the indemnification required in our amended and restated certificate of incorporation and amended and restated bylaws, we have entered into an indemnification agreement with Corey M. Mulloy, a member of our board of directors and a general partner of Highland Capital Partners, which will be amended prior to the completion of this offering. In addition, we plan to enter into indemnification agreements with each of our other directors, as well as our officers before the completion of this offering. These agreements will provide for the indemnification of our directors, officers and some employees for certain expenses and liabilities incurred in connection with any action, suit, proceeding or alternative dispute resolution mechanism, or hearing, inquiry or investigation that may lead to the foregoing, to which they are a party, or are threatened to be made a party, by reason of the fact that they are or were a director, officer, employee, agent or fiduciary of our company, or any of our subsidiaries, by reason of any action or inaction by them while serving as an officer, director, agent or fiduciary, or by reason of the fact that they were serving at our request as a director, officer, employee, agent or fiduciary of another entity. In the case of an action or proceeding by or in the right of our company or any of our subsidiaries, no indemnification will be provided for any claim where a court determines that the indemnified party is prohibited from receiving indemnification. We believe that these bylaw provisions and indemnification agreements are necessary to attract and retain qualified persons as directors and officers.
The limitation of liability and indemnification provisions in our amended and restated certificate of incorporation and amended and restated bylaws may discourage stockholders from bringing a lawsuit against directors for breach of their fiduciary duties. They may also reduce the likelihood of derivative litigation against directors and officers, even though an action, if successful, might benefit us and our stockholders. A stockholder’s investment may be harmed to the extent we pay the costs of settlement and damage awards against directors and officers pursuant to these indemnification provisions. Insofar as indemnification for liabilities arising under the Securities Act may be permitted to our directors, officers and controlling persons pursuant to the foregoing provisions, or otherwise, we have been advised that, in the opinion of the SEC, such indemnification is against public policy as expressed in the Securities Act, and is, therefore, unenforceable. There is no pending litigation or proceeding naming any of our directors or officers as to which indemnification is being sought, nor are we aware of any pending or threatened litigation that may result in claims for indemnification by any director or officer.
Policies and Procedures for Related Party Transactions
Immediately following the completion of this offering, the audit committee will have the primary responsibility for reviewing and approving or disapproving “related party transactions,” which are transactions between us and related persons in which the aggregate amount involved exceeds or may be expected to exceed $120,000 and in which a related person has or will have a direct or indirect material interest. For purposes of this policy, a related person will be defined as a director, executive officer, nominee for director, or stockholders who own greater than 5% of our outstanding common stock and their affiliates, in each case since the beginning of the most recently completed fiscal year, and their immediate family members. Our audit committee charter will provide that the audit committee shall review and approve or disapprove any related party transactions. As of the date of this prospectus, we have not adopted any formal standards, policies or procedures governing the review and approval of related-party transactions, but we expect that our audit committee will do so in the future.
115
Table of Contents
PRINCIPAL AND SELLING STOCKHOLDERS
The following table sets forth certain information with respect to the beneficial ownership of our common stock as of March 31, 2012, after giving effect to (i) the LLC Conversion and (ii) the conversion of all outstanding shares of preferred stock into shares of common stock, assuming the settlement of all outstanding performance unit awards in cash, and as adjusted to reflect the sale of common stock in this offering, for:
| Ÿ | each of our named executive officers; |
| Ÿ | each of our directors; |
| Ÿ | all of our executive officers and directors as a group; |
| Ÿ | each person, or group of affiliated persons, known by us to beneficially own more than 5% of our common stock; and |
| Ÿ | each of the selling stockholders. |
We have determined beneficial ownership in accordance with the rules of the SEC and the information is not necessarily indicative of beneficial ownership for any other purpose. Except as indicated in the footnotes below, to our knowledge, the persons and entities named in the table below have sole voting and sole investment power with respect to all shares of common stock that they beneficially owned, subject to applicable community property laws.
Applicable percentage ownership is based on 73,632,640 shares of common stock outstanding as of March 31, 2012, after giving effect to (i) the LLC Conversion and (ii) the conversion of all outstanding shares of preferred stock into shares of common stock. In computing the number of shares of common stock beneficially owned by a person and the percentage ownership of such person, we deemed to be outstanding all shares of common stock subject to options held by the person that are currently exercisable or exercisable within 60 days of March 31, 2012. We did not deem such shares outstanding, however, for the purpose of computing the percentage ownership of any other person.
116
Table of Contents
Unless otherwise indicated, the address of each beneficial owner listed in the table below is c/o Gigamon LLC, 598 Gibraltar Drive, Milpitas, California 95035.
| Shares Beneficially Owned Prior to this Offering |
Shares Beneficially Owned After this Offering | |||||||||||||||||
| Assuming the Underwriters’ Option To Purchase is Not Exercised |
Assuming the Underwriters’ Option To Purchase is Exercised in Full | |||||||||||||||||
| Name of Beneficial Owner |
Number of Shares Beneficially Owned |
Percent of Shares Beneficially Owned |
Shares Offered Pursuant to the Underwriters’ Option To Purchase |
Number of Shares Beneficially Owned |
Percent of Shares Beneficially Owned | |||||||||||||
| Number | Percentage | |||||||||||||||||
| Directors and Executive Officers: |
||||||||||||||||||
| Ted C. Ho (1) |
8,372,879 | 11.4 | ||||||||||||||||
| Patrick P. Leong (2) |
7,832,519 | 10.6 | ||||||||||||||||
| Thomas K.Y. Cheung |
6,606,279 | 9.0 | ||||||||||||||||
| Corey M. Mulloy (3) |
24,329,545 | 33.0 | ||||||||||||||||
| Kenneth A. Goldman |
0 | 0 | ||||||||||||||||
| Michael C. Ruettgers |
0 | 0 | ||||||||||||||||
| Andrew M. Miller* |
0 | 0 | ||||||||||||||||
| All directors and executive officers as a group (11 Persons) |
47,532,889 | 64.2 | ||||||||||||||||
| 5% Stockholders: |
||||||||||||||||||
| Entities Affiliated with Highland Capital Partners (4) |
24,329,545 | 33.0 | ||||||||||||||||
| King Won |
4,701,800 | 6.4 | ||||||||||||||||
| Wei-Yan “Sandy” Chau (5) |
6,332,659 | 8.6 | ||||||||||||||||
| * | Mr. Miller joined our board of directors in May 2012. |
| (1) | Consists of (i) 2,872,880 shares held by the Ted & Julie Ho Living Trust, of which Mr. Ho is a grantor and a trustee, (ii) 2,750,000 shares held by the Ted Ching-Lin Ho Nevada Gift Trust under which Mr. Ho may receive discretionary distributions from during his lifetime and (iii) 2,750,000 shares held by the Julie Hsiao Ling Ho Nevada Gift Trust under which Mr. Ho may receive distributions during his lifetime. |
| (2) | Consists of shares held by the Leong-Wong Family Trust, of which Mr. Leong is a trustee. |
| (3) | Consists of the shares listed in footnote (4) below, which are held by entities affiliated with Highland Capital Partners. |
| (4) | Consists of (i) 14,957,783 shares held by Highland Capital Partners VII Limited Partnership, a Delaware limited partnership (“Highland Capital VII”), (ii) 3,624,562 shares held by Highland Subfund VII-B GCM Limited Partnership, a Delaware limited partnership (“Highland Capital VII-B”), (iii) 5,278,506 shares held by Highland Subfund VII-C GCM Limited Partnership, a Delaware limited partnership (“Highland Capital VII-C”) and (iv) 468,694 shares held by Highland Entrepreneurs’ Fund VII Limited Partnership, a Delaware limited partnership (“Highland Entrepreneurs’ Fund,” and collectively with Highland Capital VII, Highland Capital VII-B and Highland Capital VII-C, the “Highland Investing Entities”). Highland Management Partners VII Limited Partnership, a Delaware limited partnership (“HMP VII”), is the general partner of the Highland Investing Entities. Highland Management Partners VII, LLC, a Delaware limited liability company (“Highland Management”), is the general partner of HMP VII. Peter W. Bell, Sean M. Dalton, Robert J. Davis, Robert F. Higgins, Paul A. Maeder, Daniel J. Nova, Fergal J. Mullen and Corey M. Mulloy, are the managing members of Highland Management. Highland Management, as the general partner of the general partner of the Highland Investing Entities, may be deemed to have beneficial ownership of the shares held by the Highland Investing Entities. The managing members of Highland Management may be deemed to share voting and investment power over the shares held by the Highland Investing Entities. The address for the entities affiliated with Highland Capital Partners is One Broadway, 16th Floor, Cambridge, MA 02142. |
| (5) | Consists of shares held by the Ruth K.T. Chan Family Trust. The Ruth K.T. Chan Family Trust and Wei-Yan “Sandy” Chau have entered into an irrevocable proxy under which Wai-Yan “Sandy” Chau has full voting power with respect to the shares held by the Ruth K.T. Chan Family Trust. |
117
Table of Contents
General
The following description summarizes the most important terms of our capital stock, as they are expected to be in effect upon the completion of this offering. We expect to adopt an amended and restated certificate of incorporation and amended and restated bylaws in connection with the completion of this offering, and this description summarizes the provisions that are expected to be included in such documents. This summary does not purport to be complete and is qualified in its entirety by the provisions of our amended and restated certificate of incorporation and amended and restated bylaws, copies of which have been filed as exhibits to the registration statement of which this prospectus is a part. For a complete description of our capital stock, you should refer to our amended and restated certificate of incorporation, amended and restated bylaws and investor rights agreement, which are or will be included as exhibits to the registration statement of which this prospectus forms a part, and to the applicable provisions of Delaware law. Immediately following the completion of this offering, our authorized capital stock will consist of shares of common stock, $0.0001 par value per share, and shares of undesignated preferred stock, $0.0001 par value per share.
As of March 31, 2012, there were 73,632,640 shares of our common stock outstanding, held by approximately 30 stockholders of record, and no shares of our preferred stock outstanding, assuming (i) the LLC Conversion and (ii) the conversion of all outstanding shares of preferred stock into shares of common stock. Our board of directors is authorized, without stockholder approval, except as required by the listing standards of , to issue additional shares of our capital stock.
Common Stock
Dividend Rights
Subject to preferences that may apply to any shares of preferred stock outstanding at the time, the holders of our common stock are entitled to receive dividends out of funds legally available if our board of directors, in its discretion, determines to issue dividends and then only at the times and in the amounts that our board of directors may determine. In addition, the terms of our credit facility currently prohibits us from paying cash dividends on our common stock. See the section titled “Dividend Policy” for additional information.
Voting Rights
Holders of our common stock are entitled to one vote for each share held on all matters submitted to a vote of stockholders. We have not provided for cumulative voting for the election of directors in our amended and restated certificate of incorporation. Our amended and restated certificate of incorporation establishes a classified board of directors that is divided into three classes with staggered three-year terms. Only the directors in one class will be subject to election by a plurality of the votes cast at each annual meeting of our stockholders, with the directors in the other classes continuing for the remainder of their respective three-year terms.
No Preemptive or Similar Rights
Our common stock is not entitled to preemptive rights, and is not subject to conversion, redemption or sinking fund provisions.
118
Table of Contents
Right to Receive Liquidation Distributions
If we become subject to a liquidation, dissolution or winding-up, the assets legally available for distribution to our stockholders would be distributable ratably among the holders of our common stock and any participating preferred stock outstanding at that time, subject to prior satisfaction of all outstanding debt and liabilities and the preferential rights of and the payment of liquidation preferences, if any, on any outstanding shares of preferred stock.
Fully Paid and Non-Assessable
All of the outstanding shares of our common stock are, and the shares of our common stock to be issued pursuant to this offering will be, fully paid and non-assessable.
Preferred Stock
Following this offering, our board of directors will be authorized, subject to limitations prescribed by Delaware law, to issue preferred stock in one or more series, to establish from time to time the number of shares to be included in each series, and to fix the designation, powers, preferences and rights of the shares of each series and any of its qualifications, limitations or restrictions, in each case without further vote or action by our stockholders. Our board of directors can also increase or decrease the number of shares of any series of preferred stock, but not below the number of shares of that series then outstanding, without any further vote or action by our stockholders. Our board of directors may authorize the issuance of preferred stock with voting or conversion rights that could adversely affect the voting power or other rights of the holders of our common stock. The issuance of preferred stock, while providing flexibility in connection with possible acquisitions and other corporate purposes, could, among other things, have the effect of delaying, deferring or preventing a change in our control of our company and might adversely affect the market price of our common stock and the voting and other rights of the holders of our common stock. We have no current plan to issue any shares of preferred stock.
Options
As of March 31, 2012, we had 2,596,920 outstanding options to purchase shares of our common stock, consisting of options to be assumed from Gigamon Systems LLC in connection with the LLC Conversion, with a weighted average exercise price of $0.01.
Registration Rights
After the completion of this offering, certain holders of our common stock will be entitled to rights with respect to the registration of their shares under the Securities Act of 1933, or the Securities Act. These registration rights are contained in our IRA and are described in additional detail below. We, along with our founders and the holders of our preferred stock are parties to the IRA. We entered into the IRA in connection with our preferred stock financing in January 2010. These registration rights will expire (i) five years following the completion of this offering, (ii) upon the closing of a transfer of a majority of our common stock or securities exchangeable for or convertible into our common stock (through a merger, consolidation or stock purchase) or sale of all or substantially all of our assets, or (iii) with respect to any particular stockholder, when such stockholder is able to sell all of its shares pursuant to Rule 144 of the Securities Act. We will pay the registration expenses (other than underwriting discounts, selling commissions and stock transfer taxes) of the holders of the shares registered pursuant to the registrations described below. In an underwritten offering, the managing underwriter, if any, has the right, subject to specified conditions, to limit the number of shares such holders may include. In connection with the completion of this offering, each stockholder that has registration rights agreed not to sell or otherwise dispose of any securities without the prior written
119
Table of Contents
consent of the underwriters for a period of 180 days after the date of this prospectus, subject to certain terms and conditions. See the section titled “Underwriters” for additional information.
Demand Registration Rights
After the completion of this offering, the holders of approximately 24,329,545 shares of our common stock will be entitled to certain demand registration rights. Six months after the completion of this offering, the holders of at least 50% of these shares, or a lesser percentage if the registration covers at least that number of shares with an anticipated aggregate offering price of at least $10.0 million, then outstanding can request that we register the offer and sale of their shares. If we determine that it would be seriously detrimental to our stockholders to effect such a demand registration, we have the right to defer such registration, not more than twice in any 12-month period, for a period of up to 45 days. Additionally, we will not be required to effect a demand registration during the period beginning with 60 days prior to our good faith estimate of the date of the filing of, and ending 180 days following the effectiveness of a registration statement relating to the public offering of our securities.
Piggyback Registration Rights
After the completion of this offering, if we propose to register the offer and sale of any of our securities under the Securities Act, in connection with the public offering of such securities, the holders of up to approximately 73,632,640 shares of our common stock will be entitled to certain “piggyback” registration rights allowing the holders to include their shares in such registration, subject to certain marketing and other limitations. As a result, whenever we propose to file a registration statement under the Securities Act, other than with respect to a registration related to a company stock plan and a registration on any form that does not include substantially the same information as would be required to be included in a registration statement covering the sale of our common stock, the holders of these shares are entitled to notice of the registration and have the right, subject to limitations that the underwriters may impose on the number of shares included in the registration, to include their shares in the registration.
S-3 Registration Rights
After the completion of this offering, the holders of up to approximately 24,329,545 shares of our common stock may make a written request that we register the offer and sale of their shares on Form S-3 if we are eligible to file a registration statement on Form S-3 so long as the request is made by holders of 10% of our common stock or securities convertible into common stock, and the request covers at least that number of shares with an anticipated aggregate offering price of at least $2.5 million. These stockholders may make an unlimited number of requests for registration on Form S-3; however, we will not be required to effect a registration on Form S-3 if we have effected two such registrations within the 12-month period preceding the date of the request. Additionally, if we determine that it would be seriously detrimental to our stockholders to effect such a registration, we have the right to defer such registration, not more than twice in any 12-month period, for a period of up to 45 days.
Anti-Takeover Provisions
The provisions of Delaware law, our amended and restated certificate of incorporation and our amended and restated bylaws may have the effect of delaying, deferring or discouraging another person from acquiring control of our company. These provisions, which are summarized below, may have the effect of discouraging takeover bids. They are also designed, in part, to encourage persons seeking to acquire control of us to negotiate first with our board of directors. We believe that the
120
Table of Contents
benefits of increased protection of our potential ability to negotiate with an unfriendly or unsolicited acquirer outweigh the disadvantages of discouraging a proposal to acquire us because negotiation of these proposals could result in an improvement of their terms.
Delaware Law
We are governed by the provisions of Section 203 of the Delaware General Corporation Law. In general, Section 203 prohibits a public Delaware corporation from engaging in a “business combination” with an “interested stockholder” for a period of three years after the date of the transaction in which the person became an interested stockholder, unless the business combination is approved in a prescribed manner. A “business combination” includes mergers, asset sales or other transactions resulting in a financial benefit to the stockholder. An “interested stockholder” is a person who, together with affiliates and associates, owns, or within three years of the date on which it is sought to be determined whether such person is an “interested stockholder,” did own, 15% or more of the corporation’s outstanding voting stock. These provisions may have the effect of delaying, deferring or preventing a change in our control.
Amended and Restated Certificate of Incorporation and Amended and Restated Bylaw Provisions
Our restated certificate of incorporation and our restated bylaws include a number of provisions that could deter hostile takeovers or delay or prevent changes in control of our management team, including the following:
| Ÿ | Board of Directors Vacancies. Our amended and restated certificate of incorporation and amended and restated bylaws will authorize only our board of directors to fill vacant directorships, including newly created seats. In addition, the number of directors constituting our board of directors will be permitted to be set only by a resolution adopted by a majority vote of our entire board of directors. These provisions would prevent a stockholder from increasing the size of our board of directors and then gaining control of our board of directors by filling the resulting vacancies with its own nominees. This makes it more difficult to change the composition of our board of directors but promotes continuity of management. |
| Ÿ | Classified Board. Our amended and restated certificate of incorporation and amended and restated bylaws will provide that our board is classified into three classes of directors. A third party may be discouraged from making a tender offer or otherwise attempting to obtain control of us as it is more difficult and time consuming for stockholders to replace a majority of the directors on a classified board of directors. See the section titled “Management—Board of Directors” for additional information. |
| Ÿ | Stockholder Action; Special Meeting of Stockholders. Our amended and restated certificate of incorporation will provide that our stockholders may not take action by written consent, but may only take action at annual or special meetings of our stockholders. As a result, a holder controlling a majority of our capital stock would not be able to amend our amended and restated bylaws or remove directors without holding a meeting of our stockholders called in accordance with our amended and restated bylaws. Our amended and restated bylaws will further provide that special meetings of our stockholders may be called only by a majority of our board of directors, the chairman of our board of directors, our chief executive officer or our president, thus prohibiting a stockholder from calling a special meeting. These provisions might delay the ability of our stockholders to force consideration of a proposal or for stockholders controlling a majority of our capital stock to take any action, including the removal of directors. |
121
Table of Contents
| Ÿ | Advance Notice Requirements for Stockholder Proposals and Director Nominations. Our amended and restated bylaws will provide advance notice procedures for stockholders seeking to bring business before our annual meeting of stockholders or to nominate candidates for election as directors at our annual meeting of stockholders. Our amended and restated bylaws will also specify certain requirements regarding the form and content of a stockholder’s notice. These provisions might preclude our stockholders from bringing matters before our annual meeting of stockholders or from making nominations for directors at our annual meeting of stockholders if the proper procedures are not followed. We expect that these provisions may also discourage or deter a potential acquirer from conducting a solicitation of proxies to elect the acquirer’s own slate of directors or otherwise attempting to obtain control of our company. |
| Ÿ | No Cumulative Voting. The DGCL provides that stockholders are not entitled to the right to cumulate votes in the election of directors unless a corporation’s certificate of incorporation provides otherwise. Our amended and restated certificate of incorporation and amended and restated bylaws will not provide for cumulative voting. |
| Ÿ | Directors Removed Only for Cause. Our amended and restated certificate of incorporation will provide that stockholders may remove directors only for cause. |
| Ÿ | Amendment of Charter Provisions. Any amendment of the above provisions in our amended and restated certificate of incorporation would require approval by holders of at least two-thirds of our then outstanding common stock. |
| Ÿ | Issuance of Undesignated Preferred Stock. Our board of directors will have the authority, without further action by the stockholders, to issue up to shares of undesignated preferred stock with rights and preferences, including voting rights, designated from time to time by our board of directors. The existence of authorized but unissued shares of preferred stock would enable our board of directors to render more difficult or to discourage an attempt to obtain control of us by means of a merger, tender offer, proxy contest or other means. |
Transfer Agent and Registrar
Upon the completion of this offering, the transfer agent and registrar for our common stock will be . The transfer agent and registrar’s address is , and its telephone number is .
Listing
We intend to apply for the listing of our common stock on under the symbol “GIMO.”
122
Table of Contents
SHARES ELIGIBLE FOR FUTURE SALE
Prior to this offering, there has been no public market for our common stock, and we cannot predict the effect, if any, that market sales of shares of our common stock or the availability of shares of our common stock for sale will have on the market price of our common stock prevailing from time to time. Future sales of our common stock in the public market, or the availability of such shares for sale in the public market, could adversely affect market prices prevailing from time to time. As described below, only a limited number of shares will be available for sale shortly after this offering due to contractual and legal restrictions on resale. Nevertheless, sales of our common stock in the public market after such restrictions lapse, or the perception that those sales may occur, could adversely affect the prevailing market price at such time and our ability to raise equity capital in the future.
Following the completion of this offering, and after giving effect to the LLC Conversion and the conversion of all outstanding shares of preferred stock into shares of common stock, based on the number of shares of our capital stock outstanding as of March 31, 2012, we will have a total of shares of our common stock outstanding. Of these outstanding shares, all of the shares of common stock sold in this offering will be freely tradable, except that any shares purchased in this offering by our affiliates, as that term is defined in Rule 144 under the Securities Act, would only be able to be sold in compliance with the Rule 144 limitations described below.
The remaining outstanding shares of our common stock will be deemed “restricted securities” as defined in Rule 144. Restricted securities may be sold in the public market only if they are registered or if they qualify for an exemption from registration under Rule 144 or Rule 701 under the Securities Act, which rules are summarized below. As a result of the LLC Conversion, we expect the Rule 144 holding period requirements applicable to all of our outstanding shares of common stock, which are held by Gigamon Systems LLC, as well as shares of our preferred stock, which are held by certain entities affiliated with Highland Capital Partners, to restart once these entities are merged with and into us and receive our common stock and preferred stock in exchange for their respective equity interests. In addition, holders of all or substantially all of our equity securities have entered into or will enter into lock-up agreements with the underwriters under which they have agreed, subject to specific exceptions, not to sell any of our stock for at least 180 days following the date of this prospectus, as described below. As a result of these agreements and the provisions of our investors’ rights agreement described above under “Description of Capital Stock—Registration Rights,” subject to the provisions of Rule 144 or Rule 701, based on an assumed offering date of March 31, 2012, shares will be available for sale in the public market as follows:
| Ÿ | beginning on the date of this prospectus, the shares of common stock sold in this offering will be immediately available for sale in the public market; |
| Ÿ | beginning 181 days after the date of this prospectus, subject to extension as described in the section titled “Underwriters.” below, additional shares of common stock will become eligible for sale in the public market, of which shares will be held by affiliates and subject to the volume and other restrictions of Rule 144, as described below; and |
| Ÿ | the remainder of the shares of common stock will be eligible for sale in the public market from time to time thereafter, subject in some cases to the volume and other restrictions of Rule 144, as described below. |
Lock-Up Agreements
We, the selling stockholders, our officers and directors and holders of substantially all of our common stock and securities convertible into or exchangeable for our common stock, have agreed or will agree that, subject to certain exceptions and under certain conditions, for a period of 180 days after the date of this prospectus, we and they will not, without the prior written consent of Goldman, Sachs &
123
Table of Contents
Co., dispose of or hedge any shares or any securities convertible into or exchangeable for shares of our capital stock. Goldman, Sachs & Co. may, in its discretion, release any of the securities subject to these lock-up agreements at any time without notice.
The 180-day restricted period described in the preceding paragraph will be automatically extended if: (1) during the last 17 days of the 180-day restricted period we issue an earnings release or announce material news or a material event; or (2) prior to the expiration of the 180-day restricted period, we announce that we will release earnings results during the 15-day period following the last day of the 180-day period, in which case the restrictions described in the preceding paragraph will continue to apply until the expiration of the 18-day period beginning on the issuance of the earnings release of the announcement of the material news or material event; provided that no such extension shall apply from and after such date, if any, as the Financial Industry Regulatory Authority, Inc. shall have publicly announced that Rule 2711(f)(4) is no longer applicable with respect to any public offering (or any public offering with the same characteristics as this offering).
Rule 144
In general, under Rule 144 as currently in effect, once we have been subject to the public company reporting requirements of Section 13 or Section 15(d) of the Securities Exchange Act of 1934, as amended, or the Exchange Act, for at least 90 days, a person who is not deemed to have been one of our affiliates for purposes of the Securities Act at any time during the 90 days preceding a sale and who has beneficially owned the shares proposed to be sold for at least six months, including the holding period of any prior owner other than our affiliates, is entitled to sell those shares without complying with the manner of sale, volume limitation or notice provisions of Rule 144, subject to compliance with the public information requirements of Rule 144. If such a person has beneficially owned the shares proposed to be sold for at least one year, including the holding period of any prior owner other than our affiliates, then that person would be entitled to sell those shares without complying with any of the requirements of Rule 144.
In general, under Rule 144, as currently in effect, our affiliates or persons selling shares on behalf of our affiliates are entitled to sell upon expiration of the lock-up agreements described above, within any three-month period, a number of shares that does not exceed the greater of:
| Ÿ | 1% of the number of shares of our common stock then outstanding, which will equal approximately shares immediately after this offering; or |
| Ÿ | the average weekly trading volume of our common stock during the four calendar weeks preceding the filing of a notice on Form 144 with respect to that sale. |
Sales under Rule 144 by our affiliates or persons selling shares on behalf of our affiliates are also subject to certain manner of sale provisions and notice requirements and to the availability of current public information about us.
Rule 701
Rule 701 generally allows a stockholder who purchased shares of our common stock pursuant to a written compensatory plan or contract and who is not deemed to have been an affiliate of our company during the immediately preceding 90 days to sell these shares in reliance upon Rule 144, but without being required to comply with the public information, holding period, volume limitation or notice provisions of Rule 144. Rule 701 also permits affiliates of our company to sell their Rule 701 shares under Rule 144 without complying with the holding period requirements of Rule 144. All holders of Rule 701 shares, however, are required by that rule to wait until 90 days after the date of this prospectus before selling those shares pursuant to Rule 701.
124
Table of Contents
Registration Rights
Pursuant to an investor rights agreement, the holders of approximately 73,632,640 shares of our common stock (assuming the conversion of all outstanding shares of preferred stock into shares of common stock), or their transferees, will be entitled to certain rights with respect to the registration of the offer and sale of those shares under the Securities Act. For a description of these registration rights, see the section titled “Description of Capital Stock—Registration Rights.” If the offer and sale of these shares is registered, the shares will be freely tradable without restriction under the Securities Act, and a large number of shares may be sold into the public market.
Registration Statements on Form S-8
We intend to file a registration statement on Form S-8 under the Securities Act to register all of the shares of common stock issued or reserved for issuance under our 2012 Option Plan and our 2012 Plan. We expect to file this registration statement after this offering. Shares covered by this registration statement will be eligible for sale in the public market, upon the expiration or release from the terms of the lock-up agreements, and subject to vesting of such shares.
Stock Options
As of March 31, 2012, there were no outstanding options to purchase shares of common stock pursuant to our 2012 Option Plan. As of March 31, 2012, we had 2,596,920 outstanding options to purchase shares of our common stock consisting of options to be assumed from Gigamon Systems LLC in connection with the LLC Conversion, with a weighted average exercise price of $0.01. We intend to file a registration statement on Form S-8 under the Securities Act as promptly as possible after the completion of this offering to register shares that may be issued pursuant to our 2012 Option Plan and our 2012 Plan. The registration statement on Form S-8 is expected to become effective immediately upon filing, and shares covered by the registration statement will then become eligible for sale in the public markets, subject to the Rule 144 limitations applicable to affiliates, vesting restrictions and any applicable lock-up agreements. See the section titled “Executive Compensation—Employee Benefit Plans” for additional information.
125
Table of Contents
MATERIAL U.S. FEDERAL INCOME TAX CONSEQUENCES TO NON-U.S. HOLDERS
The following is a summary of the material U.S. federal income tax consequences of the ownership and disposition of our common stock to non-U.S. holders, but does not purport to be a complete analysis of all the potential tax considerations relating thereto. This summary is based upon the provisions of the Code, Treasury regulations promulgated thereunder, administrative rulings and judicial decisions, all as of the date hereof. These authorities may be changed, possibly retroactively, so as to result in U.S. federal income tax consequences different from those set forth below. We have not sought any ruling from the Internal Revenue Service, or the IRS, with respect to the statements made and the conclusions reached in the following summary, and there can be no assurance that the IRS will agree with such statements and conclusions.
This summary also does not address the tax considerations arising under the laws of any non-U.S., state or local jurisdiction or under U.S. federal gift and estate tax laws, except to the limited extent set forth below. In addition, this discussion does not address tax considerations applicable to an investor’s particular circumstances or to investors that may be subject to special tax rules, including, without limitation:
| Ÿ | banks, insurance companies or other financial institutions; |
| Ÿ | persons subject to the alternative minimum tax; |
| Ÿ | tax-exempt organizations; |
| Ÿ | controlled foreign corporations, passive foreign investment companies and corporations that accumulate earnings to avoid U.S. federal income tax; |
| Ÿ | dealers in securities or currencies; |
| Ÿ | traders in securities that elect to use a mark-to-market method of accounting for their securities holdings; |
| Ÿ | persons that own, or are deemed to own, more than five percent of our capital stock (except to the extent specifically set forth below); |
| Ÿ | certain former citizens or long-term residents of the United States; |
| Ÿ | persons who hold our common stock as a position in a hedging transaction, “straddle,” “conversion transaction” or other risk reduction transaction; |
| Ÿ | persons who do not hold our common stock as a capital asset within the meaning of Section 1221 of the Code; or |
| Ÿ | persons deemed to sell our common stock under the constructive sale provisions of the Code. |
In addition, if a partnership or entity classified as a partnership for U.S. federal income tax purposes holds our common stock, the tax treatment of a partner generally will depend on the status of the partner and upon the activities of the partnership. Accordingly, partnerships that hold our common stock, and partners in such partnerships, should consult their tax advisors.
You are urged to consult your tax advisor with respect to the application of the U.S. federal income tax laws to your particular situation, as well as any tax consequences of the purchase, ownership and disposition of our common stock arising under the U.S. federal estate or gift tax rules or under the laws of any state, local, non-U.S. or other taxing jurisdiction or under any applicable tax treaty.
Non-U.S. Holder Defined
For purposes of this discussion, you are a non-U.S. holder if you are any holder other than:
| Ÿ | an individual citizen or resident of the United States (for tax purposes); |
126
Table of Contents
| Ÿ | a corporation or other entity taxable as a corporation created or organized in the United States or under the laws of the United States or any political subdivision thereof; |
| Ÿ | an estate whose income is subject to U.S. federal income tax regardless of its source; or |
| Ÿ | a trust (x) whose administration is subject to the primary supervision of a U.S. court and which has one or more U.S. persons who have the authority to control all substantial decisions of the trust or (y) which has made an election to be treated as a U.S. person. |
Distributions
We do not anticipate making any distributions on our common stock following the completion of this offering. However, if we do make distributions on our common stock, those payments will constitute dividends for U.S. tax purposes to the extent paid from our current or accumulated earnings and profits, as determined under U.S. federal income tax principles. To the extent those distributions exceed both our current and our accumulated earnings and profits, they will constitute a return of capital and will first reduce your basis in our common stock, but not below zero, and then will be treated as gain from the sale of stock.
Any dividend paid to you generally will be subject to U.S. withholding tax either at a rate of 30% of the gross amount of the dividend or such lower rate as may be specified by an applicable income tax treaty. In order to receive a reduced treaty rate, you must provide us with an IRS Form W-8BEN or other appropriate version of IRS Form W-8 certifying qualification for the reduced rate. A non-U.S. holder of shares of our common stock eligible for a reduced rate of U.S. withholding tax pursuant to an income tax treaty may obtain a refund of any excess amounts withheld by filing an appropriate claim for refund with the IRS. If the non-U.S. holder holds the stock through a financial institution or other agent acting on the non-U.S. holder’s behalf, the non-U.S. holder will be required to provide appropriate documentation to the agent, which then will be required to provide certification to us or our paying agent, either directly or through other intermediaries.
Dividends received by you that are effectively connected with your conduct of a U.S. trade or business (and, if an income tax treaty applies, such dividends are attributable to a permanent establishment maintained by you in the U.S.), are includible in your gross income in the taxable year received, and are exempt from such withholding tax. In order to obtain this exemption, you must provide us with an IRS Form W-8ECI or other applicable IRS Form W-8 properly certifying such exemption. Such effectively connected dividends, although not subject to withholding tax, are taxed at the same graduated rates applicable to U.S. persons, net of certain deductions and credits, subject to an applicable income tax treaty providing otherwise. In addition, if you are a corporate non-U.S. holder, dividends you receive that are effectively connected with your conduct of a U.S. trade or business may also be subject to a branch profits tax at a rate of 30% or such lower rate as may be specified by an applicable income tax treaty.
Gain on Disposition of Common Stock
You generally will not be required to pay U.S. federal income tax on any gain realized upon the sale or other disposition of our common stock unless:
| Ÿ | the gain is effectively connected with your conduct of a U.S. trade or business (and, if an income tax treaty applies, the gain is attributable to a permanent establishment maintained by you in the United States); |
| Ÿ | you are an individual who is present in the United States for a period or periods aggregating 183 days or more during the calendar year in which the sale or disposition occurs and certain other conditions are met; or |
127
Table of Contents
| Ÿ | our common stock constitutes a U.S. real property interest by reason of our status as a “United States real property holding corporation,” or USRPHC, for U.S. federal income tax purposes (a “USRPHC”) at any time within the shorter of the five-year period preceding your disposition of, or your holding period for, our common stock. |
We believe that we are not currently and will not become a USRPHC. However, because the determination of whether we are a USRPHC depends on the fair market value of our U.S. real property relative to the fair market value of our other business assets, there can be no assurance that we will not become a USRPHC in the future. Even if we become a USRPHC, however, as long as our common stock is regularly traded on an established securities market, such common stock will be treated as U.S. real property interests only if you actually or constructively hold more than five percent of such regularly traded common stock at any time during the shorter of the five-year period preceding your disposition of, or your holding period for, our common stock.
If you are a non-U.S. holder described in the first bullet above, you will be required to pay tax on the net gain derived from the sale under regular graduated U.S. federal income tax rates, and a corporate non-U.S. holder described in the first bullet above also may be subject to the branch profits tax at a 30% rate, or such lower rate as may be specified by an applicable income tax treaty. If you are an individual non-U.S. holder described in the second bullet above, you will be required to pay a flat 30% tax on the gain derived from the sale, which tax may be offset by U.S. source capital losses for the year. You should consult any applicable income tax or other treaties that may provide for different rules.
Federal Estate Tax
Our common stock beneficially owned by an individual who is not a citizen or resident of the United States (as defined for U.S. federal estate tax purposes) at the time of their death will generally be includable in the decedent’s gross estate for U.S. federal estate tax purposes, unless an applicable estate tax treaty provides otherwise.
Backup Withholding and Information Reporting
Generally, we must report annually to the IRS the amount of dividends paid to you, your name and address, and the amount of tax withheld, if any. A similar report will be sent to you. Pursuant to applicable income tax treaties or other agreements, the IRS may make these reports available to tax authorities in your country of residence.
Payments of dividends or of proceeds on the disposition of stock made to you may be subject to information reporting and backup withholding at a current rate of 28% (such rate scheduled to increase to 31% for payments made after December 31, 2012) unless you establish an exemption, for example, by properly certifying your non U.S. status on a Form W-8BEN or another appropriate version of IRS Form W-8. Notwithstanding the foregoing, backup withholding and information reporting may apply if either we or our paying agent has actual knowledge, or reason to know, that you are a U.S. person.
Backup withholding is not an additional tax; rather, the U.S. income tax liability of persons subject to backup withholding will be reduced by the amount of tax withheld. If withholding results in an overpayment of taxes, a refund or credit may generally be obtained from the IRS, provided that the required information is furnished to the IRS in a timely manner.
128
Table of Contents
Recently Enacted Legislation Affecting Taxation of our Common Stock Held by or through Foreign Entities
Recently enacted legislation generally will impose a U.S. federal withholding tax of 30% on dividends, and the gross proceeds of a disposition of our common stock, paid to a “foreign financial institution” (as specially defined under these rules), unless such institution enters into an agreement with the U.S. government to withhold on certain payments and to collect and provide to the U.S. tax authorities substantial information regarding the U.S. account holders of such institution (which includes certain equity and debt holders of such institution, as well as certain account holders that are foreign entities with U.S. owners). The legislation also generally will impose a U.S. federal withholding tax of 30% on dividends and the gross proceeds of a disposition of our common stock paid to a non-financial foreign entity unless such entity provides the withholding agent with a certification identifying the direct and indirect U.S. owners of the entity. Under certain circumstances, a non-U.S. holder might be eligible for refunds or credits of such taxes. The new legislation will apply to certain passive payments made after December 31, 2013, and to all payments, including gross proceeds from the sale of our common stock, made after December 31, 2014. Prospective investors are encouraged to consult with their own tax advisors regarding the possible implications of this legislation on their investment in our common stock.
The preceding discussion of U.S. federal tax considerations is for general information only. It is not tax advice. Each prospective investor should consult its own tax advisor regarding the particular U.S. federal, state and local and non-U.S. tax consequences of purchasing, holding and disposing of our common stock, including the consequences of any proposed change in applicable laws.
129
Table of Contents
We, the selling stockholders and the underwriters named below will enter into an underwriting agreement with respect to the shares being offered. Subject to certain conditions, each underwriter will severally agree to purchase the number of shares indicated in the following table. Goldman, Sachs & Co., Merrill Lynch, Pierce, Fenner & Smith Incorporated and Credit Suisse Securities (USA) LLC are the representatives of the underwriters.
| Underwriters |
Number of Shares | |
| Goldman, Sachs & Co. |
||
| Merrill Lynch, Pierce, Fenner & Smith Incorporated |
||
| Credit Suisse Securities (USA) LLC |
||
| Barclays Capital Inc. |
||
| Raymond James & Associates, Inc. |
||
|
| ||
| Total |
||
|
|
The underwriters are committed to take and pay for all of the shares being offered, if any are taken, other than the shares covered by the option described below unless and until this option is exercised.
The underwriters have an option to buy up to an additional shares from us and up to an additional shares from the selling stockholders to cover such sales. They may exercise that option for 30 days. If any shares are purchased pursuant to this option, the underwriters will severally purchase shares in approximately the same proportion as set forth in the table above.
The following tables show the per share and total estimated underwriting discounts and commissions to be paid to the underwriters by us and the selling stockholders. Such amounts are shown assuming both no exercise and full exercise of the underwriters’ option to purchase additional shares.
Paid by the Company
| No Exercise | Full Exercise |
|||||||
| Per Share |
$ | $ | ||||||
| Total |
$ | $ | ||||||
Paid by the Selling Stockholders
| No Exercise | Full Exercise |
|||||||
| Per Share |
$ | $ | ||||||
| Total |
$ | $ | ||||||
Shares sold by the underwriters to the public will initially be offered at the initial public offering price set forth on the cover of this prospectus. Any shares sold by the underwriters to securities dealers may be sold at a discount of up to $ per share from the initial public offering price. After the initial offering of the shares, the representative may change the offering price and the other selling terms. The offering of the shares by the underwriters is subject to receipt and acceptance and subject to the underwriters’ right to reject any order in whole or in part.
We, the selling stockholders, our officers and directors and holders of substantially all of our common stock and securities convertible into or exchangeable for our common stock, have agreed or will
130
Table of Contents
agree that, subject to certain exceptions and under certain conditions, for a period of 180 days after the date of this prospectus, we and they will not, without the prior written consent of Goldman, Sachs & Co., dispose of or hedge any shares or any securities convertible into or exchangeable for shares of our capital stock. Goldman, Sachs & Co. may, in its discretion, release any of the securities subject to these lock-up agreements at any time without notice. See the section titled “Shares Available for Future Sale” for additional information.
The 180-day restricted period described in the preceding paragraph will be automatically extended if: (1) during the last 17 days of the 180-day restricted period we issue an earnings release or announce material news or a material event; or (2) prior to the expiration of the 180-day restricted period, we announce that we will release earnings results during the 15-day period following the last day of the 180-day period, in which case the restrictions described in the preceding paragraph will continue to apply until the expiration of the 18-day period beginning on the issuance of the earnings release of the announcement of the material news or material event; provided that no such extension shall apply from and after such date, if any, as the Financial Industry Regulatory Authority, Inc. shall have publicly announced that Rule 2711(f)(4) is no longer applicable with respect to any public offering (or any public offering with the same characteristics as this offering).
Prior to the offering, there has been no public market for the shares. The initial public offering price has been negotiated among the company and the representative. Among the factors to be considered in determining the initial public offering price of the shares, in addition to prevailing market conditions, will be the company’s historical performance, estimates of the business potential and earnings prospects of the company, an assessment of the company’s management and the consideration of the above factors in relation to market valuation of companies in related businesses.
An application will be made to list the common stock on the , under the symbol “GIMO.”
In connection with the offering, the underwriters may purchase and sell shares of common stock in the open market. These transactions may include short sales, stabilizing transactions and purchases to cover positions created by short sales. Short sales involve the sale by the underwriters of a greater number of shares than they are required to purchase in the offering, and a short position represents the amount of such sales that have not been covered by subsequent purchases. A “covered short position” is a short position that is not greater than the amount of additional shares for which the underwriters’ option described above may be exercised. The underwriters may cover any covered short position by either exercising their option to purchase additional shares or purchasing shares in the open market. In determining the source of shares to cover the covered short position, the underwriters will consider, among other things, the price of shares available for purchase in the open market as compared to the price at which they may purchase additional shares pursuant to the option described above. “Naked” short sales are any short sales that create a short position greater than the amount of additional shares for which the option described above may be exercised. The underwriters must cover any such naked short position by purchasing shares in the open market. A naked short position is more likely to be created if the underwriters are concerned that there may be downward pressure on the price of the common stock in the open market after pricing that could adversely affect investors who purchase in the offering. Stabilizing transactions consist of various bids for or purchases of common stock made by the underwriters in the open market prior to the completion of the offering.
The underwriters may also impose a penalty bid. This occurs when a particular underwriter repays to the underwriters a portion of the underwriting discount received by it because the representative have repurchased shares sold by or for the account of such underwriter in stabilizing or short covering transactions.
Purchases to cover a short position and stabilizing transactions, as well as other purchases by the underwriters for their own accounts, may have the effect of preventing or retarding a decline in the market price of the company’s stock, and together with the imposition of the penalty bid, may stabilize,
131
Table of Contents
maintain or otherwise affect the market price of the common stock. As a result, the price of the common stock may be higher than the price that otherwise might exist in the open market. The underwriters are not required to engage in these activities and may end any of these activities at any time. These transactions may be effected on , in the over-the-counter market or otherwise.
In the ordinary course of our business, our products were sold to certain of the underwriters of this offering. We derived less than 5% of our revenue in 2011 from the underwriters of this offering as a group.
European Economic Area
In relation to each Member State of the European Economic Area which has implemented the Prospectus Directive (each, a Relevant Member State), each underwriter has represented and agreed that with effect from and including the date on which the Prospectus Directive is implemented in that Relevant Member State (the Relevant Implementation Date) it has not made and will not make an offer of shares to the public in that Relevant Member State prior to the publication of a prospectus in relation to the shares which has been approved by the competent authority in that Relevant Member State or, where appropriate, approved in another Relevant Member State and notified to the competent authority in that Relevant Member State, all in accordance with the Prospectus Directive, except that it may, with effect from and including the Relevant Implementation Date, make an offer of shares to the public in that Relevant Member State at any time:
(a) to legal entities which are authorised or regulated to operate in the financial markets or, if not so authorised or regulated, whose corporate purpose is solely to invest in securities;
(b) to any legal entity which has two or more of (1) an average of at least 250 employees during the last financial year; (2) a total balance sheet of more than €43,000,000 and (3) an annual net turnover of more than €50,000,000, as shown in its last annual or consolidated accounts;
(c) to fewer than 100 natural or legal persons (other than qualified investors as defined in the Prospectus Directive) subject to obtaining the prior consent of the representative for any such offer; or
(d) in any other circumstances which do not require the publication by the Issuer of a prospectus pursuant to Article 3 of the Prospectus Directive.
For the purposes of this provision, the expression an “offer of shares to the public” in relation to any shares in any Relevant Member State means the communication in any form and by any means of sufficient information on the terms of the offer and the shares to be offered so as to enable an investor to decide to purchase or subscribe the shares, as the same may be varied in that Relevant Member State by any measure implementing the Prospectus Directive in that Relevant Member State and the expression Prospectus Directive means Directive 2003/71/EC and includes any relevant implementing measure in each Relevant Member State.
United Kingdom
Each underwriter has represented and agreed that:
(a) it has only communicated or caused to be communicated and will only communicate or cause to be communicated an invitation or inducement to engage in investment activity (within the meaning of Section 21 of the FSMA) received by it in connection with the issue or sale of the shares in circumstances in which Section 21(1) of the FSMA does not apply to the Issuer; and
132
Table of Contents
(b) it has complied and will comply with all applicable provisions of the FSMA with respect to anything done by it in relation to the shares in, from or otherwise involving the United Kingdom.
Hong Kong
The shares may not be offered or sold by means of any document other than (i) in circumstances which do not constitute an offer to the public within the meaning of the Companies Ordinance (Cap.32, Laws of Hong Kong), or (ii) to “professional investors” within the meaning of the Securities and Futures Ordinance (Cap.571, Laws of Hong Kong) and any rules made thereunder, or (iii) in other circumstances which do not result in the document being a “prospectus” within the meaning of the Companies Ordinance (Cap.32, Laws of Hong Kong), and no advertisement, invitation or document relating to the shares may be issued or may be in the possession of any person for the purpose of issue (in each case whether in Hong Kong or elsewhere), which is directed at, or the contents of which are likely to be accessed or read by, the public in Hong Kong (except if permitted to do so under the laws of Hong Kong) other than with respect to shares which are or are intended to be disposed of only to persons outside Hong Kong or only to “professional investors” within the meaning of the Securities and Futures Ordinance (Cap. 571, Laws of Hong Kong) and any rules made thereunder.
Singapore
This prospectus has not been registered as a prospectus with the Monetary Authority of Singapore. Accordingly, this prospectus and any other document or material in connection with the offer or sale, or invitation for subscription or purchase, of the shares may not be circulated or distributed, nor may the shares be offered or sold, or be made the subject of an invitation for subscription or purchase, whether directly or indirectly, to persons in Singapore other than (i) to an institutional investor under Section 274 of the Securities and Futures Act, Chapter 289 of Singapore, or the SFA, (ii) to a relevant person, or any person pursuant to Section 275(1A), and in accordance with the conditions, specified in Section 275 of the SFA or (iii) otherwise pursuant to, and in accordance with the conditions of, any other applicable provision of the SFA.
Where the shares are subscribed or purchased under Section 275 by a relevant person which is: (a) a corporation (which is not an accredited investor) the sole business of which is to hold investments and the entire share capital of which is owned by one or more individuals, each of whom is an accredited investor; or (b) a trust (where the trustee is not an accredited investor) whose sole purpose is to hold investments and each beneficiary is an accredited investor, shares, debentures and units of shares and debentures of that corporation or the beneficiaries’ rights and interest in that trust shall not be transferable for 6 months after that corporation or that trust has acquired the shares under Section 275 except: (1) to an institutional investor under Section 274 of the SFA or to a relevant person, or any person pursuant to Section 275(1A), and in accordance with the conditions, specified in Section 275 of the SFA; (2) where no consideration is given for the transfer; or (3) by operation of law.
Japan
The securities have not been and will not be registered under the Financial Instruments and Exchange Law of Japan (the Financial Instruments and Exchange Law) and each underwriter has
agreed that it will not offer or sell any securities, directly or indirectly, in Japan or to, or for the benefit of, any resident of Japan (which term as used herein means any person resident in Japan, including any corporation or other entity organized under the laws of Japan), or to others for re-offering or resale, directly or indirectly, in Japan or to a resident of Japan, except pursuant to an exemption from the registration requirements of, and otherwise in compliance with, the Financial Instruments and Exchange Law and any other applicable laws, regulations and ministerial guidelines of Japan.
133
Table of Contents
Switzerland
The shares may not be publicly offered in Switzerland and will not be listed on the SIX Swiss Exchange, or SIX, or on any other stock exchange or regulated trading facility in Switzerland. This document has been prepared without regard to the disclosure standards for issuance prospectuses under art. 652a or art. 1156 of the Swiss Code of Obligations or the disclosure standards for listing prospectuses under art. 27 ff. of the SIX Listing Rules or the listing rules of any other stock exchange or regulated trading facility in Switzerland. Neither this document nor any other offering or marketing material relating to the shares or the offering may be publicly distributed or otherwise made publicly available in Switzerland.
Neither this document nor any other offering or marketing material relating to the offering, the Company, the shares have been or will be filed with or approved by any Swiss regulatory authority. In particular, this document will not be filed with, and the offer of shares will not be supervised by, the Swiss Financial Market Supervisory Authority FINMA, and the offer of shares has not been and will not be authorized under the Swiss Federal Act on Collective Investment Schemes, or CISA. The investor protection afforded to acquirers of interests in collective investment schemes under the CISA does not extend to acquirers of shares.
Dubai
This prospectus supplement relates to an Exempt Offer in accordance with the Offered Securities Rules of the Dubai Financial Services Authority, or DFSA. This prospectus supplement is intended for distribution only to persons of a type specified in the Offered Securities Rules of the DFSA. It must not be delivered to, or relied on by, any other person. The DFSA has no responsibility for reviewing or verifying any documents in connection with Exempt Offers. The DFSA has not approved this prospectus supplement nor taken steps to verify the information set forth herein and has no responsibility for the prospectus supplement. The shares to which this prospectus supplement relates may be illiquid and/or subject to restrictions on their resale. Prospective purchasers of the shares offered should conduct their own due diligence on the shares. If you do not understand the contents of this prospectus supplement you should consult an authorized financial advisor.
The underwriters do not expect sales to discretionary accounts to exceed five percent of the total number of shares offered.
We and the selling stockholders estimate that their share of the total expenses of the offering, excluding underwriting discounts and commissions, will be approximately $ .
We and the selling stockholders will agree to indemnify the several underwriters against certain liabilities, including liabilities under the Securities Act of 1933.
The underwriters and their respective affiliates are full service financial institutions engaged in various activities, which may include securities trading, commercial and investment banking, financial advisory, investment management, investment research, principal investment, hedging, financing and brokerage activities. Certain of the underwriters and their respective affiliates have, from time to time, performed, and may in the future perform, various financial advisory and investment banking services for the issuer, for which they received or will receive customary fees and expenses.
In the ordinary course of their various business activities, the underwriters and their respective affiliates may make or hold a broad array of investments and actively trade debt and equity securities (or related derivative securities) and financial instruments (including bank loans) for their own account and for the accounts of their customers, and such investment and securities activities may involve securities and/or instruments of the issuer (directly, as collateral securing other obligations or otherwise). The underwriters and their respective affiliates may also make investment recommendations and/or publish or express independent research views in respect of such securities or instruments and may at any time hold, or recommend to clients that they acquire, long and/or short positions in such securities and instruments.
134
Table of Contents
Wilson Sonsini Goodrich & Rosati, P.C., Palo Alto, California, which has acted as our counsel in connection with this offering, will pass upon the validity of the shares of common stock being offered by this prospectus. The underwriters have been represented by Goodwin Procter LLP, Menlo Park, California.
The consolidated financial statements as of December 31, 2010 and 2011, and for each of the three years in the period ended December 31, 2011, included in this prospectus have been so included in reliance on the report of PricewaterhouseCoopers LLP, an independent registered public accounting firm, given on the authority of such firm as experts in accounting and auditing.
WHERE YOU CAN FIND ADDITIONAL INFORMATION
We have filed with the SEC a registration statement on Form S-1 under the Securities Act with respect to the shares of common stock offered by this prospectus. This prospectus, which constitutes a part of the registration statement, does not contain all of the information set forth in the registration statement, some of which is contained in exhibits to the registration statement as permitted by the rules and regulations of the SEC. For further information with respect to us and our common stock, we refer you to the registration statement, including the exhibits filed as a part of the registration statement. Statements contained in this prospectus concerning the contents of any contract or any other document is not necessarily complete. If a contract or document has been filed as an exhibit to the registration statement, please see the copy of the contract or document that has been filed. Each statement is this prospectus relating to a contract or document filed as an exhibit is qualified in all respects by the filed exhibit. You may obtain copies of this information by mail from the Public Reference Section of the SEC, 100 F Street, N.E., Room 1580, Washington, D.C. 20549, at prescribed rates. You may obtain information on the operation of the public reference rooms by calling the SEC at 1-800-SEC-0330. The SEC also maintains an Internet website that contains reports, proxy statements and other information about issuers, like us, that file electronically with the SEC. The address of that website is www.sec.gov.
As a result of this offering, we will become subject to the information and reporting requirements of the Securities Exchange Act of 1934 and, in accordance with this law, will file periodic reports, proxy statements and other information with the SEC. These periodic reports, proxy statements and other information will be available for inspection and copying at the SEC’s public reference facilities and the website of the SEC referred to above. We also maintain a website at www.gigamon.com. Upon completion of this offering, you may access these materials free of charge as soon as reasonably practicable after they are electronically filed with, or furnished to, the SEC. Information contained on our website is not a part of this prospectus and the inclusion of our website address in this prospectus is an inactive textual reference only.
135
Table of Contents
GIGAMON LLC
INDEX TO CONSOLIDATED FINANCIAL STATEMENTS
| F-2 | ||||
| F-3 | ||||
| F-4 | ||||
| Consolidated Statements of Redeemable Convertible Preferred Units and Members’ Deficit |
F-5 | |||
| F-6 | ||||
| F-7 |
F-1
Table of Contents
Report of Independent Registered Public Accounting Firm
To the Board of Directors and Members of Gigamon LLC:
In our opinion, the accompanying consolidated balance sheets and the related consolidated statements of operations, consolidated statements of redeemable convertible preferred units and members’ deficit, and consolidated statements of cash flows present fairly, in all material respects, the financial position of Gigamon LLC, and its subsidiary at December 31, 2010 and 2011, and the results of their operations and their cash flows for each of the three years in the period ended December 31, 2011 in conformity with accounting principles generally accepted in the United States of America. These financial statements are the responsibility of the Company’s management. Our responsibility is to express an opinion on these financial statements based on our audits. We conducted our audits of these statements in accordance with the standards of the Public Company Accounting Oversight Board (United States). Those standards require that we plan and perform the audit to obtain reasonable assurance about whether the financial statements are free of material misstatement. An audit includes examining, on a test basis, evidence supporting the amounts and disclosures in the financial statements, assessing the accounting principles used and significant estimates made by management, and evaluating the overall financial statement presentation. We believe that our audits provide a reasonable basis for our opinion.
As discussed in Note 2 to the consolidated financial statements, effective January 1, 2011, the Company changed the manner in which it recognizes revenue for multiple element arrangements.
As discussed in Note 3 to the consolidated financial statements, the Company has restated the consolidated financial statements for the correction of errors.
/s/ PricewaterhouseCoopers LLP
San Jose, California
July 13, 2012
F-2
Table of Contents
Gigamon LLC
(In thousands, except per share amounts)
| December 31, 2010 |
December 31, 2011 |
March 31, 2012 |
Pro Forma Stockholders’ Equity March 31, 2012 | |||||||||||
| (Restated) | (Restated) | (unaudited) | (unaudited) | |||||||||||
| ASSETS |
||||||||||||||
| CURRENT ASSETS: |
||||||||||||||
| Cash and cash equivalents |
$ | 5,804 | $ | 13,102 | $ | 16,366 | ||||||||
| Accounts receivable, net |
7,425 | 17,609 | 9,841 | |||||||||||
| Inventory |
5,584 | 7,437 | 8,012 | |||||||||||
| Prepaid expenses and other current assets |
1,068 | 3,750 | 4,734 | |||||||||||
|
|
|
|
|
|
|
|||||||||
| Total current assets |
19,881 | 41,898 | 38,953 | |||||||||||
| Property and equipment, net |
905 | 2,017 | 2,228 | |||||||||||
| Other assets |
90 | 80 | 85 | |||||||||||
|
|
|
|
|
|
|
|||||||||
| TOTAL ASSETS |
$ | 20,876 | $ | 43,995 | $ | 41,266 | ||||||||
|
|
|
|
|
|
|
|||||||||
| LIABILITIES, REDEEMABLE CONVERTIBLE PREFERRED UNITS AND MEMBERS’ DEFICIT/STOCKHOLDERS’ EQUITY |
||||||||||||||
| CURRENT LIABILITIES: |
||||||||||||||
| Accounts payable |
$ | 623 | $ | 2,665 | $ | 2,846 | ||||||||
| Accrued liabilities |
2,667 | 7,963 | 10,103 | |||||||||||
| Members’ distribution payable |
7,994 | 12,742 | 7,379 | |||||||||||
| Deferred revenue |
9,152 | 18,437 | 18,289 | |||||||||||
|
|
|
|
|
|
|
|||||||||
| Total current liabilities |
20,436 | 41,807 | 38,617 | |||||||||||
| Deferred revenue, non-current |
1,969 | 3,525 | 4,000 | |||||||||||
| Other liabilities, non-current |
172 | 364 | 350 | |||||||||||
|
|
|
|
|
|
|
|||||||||
| TOTAL LIABILITIES |
22,577 | 45,696 | 42,967 | |||||||||||
|
|
|
|
|
|
|
|||||||||
| Commitments and Contingencies (Note 7) |
||||||||||||||
| Redeemable convertible Series A preferred units – $0.937 per unit value, 24,330 units authorized at December 31, 2010 and 2011 and March 31, 2012 (unaudited); 24,330 units issued and outstanding at December 31, 2010 and 2011 and March 31, 2012 (unaudited); no units authorized, issued and outstanding, pro forma (unaudited); redemption value of $33,483 |
24,030 | 26,108 | 26,652 | |||||||||||
|
|
|
|
|
|
|
|||||||||
| MEMBERS’ DEFICIT/STOCKHOLDERS’ EQUITY |
||||||||||||||
| Common Units – No par value per unit, 100,000 units authorized at December 31, 2010 and 2011 and March 31, 2012 (unaudited); 51,900 units issued and outstanding at December 31, 2010 and 2011 and March 31, 2012 (unaudited); 100,000 shares authorized, shares issued and outstanding, pro forma (unaudited) |
1,625 | 1,625 | 1,625 | |||||||||||
| Additional paid-in capital |
147 | 159 | 159 | |||||||||||
| Treasury units—No par value, 24,330 units authorized and outstanding as of December 31, 2010 and 2011, and March 31, 2012 (unaudited) |
(12,469 | ) | (12,469 | ) | (12,469 | ) | ||||||||
| Accumulated deficit |
(15,034 | ) | (17,124 | ) | (17,668 | ) | ||||||||
|
|
|
|
|
|
|
| ||||||||
| TOTAL MEMBERS’ DEFICIT/STOCKHOLDERS’ EQUITY |
(25,731 | ) | (27,809 | ) | (28,353 | ) | ||||||||
|
|
|
|
|
|
|
| ||||||||
| TOTAL LIABILITIES, REDEEEMABLE CONVERTIBLE PREFERRED UNITS, AND MEMBERS’ DEFICIT/STOCKHOLDERS’ EQUITY |
$ | 20,876 | $ | 43,995 | $ | 41,266 | ||||||||
|
|
|
|
|
|
|
| ||||||||
The accompanying notes are an integral part of these consolidated financial statements.
F-3
Table of Contents
Gigamon LLC
Consolidated Statements of Operations
(In thousands, except per share amounts)
| Year Ended December 31, | Three Months Ended March 31, |
|||||||||||||||||||
| 2009 | 2010 | 2011 | 2011 | 2012 | ||||||||||||||||
| (restated) | (restated) | (restated) | (unaudited) | |||||||||||||||||
| Revenue: |
||||||||||||||||||||
| Product |
$ | 24,664 | $ | 35,577 | $ | 51,308 | $ | 6,720 | $ | 10,893 | ||||||||||
| Services |
6,723 | 10,909 | 16,797 | 3,353 | 5,809 | |||||||||||||||
|
|
|
|
|
|
|
|
|
|
|
|||||||||||
| Total revenue |
31,387 | 46,486 | 68,105 | 10,073 | 16,702 | |||||||||||||||
|
|
|
|
|
|
|
|
|
|
|
|||||||||||
| Cost of revenue: |
||||||||||||||||||||
| Product |
4,826 | 6,122 | 12,528 | 1,569 | 3,365 | |||||||||||||||
| Services |
665 | 2,239 | 1,900 | 306 | 492 | |||||||||||||||
|
|
|
|
|
|
|
|
|
|
|
|||||||||||
| Total cost of revenue |
5,491 | 8,361 | 14,428 | 1,875 | 3,857 | |||||||||||||||
|
|
|
|
|
|
|
|
|
|
|
|||||||||||
| Gross profit |
25,896 | 38,125 | 53,677 | 8,198 | 12,845 | |||||||||||||||
|
|
|
|
|
|
|
|
|
|
|
|||||||||||
| Operating expenses: |
||||||||||||||||||||
| Research and development |
4,977 | 12,283 | 12,530 | 2,103 | 3,945 | |||||||||||||||
| Sales and marketing |
5,209 | 12,522 | 19,358 | 3,543 | 8,223 | |||||||||||||||
| General and administrative |
2,506 | 6,610 | 4,766 | 893 | 1,306 | |||||||||||||||
|
|
|
|
|
|
|
|
|
|
|
|||||||||||
| Total operating expenses |
12,692 | 31,415 | 36,654 | 6,539 | 13,474 | |||||||||||||||
|
|
|
|
|
|
|
|
|
|
|
|||||||||||
| Income (loss) from operations |
13,204 | 6,710 | 17,023 | 1,659 | (629 | ) | ||||||||||||||
| Interest income |
65 | 9 | 4 | 2 | 3 | |||||||||||||||
| Other expense, net |
(7 | ) | (7 | ) | (16 | ) | (1 | ) | (26 | ) | ||||||||||
|
|
|
|
|
|
|
|
|
|
|
|||||||||||
| Income (loss) before provision for income taxes |
13,262 | 6,712 | 17,011 | 1,660 | (652 | ) | ||||||||||||||
| Provision for income taxes |
(122 | ) | (75 | ) | (80 | ) | — | (63 | ) | |||||||||||
|
|
|
|
|
|
|
|
|
|
|
|||||||||||
| Net income (loss) |
13,140 | 6,637 | 16,931 | 1,660 | (715 | ) | ||||||||||||||
| Accretion of preferred units to redemption value and issuance costs |
— | (1,834 | ) | (2,078 | ) | (505 | ) | (544 | ) | |||||||||||
| (Earnings) loss distributed to preferred unit holders |
— | (1,350 | ) | (4,741 | ) | (369 | ) | 402 | ||||||||||||
|
|
|
|
|
|
|
|
|
|
|
|||||||||||
| Net income (loss) attributable to common unit holders |
$ | 13,140 | $ | 3,453 | $ | 10,112 | $ | 786 | $ | (857 | ) | |||||||||
|
|
|
|
|
|
|
|
|
|
|
|||||||||||
| Net income (loss) per common unit attributable to common unit holders: |
||||||||||||||||||||
| Basic and Diluted |
$ | 0.17 | $ | 0.06 | $ | 0.19 | $ | 0.02 | $ | (0.02 | ) | |||||||||
|
|
|
|
|
|
|
|
|
|
|
|||||||||||
| Weighted average shares used in computing net income (loss) per common unit attributable to common unit holders: |
||||||||||||||||||||
| Basic and Diluted |
76,230 | 53,587 | 51,900 | 51,900 | 51,900 | |||||||||||||||
|
|
|
|
|
|
|
|
|
|
|
|||||||||||
| Pro forma net income (loss) per common share: |
||||||||||||||||||||
| Basic and Diluted |
||||||||||||||||||||
|
|
|
|
|
|||||||||||||||||
| Weighted average shares of common stock outstanding used in computing pro forma net income (loss) per common share: |
||||||||||||||||||||
| Basic and Diluted |
||||||||||||||||||||
|
|
|
|
|
|||||||||||||||||
The accompanying notes are an integral part of these consolidated financial statements.
F-4
Table of Contents
Gigamon LLC
Consolidated Statements of Redeemable Convertible Preferred Units and Members’ Deficit
(In thousands)
| Preferred Units | Common Shares/Units |
Treasury Units |
Additional Paid-in Capital |
Accumulated Deficit |
Total Members’ Deficit |
|||||||||||||||||||||||||||||
| Units | Amount | Shares/ Units* |
Amount | |||||||||||||||||||||||||||||||
| Balance as of December 31, 2008 |
— | $ | — | 3,812 | $ | 4 | $ | — | $ | 1,873 | $ | (2,724 | ) | $ | (847 | ) | ||||||||||||||||||
|
|
|
|
|
|
|
|
|
|
|
|
|
|
|
|
|
|||||||||||||||||||
| Capitalization of the Company* |
— | $ | — | 76,230 | $ | 1,877 | $ | — | $ | — | $ | (2,724 | ) | $ | (847 | ) | ||||||||||||||||||
| Distribution to members (restated) |
— | — | — | (252 | ) | — | — | (13,248 | ) | (13,500 | ) | |||||||||||||||||||||||
| Stock-based compensation expense |
— | — | — | — | — | 110 | — | 110 | ||||||||||||||||||||||||||
| Net income (restated) |
— | — | — | — | — | — | 13,140 | 13,140 | ||||||||||||||||||||||||||
|
|
|
|
|
|
|
|
|
|
|
|
|
|
|
|
|
|||||||||||||||||||
| Balance as of December 31, 2009 (restated) |
— | — | 76,230 | 1,625 | — | 110 | (2,832 | ) | (1,097 | ) | ||||||||||||||||||||||||
| Issuance of Series A preferred units, net of issuance costs |
24,330 | 22,196 | — | — | — | — | — | — | ||||||||||||||||||||||||||
| Treasury units |
— | — | (24,330 | ) | — | (12,469 | ) | — | — | (12,469 | ) | |||||||||||||||||||||||
| Distribution to members (restated) |
— | — | — | — | — | — | (17,005 | ) | (17,005 | ) | ||||||||||||||||||||||||
| Stock-based compensation expense |
— | — | — | — | — | 37 | — | 37 | ||||||||||||||||||||||||||
| Net income (restated) |
— | — | — | — | — | — | 6,637 | 6,637 | ||||||||||||||||||||||||||
| Accretion of preferred units to redemption value and issuance costs |
— | 1,834 | — | — | — | — | (1,834 | ) | (1,834 | ) | ||||||||||||||||||||||||
|
|
|
|
|
|
|
|
|
|
|
|
|
|
|
|
|
|||||||||||||||||||
| Balance as of December 31, 2010 (restated) |
24,330 | 24,030 | 51,900 | 1,625 | (12,469 | ) | 147 | (15,034 | ) | (25,731 | ) | |||||||||||||||||||||||
| Distribution to members (restated) |
— | — | — | — | — | — | (16,943 | ) | (16,943 | ) | ||||||||||||||||||||||||
| Stock-based compensation expense |
— | — | — | — | — | 12 | — | 12 | ||||||||||||||||||||||||||
| Net income (restated) |
— | — | — | — | — | — | 16,931 | 16,931 | ||||||||||||||||||||||||||
| Accretion of preferred units to redemption value and issuance costs |
— | 2,078 | — | — | — | — | (2,078 | ) | (2,078 | ) | ||||||||||||||||||||||||
|
|
|
|
|
|
|
|
|
|
|
|
|
|
|
|
|
|||||||||||||||||||
| Balance as of December 31, 2011 (restated) |
24,330 | 26,108 | 51,900 | 1,625 | (12,469 | ) | 159 | (17,124 | ) | (27,809 | ) | |||||||||||||||||||||||
| Net loss (unaudited) |
— | — | — | — | — | — | (715 | ) | (715 | ) | ||||||||||||||||||||||||
| Allocation of losses to members (unaudited) |
— | — | — | — | — | — | 715 | 715 | ||||||||||||||||||||||||||
| Accretion of preferred units to redemption value and issuance costs (unaudited) |
— | 544 | — | — | — | — | (544 | ) | (544 | ) | ||||||||||||||||||||||||
|
|
|
|
|
|
|
|
|
|
|
|
|
|
|
|
|
|||||||||||||||||||
| Balance as of March 31, 2012 (unaudited) |
24,330 | $ | 26,652 | 51,900 | $ | 1,625 | $ | (12,469 | ) | $ | 159 | $ | (17,668 | ) | $ | (28,353 | ) | |||||||||||||||||
|
|
|
|
|
|
|
|
|
|
|
|
|
|
|
|
|
|||||||||||||||||||
* In accordance with the LLC Agreement (as defined in note 3), all common stock issued and outstanding was converted to common units.
The accompanying notes are an integral part of these consolidated financial statements.
F-5
Table of Contents
Gigamon LLC
Consolidated Statements of Cash Flows
(In thousands)
| Year Ended December 31, | Three Months Ended March 31, |
|||||||||||||||||||
| 2009 | 2010 | 2011 | 2011 | 2012 | ||||||||||||||||
| (restated) | (restated) | (restated) | (unaudited) | |||||||||||||||||
| CASH FLOWS FROM OPERATING ACTIVITIES: |
||||||||||||||||||||
| Net income (loss) |
$ | 13,140 | $ | 6,637 | $ | 16,931 | $ | 1,660 | $ | (715 | ) | |||||||||
| Adjustments to reconcile net income (loss) to net cash provided by operating activities: |
||||||||||||||||||||
| Depreciation and amortization |
130 | 335 | 743 | 136 | 258 | |||||||||||||||
| Loss on disposal of fixed assets |
— | 3 | — | — | — | |||||||||||||||
| Stock-based compensation expense |
110 | 37 | 12 | 12 | — | |||||||||||||||
| Write-down of inventory |
162 | — | 3,227 | 289 | 978 | |||||||||||||||
| Provision for doubtful accounts |
— | — | 16 | — | — | |||||||||||||||
| Changes in operating assets and liabilities: |
||||||||||||||||||||
| Accounts receivable |
(2,942 | ) | (1,297 | ) | (10,200 | ) | 1,149 | 7,768 | ||||||||||||
| Inventory |
(1,398 | ) | (3,346 | ) | (4,811 | ) | 85 | (1,458 | ) | |||||||||||
| Prepaid expenses and other current assets |
(799 | ) | (157 | ) | (2,682 | ) | (692 | ) | (984 | ) | ||||||||||
| Other assets |
— | (91 | ) | 10 | (2 | ) | (5 | ) | ||||||||||||
| Accounts payable |
(115 | ) | 474 | 2,042 | 157 | 181 | ||||||||||||||
| Accrued liabilities and other liabilities, non-current |
1,050 | 1,409 | 5,488 | 1,263 | 2,126 | |||||||||||||||
| Deferred revenue |
2,570 | 3,670 | 10,841 | 979 | 327 | |||||||||||||||
|
|
|
|
|
|
|
|
|
|
|
|||||||||||
| Net cash provided by operating activities |
11,908 | 7,674 | 21,617 | 5,036 | 8,476 | |||||||||||||||
|
|
|
|
|
|
|
|
|
|
|
|||||||||||
| CASH FLOWS FROM INVESTING ACTIVITIES: |
||||||||||||||||||||
| Purchase of property and equipment |
(414 | ) | (832 | ) | (2,124 | ) | (363 | ) | (562 | ) | ||||||||||
|
|
|
|
|
|
|
|
|
|
|
|||||||||||
| Net cash used in investing activities |
(414 | ) | (832 | ) | (2,124 | ) | (363 | ) | (562 | ) | ||||||||||
|
|
|
|
|
|
|
|
|
|
|
|||||||||||
| CASH FLOWS FROM FINANCING ACTIVITIES: |
||||||||||||||||||||
| Distribution of income to members |
(11,020 | ) | (13,887 | ) | (12,195 | ) | — | (4,650 | ) | |||||||||||
| Proceeds from issuance of preferred units, net of issuance costs |
— | 22,196 | — | — | — | |||||||||||||||
| Payment for common unit redemption |
— | (12,469 | ) | — | — | — | ||||||||||||||
|
|
|
|
|
|
|
|
|
|
|
|||||||||||
| Net cash used in financing activities |
(11,020 | ) | (4,160 | ) | (12,195 | ) | — | (4,650 | ) | |||||||||||
|
|
|
|
|
|
|
|
|
|
|
|||||||||||
| NET INCREASE IN CASH AND CASH EQUIVALENTS |
474 | 2,682 | 7,298 | 4,673 | 3,264 | |||||||||||||||
| CASH AND CASH EQUIVALENTS — Beginning of period |
2,648 | 3,122 | 5,804 | 5,804 | 13,102 | |||||||||||||||
|
|
|
|
|
|
|
|
|
|
|
|||||||||||
| CASH AND CASH EQUIVALENTS — End of period |
$ | 3,122 | $ | 5,804 | $ | 13,102 | $ | 10,477 | $ | 16,366 | ||||||||||
|
|
|
|
|
|
|
|
|
|
|
|||||||||||
| SUPPLEMENTAL DISCLOSURES OF CASH FLOW INFORMATION: |
||||||||||||||||||||
| Income taxes paid during the period |
$ | 13 | $ | 20 | $ | 109 | $ | — | $ | 4 | ||||||||||
| NONCASH INVESTING AND FINANCING ACTIVITIES: |
||||||||||||||||||||
| Transfer of property and equipment to inventory |
$ | — | $ | — | $ | 269 | $ | — | $ | 95 | ||||||||||
| Accretion of preferred units to redemption value and issuance costs discount |
$ | — | $ | 1,834 | $ | 2,078 | $ | 505 | $ | 544 | ||||||||||
The accompanying notes are an integral part of these consolidated financial statements.
F-6
Table of Contents
Gigamon LLC
Notes to the Consolidated Financial Statements
1. Description of the Company
Gigamon LLC (the “Company”) designs, develops and sells products and services that together provide customers visibility and control of network traffic. The Company serves global enterprises and services providers that seek to maintain and improve the reliability, performance and security of their network infrastructure. The business was founded in 2004 and was originally operated by Gigamon Systems LLC, a California limited liability company (“Gigamon Systems”). In January 2009, the Company was formed as a limited liability company in the state of Delaware and Gigamon Systems contributed substantially all of its assets and liabilities to the Company in exchange for all the Company’s common units.
2. Summary of Significant Accounting Policies
Principles of Consolidation
The consolidated financial statements include the accounts of the Company and its wholly owned subsidiary in the United Kingdom, established in February 2011. All significant intercompany accounts and transactions have been eliminated in consolidation.
Segments
Management has determined that the Company operates as one reportable and operating segment as financial information on an aggregate and consolidated basis is prepared for and reviewed by the chief executive officer, who is the Company’s chief operating decision maker.
Use of Estimates
The preparation of consolidated financial statements in conformity with accounting principles generally accepted in the United States of America requires management to make certain estimates and assumptions that affect the reported amounts of assets and liabilities and disclosure of contingent assets and liabilities at the date of the financial statements and the reported amounts of revenues and expenses during the reported periods. On an ongoing basis, the Company evaluates its estimates, including but not limited to those related to revenue recognition, provision for doubtful accounts, warranty reserve, excess and obsolete inventory write-downs, fair value of the Company’s common stock, depreciable lives, and income taxes. The Company bases its estimates on historical experience, projections for future performance and other assumptions that it believes to be reasonable under the circumstances. Actual results could differ materially from those estimates.
Unaudited Interim Financial Statements
The interim consolidated balance sheet as of March 31, 2012, the consolidated statements of operations and cash flows for the three months ended March 31, 2011 and 2012, and the consolidated statement of redeemable convertible preferred units and members’ deficit for the three months ended March 31, 2012 are unaudited. The unaudited interim financial statements have been prepared on a basis consistent with the annual consolidated financial statements and, in the opinion of management, reflect all adjustments, which include only normal recurring adjustments, necessary to state fairly the Company’s financial position as of March 31, 2012 and its results of operations and cash flows for the three months ended March 31, 2011 and 2012. The financial data and the other financial information disclosed in these notes to the financial statements related to the three month periods are also
F-7
Table of Contents
Gigamon LLC
Notes to the Consolidated Financial Statements
unaudited. The results of operations for the three months ended March 31, 2012 are not necessarily indicative of the results to be expected for the year ending December 31, 2012 or for any other future annual or interim period.
Foreign Currency Transactions
The Company uses the U.S. dollar as its functional currency. Foreign currency assets and liabilities are remeasured into U.S. dollars using the end-of-period exchange rates except for nonmonetary assets and liabilities, which are remeasured using historical exchange rates. Revenue and expenses are remeasured using an average exchange rate for the respective period. Gains or losses from foreign currency transactions are included in net income (loss) within other income (expense), net. Foreign currency transaction gains and losses have not been significant to the consolidated financial statements for all periods presented.
Cash and Cash Equivalents
The Company considers all highly liquid investments with an original maturity or remaining maturity of three months or less at the time of purchase to be cash equivalents. Cash equivalents consist primarily of investments in money market funds.
Fair Value of Financial Instruments
The Company records its financial assets and liabilities at fair value. The accounting guidance for fair value provides a framework for measuring fair value, clarifies the definition of fair value, and expands disclosures regarding fair value measurements. Fair value is defined as the price that would be received to sell an asset or paid to transfer a liability (an exit price) in an orderly transaction between market participants at the reporting date. The accounting guidance establishes a three-tiered hierarchy, which prioritizes the inputs used in the valuation methodologies in measuring fair value:
Level 1 – Quoted prices in active markets for identical assets or liabilities.
Level 2 – Inputs other than Level 1 that are observable, either directly or indirectly, such as quoted prices in markets that are not active; or other inputs that are observable or can be corroborated by observable market data for substantially the full term of the assets or liabilities.
Level 3 – Unobservable inputs that are supported by little or no market activity and that are significant to the fair value of the assets or liabilities.
The Company’s financial instruments, including cash equivalents, accounts receivable, accounts payable and accrued liabilities have carrying amounts which approximate fair value due to the short-term maturity of these instruments.
Accounts Receivable
Accounts receivable, which represent trade accounts receivable from both resellers and direct customers, are recorded at the invoiced amounts and do not bear interest. The Company extends credit to its customers in the normal course of business and performs ongoing credit evaluations of its customers. The Company establishes an allowance for doubtful accounts for estimated losses resulting from the customer’s inability to make payments. Management determines the collectability of specific customer accounts by their past transaction history. If financial conditions of the Company’s
F-8
Table of Contents
Gigamon LLC
Notes to the Consolidated Financial Statements
customers were to deteriorate, adversely affecting their ability to make payments, additional allowances would be required. Estimates for allowance for doubtful accounts are charged to operating expenses and a credit to a valuation allowance. As of December 31, 2010 and 2011 and March 31, 2012, the Company has recorded an allowance of doubtful accounts of zero, $16,000 and zero (unaudited), respectively.
Concentration of Market, Manufacturing and Credit Risk and Significant Customers
The Company operates in markets that are highly competitive and rapidly changing. Significant technological changes, shifting customer needs, the emergence of competitive products or services with new capabilities and other factors could negatively impact the Company’s operating results. A number of components that meet the Company’s manufacturing requirements are available only from single source suppliers. If these single source suppliers fail to satisfy the Company’s requirements on a timely basis at competitive prices, it could suffer manufacturing delays, a possible loss of revenues, or incur higher cost of sales, any of which could adversely affect its operating results. In addition, the Company relies on a limited number of contract manufacturers to manufacture substantially all of its product and relies on a single-source manufacturer for certain of its product modules. The inability of its contract manufacturers to provide the Company with adequate supplies of high-quality products could cause a delay in order fulfillment, which could adversely affect the Company’s operating results.
Financial instruments that potentially subject the Company to significant concentrations of credit risk consist principally of cash, cash equivalents and accounts receivable. The Company places its cash and cash equivalents, primarily in institutional money market funds, with one major financial institution in the United States of America that management believes is creditworthy.
The Company sells its products primarily through channel partners, including distributors and resellers, and occasionally directly to end-user customers. For the years ended December 31, 2010 and 2011 and the three months ended March 31, 2012, no end-user customer accounted for 10% or more of total revenue for any of the periods presented. The Company generally requires no collateral from its customers.
Customers that represented more than 10% of total revenue and accounts receivable are the following:
| Year Ended | Three Months Ended March 31, 2012 |
|||||||||||||||
| December 31, 2009 |
December 31, 2010 |
December 31, 2011 |
||||||||||||||
| (unaudited) | ||||||||||||||||
| Percent of Total Revenue: |
||||||||||||||||
| Customer A (distributor) |
* | * | 37 | % | 63 | % | ||||||||||
| Customer B (reseller) |
41 | % | 34 | % | 18 | % | * | |||||||||
| Customer C (reseller) |
* | 10 | % | * | * | |||||||||||
| Customer D (direct end-user customer) |
12 | % | * | * | * | |||||||||||
* less than 10%
F-9
Table of Contents
Gigamon LLC
Notes to the Consolidated Financial Statements
| As of December 31, 2010 |
As of December 31, 2011 |
As of March 31, 2012 |
||||||||||
| (unaudited) | ||||||||||||
| Percent of Accounts Receivable: |
||||||||||||
| Customer A (distributor) |
* | 29 | % | 72 | % | |||||||
| Customer B (reseller) |
20 | % | 18 | % | * | |||||||
* less than 10%
Inventory
Inventory is valued at the lower of cost computed on a first-in, first-out basis, or market value. At the point of inventory write-down, a new lower-cost basis for that inventory is established and subsequent changes in facts and circumstances do not result in the restoration or increase in that newly established cost basis. The Company recorded inventory write-downs of $0.2 million, zero, $3.2 million, $0.3 million (unaudited), and $1.0 million (unaudited) during the years ended December 31, 2009, 2010 and 2011, and the three months ended March 31, 2011 and 2012, respectively.
The Company provides for inventory losses based on obsolescence and levels in excess of forecasted demand. In these cases, inventory is reduced to estimated realizable value based on historical usage and expected demand. Inherent in the Company’s estimates of market value in determining inventory valuation are estimates related to economic trends, future demand for the Company’s products, and technical obsolescence of products.
Deferred Costs
The Company defers the direct cost of inventory, associated with the revenue that has been deferred. These costs are recognized when the associated revenue is recognized. The Company had deferred costs recorded within prepaid expenses and other current assets of $0.1 million, $0.5 million and $0.5 million (unaudited) at December 31, 2010 and 2011, and March 31, 2012, respectively.
Property and Equipment
Property and equipment are stated at cost and depreciated using the straight–line method over the estimated useful lives of the assets. Leasehold improvements are amortized over the lesser of the useful life of these improvements or the remaining term of the lease. Maintenance and repairs are charged to operations as incurred. Upon sale or retirement of assets, the cost and related accumulated depreciation are removed from the balance sheet and the resulting gain or loss is reflected within operating expenses.
The useful lives of the property and equipment are as follows:
| Furniture and fixtures |
5 years | |
| Software |
3 years | |
| Equipment and machinery |
1.5 to 3 years | |
| Leasehold improvements |
Shorter of lease term or estimated useful life |
F-10
Table of Contents
Gigamon LLC
Notes to the Consolidated Financial Statements
Research and Development and Software Development Costs
Research and development costs are expensed as incurred, except for certain software development costs. To-date, software development costs qualifying for capitalization have been insignificant. Accordingly, the Company has not capitalized any software development costs.
Impairment of Long-Lived Assets
The Company reviews long-lived assets for impairment whenever events or changes in circumstances indicate that the carrying amount of an asset may not be recoverable. Recoverability is measured by comparison of the anticipated future net undiscounted cash flows to the related assets’ carrying values. If such assets are considered to be impaired, the impairment to be recognized is measured by the amount by which the carrying amount of the assets exceeds the projected discounted future net cash flows arising from the asset. No assets were determined to be impaired during any of the periods presented.
Revenue Recognition
The Company generates revenue from sales of traffic visibility solutions to resellers and direct customers (“product revenue”) as well as maintenance and support contracts and other billable services (together “services revenue”). Most of the Company’s products are hardware appliances containing software components that function together to deliver the essential functionality of the solution. The Company typically delivers products and services in a single transaction. The deliverables consist of traffic visibility solutions, maintenance and support, and other billable services. The Company’s typical arrangement includes a sale of one or multiple products that include first year maintenance and support as well as standard warranty. Other arrangements consist of a sale of products bundled with additional maintenance and support or a renewal of maintenance and support contracts. Billable services are billed in advance or when service is provided and performed as requested by customers. Under maintenance and support contracts, services are provided as needed by customers over the fixed arrangement term. The Company does not grant its customers a general right of return or any refund terms, except to one of the Company’s distributors which has a general right of return and in that case, revenue is deferred until sell-through has occurred. Revenue is reported net of rebates, discounts, and any other sales incentives. The Company recognizes revenue when persuasive evidence of an arrangement exists, delivery has occurred or services have been rendered, the seller’s price is fixed or determinable, and collectability is reasonably assured. When the Company lacks evidence that collectability of the resulting receivable is not probable, it defers recognition of revenue until collectability is reasonably assured.
In 2009, the Financial Accounting Standard Board (“FASB”) amended the accounting guidance on whether multiple deliverables exist, how the arrangement should be separated, and how the consideration should be allocated. The new accounting guidance also requires an entity to allocate revenue in an arrangement using estimated selling prices of deliverables if a vendor does not have vendor-specific objective evidence (“VSOE”) or third-party evidence (“TPE”) of the selling price. The guidance eliminates the use of the residual method, requires entities to allocate revenue using relative standalone selling price and significantly expands the disclosure requirements for multiple-deliverable revenue arrangements.
Effective January 1, 2011, the Company adopted the new accounting guidance for arrangements that include software elements and arrangements with multiple deliverables. Under the new guidance,
F-11
Table of Contents
Gigamon LLC
Notes to the Consolidated Financial Statements
tangible products containing both software and non-software components that function together to deliver the product’s essential functionality, are excluded from the scope of software revenue recognition guidance. Also, the new guidance provided updates on determining whether multiple units of accounting exist, how the arrangement should be separated, and how the consideration should be allocated. The amended guidance for multiple element arrangements did not change the units of accounting for the Company’s revenue transactions. Also, there is no impact on timing of recognized revenue from each deliverable in multiple element arrangements. The new guidance established a hierarchy of evidence to determine the standalone selling price of a deliverable based on vendor VSOE, TPE, or best estimated selling price (“BESP”).
When the Company enters in arrangements to provide more than one product or service (multiple deliverables), these arrangements are evaluated to determine if the multiple elements consist of more than one unit of accounting and can be separated accordingly. Based on separation criteria under the guidance, deliverables in multiple element arrangements can be segregated into separate units of accounting if they have value to the customer on a standalone basis. If deliverables can be separated into individual units of accounting, then the arrangement consideration is allocated among deliverables based on their relative selling price. Revenue from each deliverable is recognized when all requirements are met for that specific deliverable. If deliverables cannot be separated into separate units of accounting, then the arrangement will be accounted for as a single unit of accounting and revenue will be recognized when all requirements are met for all deliverables within the arrangement. The Company has established VSOE for maintenance and support contracts since the majority of selling prices fall within a narrow range when sold separately. For deliverables with no established VSOE, the Company established BESP to determine the standalone selling price for such deliverables. TPE is not used since this information is not widely available in the market. The Company has established a process for developing BESP, which incorporates historical selling prices, the effect of market conditions, gross margin objectives, pricing practices, as well as entity specific factors. The Company monitors and evaluates BESP on a regular basis to ensure that changes in circumstances are accounted for in a timely manner.
The incremental revenue recorded in the year ended December 31, 2011 due to the adoption of the amended guidance was $860,000. The Company is not able to reasonably estimate the effect of adopting this guidance on future periods as the impact will vary if the Company modifies or develops new go-to-market strategies or pricing practices, which could impact VSOE and BESP resulting in a different allocation of revenue to the deliverables in multiple element arrangements.
Shipping and Handling Charges
Shipping and handling costs are recorded in cost of revenue in the period products are shipped to customers.
Warranty
Beginning on February 1, 2011, the Company began providing five-year warranties on its products against defects in manufacturing. Prior to February 1, 2011, the Company provided a one-year warranty on its products. The Company accrues for potential liability claims as a component of cost of product revenue based on historical trends of product failure rates and the expected material and labor costs to provide warranty services. The accrued warranty balance is reviewed periodically for adequacy and is included in accrued liabilities on the consolidated balance sheets.
F-12
Table of Contents
Gigamon LLC
Notes to the Consolidated Financial Statements
Advertising and Promotion Costs
Expenses related to advertising and promotion of products is charged to sales and marketing expense as incurred. For all periods presented, advertising expenses were insignificant.
Income Taxes
The Company is a Delaware limited liability company that passes through income and losses to its members. As a result, the Company is not subject to any U.S. federal or state income taxes as the related tax consequences are reported by the individual members. The Company may be subject to state taxes in certain states that may assess capital taxes or taxes based on gross receipts. In addition, the Company may be subject to taxes in a foreign jurisdiction where it operates.
Comprehensive Income (Loss)
Comprehensive income (loss) is defined as a change in equity of a business enterprise during a period, resulting from transactions from non-owner sources. There have been no material items qualifying as other comprehensive income (loss) and, therefore, for all periods presented, the Company’s comprehensive income (loss) was the same as its reported net income (loss).
Earnings Per Share
The Company applies the two-class method for calculating and presenting earnings per share. Under the two-class method, net income is allocated between common units and other participating securities based on their participating rights. Participating securities are defined as securities that participate in dividends with common units according to a pre-determined formula or a contractual obligation to share in the income of the entity.
Basic net income per common unit is calculated by dividing the net income attributable to common unit holders by the weighted-average number of common units outstanding for the period.
Diluted net income per common unit is computed by giving effect to all potential dilutive common unit outstanding during the period, including options. The computation of diluted net income does not assume conversion or exercise of potentially dilutive securities that would have an anti-dilutive effect on earnings. The dilutive effect of outstanding options is computed using the treasury stock method.
Recent Accounting Pronouncements
In May 2011, the FASB further amended its guidance related to fair value measurements in order to achieve common fair value measurements between U.S. GAAP and International Financial Reporting Standards. The amendments in the updated guidance explain how to measure fair value. They do not require additional fair value measurements and are not intended to establish valuation standards or affect valuation practices outside of financial reporting. The amendments change the wording used to describe many of the requirements in U.S. GAAP for measuring fair value and for disclosing information about fair value measurements. For many of the requirements, the updated guidance should not result in a change in the application of previous fair value measurement guidance. The updated guidance is effective during interim and annual periods beginning after December 15, 2011. The adoption of this guidance on January 1, 2012 did not have a significant impact on the Company’s consolidated financial statements.
F-13
Table of Contents
Gigamon LLC
Notes to the Consolidated Financial Statements
In June 2011, the FASB updated its guidance related to the presentation of comprehensive income. Under the updated guidance, an entity has the option to present the total of comprehensive income, the components of net income, and the components of other comprehensive income either in a single continuous statement of comprehensive income or in two separate but consecutive statements. In both choices, an entity is required to present each component of net income along with total net income, each component of other comprehensive income along with a total for other comprehensive income, and a total amount for comprehensive income. The updated guidance eliminates the option to present the components of other comprehensive income as part of the statement of changes in stockholders’ equity. The amendments in the updated guidance do not change the items that must be reported in other comprehensive income or when an item of other comprehensive income must be reclassified to net income. In December 2011, the FASB further amended its guidance to defer changes related to the presentation of reclassification adjustments indefinitely as a result of concerns raised by stakeholders that the new presentation requirements would be difficult for preparers and add unnecessary complexity to financial statements. The updated guidance, other than the portion related to the presentation of reclassification adjustments, will be effective for fiscal years, and interim periods within those fiscal years, beginning after December 15, 2011, with early adoption permitted. The updated guidance must be applied retrospectively. The adoption of this guidance on January 1, 2012 did not have an impact on the Company’s consolidated financial statements.
3. Restatements of Previously Issued Financial Statements
The Company has restated its consolidated financial statements as of December 31, 2011 and 2010 and for the years ended December 31, 2011, 2010, and 2009 to correct for the following errors:
| Ÿ | The Company determined that inventory as of December 31, 2011 was overstated because excess and obsolete inventory write-downs of $0.6 million were not recorded in 2011. In addition, the Company failed to provide for a probable loss related to non-cancellable future inventory purchase commitments of $1.3 million in accrued liabilities as of December 31, 2011. The correction of these errors increased cost of revenue by $1.9 million. |
| Ÿ | The Company determined the fair value of the common units of Gigamon Systems exceeded the exercise price of the common unit options granted to Gigamon Systems’ employees during 2007 and 2008. The granting of options at less than fair value created taxable income for the employees and a tax withholding obligation for the Company. The withholding obligation is based on the employees’ taxable income as these options vest and as the fair value of the units increase until the options are exercised, cancelled or expire. This tax withholding obligation includes the federal and California income taxes ordinarily assessed on taxable income for employees as well as additional penalty income taxes for both federal and California, including related interest and penalties for employees. |
| The Company has provided for all liabilities associated with this failure to withhold resulting in an additional liability of $2.9 million and $0.9 million at December 31, 2011 and 2010, respectively, which has been recorded within accrued liabilities. The Company has also recorded, within prepaid expenses and other current assets, a receivable from employees of $0.9 million and $0.3 million as of December 31, 2011 and 2010, respectively, related to the tax withholding for the federal and California income taxes ordinarily assessed on taxable income for employees excluding any penalty income taxes. The resulting increase in operating expenses of $1.4 million, $0.3 million and $0.3 million for the years ended December 31, 2011, 2010, and 2009, respectively, represents the additional federal and California income taxes, |
F-14
Table of Contents
Gigamon LLC
Notes to the Consolidated Financial Statements
| including related interest and certain penalties to be paid by the Company on behalf of the employees as well as the gross up for the associated income taxes due on such payments. |
| Ÿ | The Company has recorded additional adjustments in each of the 2011, 2010 and 2009 consolidated financial statements in order to correct for other errors which were determined not to be material individually or in the aggregate. The most significant of such adjustments was to reduce operating expenses and increase prepaid and other current assets in 2011 for the adjustment of the founders’ bonus, including amounts accrued or already paid, for the errors discussed above. |
| Ÿ | As a result of the above adjustments, the members’ distribution payable amounts as of December 31, 2011 and 2010 were corrected to reflect the amounts owed based on the revised financial results in accordance with the Company’s Restated Limited Liability Company Agreement, dated as of January 20, 2010, as amended (the “LLC Agreement”). |
The following table presents the impact of the restatement adjustments on the Company’s consolidated balance sheets as of December 31, 2011 and 2010 (in thousands):
| As of December 31, 2011 | ||||||||||||
| As Previously Reported |
Effect of Restatement |
As Restated | ||||||||||
| Accounts receivable |
$ | 17,752 | $ | (143 | ) | $ | 17,609 | |||||
| Inventory |
8,024 | (587 | ) | 7,437 | ||||||||
| Prepaid expenses and other current assets |
2,352 | 1,398 | 3,750 | |||||||||
| Accounts payable |
3,323 | (658 | ) | 2,665 | ||||||||
| Accrued liabilities |
3,307 | 4,656 | 7,963 | |||||||||
| Members’ distribution payable |
16,038 | (3,296 | ) | 12,742 | ||||||||
| Deferred revenue |
21,995 | (33 | ) | 21,962 | ||||||||
| Members’ deficit |
24,733 | 3,076 | 27,809 | |||||||||
| As of December 31, 2010 | ||||||||||||
| As Previously Reported |
Effect of Restatement |
As Restated | ||||||||||
| Inventory |
$ | 5,431 | $ | 153 | $ | 5,584 | ||||||
| Prepaid and other current assets |
556 | 512 | 1,068 | |||||||||
| Accrued liabilities |
1,782 | 885 | 2,667 | |||||||||
| Members’ distribution payable |
8,214 | (220 | ) | 7,994 | ||||||||
| Members’ deficit |
25,570 | 161 | 25,731 | |||||||||
F-15
Table of Contents
Gigamon LLC
Notes to the Consolidated Financial Statements
The following table presents the impact of the restatement adjustments on the Company’s consolidated statements of operations for the years ended December 31, 2011, 2010 and 2009 (in thousands):
| Year Ended December 31, 2011 | ||||||||||||
| As Previously Reported |
Effect of Restatement |
As Restated |
||||||||||
| Revenue |
$ | 68,213 | $ | (108 | ) | $ | 68,105 | |||||
| Cost of revenue |
12,258 | 2,170 | 14,428 | |||||||||
| Operating expenses |
35,867 | 787 | 36,654 | |||||||||
| Income from operations |
20,088 | (3,065 | ) | 17,023 | ||||||||
| Other expense, net |
5 | 11 | 16 | |||||||||
| Net income |
20,007 | (3,076 | ) | 16,931 | ||||||||
| Year Ended December 31, 2010 | ||||||||||||
| As Previously Reported |
Effect of Restatement |
As Restated |
||||||||||
| Cost of revenue |
$ | 8,429 | $ | (68 | ) | $ | 8,361 | |||||
| Operating expenses |
31,193 | 222 | 31,415 | |||||||||
| Income from operations |
6,864 | (154 | ) | 6,710 | ||||||||
| Other expense, net |
— | 7 | 7 | |||||||||
| Net income |
6,798 | (161 | ) | 6,637 | ||||||||
| Year Ended December 31, 2009 | ||||||||||||
| As Previously Reported |
Effect of Restatement |
As Restated |
||||||||||
| Cost of revenue |
$ | 5,516 | $ | (25 | ) | $ | 5,491 | |||||
| Operating expenses |
12,504 | 188 | 12,692 | |||||||||
| Income from operations |
13,367 | (163 | ) | 13,204 | ||||||||
| Other expense, net |
— | 7 | 7 | |||||||||
| Net income |
13,310 | (170 | ) | 13,140 | ||||||||
There was no impact of these restatement adjustments on the net cash provided by (used in) the Company’s operating, financing or investing activities for the years ended December 31, 2011, 2010 and 2009.
F-16
Table of Contents
Gigamon LLC
Notes to the Consolidated Financial Statements
4. Fair Value Measurements
The components of the Company’s cash and cash equivalents are as follows (in thousands):
| December 31, 2010 |
December 31, 2011 |
March 31, 2012 |
||||||||||
| (unaudited) | ||||||||||||
| Cash |
$ | 5,804 | $ | 2,900 | $ | 4,762 | ||||||
| Money market funds |
— | 10,202 | 11,604 | |||||||||
|
|
|
|
|
|
|
|||||||
| Total cash and cash equivalents |
$ | 5,804 | $ | 13,102 | $ | 16,366 | ||||||
|
|
|
|
|
|
|
|||||||
There are no unrealized gains or losses for any of the periods presented. The Company holds money market funds that invest primarily in high-quality short-term money-market instruments, including certificates of deposit, banker’s acceptances, commercial paper, and other money market securities. Investments in these funds are not insured or guaranteed by the Federal Deposit Insurance Corporation (FDIC) or any other government agency. The money market funds are classified as cash and cash equivalents.
Money market funds have been classified as Level 1 because these securities are valued based upon quoted prices in active markets. There have been no transfers between Level 1 and 2 during the periods presented.
5. Balance Sheet Components
Property and equipment, net
Property and equipment, net, are comprised of the following (in thousands):
| December 31, 2010 |
December 31, 2011 |
March 31, 2012 |
||||||||||
| (unaudited) | ||||||||||||
| Equipment and machinery |
$ | 965 | $ | 2,115 | $ | 2,453 | ||||||
| Furniture and fixtures |
75 | 110 | 224 | |||||||||
| Leasehold improvements |
— | 53 | 53 | |||||||||
| Software |
529 | 820 | 836 | |||||||||
|
|
|
|
|
|
|
|||||||
| Total property and equipment |
1,569 | 3,098 | 3,566 | |||||||||
| Less accumulated depreciation and amortization |
(664 | ) | (1,081 | ) | (1,338 | ) | ||||||
|
|
|
|
|
|
|
|||||||
| Total property and equipment, net |
$ | 905 | $ | 2,017 | $ | 2,228 | ||||||
|
|
|
|
|
|
|
|||||||
Depreciation and amortization expense was $0.1 million, $0.3 million and $0.7 million for the years ended December 31, 2009, 2010 and 2011, respectively, and $0.1 million (unaudited) and $0.3 million (unaudited) for the three months ended March 31, 2011 and 2012, respectively.
F-17
Table of Contents
Gigamon LLC
Notes to the Consolidated Financial Statements
Inventories
Inventories are comprised of the following (in thousands):
| December 31, | March 31, 2012 |
|||||||||||
| 2010 | 2011 | |||||||||||
| (restated) | (unaudited) | |||||||||||
| Raw materials |
$ | 1,892 | $ | 3,083 | $ | 4,382 | ||||||
| Finished goods |
3,692 | 4,354 | 3,630 | |||||||||
|
|
|
|
|
|
|
|||||||
| Total inventories |
$ | 5,584 | $ | 7,437 | $ | 8,012 | ||||||
|
|
|
|
|
|
|
|||||||
Accrued Liabilities
The following table shows the components of accrued liabilities (in thousands):
| December 31, | March 31, 2012 |
|||||||||||
| 2010 | 2011 | |||||||||||
| (restated) | (unaudited) | |||||||||||
| Accrued employee related costs |
$ | 1,590 | $ | 2,161 | $ | 2,577 | ||||||
| Accrued payroll and other taxes |
933 | 3,031 | 5,504 | |||||||||
| Accrued inventory purchases |
— | 1,924 | 468 | |||||||||
| Accrued professional services |
16 | 106 | 327 | |||||||||
| Accrued warranty |
— | 231 | 276 | |||||||||
| Other accruals |
128 | 510 | 951 | |||||||||
|
|
|
|
|
|
|
|||||||
| Total accrued liabilities |
$ | 2,667 | $ | 7,963 | $ | 10,103 | ||||||
|
|
|
|
|
|
|
|||||||
Accrued Warranty
The following table presents the activity related to the product warranty (in thousands):
| December 31, | March 31, 2012 |
|||||||||||
| 2010 | 2011 | |||||||||||
| (restated) | (unaudited) | |||||||||||
| Balance at beginning of period |
$ | — | $ | — | $ | 231 | ||||||
| Accrual for warranty during the period |
— | 415 | 100 | |||||||||
| Actual costs incurred |
— | (184 | ) | (55 | ) | |||||||
|
|
|
|
|
|
|
|||||||
| Balance at end of period |
$ | — | $ | 231 | $ | 276 | ||||||
|
|
|
|
|
|
|
|||||||
6. Related Party Transactions
Related Party Receivable
In accordance with the agreement between the Company’s members, based upon the cash position of the Company, an advancement of the distribution for the year may be declared before the end of the fiscal year to all members. The advancement is treated as an interest bearing loan and interest will be paid by the recipients at the end of the year. The interest rate is determined based on the fair market Certificate of Deposit rate at time of advancement. In 2010, a total of $2.0 million was advanced at an interest rate of 1.25% and interest income of $9,000 was collected. The advances were repaid in 2011. No new loans were made in 2011 and for the three months ended March 31, 2012 (unaudited).
F-18
Table of Contents
Gigamon LLC
Notes to the Consolidated Financial Statements
During 2011, the Company paid income taxes on behalf of Gigamon Systems. As of December 31, 2011 and March 31, 2012, the Company had a receivable of $0.9 million and $13,000, respectively, from Gigamon Systems, which was included in prepaid and other current assets within the consolidated balance sheet. The balance is to be repaid through deductions from future distributions payable to Gigamon Systems.
The Company pays bonuses to certain founder employees in accordance with its LLC agreement. For the years ended December 31, 2009, 2010, and 2011, and for the three months ended March 31, 2011 and 2012, founders’ bonus expense was zero, $5.7 million, $4.2 million, $0.4 million, and zero, respectively.
Members’ Distribution Payable
In accordance with the LLC Agreement, the Company may distribute its available cash on hand, from time to time to the holders of Series A preferred units and common units (hereafter referred to as the members) pro rata based upon the number of units held. The Series A preferred units allocation is based on an as-converted to common units basis. However, the Company will not make any such distribution if, upon completion thereof, the Company’s cash and cash equivalents would be less than $2.5 million.
For the periods presented, the undistributed amount is recorded as members’ distribution payable within the consolidated balance sheet. As of December 31, 2010 and 2011 and March 31, 2012, the members’ distribution payable was $8.0 million, $12.7 million and $7.4 million (unaudited), respectively.
7. Commitments and Contingencies
Lease Commitments
The Company leases the office spaces for its headquarters and United Kingdom subsidiary under non-cancelable operating leases that expire at various times through July 2016. The Company has an option to extend the lease on its headquarters from June 2016 to June 2019, as well as an early termination option which allows the Company to terminate this lease effective June 2014. The Company also entered into lease agreements on a yearly basis for its sales offices in New York, Hong Kong and Russia. The Company recognizes rent expense on a straight–line basis over the lease period.
Rent expense related to the Company’s operating leases was approximately $0.1 million, $0.4 million and $0.5 million for the years ended December 2009, 2010 and 2011, respectively, and $0.1 million (unaudited) and $0.1 million (unaudited) for the three months ended March 31, 2011 and 2012, respectively.
Future minimum lease payments under non-cancelable operating leases as of December 31, 2011 are as follows (in thousands):
| Year Ending December 31, |
||||
| 2012 |
$ | 478 | ||
| 2013 |
443 | |||
| 2014 |
470 | |||
| 2015 |
497 | |||
| 2016 |
257 | |||
|
|
|
|||
| $ | 2,145 | |||
|
|
|
F-19
Table of Contents
Gigamon LLC
Notes to the Consolidated Financial Statements
Purchase Commitments
As of December 31, 2011, the Company’s purchase commitments with its vendors totaled $7.1 million which are all due within one year.
Revolving Line of Credit
In April 2011, the Company entered into the Loan and Security Agreement (“Agreement”) with Silicon Valley Bank which was amended in April 2012. The terms of the amended Agreement include a $10.0 million revolving line of credit available through April 2013, as long as the Company is in compliance with the loan covenants. The outstanding principal will accrue interest at a floating per annum rate equal to the greater of one-quarter of one percentage point (0.25%) above the Prime Rate or three and one-half percent (3.50%). At December 31, 2011 and March 31, 2012 (unaudited), the Company had no borrowings under the line of credit.
Under the terms of the Agreement, except as noted above, the Company must maintain compliance with certain negative and affirmative covenants, including financial covenants and covenants relating to the incurrence of other indebtedness, the occurrence of material adverse change, the maintenance of depository accounts, the disposition of assets, mergers, acquisitions, investments, the granting of liens and the payment of dividends. The Company was in compliance with the financial covenants of the agreement as of December 31, 2011 and March 31, 2012 (unaudited).
Legal Proceedings
From time to time, the Company may become involved in legal proceedings arising in the ordinary course of business. The Company is not currently a party to any legal proceedings the outcome of which, if determined adversely to the Company, would individually or in the aggregate have a material adverse effect on its business, operating results, financial condition or cash flows.
Indemnification Obligations
Under the indemnification provisions of its standard sales related contracts, the Company agrees to defend its customers against third-party claims asserting infringement of certain intellectual property rights, which may include patents, copyrights, trademarks, or trade secrets, and to pay judgments entered on such claims. The Company’s exposure under these indemnification provisions is generally limited to the total amount paid by its customer under the agreement. However, certain agreements include indemnification provisions that could potentially expose the Company to losses in excess of the amount received under the agreement. The Company has not incurred any costs as a result of such indemnifications and has not accrued any liabilities related to such obligations in the consolidated financial statements. In addition, the Company indemnifies its officers, directors, and certain key employees while they are serving in good faith in their company capacities. To date, there have been no claims under any indemnification provisions. The fair values of these obligations are not material as of each balance sheet date.
8. Members’ Deficit
Common Units
As of December 31, 2011, the LLC Agreement authorizes the Company to issue 100,000,000 common units at no par value. Each holder of common unit is entitled to one vote for each share of common unit held.
F-20
Table of Contents
Gigamon LLC
Notes to the Consolidated Financial Statements
Redeemable Convertible Series A Preferred Units
As of December 31, 2011 and March 31, 2012 (unaudited), the LLC Agreement authorizes the Company to issue 24,329,545 Series A preferred units (“Series A”) at no par value. As of December 31, 2011 and March 31, 2012 (unaudited), 24,329,545 Series A were issued and outstanding.
The rights, privileges and restrictions of Series A as set forth in the LLC Agreement are summarized as follows:
Voting
Each unit of Series A has voting rights equal to an equivalent number of common units into which it is convertible and votes together as one class with the common units.
Liquidation
Upon a liquidation or a deemed liquidation event, the Company shall distribute the net proceeds or assets available for distribution, whether in cash or in other property, to the holders of Series A and common units as follows:
| Ÿ | First, to the holders of Series A on a pari passu basis, and |
| Ÿ | Next, to the holders of common units, pro rata in proportion to the number of common units held by such holders. |
A merger or consolidation of the Company into another entity in which the members of the Company own less than 50% of the voting stock/units of the surviving company or the sale or transfer of substantially all of the assets would be deemed a liquidation of the Company.
Conversion
Each Series A is convertible into a common unit by dividing $0.9371322 by the conversion price in effect. The initial conversion price of $0.9371322 is subject to adjustments for subdivisions or combinations of common units, reclassification, exchange and substitution and dilutive issuances. As of December 31, 2011 and March 31, 2012, the conversion price in effect was the same as the issuance price. As such, the conversion as of December 31, 2011 and March 31, 2012 (unaudited) was 1-to-1.
Conversion is either at the option of the holder or is automatic upon the written consent of the requisite Series A Preferred Holders. “Requisite Series A Preferred Holders” is defined as holders of a majority of the Series A then issued and outstanding, voting as a separate class.
Redemption
After January 20, 2015, the holders of Series A can elect to require the Company to purchase all of the outstanding Series A at $0.9371322 per unit plus accrued preferred return at 8% per annum, payable in three equal annual installments. Accordingly, the Company is accreting to the January 20, 2015 redemption value of $33.5 million, as this is the first date the Series A can be redeemed. For the years ended December 31, 2010 and 2011 and the three months ended March 31, 2012, the Company has recorded $1.8 million, $2.0 million and $0.5 million (unaudited) for the accretion of the Series A units to their redemption value using the effective interest method. As redemption of Series A is outside the
F-21
Table of Contents
Gigamon LLC
Notes to the Consolidated Financial Statements
control of the Company, all units have been presented outside of Members’ deficit in the Company’s consolidated balance sheets and consolidated statements of redeemable convertible preferred units and members’ deficit.
The Company initially recorded the Series A at their issuance price net of their issuance costs, which represents the carrying value. The difference between the initial carrying value of Series A and their total redemption value is being accreted from the issuance date through the first redemption date, January 20, 2015, using the effective interest rate method. The Company recorded accretion of $117,000, $119,000 and $30,000 (unaudited) for the years ended December 31, 2010 and 2011 and the three months ended March 31, 2012.
The Company will recognize the following accretion (in thousands):
| Year Ending December 31, |
||||
| 2012 |
$ | 2,236 | ||
| 2013 |
2,406 | |||
| 2014 |
2,589 | |||
| 2015 |
145 | |||
|
|
|
|||
| $ | 7,376 | |||
|
|
|
Treasury Units
During the year ended December 31, 2010, the Company repurchased 24,329,545 common units for a total of $22.8 million, of which $12.5 million is classified within members’ deficit. The repurchased units did not have any restrictions imposed by state law. Under the Unit purchase and redemption agreement dated January 15, 2010, the Company paid $0.9371322 for each common unit sold by Gigamon Systems members. The amount paid by the Company exceeded the $0.4485 fair value price of one common unit. As all Gigamon Systems holders of common units were employees, excluding one outside investor who held 3,186,580 common units, the amount paid in excess of the common unit fair value was accounted for as compensation expense. As a result of this payment by the Company, the Company recorded a unit-based compensation charge in the consolidated statement of operations of $10.3 million during the year ended December 31, 2010.
Pro Forma Stockholders’ Equity (Unaudited)
The Company is currently a Delaware limited liability company. Prior to the issuance of common stock in this offering, the Company will convert into a Delaware corporation and change its name from Gigamon LLC to Gigamon Inc. In connection with the conversion, all of its outstanding common units and preferred units will convert into shares of common stock and preferred stock. Immediately following the Company’s conversion to a corporation, the holder of all of its outstanding common units, Gigamon Systems, as well as certain entities affiliated with Highland Capital Partners that hold the Company’s Series A preferred units, will be merged with and into the Company, and the equity holders of Gigamon Systems, and the entities affiliated with Highland Capital Partners that will merge with and into the Company will receive its common stock and preferred stock in exchange for their equity interests. In addition, the Company will record (i) a net adjustment to deferred income tax assets and deferred income tax liabilities in connection with the Company’s conversion from a Delaware limited liability company to a Delaware corporation, with a resulting net adjustment of $ million to retained earnings, (ii) a contribution of $ million to additional paid-in capital in connection with
F-22
Table of Contents
Gigamon LLC
Notes to the Consolidated Financial Statements
the merger of Gigamon Systems with and into the Company as part of the conversion, and (iii) a distribution of $ of cash to the Company’s stockholders at the time of the conversion equal to the members’ distribution payable balance. All of the aforementioned adjustments have been reflected in the pro forma consolidated balance sheet as if these events all occurred on March 31, 2012.
9. Performance Unit Plan (PUP)
In 2009, the Company adopted the 2009 Performance Unit Plan (the “Plan” or “PUP”). The Plan is designed to motivate, reward and retain key contributors to the Company by providing an incentive based on the appreciation in value of the Company at the time of change in control event as defined below. This Plan is not an equity plan and is intended to provide an incentive payment to selected employees, external or third party consultants and members of the Board of Managers (the “Board”). In the event that a participant’s continuous status as an employee or consultant terminates for any reason (including death or disability of participant) prior to the redemption date, vesting shall cease and all rights to receive distributions with respect to unvested performance units granted under the Plan shall cease and be terminated as of the date of such termination of employment or consultancy. The distribution amount is defined as the difference between the redemption value of the units received at the time of sale, or change of control, and the base value of the PUP. The base value of the PUP is determined by the Board at each award date, and was determined to be $0.05 for all periods presented. Performance units do not constitute ownership units or interests of the Company. Amounts distributable under the Plan shall be made only upon any of the following occurrences by acquisition, merger, consolidation or other transaction (“Change of Control”):
| Ÿ | The acquisition by any person, or more than one person acting as a group, of ownership of units of the Company that, together with stock held by such person or group, constitutes more than fifty percent (50%) of the total fair market value or of the total voting power represented by the Company’s then outstanding units; |
| Ÿ | The acquisition by any person, or more than one person acting as a group, of all or substantially all of the assets of the Company, provided that such assets have at least a total gross fair market value equal to or more than 90% of the total gross fair market value of all of the assets of the Company immediately before such acquisition, except that no “Change of Control” shall occur if the assets are transferred to an entity that is controlled by the unit holders of the Company immediately after the transfer; or |
| Ÿ | An initial public offering. |
Awards granted under the plan generally vest over a four-year period with 25% vesting on the first anniversary from the grant date and the remainder vesting ratably each month over the ensuing 36-month period.
F-23
Table of Contents
Gigamon LLC
Notes to the Consolidated Financial Statements
The following table summarizes the Company’s PUP activity:
| PUPS Outstanding | ||||||||||||
| PUPS Available for Grant |
Number of PUPS |
Weighted- Average Base Price |
||||||||||
| Units authorized at plan inception |
1,536,000 | — | NA | |||||||||
| Granted |
(814,000 | ) | 814,000 | $ | 0.05 | |||||||
|
|
|
|
|
|||||||||
| Balances — December 31, 2009 |
722,000 | 814,000 | 0.05 | |||||||||
| Additional units authorized under plan |
3,332,924 | — | NA | |||||||||
| Granted |
(2,054,000 | ) | 2,054,000 | 0.05 | ||||||||
| Cancelled |
50,000 | (50,000 | ) | 0.05 | ||||||||
|
|
|
|
|
|||||||||
| Balances — December 31, 2010 |
2,050,924 | 2,818,000 | 0.05 | |||||||||
| Granted |
(2,310,550 | ) | 2,310,550 | 0.05 | ||||||||
| Cancelled |
469,292 | (469,292 | ) | 0.05 | ||||||||
|
|
|
|
|
|||||||||
| Balances — December 31, 2011 |
209,666 | 4,659,258 | 0.05 | |||||||||
| Cancelled |
66,043 | (66,043 | ) | 0.05 | ||||||||
|
|
|
|
|
|||||||||
| Balances — March 31, 2012 (unaudited) |
275,709 | 4,593,215 | $ | 0.05 | ||||||||
|
|
|
|
|
|||||||||
| As of December 31, 2011 | ||||||||||||
| Base Price |
Number Outstanding | Weighted Average Remaining Contractual Life (in Years) |
Number Vested | |||||||||
| $0.05 | 4,659,258 | 8.80 | 1,379,083 | |||||||||
| As of March 31, 2012 | ||||||||||||
| Base Price |
Number Outstanding | Weighted Average Remaining Contractual Life (in Years) |
Number Vested | |||||||||
| $0.05 | 4,593,215 | 7.37 | 1,633,244 | |||||||||
While the distributable amount may be satisfied in either cash or stock at the time of a change in control, the Company has elected to make such distribution in cash. Accordingly, the Company intends to pay out the vested awards at the time of an IPO in cash and that the cash value will be determined based on the price of the common units in the IPO. Under existing accounting guidance, the compensation expense associated with the Plan is not required to be reflected in the consolidated financial statements until an acquisition or Change of Control is deemed probable. Accordingly, the Company has not recorded any liabilities or compensation expense associated with the PUPs in its consolidated financial statements for the years ended December 31, 2009, 2010 and 2011 and the three months ended March 31, 2012 (unaudited) but will record the entire amount in the period in which a change of control occurs.
10. Unit Option Plan
Prior to the formation of the Company in 2009, Gigamon Systems issued to some of its employees unit options to purchase Gigamon Systems equity. As these individuals became employees of the Company upon the transfer to the Company of all the assets, liabilities and equity of Gigamon Systems subsequent to the Company’s formation, the Company assumed all of the necessary tax obligations and recorded all stock-based compensation expense related to these unit options.
F-24
Table of Contents
Gigamon LLC
Notes to the Consolidated Financial Statements
There were 2,596,920 unit options outstanding as of December 31, 2011 and March 31, 2012 (unaudited) with a weighted average exercise price of $0.01 per unit. The weighted average remaining contractual life as of December 31, 2011 and March 31, 2012 related to these unit options were 4.7 years and 4.5 years (unaudited), respectively. The aggregate intrinsic value of these unit options as of December 31, 2011 and March 31, 2012 was $5.2 million and $10.0 million (unaudited), respectively. There were 2,501,052 of these unit options vested and exercisable as of December 31, 2011.
There were no other unit options granted by the Company or Gigamon Systems during the years ended December 31, 2009, 2010, 2011 and during the three months ended March 31, 2012.
In April 2012, the Company adopted the 2012 Unit Option Plan (“Option Plan”). The Option Plan authorizes the Company to grant options up to a maximum of 5,901,516 units to employees, members and consultants of the Company.
Under the Option Plan, options granted are generally subject to a four-year vesting period whereby options become 25% vested on the first anniversary from the grant date and then ratably monthly thereafter through the end of the vesting period. Vested options may be exercised up to ten years from the vesting commencement date, as defined in the Option Plan. Vested but unexercised options expire three months after termination of employment with the Company. There were no options granted under this Option Plan as of March 31, 2012.
Stock-Based Compensation Expense
Determining the fair value of the Company’s stock requires complex and subjective judgment and estimates. There is inherent uncertainty in making these judgments and estimates. The absence of an active market for the Company’s common units required the Board to estimate the fair value of its common unit for purposes of setting the exercise price of the options and estimating the fair value of common unit at each meeting at which options were granted based on factors such as the valuations of comparable companies, the status of the Company’s development and sales efforts, revenue growth and additional objective and subjective factors relating to the Company’s business. The Company performed its analysis in accordance with applicable elements of the practice aid issued by the American Institute of Certified Public Accountants entitled Valuation of Privately Held Company Equity Securities Issued as Compensation.
The fair value of unit options is estimated on the date of grant using the Black-Scholes option-pricing model. The expected life of these options is based on the peer companies expected lives. The risk-free interest rate for the period covering the expected life of the option is based on the U.S. Treasury yield curve in effect at the time of grant. The expected volatility was determined based on historical volatility of the common stock of publicly traded comparable companies and the expected life of the options. The dividend yield assumption is based on the Company’s historical dividend payouts. The Company uses the graded vesting method for expense attribution.
F-25
Table of Contents
Gigamon LLC
Notes to the Consolidated Financial Statements
The following table presents the unit based compensation expense recorded in the Company’s consolidated statement of operations for the year ended December 31, 2009, 2010 and 2011 and the three months ended March 31, 2011 and 2012 (unaudited). See Note 8, Members’ Deficit Treasury Units for more information.
| Year Ended December 31, |
Three Months Ended March 31, |
|||||||||||||||||||
| 2009 | 2010 | 2011 | 2011 | 2012 | ||||||||||||||||
| (dollars in thousands) | (unaudited) | |||||||||||||||||||
| Cost of revenue |
$ | 8 | $ | 1,086 | $ | — | $ | — | $ | — | ||||||||||
| Research and development |
64 | 4,692 | 8 | 8 | — | |||||||||||||||
| Sales and marketing |
25 | 2,377 | 2 | 2 | — | |||||||||||||||
| General and administrative |
13 | 2,212 | 2 | 2 | — | |||||||||||||||
|
|
|
|
|
|
|
|
|
|
|
|||||||||||
| Total stock-based compensation expense |
$ | 110 | $ | 10,367 | $ | 12 | $ | 12 | $ | — | ||||||||||
|
|
|
|
|
|
|
|
|
|
|
|||||||||||
Capitalizable stock-based compensation expense relating to inventory or deferred cost of revenues was not significant for any period presented.
11. Net Income (Loss) per Common Unit and Pro Forma Net Income (Loss) per Common Share (Unaudited)
Net income (loss) per unit is presented in conformity with the two-class method required for participating security. Holders of Series A preferred units are entitled to receive a cumulative preferred return of 8% per annum upon a liquidation or deemed liquidation event or after January 20, 2015. The cumulative preferred return is reflected in the Series A preferred units redemption value. The preferred return is payable prior and in preference to any other shares of the Company’s common units. In the event an earning distribution is approved by the Board, holders of Series A preferred units are entitled to a proportionate share of any such distribution as if they were holders of common units (on an as-if converted basis). Holders of the Series A preferred units have a contractual obligation to share in the losses of the Company. The Company considers its preferred units to be a participating security and, in accordance with the two-class method, earnings allocated/distributed to preferred units and the related number of outstanding shares of preferred units have been excluded from the computation of basic and diluted net income (loss) per unit. As such, the Company’s basic and diluted net income (loss) per unit is the same.
Under the two-class method, net income attributable to common unit holders is determined by allocating undistributed earnings, calculated as net income less the current period Series A convertible preferred units cumulative preferred return, between common units and Series A convertible preferred units. In computing diluted net income attributable to common unit holders, undistributed earnings are re-allocated to reflect the potential impact of dilutive securities. For the periods presented, the Company made earning distribution to its members (common units and Series A preferred units holders) on a proportionate basis on an as-if converted basis. As such, there are no undistributed earnings to be allocated between the common units and preferred units. Net income (loss) attributable to common unit holders is calculated as net income (loss) less the current period Series A convertible preferred units cumulative preferred return and earnings distributed to holders of Series A preferred units.
Basic and diluted net income per common unit is computed by dividing the net income attributable to common unit holders by the weighted-average number of common units outstanding during the period.
F-26
Table of Contents
Gigamon LLC
Notes to the Consolidated Financial Statements
The following outstanding shares of potentially dilutive securities were excluded from the computation of diluted net income per common unit for the periods presented because including them would have been antidilutive (in thousands):
| Year Ended December 31, | Three Months Ended March 31, |
|||||||||||||||||||
| 2009 | 2010 | 2011 | 2011 | 2012 | ||||||||||||||||
| (unaudited) | ||||||||||||||||||||
| Convertible Series A preferred units |
— | 24,330 | 24,330 | 24,330 | 24,330 | |||||||||||||||
Unaudited Pro Forma Net Income (Loss) Per Common Share
Pro forma basic and diluted net income (loss) per common share have been computed to give effect to the assumed conversion of the redeemable convertible preferred units into common stock upon the completion of the initial public offering of the Company’s common stock. In addition, the pro forma net income (loss) applied in computing the pro forma basic and diluted net income (loss) per share is based upon the Company’s historical net income (loss) as adjusted to reflect the conversion of the Company from a Delaware limited liability company into a Delaware corporation. Prior to such conversion, the Company was treated as a partnership and generally not subject to income taxes. The pro forma net income (loss), therefore, includes adjustments for income tax expense (benefit) as if the Company had been a corporation and subject to income taxes at an assumed combined federal, state, and local income tax rate of %. Upon the conversion of the Company into a Delaware corporation, the Company expects to record a non-cash benefit equal to the amount of the net adjustments to the deferred tax balances, which would have been $ on a pro forma basis as of March 31, 2012, which has not been reflected in the adjustment to pro forma net income (loss) for the year ended December 31, 2011 or the three months ended March 31, 2012.
The following table presents the calculation of unaudited pro forma net income (loss) per common share – basic and diluted for the year ended December 31, 2011 and the three months ended March 31, 2012 (in thousands, except per share data):
| Year Ended December 31, 2011 |
Three Months Ended March 31, 2012 | |||
| (unaudited) | (unaudited) | |||
| Net income (loss) |
||||
| Adjustment for pro forma income tax expense (benefit) |
||||
| Pro forma net income (loss) |
||||
|
|
| |||
| Weighted average shares used to compute pro forma net income (loss) per share |
||||
| Weighted average shares used to compute basic net income (loss) per share, basic and diluted |
||||
| Pro forma adjustment to reflect assumed conversion of redeemable preferred units |
||||
|
|
| |||
| Weighted average shares used to compute pro forma net income (loss) per share, basic and diluted |
||||
|
|
| |||
| Pro forma net income (loss) per share attributable to common stockholders: |
||||
| Basic and Diluted |
||||
|
|
|
F-27
Table of Contents
Gigamon LLC
Notes to the Consolidated Financial Statements
12. Segment Information
Operating segments are defined as components of an enterprise that engage in business activities for which separate financial information is available and evaluated by the chief operating decision maker in deciding how to allocate resources and assessing performance. The Company’s chief operating decision maker is its chief executive officer. The chief executive officer reviews financial information presented on a consolidated basis, for purposes of allocating resources and evaluating financial performance. The Company has one business activity and there are no segment managers who are held accountable for operations, or plans for levels or components below the consolidated unit level. Accordingly, the Company operates as a single reportable segment.
The Company’s revenues by geographic region, based on the location to where the product was shipped, are summarized as follows (in thousands):
| Year Ended December 31, | Three Months Ended March 31, |
|||||||||||||||||||
| 2009 | 2010 | 2011 | 2011 | 2012 | ||||||||||||||||
| (unaudited) | ||||||||||||||||||||
| United States |
$ | 23,434 | $ | 34,346 | $ | 50,627 | $ | 7,338 | $ | 13,697 | ||||||||||
| Rest of North America |
1,192 | 1,667 | 3,595 | 300 | 713 | |||||||||||||||
| Europe, Middle East and Africa |
3,429 | 6,601 | 9,559 | 1,776 | 1,501 | |||||||||||||||
| Asia Pacific |
3,332 | 3,872 | 4,324 | 659 | 791 | |||||||||||||||
|
|
|
|
|
|
|
|
|
|
|
|||||||||||
| Total |
$ | 31,387 | $ | 46,486 | $ | 68,105 | $ | 10,073 | $ | 16,702 | ||||||||||
|
|
|
|
|
|
|
|
|
|
|
|||||||||||
The Company’s long-lived assets by geographic region is summarized as follows (in thousands):
| December 31, | March 31, 2012 |
|||||||||||
| 2010 | 2011 | |||||||||||
| (unaudited) | ||||||||||||
| United States |
$ | 905 | $ | 1,950 | $ | 2,159 | ||||||
| Other |
— | 67 | 69 | |||||||||
|
|
|
|
|
|
|
|||||||
| $ | 905 | $ | 2,017 | $ | 2,228 | |||||||
|
|
|
|
|
|
|
|||||||
13. Employee Benefit Plans
The Company sponsors a 401(k) defined contribution plan providing a match equal to 3% of each participant’s compensation subject to applicable tax rules. The Company’s contributions to the plan were $0.2 million, $0.3 million and $0.4 million for the years ended December 31, 2009, 2010 and 2011, respectively. The Company contributed $0.2 million to its 401(k) defined contribution plan in the three months ended March 31, 2011 and 2012 (unaudited).
14. Subsequent Events
The Company has evaluated subsequent events through July 13, 2012, the date the audited consolidated financial statements and the unaudited interim consolidated financial statements for the three months ended March 31, 2012 were issued for inclusion in the registration statement on Form S-1.
F-28
Table of Contents
Shares
Gigamon Inc.
Common Stock
| Goldman, Sachs & Co. | BofA Merrill Lynch | Credit Suisse | ||
| Barclays | ||||
| Raymond James | ||||
Prospectus dated , 2012
Table of Contents
PART II
INFORMATION NOT REQUIRED IN PROSPECTUS
| ITEM 13. | OTHER EXPENSES OF ISSUANCE AND DISTRIBUTION. |
The following table sets forth all expenses to be paid by the Registrant, other than underwriting discounts and commissions, in connection with this offering. All amounts shown are estimates except for the SEC registration fee and the FINRA filing fee.
| SEC registration fee |
$ | 11,460 | ||
| FINRA filing fee |
15,500 | |||
| Listing fee |
* | |||
| Printing and engraving |
* | |||
| Legal fees and expenses |
* | |||
| Accounting fees and expenses |
* | |||
| Blue sky fees and expenses (including legal fees) |
* | |||
| Transfer agent and registrar fees |
* | |||
| Miscellaneous |
* | |||
|
|
|
|||
| Total |
$ | * | ||
|
|
|
| * | To be filed by amendment |
ITEM 14. INDEMNIFICATION OF DIRECTORS AND OFFICERS.
Section 145 of the Delaware General Corporation Law authorizes a corporation’s board of directors to grant, and authorizes a court to award, indemnity to officers, directors, and other corporate agents.
Prior to the completion of this offering, we expect to adopt an amended and restated certificate of incorporation, which will become effective in connection with the completion of this offering, and which will contain provisions that limit the liability of our directors for monetary damages to the fullest extent permitted by Delaware law. Consequently, our directors will not be personally liable to us or our stockholders for monetary damages for any breach of fiduciary duties as directors, except liability for the following:
| Ÿ | any breach of their duty of loyalty to our company or our stockholders; |
| Ÿ | any act or omission not in good faith or that involves intentional misconduct or a knowing violation of law; |
| Ÿ | unlawful payments of dividends or unlawful stock repurchases or redemptions as provided in Section 174 of the Delaware General Corporation Law; or |
| Ÿ | any transaction from which they derived an improper personal benefit. |
Any amendment to, or repeal of, these provisions will not eliminate or reduce the effect of these provisions in respect of any act, omission or claim that occurred or arose prior to that amendment or repeal. If the Delaware General Corporation Law is amended to provide for further limitations on the personal liability of directors of corporations, then the personal liability of our directors will be further limited to the greatest extent permitted by the Delaware General Corporation Law.
In addition, prior to the completion of this offering, we expect to adopt amended and restated bylaws which will provide that we will indemnify, to the fullest extent permitted by law, any person who is or was a party or is threatened to be made a party to any action, suit or proceeding by reason of the fact that he or she is or was one of our directors or officers or is or was serving at our request as a
II-1
Table of Contents
director or officer of another corporation, partnership, joint venture, trust, or other enterprise. Our amended and restated bylaws are expected to provide that we may indemnify to the fullest extent permitted by law any person who is or was a party or is threatened to be made a party to any action, suit, or proceeding by reason of the fact that he or she is or was one of our employees or agents or is or was serving at our request as an employee or agent of another corporation, partnership, joint venture, trust, or other enterprise. Our amended and restated bylaws will also provide that we must advance expenses incurred by or on behalf of a director or officer in advance of the final disposition of any action or proceeding, subject to very limited exceptions.
Further, prior to the completion of this offering, we expect to enter into indemnification agreements with each of our directors and executive officers that may be broader than the specific indemnification provisions contained in the Delaware General Corporation Law. These indemnification agreements will require us, among other things, to indemnify our directors and executive officers against liabilities that may arise by reason of their status or service. These indemnification agreements will also require us to advance all expenses incurred by the directors and executive officers in investigating or defending any such action, suit, or proceeding. We believe that these agreements are necessary to attract and retain qualified individuals to serve as directors and executive officers.
The limitation of liability and indemnification provisions that are expected to be included in our amended and restated certificate of incorporation, amended restated bylaws, and in indemnification agreements that we enter into with our directors and executive officers may discourage stockholders from bringing a lawsuit against our directors and executive officers for breach of their fiduciary duties. They may also reduce the likelihood of derivative litigation against our directors and executive officers, even though an action, if successful, might benefit us and other stockholders. Further, a stockholder’s investment may be adversely affected to the extent that we pay the costs of settlement and damage awards against directors and executive officers as required by these indemnification provisions. At present, we are not aware of any pending litigation or proceeding involving any person who is or was one of our directors, officers, employees or other agents or is or was serving at our request as a director, officer, employee or agent of another corporation, partnership, joint venture, trust or other enterprise, for which indemnification is sought, and we are not aware of any threatened litigation that may result in claims for indemnification.
The underwriting agreement filed as Exhibit 1.1 to this registration statement provides for indemnification by the underwriters of the Registrant and its officers and directors for certain liabilities arising under the Securities Act and otherwise.
| ITEM 15. | RECENT SALES OF UNREGISTERED SECURITIES. |
Since January 1, 2009, we have issued unregistered securities to a limited number of persons, as described below.
Sales of Series A Preferred Stock
On January 20, 2010, we sold an aggregate of 24,329,545 shares of our Series A preferred stock to a total of four accredited investors at a purchase price per unit of $0.94, for an aggregate purchase price of $22.8 million.
Option and Common Unit Issuances
We granted our employees, consultants and other service providers options to purchase an aggregate of 5,864,300 shares of common stock under our 2012 Unit Option Plan at exercise prices ranging from $2.03 to $3.88 per share.
II-2
Table of Contents
We believe these transactions were exempt from registration under the Securities Act in reliance upon Section 4(2) of the Securities Act or Regulation D promulgated thereunder, or Rule 701 promulgated under Section 3(b) of the Securities Act as transactions by an issuer not involving any public offering or pursuant to benefit plans and contracts relating to compensation as provided under Rule 701. The recipients of the securities in each of these transactions represented their intentions to acquire the securities for investment only and not with a view to or for sale in connection with any distribution thereof, and appropriate legends were placed upon the stock certificates issued in these transactions. All recipients had adequate access, through their relationships with us, to information about Gigamon.
| ITEM 16. | EXHIBITS AND FINANCIAL STATEMENT SCHEDULES. |
| (a) | Exhibits. The following exhibits are filed herewith or incorporated herein by reference: |
| Exhibit |
Description | |
| 1.1* | Form of Underwriting Agreement | |
| 2.1* | Conversion Agreement dated as of , 2012, between the registrant and the other parties thereto | |
| 2.2* | Agreement and Plan of Merger dated as of , 2012, between the registrant and the other parties thereto | |
| 3.1 | Restated Limited Liability Company Agreement dated as of January 20, 2010, between the registrant and the other parties thereto, as amended by Amendment No. 1 to Restated Limited Liability Company Agreement dated as of April 26, 2011 | |
| 3.2* | Form of Amended and Restated Certificate of Incorporation of registrant, to be in effect upon the completion of this offering | |
| 3.3* | Form of Amended and Restated Bylaws of registrant, to be in effect upon the completion of this offering | |
| 4.1* | Specimen common stock certificate of the registrant | |
| 4.2 | Investor Rights Agreement dated as of January 20, 2010, between the registrant and the other parties thereto | |
| 5.1* | Opinion of Wilson Sonsini Goodrich & Rosati, P.C. | |
| 10.1+* | Form of Indemnification Agreement between the registrant and its directors and officers | |
| 10.2+ | 2009 Performance Unit Plan | |
| 10.3+ | Form of Performance Unit Grant Notice and Agreement | |
| 10.4+ | 2012 Unit Option Plan | |
| 10.5+ | Form of Unit Option Agreement | |
| 10.6+* | 2012 Equity Incentive Plan | |
| 10.7+* | Form of Stock Option Agreement | |
| 10.8+ | Offer Letter, between the registrant and Michael C. Ruettgers, dated November 4, 2010 | |
| 10.9+ | Offer Letter, between the registrant and Kenneth A. Goldman, dated February 7, 2011 | |
| 10.10+ | Offer Letter, between the registrant and Andrew M. Miller, dated April 16, 2012 | |
| 10.11 | Commercial/Industrial Lease dated as of May 21, 2010, between the registrant and LBA Realty Fund II-WBP II, LLC | |
II-3
Table of Contents
| Exhibit |
Description | |
| 10.12†* | Distribution Agreement dated as of May 5, 2010, between the registrant and Interlink Communication Systems, Inc., as amended | |
| 21.1 | List of subsidiaries of registrant | |
| 23.1 | Consent of PricewaterhouseCoopers LLP, Independent Registered Public Accounting Firm | |
| 23.2* | Consent of Wilson Sonsini Goodrich & Rosati, P.C. (included in Exhibit 5.1) | |
| 24.1 | Power of Attorney (see page II-5 to this registration statement on Form S-1) |
| * | To be filed by amendment. |
| + | Indicates a management contract or compensatory plan. |
| † | Portions of this exhibit have been omitted pending a determination by the SEC as to whether these portions should be granted confidential treatment. |
| (b) | Financial Statement Schedules. |
All financial statement schedules are omitted because the information called for is not required or is shown either in the consolidated financial statements or in the notes thereto.
| ITEM 17. | UNDERTAKINGS. |
The undersigned Registrant hereby undertakes to provide to the underwriters at the closing specified in the underwriting agreement certificates in such denominations and registered in such names as required by the underwriters to permit prompt delivery to each purchaser.
Insofar as indemnification for liabilities arising under the Securities Act of 1933 may be permitted to directors, officers and controlling persons of the Registrant pursuant to the foregoing provisions, or otherwise, the Registrant has been advised that in the opinion of the SEC such indemnification is against public policy as expressed in the Act and is, therefore, unenforceable. In the event that a claim for indemnification against such liabilities (other than the payment by the Registrant of expenses incurred or paid by a director, officer or controlling person of the Registrant in the successful defense of any action, suit or proceeding) is asserted by such director, officer or controlling person in connection with the securities being registered, the Registrant will, unless in the opinion of its counsel the matter has been settled by controlling precedent, submit to a court of appropriate jurisdiction the question whether such indemnification by it is against public policy as expressed in the Act and will be governed by the final adjudication of such issue.
The undersigned Registrant hereby undertakes that:
| (1) | For purposes of determining any liability under the Securities Act of 1933, the information omitted from the form of prospectus filed as part of this registration statement in reliance upon Rule 430A and contained in a form of prospectus filed by the Registrant pursuant to Rule 424(b)(1) or (4) or 497(h) under the Securities Act shall be deemed to be part of this registration statement as of the time it was declared effective. |
| (2) | For the purpose of determining any liability under the Securities Act of 1933, each post-effective amendment that contains a form of prospectus shall be deemed to be a new registration statement relating to the securities offered therein, and the offering of such securities at that time shall be deemed to be the initial bona fide offering thereof. |
II-4
Table of Contents
SIGNATURES
Pursuant to the requirements of the Securities Act of 1933, the Registrant has duly caused this registration statement on Form S-1 to be signed on its behalf by the undersigned, thereunto duly authorized, in the City of Milpitas, State of California, on the thirteenth day of July, 2012.
| GIGAMON LLC | ||
| By: |
/S/ TED C. HO | |
| Ted C. Ho | ||
| Chief Executive Officer | ||
POWER OF ATTORNEY
KNOW ALL PERSONS BY THESE PRESENTS, that each person whose signature appears below hereby constitutes and appoints Ted C. Ho and Duston M. Williams, and each of them, as his true and lawful attorney-in-fact and agent with full power of substitution, for him in any and all capacities, to sign any and all amendments to this registration statement (including post-effective amendments or any abbreviated registration statement and any amendments thereto filed pursuant to Rule 462(b) increasing the number of securities for which registration is sought), and to file the same, with all exhibits thereto and other documents in connection therewith, with the Securities and Exchange Commission, granting unto said attorney-in-fact, proxy and agent full power and authority to do and perform each and every act and thing requisite and necessary to be done in connection therewith, as fully for all intents and purposes as he might or could do in person, hereby ratifying and confirming all that said attorney-in-fact, proxy and agent, or his substitute, may lawfully do or cause to be done by virtue hereof.
Pursuant to the requirements of the Securities Act of 1933, this registration statement on Form S-1 has been signed by the following persons in the capacities and on the dates indicated.
| Signature |
Title |
Date | ||
| /s/ Ted C. Ho Ted C. Ho |
Chief Executive Officer and Director (Principal Executive Officer) |
July 13, 2012 | ||
| /s/ Duston M. Williams Duston M. Williams |
Chief Financial Officer (Principal Accounting and Financial Officer) |
July 13, 2012 | ||
| /s/ Patrick P. Leong Patrick P. Leong |
Chief Technology Officer and Director | July 13, 2012 | ||
| /s/ Corey M. Mulloy Corey M. Mulloy |
Director | July 13, 2012 | ||
| /s/ Kenneth A. Goldman Kenneth A. Goldman |
Director | July 13, 2012 | ||
| /s/ Michael C. Ruettgers Michael C. Ruettgers |
Director | July 13, 2012 | ||
| /s/ Andrew M. Miller Andrew M. Miller |
Director | July 13, 2012 | ||
II-5
Table of Contents
EXHIBIT INDEX
| Exhibit |
Description | |
| 1.1* | Form of Underwriting Agreement | |
| 2.1* | Conversion Agreement dated as of , 2012, between the registrant and the other parties thereto | |
| 2.2* | Agreement and Plan of Merger dated as of , 2012, between the registrant and the other parties thereto | |
| 3.1 | Restated Limited Liability Company Agreement dated as of January 20, 2010, between the registrant and the other parties thereto, as amended by Amendment No. 1 to Restated Limited Liability Company Agreement dated as of April 26, 2011 | |
| 3.2* | Form of Amended and Restated Certificate of Incorporation of registrant to be in effect upon the completion of this offering | |
| 3.3* | Form of Amended and Restated Bylaws of registrant, to be in effect upon the completion of this offering | |
| 4.1* | Specimen common stock certificate of the registrant | |
| 4.2 | Investor Rights Agreement dated as of January 20, 2010, between the registrant and the other parties thereto | |
| 5.1* | Opinion of Wilson Sonsini Goodrich & Rosati, P.C. | |
| 10.1+* | Form of Indemnification Agreement between the registrant and its directors and officers | |
| 10.2+ | 2009 Performance Unit Plan | |
| 10.3+ | Form of Performance Unit Grant Notice and Agreement | |
| 10.4+ | 2012 Unit Option Plan | |
| 10.5+ | Form of Unit Option Agreement | |
| 10.6+* | 2012 Equity Incentive Plan | |
| 10.7+* | Form of Stock Option Agreement | |
| 10.8+ | Offer Letter, between the registrant and Michael C. Ruettgers, dated November 4, 2010 | |
| 10.9+ | Offer Letter, between the registrant and Kenneth A. Goldman, dated February 7, 2011 | |
| 10.10+ | Offer Letter, between the registrant and Andrew M. Miller, dated April 16, 2012 | |
| 10.11 | Commercial/Industrial Lease dated as of May 21, 2010, between the registrant and LBA Realty Fund II-WBP II, LLC | |
| 10.12†* | Distribution Agreement dated as of May 5, 2010, between the registrant and Interlink Communication Systems, Inc., as amended | |
| 21.1 | List of subsidiaries of registrant | |
| 23.1 | Consent of PricewaterhouseCoopers LLP, Independent Registered Public Accounting Firm | |
| 23.2* | Consent of Wilson Sonsini Goodrich & Rosati, P.C. (included in Exhibit 5.1) | |
| 24.1 | Power of Attorney (see page II-5 to this registration statement on Form S-1) | |
| * | To be filed by amendment. |
| + | Indicates a management contract or compensatory plan. |
| † | Portions of this exhibit have been omitted pending a determination by the Securities and Exchange Commission as to whether these portions should be granted confidential treatment. |