Attached files
| file | filename |
|---|---|
| EX-2.1 - EXHIBIT 2.1 - Emerald Oil, Inc. | v318108_ex2-1.htm |
| EX-99.1 - PRESS RELEASE - Emerald Oil, Inc. | v318108_ex99-1.htm |
| 8-K - CURRENT REPORT - Emerald Oil, Inc. | v318108_8k.htm |
Voyager Oil & Gas, Inc. (Pro Forma For Acquisition of Emerald Oil Inc.) Investor Presentation July 2012 For Discussion Purposes Only 1
This presentation contains “forward - looking statements” regarding future events and our future results that are subject to the s afe harbors created under the Securities Act of 1933 and the Securities Exchange Act of 1934. All statements other than statements of histo rical facts included in this presentation, such as statements regarding our future expectations to increase our production are forward - looki ng statements (often, but not always, using words such as “expects”, “anticipates”, “plans”, “estimates”, “potential”, “possible”, “probabl e”, or “intends”, or stating that certain actions, events or results “may”, “will”, “should”, or “could” be taken, occur or be achieved). These s tat ements discuss future expectations, contain projections of results of operations or state other “forward-looking” information and may include state men ts that relate to, among other things, business strategies; expected benefits; ability to replace the reserves we produce through drilling and p rop erty acquisitions; drilling plans and locations; oil and natural gas reserves; technology; realized oil and natural gas prices; production volum es; oil and natural gas production expenses; general and administrative expenses; future operating results; cash flows and liquidity; availability of dr illing and production equipment; availability of oil field labor; capital expenditures; availability and terms of capital; marketing of oil and nat ura l gas; general economic conditions; competition in the oil and natural gas industry; effectiveness of risk management activities; environmental liabi lit ies; counterparty credit risk; governmental regulation and taxation; developments in oil - producing and natural - gas producing countries; and plans, objectives, expectations and intentions. On July 9, 2012, Voyager Oil & Gas, Inc. (“Voyager”) , Emerald Oil & Gas NL (“Emerald Australia”), and Emerald Oil, Inc. (“Em era ld Oil”) entered into a securities purchase agreement (the “Purchase Agreement”) whereby Voyager will acquire all of the outstanding equity in ter ests of Emerald Oil From Emerald Australia. The closing of the Purchase Agreement is subject to customary closing conditions, including the com pletion of due diligence. Following the closing of the Purchase Agreement, Emerald Oil will be a wholly owned subsidiary of Voyager, and Vo yag er intends to do business as “Emerald Oil” and submit an application to the NYSE MKT to change its trading symbol from “VOG” to “EO”. This presentation discusses the combined company on a post - closing basis, which assumes all closing conditions will be met or otherwise waived, an d that the transactions contemplated by the Purchase Agreement are consummated. There can be no assurance that such closing conditions wil l be met or otherwise waived or that the transactions contemplated by the Purchase Agreement will be consummated . Forward-looking statements are subject to a number of inherent risks and uncertainties that could cause actual results to dif fer materially from the expectations set forth in the forward-looking statements. These risks include, but are not limited to, the volatility in com modity prices for crude oil and natural gas, the presence or recoverability of estimated reserves, the ability to replace reserves, environment al risks, drilling and operating risks, exploration and development risks, competition and government regulation or other actions. Forward-looking stat ements are not guarantees of future performance or an assurance that our current assumptions and projections are valid. All forward-looking statements speak only as of the date of this presentation and Voyager assumes no obligation to, and expressly disclaims any obligation to, update or revise any forward-looking statement, except as required by law. You should not place undue reliance on these forward-looking statements. Forward - Looking Statements 2

Acquisition of Emerald by Voyager ▪ Consideration ( 1 ) ▪ Up to 19.9% of Voyager common stock (~11.6 million shares) ▪ Management and Board of Directors will own ~9% pro forma for the transaction ▪ Assumption of ~$19 million of indebtedness ▪ Emerald Oil Asset Highlights ▪ 10,600 Williston net acres in Dunn County, North Dakota ▪ 14 gross (5.4 net) operated DSU’s and an inventory of ~58 net unrisked Middle Bakken and Three Forks locations ▪ 45,000 net acres in the Sandwash Basin Niobrara in Northwest Colorado & Southwest Wyoming, actively being developed by offset operators including Shell, Quicksilver, and Gulfport Energy ▪ Rationale ▪ Adds attractive operated inventory and expands executive and technical expertise to kick off operated Bakken and Three Forks drilling program by the end of 2012 / beginning of 2013 3 ▪ J.R. Reger – Executive Chairman ▪ Mike Krzus – Director and CEO ▪ McAndrew Rudisill – Director and President ▪ Lyle Berman – Chairman & CEO of Lakes Entertainment, Chairman VOG ▪ Duke Ligon – Former General Counsel of Devon Energy ▪ Seth Setrakian – Managing Member of First New York Securities ▪ Dan Spears – Partner and P ortfolio Manager at Swank Capital, LLC Board of Directors Management Team ▪ Mike Krzus – Director and CEO ▪ McAndrew Rudisill – Director and President ▪ J.R. Reger – Executive Chairman ▪ Paul Wiesner – Chief Financial Officer ▪ Karl Osterbuhr – VP of Exploration and Business Development ▪ Mitch Thompson – Chief Accounting Officer ▪ Marty Beskow – VP of Finance / Capital Markets 1. Transaction consideration information subject to change with closing adjustments.

▪ Chief Executive Officer of Voyager Oil & Gas since 2009 ▪ Has 18+ years of experience in oil and gas leases ▪ Formerly served as President of South Fork Exploration ▪ CEO Emerald Oil & Gas NL from 2009 and Emerald Oil Inc since 2011 ▪ Petroleum Engineer with over 29 years of international experience developing oil and gas assets ▪ Has held various managerial and executive level roles in upstream oil and gas business ▪ Formerly with Woodside Petroleum Ltd and Shell ▪ President and Executive Chairman of Emerald Oil Inc since 2011 ▪ Has 11+ years of experience in the natural resources sector ▪ Founder and Managing Partner of Pelagic Capital Advisors ▪ Joined Emerald Oil Inc in 2012, and has over 25 years of experience in the oil and gas industry ▪ Served as CFO for Tracker Resource Development II (acquired by Hess), and Storm Cat Energy Corp. ▪ Joined Emerald Oil Inc in 2011, and has over 20 years of operating US oil & gas exploration experience ▪ Formerly served as Exploration Manager at Delta Petroleum, focusing in the Rockies and Gulf Coast regions McAndrew Rudisill Director & President 4 Executive Management Team Michael Krzus Director & CEO J.R. Reger Executive Chairman Paul Wiesner Chief Financial Officer Karl Osterbuhr VP of Exploration and Business Development

Combined Company Overview ▪ ~43,500 net acres in the Williston ▪ 6,900 net operated acres in Dunn County, ND ▪ 6,800 net acres in core focus areas targeted for conversion to operated model ▪ 29,800 net non - operated acres in, Williams, McKenzie, Dunn, Mountrail, and Richland, ND/MT ▪ Drilling inventory (1) ▪ ~238 net unrisked Bakken & Three Forks locations ▪ ~38 net operated locations ▪ 12 - month drilling program ▪ ~$31 million to drill ~2.5 net (2) operated and ~1.1 net non - operated Bakken wells ▪ Transitioning to operated model ▪ Combined management team and operated acreage from Emerald transaction provide base for transition 1. Management estimates based on 4 M iddle B akken wells and 3 Three Forks wells per 1,280 acre spacing unit 2. Assumes average 50% working interest in operated wells 5 Williston Basin Acreage Overview ▪ ~45,000 net acres in the Sandwash Niobrara ▪ Other operators in the play include Anadarko, Quicksilver, Shell, and Gulfport ▪ ~33,500 net acres prospective for Heath shale oil ▪ Musselshell, Petroleum, Garfield, and Fergus Counties, MT ▪ Long term leases with 3 - year extensions provide for option value through 2017 ▪ Positive early drilling results from other operators ▪ Waiting for industry to further de - risk Emerging Oil Plays Other Project Areas ▪ 74,700 net acres prospective for Tiger Ridge gas play ▪ Blaine , Hill, and Chouteau Counties, MT ▪ Low cost of entry equals significant option value ▪ 2,400 net acres in the DJ Basin Niobrara Operating Metrics ▪ Currently producing ~900 boe /d ▪ YE:2011 proved reserves - 3.5 Mmboe ▪ YE:2011 PV - 10 value - ~$60 million Williston

▪ ~43,500 net acre position in the core of the Williston Basin ▪ Pro forma for Emerald transaction, VOG at $1.77 per share would trade at ~$1,431 per Bakken acre vs. the peer group average of $6,188 per Bakken acre (1) ▪ Expanded management team with core oil and gas exploration and development capability to round out Voyager’s land expertise and local Williston Basin knowledge ▪ Technical analysis to high grade current portfolio and identify emerging areas in the Williston Basin and other Rocky Mountain Basins ▪ Operational expertise to implement best drilling and completion practices in Williston Basin ▪ Operated drilling program to commence end of 2012 / early 2013 ▪ ~6,900 net operated acres in Dunn County with an additional ~6,800 net acres in Williams, McKenzie, and Richland Counties, ND/MT targeted for conversion to operated acreage ▪ 12 - month drilling budget: ~$31 million for drilling and completions of ~2.5 net operated and ~1.1 net non - operated Bakken wells (2) ▪ 10 gross operated drilling opportunities currently identified with a 10 well/year operated drilling program beginning 2013 ▪ Large inventory of identified low risk, high return non - operated drilling opportunities ▪ Emerging oil plays include ~45,000 net acres in the Sandwash Niobrara and ~33,500 net acres in the Heath Shale Oil ▪ Other project areas include ~74,700 net acres prospective for the Tiger Ridge gas play and ~2,400 net acres in the DJ Basin Niobrara 12 - Month Growth Plan Significant Williston Oil Exposure at Compelling Valuation Converting to Operated Model Emerging Oil Plays Provide Significant Upside 6 Investment Considerations 1. Enterprise Value of each of the companies listed have been adjusted for production at $80,000 per flowing barrel and net acre age in other areas. For derivation please see slide 21. 2. Assumes ~50% working interest in operated wells and ~4.9% working interest in non - operated wells

Strategy & Execution Strategies Ability To Execute 12 Month Goals ▪ Identify and consolidate core operated Williston Basin acreage position ▪ Leverage 14 gross (5.4 net) operated DSUs to consolidate and increase lease positions ▪ ~6,800 net acres in Williams, McKenzie and Richland Counties, ND/MT targeted for conversion to operated acreage ▪ Increase net operated Williston basin leases to at least 13,000 net acres ▪ Transition to an operated business model while optimizing capital efficiency of non - operated portfolio ▪ Recent management and acreage additions from Emerald transaction (Michael Krzus, Karl Osterbuhr combined 49 years with operating companies) provide operating base ▪ Access to extensive well data from non - operated positions ▪ Commence operated drilling program in early 2013 ▪ Grow operated production to >1,000 boe /d ▪ Build reserves and production and hold acreage with well planned drilling program ▪ Utilize new technical and operational capability and oil and gas management experience to maximize value with effective drilling program ▪ Drill ~3.6 net Bakken wells over the next 12 months ▪ Grow total production to >2,000 boe /d ▪ Demonstrate Sandwash Niobrara oil production and reserve potential ▪ Joint operated position of ~45,000 net acres ▪ Leverage information from recent wells (ours and competitors) to optimize well completions ▪ Commercial Sandwash Niobrara oil production ▪ Agree on conceptual field development plan with joint venture partner ▪ Maintain strong liquidity position and conservative balance sheet ▪ Successful track record of capitalizing on opportunities in difficult economic environments ▪ Execute value accretive acquisitions to meet strategic objectives above ▪ Implement hedging program to limit commodity price sensitivity 7

Oil - Weighted Reserve & Production Growth 8 Average Daily Net Production Per Period ( Boe /d) Proved Reserves: 3.5 Mmboe ( 12/31/2011) & Total Unrisked Potential of 90.4 Mmboe Williston Reserves and Potential Upside (Mmboe) Gross Wells Net Wells Total Boe (Mmboe) PV-10 Value ($MM) PDP 75 2.9 0.7 26.6$ PDNP 32 1.2 0.4 9.7 PUD 169 7.0 2.4 23.3 Total Proved 276 11.1 3.5 59.6$ *Based on NSA reserve report as of 12/31/2011 *Company had ~32,000 Williston net acres at time of report 114 196 362 397 625 900 - 100 200 300 400 500 600 700 800 900 1,000 Q1:2011 Q2:2011 Q3:2011 Q4:2011 Q1:2012 Q2:2012E 3.5 90.4 - 10 20 30 40 50 60 70 80 90 100 Proved (Mmboe) Total Unrisked Potential (Mmboe) Project Area Net Acres DSU Spacing Unit Potential Wells per DSU (1) Unrisked Potential Locations NRI NRI Wells Per Well EUR (Mboe) (2) Total Unrisked Potential (Mmboe) Williston Operated 6,900 1,280 7.0 37.7 80% 30.2 475 14.3 Williston Non-Operated 36,600 1,280 7.0 200.2 80% 160.1 475 76.1 Total Potential 90.4 (1) Management estimates based on 4 Middle Bakken wells and 3 Three Forks wells per 1,280 acre spacing unit (2) EUR based on assumptions from third party reserve report.

12 - Month Drilling Program & Multi - Year Inventory ▪ Over the next 12 - months Emerald anticipates spending ~ $ 31 million to drill 5 gross (~ 2 . 5 net) operated wells and ~ 1 . 1 net non - operated wells in the Williston Basin ▪ Emerald has identified a multi - year drilling inventory of ~ 238 total net unrisked locations in the Williston alone ▪ Additional upside from emerging oil plays in the Sandwash Niobrara and Heath Shale Oil ▪ Further option value from Tiger Ridge gas play and DJ Basin Niobrara 9 Emerald Inventory and Drilling Program 1. Total identified drilling locations are calculated using 4 Middle Bakken wells and 3 Three Forks wells per 1,280 acre spacing unit in the Williston Basin Net Acres Net Unrisked Locations (1) Planned Gross Wells Planned Net Wells Drilling Budget ($MM) Williston Operated 6,900 37.7 5.0 2.5 21.3$ Non-Operated 36,600 200.2 30.0 1.1 10.0 Total 43,500 237.9 35.0 3.6 31.3$ 12 -Month Budget ending 6/30/2013
Williston Basin – 43,500 net acres 10

11 Williston Basin Acreage Overview Williston Acreage Overview ▪ ~36,600 net non - operated acres in core of Williston Basin ▪ Williams, McKenzie , Dunn, & Mountrail Counties, ND ▪ Richland , Roosevelt, and Sheridan, Counties, MT ▪ 4.9% average working interest ▪ ~200 net non - operated unrisked locations / 76.1 Mmboe of unrisked potential (1 ) ▪ ~6,800 net acres in Williams, McKenzie, and Richland Counties, ND/MT targeted for conversion to operated acreage Williston Operated Acreage Overview ▪ ~6,900 net acres in Dunn County, ND ▪ 5.4 net operated DSUs with 7 potential wells per DSU ▪ W.I. ranges from 1.5% to 75% in 46 gross DSUs ▪ ~38 net operated unrisked locations / 14.3 Mmboe of unrisked potential (1 ) ▪ ~$21.3 million committed to operated program to drill 2.5 net Bakken wells ▪ ~$10.0 million committed to non - operated program to drill 1.1 net Bakken wells Williston Non - Operated Acreage Overview 12 - month Drilling Program 1. Management estimate. See slide 8 for derivation . Assumed 475 Mboe /well.

12 Williston Acreage Overview – Operated Position Williston Operated Acreage Overview Map (1) Production information taken from the North Dakota Industrial Commission website. # Company Well 24 Hour IP (Boe/d) (1) 30 Day Avg. IP (Boe/d) Stages 1 Hunt Dunn 1-12-1H 573 559 25 2 Hunt Halliday 1-30-31H 543 460 21 3 Hunt Halliday 1-19-18H1 910 855 25 4 Marathon Rhode 14-20H 505 350 n/a 5 Marathon Rosemary Ekelberg 21-26H 668 451 16 6 Hunt Halliday 1-13-24H1 360 351 21 7 Slawson Drone 1-34-27H 1273 499 21 8 Marathon Trampe 44-32H 494 335 16 9 Marathon Repp 11-16H 729 298 14 10 Marathon Person 24-35H 1000 434 30 11 Slawson Turbo 2-21-16H 1156 610 25 12 Burlington Patton 31-1H 2935 572 21 13 Marathon Anderson 44-23H 1442 754 20 14 Oxy Spring Creek 1-20-141-93 (vertical) WOC n/a n/a # Company Well 24 Hour IP (Boe/d) (1) 30 Day Avg. IP (Boe/d) Stages 15 Hunt Cook 1-24-13H 704 781 20 16 Marathon Paulson 34-9 TFH 612 285 20 17 Burlington Goldpoint 41-25 TFH 2149 n/a 30 18 ContinentalClover 1-3H 1258 967 n/a 19 Kodiak Charging Eagle 15-22-15-3H 580 518 29 20 Whiting Mann 21-18 TFH 870 317 30 21 Whiting Marsh 21-16 TFH-R 2688 848 30 # Company Well 24 Hour IP (Boe/d) (1) 30 Day Avg. IP (Boe/d) Stages A Hunt Halliday 1-15-22H 475 645 21 B Hunt Halliday 2-15-22H WOC n/a 24 Selected Bakken Producing Wells Selected Three Forks Producing Wells PF Emerald Active Wells Operating Focus Area

$- $2.0 $4.0 $6.0 $8.0 $10.0 $12.0 $14.0 $16.0 $80 $90 $100 600 MBOE 475 MBOE 350 MBOE Operated Williston Basin Economics 13 Sensitivity Case Assumptions * (1) 1. Assumes $90 oil, $10 differentials, & $8.00 / Boe LOE. * Sensitivity cases, type curves , years to payback, and IRRs are management estimates and are derived from operating experience, offset operator activity, and other published in dus try information. Representative Type Curve / Development Economics* Years to Payback, IRR, & PV - 10 Sensitivity To Oil Price* - 100 200 300 400 500 600 700 800 900 350 MBOE 475 MBOE 600 MBOE Payback: 1.2 yrs. IRR: 87% Payback: 0.9 yrs. IRR: 129% Payback: 0.6 yrs. IRR: 252% Payback: 1.4 yrs. IRR: 69% Payback: 1.1 yrs. IRR: 101% Payback: 0.9 yrs. IRR: 141% Payback: 3.5 yrs. IRR: 21% Payback: 2.5 yrs. IRR: 32% Payback: 1.9 yrs. IRR: 44% High Base Low EUR (Mboe) 600 475 350 PV-10 ($MM) 12.3$ 9.2$ 3.8$ IRR (%) 129% 101% 32% Payback (Years) 0.91 1.06 2.51 Gross Well Cost ($MM) 8.0$ 8.0$ 8.0$ 24H IP (Boe/d) 925 730 500 Initial Decline (% / Year) 90.0% 89.5% 87.0% B-Factor 1.12 1.12 1.12

Emerging Oil Plays 14

15 Emerging Oil Plays - Sandwash Niobrara Sandwash Niobrara Overview ▪ ~ 45,000 net non - operated acres in Sandwash Niobrara ▪ Moffat & Routt Counties, CO & Carbon County, WY ▪ ~ 45% working interest in joint venture ▪ Operators in the area include: Quicksilver, Anadarko, Gulfport, Double Eagle , Cirque and Shell ▪ Various well and completion designs ▪ Substantial competitor drilling programs in 2012 ▪ Quicksilver reported IP 793 boe /d from partially fracced short horizontal well and 162 boe /d from fracced zones in vertical wells ▪ Plan to drill 7 additional wells in 2012 Sandwash Niobrara Overview Double Eagle 2011 well with oil charge throughout the Niobrara Section, being fracture stimulated in 2012 Sierra Madre 12 - 20 Vertical, un - stimulated IP: 549 BOPD EUR: >500 BOPD Quicksilver Grandbouche Horizontal IP: 793 Boepd Hz IP: 162 Boepd Vrt . Plan to drill up to 7 Hz. & Vrt . wells in 2012 Gulfport Vertical un - stimulated IPs 40 - 100 BOPD . Up to 7 wells planned in 2012 Buck Peak Field Nolan 1 well Vertical un - stimulated IP: 480 BOPD EUR: ~1.3 MMBO Shell Vertical wells doing 80 to 100 BOPD. At least 2 Hz. drilled in 2011. Up to 10 wells planned in 2012 North Park Basin EOG, Bonanza Creek, Dakota Drilling Niobrara reported IPs of 223 to 550 BOPD From Vrt . & Hz wells Entek 12 - 1 Well Emerald JV Vertical un - stimulated IP:240 BOPD. Cum. Rate. Entire Niobrara not tested

Emerging Oil Plays – Heath Shale Oil (Central Montana) 16 Heath Shale Oil Map Heath Shale Oil Overview ▪ ~33,500 net acres prospective for Heath shale oil ▪ Musselshell, Petroleum, Garfield, and Fergus Counties, MT ▪ Low cost of entry and 3 - year extensions through 2017 provide optionality as industry de - risks the play ▪ Early signs of resource play ▪ Operators are beginning to “crack the code” – believe results can be replicated ▪ Offset operators include: Cirque/ StatOil , Fidelity, Endeavour Resources, Central Montana Resources, and True Oil ▪ Recent reported well results ▪ Cirque Resources - Recent IP of 271 boe/d on Rock Happy 33 - 3H ▪ Fidelity E&P - Recent IP of 248 boe/d on Schmidt 44 - 27H Cirque Rock Happy 33 - 3H Implied Economics ▪ $4.5 million D&C cost with 12 - stage frac ▪ IP: 271 boe /d ▪ EUR: 241 Mboe (97% crude) ▪ IRR: 41% ▪ NPV: $3.8 million (10% discount) ▪ Payout: 1.7 years ▪ Assumes $90.58/ bbl and $1.15/ mcf of natural gas 1 2

Financial Overview 17

Capitalization Table & 12 - Month Drilling Budget 18 Capitalization Table (1) 1. Capitalization subject to transaction closing adjustments. 12 - Month Drilling Budget ($MM) $0 $5 $10 $15 $20 $25 $30 $35 Jun-12 Jul-12 Aug-12 Sep-12 Oct-12 Nov-12 Dec-12 Jan-13 Feb-13 Mar-13 Apr-13 May-13 Jun-13 Bakken Non Op Bakken Op $10.0 $21.3 Estimated July 1, 2012 Voyager Emerald Adjustments Emerald Oil PF Debt 18$ 19$ -$ 37$ Shareholder's Equity 82$ 27$ (6)$ 103$ Total Capitalization 100$ 46$ (6)$ 140$

Peer Company Valuation - $EV / Bakken Acre ▪ After adjusting for production and net acreage in other project areas, Emerald trades at $ 1,431 per net Williston acre vs. the peer average of $6,188 per net Williston acre 19 Williston Public Peer $EV/Williston Net Acre (1) 1. Enterprise Value of each of the companies listed have been adjusted for production at $80,000 per flowing barrel and net acre age in other areas. For derivation please see slide 21 . $13,346 $6,188 $4,526 $4,118 $2,763 $1,431 $- $2,000 $4,000 $6,000 $8,000 $10,000 $12,000 $14,000 $16,000 KOG Peer Average OAS TPLM NOG PF Emerald

Supporting Information 20
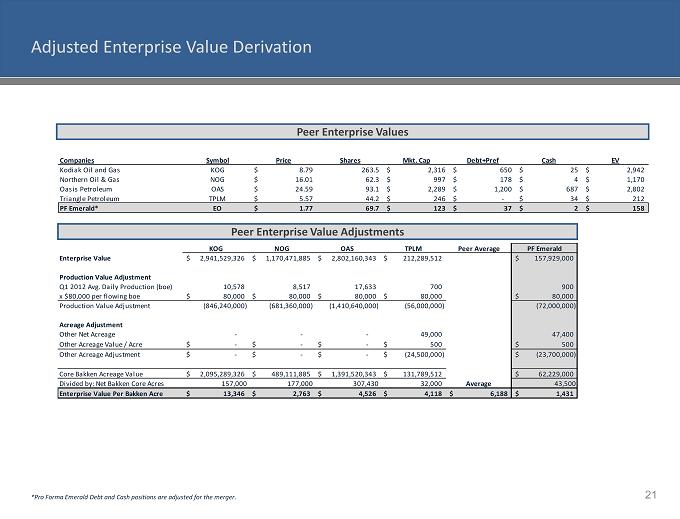
Adjusted Enterprise Value Derivation 21 Peer Enterprise Values Peer Enterprise Value Adjustments *Pro Forma Emerald Debt and Cash positions are adjusted for the merger . 7/9/2012 7/9/2012 Companies Symbol Price Shares Mkt. Cap Debt+Pref Cash EV Kodiak Oil and Gas KOG 8.79$ 263.5 2,316$ 650$ 25$ 2,942$ Northern Oil & Gas NOG 16.01$ 62.3 997$ 178$ 4$ 1,170$ Oasis Petroleum OAS 24.59$ 93.1 2,289$ 1,200$ 687$ 2,802$ Triangle Petroleum TPLM 5.57$ 44.2 246$ -$ 34$ 212$ PF Emerald* EO 1.77$ 69.7 123$ 37$ 2$ 158$ KOG NOG OAS TPLM Peer Average PF Emerald Enterprise Value 2,941,529,326$ 1,170,471,885$ 2,802,160,343$ 212,289,512$ 157,929,000$ Production Value Adjustment Q1 2012 Avg. Daily Production (boe) 10,578 8,517 17,633 700 900 x $80,000 per flowing boe 80,000$ 80,000$ 80,000$ 80,000$ 80,000$ Production Value Adjustment (846,240,000) (681,360,000) (1,410,640,000) (56,000,000) (72,000,000) Acreage Adjustment Other Net Acreage - - - 49,000 47,400 Other Acreage Value / Acre -$ -$ -$ 500$ 500$ Other Acreage Adjustment -$ -$ -$ (24,500,000)$ (23,700,000)$ Core Bakken Acreage Value 2,095,289,326$ 489,111,885$ 1,391,520,343$ 131,789,512$ 62,229,000$ Divided by: Net Bakken Core Acres 157,000 177,000 307,430 32,000 Average 43,500 Enterprise Value Per Bakken Acre 13,346$ 2,763$ 4,526$ 4,118$ 6,188$ 1,431$