Attached files
| file | filename |
|---|---|
| 8-K - 8-K - Western Asset Mortgage Capital Corp | a12-15804_18k.htm |
| EX-99.1 - EX-99.1 - Western Asset Mortgage Capital Corp | a12-15804_1ex99d1.htm |
Exhibit 99.2
|
|
Portfolio Composition Conference Call June 28, 2012 |
|
|
Safe Harbor Statement We make forward-looking statements in this presentation that are subject to risks and uncertainties. These forward-looking statements include information about possible or assumed future results of our business, financial condition, liquidity, results of operations, plans and objectives. When we use the words "believe," "expect," "anticipate," "estimate," "plan," "continue," "intend," "should," "may" or similar expressions, we intend to identify forward-looking statements. Statements regarding the following subjects, among others, may be forward-looking: our business and investment strategy; our projected operating results; our ability to obtain financing arrangements; financing and advance rates for Agency RMBS and our potential target assets; our expected leverage; general volatility of the securities markets in which we invest and the market price of our common stock; our expected investments; interest rate mismatches between Agency RMBS and our potential target assets and our borrowings used to fund such investments; changes in interest rates and the market value of Agency RMBS and our potential target assets; changes in prepayment rates on Agency RMBS and non-Agency RMBS; effects of hedging instruments on Agency RMBS and our potential target assets; rates of default or decreased recovery rates on Agency RMBS and our potential target assets; the degree to which any hedging strategies may or may not protect us from interest rate volatility; impact of and changes in governmental regulations, tax law and rates, accounting guidance and similar matters; our ability to maintain our qualification as a REIT; our ability to maintain our exemption from registration under the Investment Company Act of 1940, as amended; availability of investment opportunities in mortgage-related, real estate-related and other securities; availability of qualified personnel; estimates relating to our ability to make distributions to our stockholders in the future; our understanding of our competition; and market trends in our industry, interest rates, real estate values, the debt securities markets or the general economy. The forward-looking statements in this presentation are based on our beliefs, assumptions and expectations of our future performance, taking into account all information currently available to us. You should not place undue reliance on these forward-looking statements. These beliefs, assumptions and expectations can change as a result of many possible events or factors, not all of which are known to us. Some of these factors are described in our filings with the SEC under the headings "Summary," "Risk factors," "Management's discussion and analysis of financial condition and results of operations" and "Business." If a change occurs, our business, financial condition, liquidity and results of operations may vary materially from those expressed in our forward-looking statements. Any forward-looking statement speaks only as of the date on which it is made. New risks and uncertainties arise over time, and it is not possible for us to predict those events or how they may affect us. Except as required by law, we are not obligated to, and do not intend to, update or revise any forward-looking statements, whether as a result of new information, future events or otherwise. 1 |
|
|
Overview of Western Asset Mortgage Capital Corporation Leading asset management firm with AUM of $643 billion1 Serves individuals and institutional investors on five continents. Capabilities and services are delivered through staff located in 31 cities around the world Proven investment expertise and investment performance (NYSE: LM) WMC is a public REIT formed to take advantage of attractive market opportunities focused on Agency RMBS One of the largest U.S. fixed income asset managers with AUM of $447 billion1 Structured Product AUM of $59 billion1 including agency RMBS of $37 billion 1 Global reach with offices in Pasadena, New York, London, Tokyo, Sao Paulo, Melbourne, Dubai, Singapore and Hong Kong Senior investment team members have worked together for over 15 years Extensive mortgage investing track record Manager New vehicle designed to capture attractive current and long-term investment opportunities in the Agency residential mortgage market (NYSE: WMC) 1 As of 3/31/12. 2 |
|
|
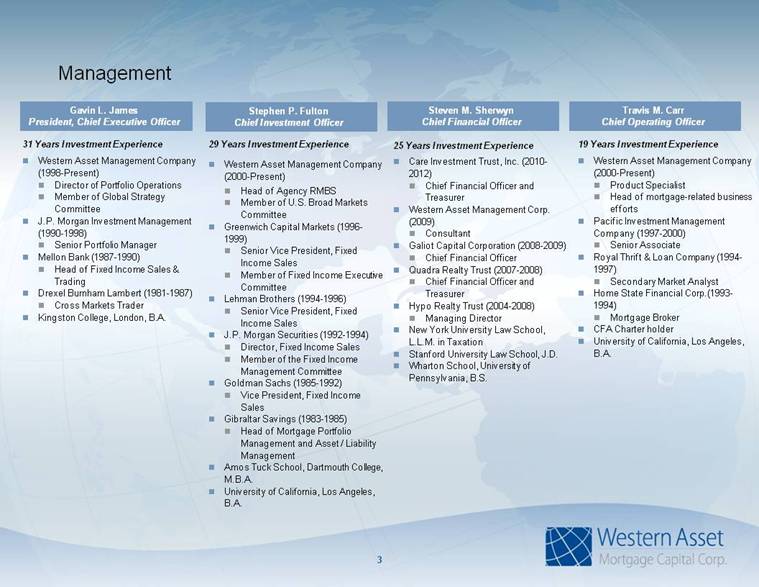
Management 29 Years Investment Experience Western Asset Management Company (2000-Present) Head of Agency RMBS Member of U.S. Broad Markets Committee Greenwich Capital Markets (1996-1999) Senior Vice President, Fixed Income Sales Member of Fixed Income Executive Committee Lehman Brothers (1994-1996) Senior Vice President, Fixed Income Sales J.P. Morgan Securities (1992-1994) Director, Fixed Income Sales Member of the Fixed Income Management Committee Goldman Sachs (1985-1992) Vice President, Fixed Income Sales Gibraltar Savings (1983-1985) Head of Mortgage Portfolio Management and Asset / Liability Management Amos Tuck School, Dartmouth College, M.B.A. University of California, Los Angeles, B.A. Gavin L. James President, Chief Executive Officer Stephen P. Fulton Chief Investment Officer 3 Travis M. Carr Chief Operating Officer 19 Years Investment Experience Western Asset Management Company (2000-Present) Product Specialist Head of mortgage-related business efforts Pacific Investment Management Company (1997-2000) Senior Associate Royal Thrift & Loan Company (1994-1997) Secondary Market Analyst Home State Financial Corp.(1993-1994) Mortgage Broker CFA Charter holder University of California, Los Angeles, B.A. 31 Years Investment Experience Western Asset Management Company (1998-Present) Director of Portfolio Operations Member of Global Strategy Committee J.P. Morgan Investment Management (1990-1998) Senior Portfolio Manager Mellon Bank (1987-1990) Head of Fixed Income Sales & Trading Drexel Burnham Lambert (1981-1987) Cross Markets Trader Kingston College, London, B.A. Steven M. Sherwyn Chief Financial Officer 25 Years Investment Experience Care Investment Trust, Inc. (2010-2012) Chief Financial Officer and Treasurer Western Asset Management Corp. (2009) Consultant Galiot Capital Corporation (2008-2009) Chief Financial Officer Quadra Realty Trust (2007-2008) Chief Financial Officer and Treasurer Hypo Realty Trust (2004-2008) Managing Director New York University Law School, L.L.M. in Taxation Stanford University Law School, J.D. Wharton School, University of Pennsylvania, B.S. |
|
|
Western Asset’s REIT Team – Deep & Proven Additional Structured Product Resources 10 members* 23 years 4 5 members* 18 years 16 members* 12 years 11 members* 23 years 4 members* 11 years 35+ Years of MBS Experience and Innovation 1974 First investment in Agency RMBS 1991 Began investing in CMBS 1991 Invested in Resolution Trust Corporation (RTC) programs 2004 Created Super Senior Option ARM 1970 1985 1990 1995 2000 2005 2010 1987 Began investing in Non-Agency RMBS 1990 Started investing in ABS Stephen P. Fulton (29 yrs) Chief Investment Officer Investment Oversight Committee Liquidity Structured Products Agency MBS Derivatives 2009 Initial closing of PPIP Includes senior members of the investment manager team * represents team members / years of average experience 2012 WMC Launched Deep Global Infrastructure 904 staff across all functions 127 investment professionals Future opportunities |
|
|
Portfolio composition Leverage ratio Hedging strategy Disciplined Investment Process Leverages WAMCO’s Global Strength 5 Determine duration & convexity cost by sector / coupon Prepayment Modeling Empirical Price Implied Agency Mortgage universe MBS with positive carry and probability of error within tolerance MBS with positive carry after hedging duration and convexity Estimate probability of error Prepayments Defaults Duration Convexity Apply Western Asset’s view of interest rates, yield curve shape and volatility Identify collateral with specific convexity characteristics |
|
|
6 Finding Value in the Current Market We are targeting pools with the following characteristics that lead to lower than expected CPRs: Lower loan balance loans Investor only Low FICO High Spread at Origination (SATO) MHA/HARP origination |
|
|
Key Considerations: Origination Channel Third-party origination (“TPO”) = loans originated by brokers and correspondents, rather than retail Servicing on TPO is not retained and loan officer compensation is volume-dependent Thus, TPO loans ramp up more quickly than retail when “in the money” 79% of loans in passthrough holdings were originated through retail channel 7 TPO vs. Retail Prepayments 0 10 20 30 40 50 1 3 5 7 9 11 13 15 17 19 21 23 Weighted Average Loan Age CPR Retail refi TPO refi Source: Barclays, Freddie Mac Loan Level Data Gold 4.5%, October 2011 to January 2012 prepayment reports Prepayments by Channel, Mid-Tier and Smaller Lenders 0 5 10 15 20 25 30 1-Month 3-Months 6-Months 12-Months CPR 100 > 80 > 60 > 40 > 20 > 0 0 Source: Deutsche Bank, Freddie Mac Loan Level Data Gold 4% originated in 2011. Excludes loans originated by Chase, Wells, Citi and Bank of America |
|
|
Key Considerations: Spread at Origination (SATO) Spread at origination equals difference between borrower rate and prevailing rate Proxies for intangible borrower characteristics not measured by FICO, LTV and loan size, e.g., accuracy of the appraisal, nature of income, amount of liquid assets, documentation and undisclosed liabilities Refinancing response in rally is more muted due to credit risk premium, although effect diminishes in economic recovery SATO on seasoned 30-year 7% passthroughs is 133 8 S-Curve by SATO 0 5 10 15 20 25 30 35 -50 -25 0 25 50 75 100 125 150 Refi Incentive 1-Month CPR 0<SATO<=25 25<SATO<=50 50<SATO<=75 75<SATO<=100 SATO>100 Source: Barclays, Freddie Mac Loan Level Data Excludes all MHA loans (refinance loans with >80 OLTV) and all loans with original loan size <150,000. Prepayment vs. SATO, Post-HARP 30-Year 4.5s |
|
|
9 Portfolio Composition as of June 19, 2012 Sector Coupon CurrentFace Cost Description30-Year Fixed Rate 3.0% $160.6 $163.6 New Production Loans3.5% $413.6 $436.6 Lower Loan Balance3.5% $234.7 $245.2 New Production Loans3.5% $37.7 $39.7 HARP4.0% $278.3 $299.3 Lower Loan Balance4.0% $123.9 $133.3 Low FICO4.0% $114.3 $122.6 Investor Loans7.0% $79.4 $92.3 Seasoned Loans20-Year Fixed Rate 3.5% $186.9 $198.1 Lower Loan Balance4.0% $25.0 $27.0 Lower Loan BalanceTotal Specified Pool $1,654.4 $1,757.7CMOIO/IIO 4.4% $553.1 $87.3Fixed Rate 6.5% $65.0 $76.0Total CMO $618.1 $163.3Total Portfolio $2,272.5 $1,921.0 |
|
|
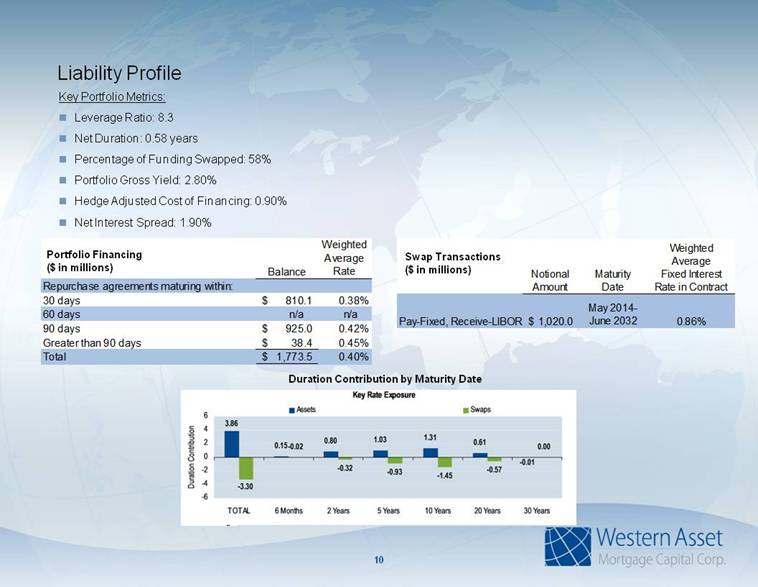
10 Duration Contribution by maturity date Key Portfolio Metrics: Leverage Ratio: 8.3 Net Duration: 0.58 years Percentage of Funding Swapped: 58% Portfolio Gross Yield: 2.80% Hedge Adjusted Cost of Financing: 0.90% Net Interest Spread: 1.90% Duration Contribution by Maturity Date Portfolio Financing ($ in millions) Swap Transactions ($ in millions) Liability Profile Balance Weighted Average Rate Repurchase agreements maturing within: 30 days 810.1 $ 0.38% 60 days n/a n/a 90 days 925.0 $ 0.42% Greater than 90 days 38.4 $ 0.45% Total 1,773.5 $ 0.40% Notional Amount Maturity Date Weighted Average Fixed Interest Rate in Contract Pay-Fixed, Receive-LIBOR 1,020.0 $ May 2014- June 2032 0.86% |
|
|
Source: Bloomberg, Western Asset. Hedging Is As Important As Security Selection There are several ways to hedge against changes in long-term rates 11 Hedging the wrong instrument can be more expensive than anticipated Economics of a five year swap if rates remain unchanged for twelve months |
|
|
12 Market Observations and Outlook Economic growth will remain anemic Housing sector weakness indicates long-lived yield curve opportunity Federal Reserve is on watch Primary mortgage rates are low, but credit is limited Prepayment landscape is shifting |