Attached files
| file | filename |
|---|---|
| EX-23.1 - CONSENT OF INDEPENDENT REGISTERED PUBLIC ACCOUNTING FIRM - CKE Inc. | d350029dex231.htm |
Table of Contents
As filed with the Securities and Exchange Commission on July 3, 2012
Registration No. 333-181504
UNITED STATES
SECURITIES AND EXCHANGE COMMISSION
WASHINGTON, D.C. 20549
AMENDMENT NO. 1
TO
FORM S-1
REGISTRATION STATEMENT
UNDER
THE SECURITIES ACT OF 1933
CKE INC.
(Exact name of registrant as specified in its charter)
| Delaware | 5812 | 27-3026224 | ||
| (State or Other Jurisdiction of Incorporation or Organization) |
(Primary Standard Industrial Classification Code Number) |
(IRS Employer Identification No.) |
6307 Carpinteria Ave., Ste A.
Carpinteria, California 93013
(805) 745-7500
(Address, including zip code, and telephone number, including area code, of registrant’s principal executive offices)
Andrew F. Puzder
Chief Executive Officer
CKE Inc.
6307 Carpinteria Ave., Ste A.
Carpinteria, California 93013
(805) 745-7500
(Name, address, including zip code, and telephone number, including area code, of agent for service)
Copies to:
| Howard A. Kenny Morgan, Lewis & Bockius LLP 101 Park Avenue New York, New York 10178 (212) 309-6000 |
Charles A. Seigel III Senior Vice President and Assistant Secretary CKE Inc. 6307 Carpinteria Ave., Ste. A Carpinteria, California 93013 (805) 745-7500 |
Steven B. Stokdyk Latham & Watkins LLP 355 South Grand Avenue Los Angeles, California 90071 (213) 485-1234 |
Approximate date of commencement of proposed sale to the public: As soon as practicable after the effective date of this registration statement.
If any of the securities being registered on this Form are to be offered on a delayed or continuous basis pursuant to Rule 415 under the Securities Act of 1933, check the following box. ¨
If this Form is filed to register additional securities for an offering pursuant to Rule 462(b) under the Securities Act, check the following box and list the Securities Act registration statement number of the earlier effective registration statement for the same offering. ¨
If this Form is a post-effective amendment filed pursuant to Rule 462(c) under the Securities Act, check the following box and list the Securities Act registration statement number of the earlier effective registration statement for the same offering. ¨
If this Form is a post-effective amendment filed pursuant to Rule 462(d) under the Securities Act, check the following box and list the Securities Act registration statement number of the earlier effective registration statement for the same offering. ¨
Indicate by check mark whether the registrant is a large accelerated filer, an accelerated filer, a non-accelerated filer, or a smaller reporting company. See the definitions of “large accelerated filer,” “accelerated filer” and “smaller reporting company” in Rule 12b-2 of the Exchange Act.
| Large accelerated filer |
¨ | Accelerated filer | ¨ | |||
| Non-accelerated filer |
x (Do not check if a smaller reporting company) | Smaller reporting company | ¨ |
The registrant hereby amends this registration statement on such date or dates as may be necessary to delay its effective date until the registrant shall file a further amendment which specifically states that this registration statement shall thereafter become effective in accordance with Section 8(a) of the Securities Act of 1933, or until the registration statement shall become effective on such date as the Commission, acting pursuant to said Section 8(a), may determine.
Table of Contents
The information in this preliminary prospectus is not complete and may be changed. We may not sell these securities until the registration statement filed with the Securities and Exchange Commission is effective. This preliminary prospectus is not an offer to sell these securities, and we are not soliciting an offer to buy these securities, in any jurisdiction where the offer or sale is not permitted.
Subject to Completion
Preliminary Prospectus dated July 3, 2012
PROSPECTUS
Shares
CKE INC.
Common Stock
This is our initial public offering. We are selling of the shares being offered hereby. The selling stockholder identified in this prospectus is selling an additional shares. We will not receive any of the proceeds from the sale of the shares being sold by the selling stockholder.
We expect the public offering price to be between $ and $ per share. Currently, no public market exists for our common stock. We intend to apply to list our common stock on the New York Stock Exchange under the symbol “CK.” Following this offering, we will remain a “controlled company” as defined under the New York Stock Exchange listing rules, and Apollo Management, L.P. and its affiliates will beneficially own % of our shares of outstanding common stock, assuming the underwriters do not exercise their option to purchase up to additional shares.
Investing in our common stock involves risks that are described in the “Risk Factors” section beginning on page 19 of this prospectus.
| Per Share |
Total | |||||||
| Public offering price |
$ | $ | ||||||
| Underwriting discounts and commissions |
$ | $ | ||||||
| Proceeds, before expenses, to CKE Inc. |
$ | $ | ||||||
| Proceeds, before expenses, to the selling stockholder |
$ | $ | ||||||
The underwriters also have an option to purchase up to an additional shares from us and the selling stockholder at the initial public offering price less the underwriting discount.
The shares will be ready for delivery on or about , 2012.
Neither the Securities and Exchange Commission nor any state securities commission has approved or disapproved of these securities or determined if this prospectus is truthful or complete. Any representation to the contrary is a criminal offense.
| Morgan Stanley | Citigroup | Goldman, Sachs & Co. |
| Barclays | Credit Suisse | RBC Capital Markets |
Apollo Global Securities, LLC
The date of this prospectus is , 2012.
Table of Contents
| Page | ||||
| ii | ||||
| ii | ||||
| ii | ||||
| 1 | ||||
| 19 | ||||
| 35 | ||||
| 37 | ||||
| 37 | ||||
| 38 | ||||
| 40 | ||||
| 42 | ||||
| MANAGEMENT’S DISCUSSION AND ANALYSIS OF FINANCIAL CONDITION AND RESULTS OF OPERATIONS |
46 | |||
| 96 | ||||
| 113 | ||||
| 120 | ||||
| 143 | ||||
| 145 | ||||
| 148 | ||||
| 152 | ||||
| 156 | ||||
| MATERIAL UNITED STATES FEDERAL INCOME TAX CONSIDERATIONS FOR NON-U.S. HOLDERS OF COMMON STOCK |
158 | |||
| 162 | ||||
| 167 | ||||
| 167 | ||||
| 167 | ||||
| F-1 | ||||
Dealer Prospectus Delivery Obligations
Until , 2012 (25 days after the date of this prospectus), all dealers that effect transactions in these securities, whether or not participating in this offering, may be required to deliver a prospectus. This is in addition to the dealers’ obligation to deliver a prospectus when acting as an underwriter and with respect to their unsold allotments or subscriptions.
-i-
Table of Contents
We have not authorized anyone to provide any information other than that contained in this prospectus or in any free writing prospectus prepared by or on behalf of us or to which we have referred you. We take no responsibility for, and can provide no assurance as to the reliability of, any other information that others may give you. We are not making an offer to sell these securities in any jurisdiction where the offer or sale is not permitted. You should assume that the information appearing in this prospectus is accurate only as of the date on the front cover of this prospectus. Our business, financial condition, results of operations and prospects may have changed since that date.
We have obtained certain industry and market share data from third-party sources, such as Sandelman Quick-Track reports, QSR Magazine and other industry publications that we believe are reliable. In many cases, however, we have made statements in this prospectus regarding our industry and our position in the industry based on estimates made from our experience in the industry and our own investigation of market conditions. While we believe these estimates to be accurate as of the date of this prospectus, we cannot guarantee the accuracy or completeness of the industry or market data included in this prospectus or the estimates and beliefs based on that data because of the method by which we obtained some of the data for our estimates or because this information cannot always be verified with complete certainty due to the limits on the availability and reliability of raw data, the voluntary nature of the data gathering process and other limitations and uncertainties.
TRADEMARKS, SERVICE MARKS AND TRADENAMES
We own or have rights to trademarks, service marks or tradenames that we use in connection with the operation of our business, including our corporate names, brands, logos and product names. Other trademarks, service marks and tradenames appearing in this prospectus are the property of their respective owners. The trademarks we own include CKE Restaurants®, Carl’s Jr.® and Hardee’s® along with the names of various products offered at our restaurants. Solely for convenience, some of the trademarks, service marks and tradenames referred to in this prospectus are listed without the ® and TM symbols, but we assert, to the fullest extent under applicable law, our rights to our trademarks, service marks and tradenames.
To supplement our financial information presented in accordance with U.S. generally accepted accounting principles (“U.S. GAAP”), we use additional measures to clarify and enhance understanding of past performance and prospects for the future.
Adjusted EBITDA, Adjusted EBITDA margin, company-operated restaurant-level adjusted EBITDA, company-operated restaurant-level adjusted EBITDA margin, and franchise restaurant adjusted EBITDA (each as defined below) (“Non-GAAP Measures”), as presented in this prospectus, are supplemental measures of our performance that are not required by, or presented in accordance with, U.S. GAAP. They are not measurements of our financial performance under U.S. GAAP and should not be considered as alternatives to net income or any other performance measures derived in accordance with U.S. GAAP or alternatives to net cash provided by operating activities as a measure of our liquidity.
“Adjusted EBITDA” represents net income (loss), adjusted to exclude income taxes, interest income and expense, asset impairments, facility action charges, depreciation and amortization, management fees, the effects of acquisition accounting adjustments, and certain non-cash and other items. Adjusted EBITDA margin is defined as Adjusted EBITDA divided by total revenue. See Note 5 under “Summary—Summary Historical and Pro Forma Financial and Other Data.”
-ii-
Table of Contents
We define company-operated restaurant-level adjusted EBITDA as company-operated restaurants revenue (i) less restaurant operating costs, excluding depreciation and amortization expense, and (ii) less advertising expense. Restaurant operating costs exclude advertising costs, general and administrative expenses and facility action charges. Company-operated restaurant-level adjusted EBITDA margin is defined as company-operated restaurant-level adjusted EBITDA divided by company-operated restaurants revenue. We define franchise restaurant adjusted EBITDA as franchised restaurants and other revenue less franchised restaurants and other expense, plus depreciation and amortization expense. See “Management’s Discussion and Analysis of Financial Condition and Results of Operations—Presentation of Non-GAAP Measures.”
We believe the Non-GAAP Measures provide investors with helpful information with respect to our operating performance and cash flows. In addition, our calculation of Adjusted EBITDA is consistent with the equivalent measurement in the covenants contained in agreements respecting certain of our indebtedness. See “Description of Indebtedness.” Our Non-GAAP Measures may not be comparable to those of other companies.
In addition, in evaluating these Non-GAAP Measures, you should be aware that in the future we will incur expenses such as those we have excluded in calculating these measures. Our presentation of these measures should not be construed as an inference that our future results will be unaffected by any unusual or nonrecurring items.
iii
Table of Contents
The following summary highlights information contained elsewhere in this prospectus. It does not contain all the information that may be important to you in making an investment decision and should be read together with the more detailed information and consolidated financial statements included elsewhere in this prospectus. You should read the entire prospectus, including the “Risk Factors” section and our consolidated financial statements and notes to those statements, before making an investment decision.
Unless otherwise noted, “we,” “us,” “our” and the “Company” mean, for periods after the Merger (as defined below), CKE Inc. and its consolidated subsidiaries, including CKE Restaurants, Inc. (“CKE Restaurants®”), and for the periods prior to the Merger, CKE Restaurants and its consolidated subsidiaries. “CKE” means CKE Inc. but not its subsidiaries.
We operate on a retail accounting calendar. Our fiscal year ends on the last Monday in January and typically has 13 four-week accounting periods. For clarity of presentation, we generally label all fiscal year ends as if the fiscal year ended January 31 (e.g., the fiscal year ended January 30, 2012 is referred to as fiscal 2012 or the fiscal year ended January 31, 2012). References made to our fiscal year ended January 31, 2011, or fiscal 2011, refer to the Predecessor twenty-four weeks ended July 12, 2010 and the Successor twenty-nine weeks ended January 31, 2011. The first quarter of our fiscal year has four periods, or 16 weeks. All other quarters generally have three periods, or 12 weeks. Our fiscal year ended January 31, 2011 contained 53 weeks, with the one additional week included in our fourth quarter. The first quarter of our fiscal 2013 and fiscal 2012 ended May 21, 2012 and May 23, 2011, respectively.
Unless otherwise indicated, the information contained in this prospectus assumes that (i) the underwriters’ option to purchase up to additional shares will not be exercised, (ii) each share of common stock outstanding immediately prior to the -for-one stock split will have been split into shares of common stock and (iii) the number of our authorized shares of capital stock will have been increased to shares of common stock and shares of preferred stock pursuant to our amended and restated certificate of incorporation.
Home of the Big, Juicy Burger
We are one of the world’s largest operators and franchisors of quick service restaurants (“QSR”) with 3,263 owned or franchised locations operating in 42 states and 25 foreign countries primarily under our Carl’s Jr.® and Hardee’s® brands. We believe we offer innovative, premium products that we develop for a target demographic we refer to as “young, hungry guys” but that we believe also appeal to a broader customer base of individuals who aspire to be youthful. Our target demographic of 18 to 34 year old males who enjoy premium food at a reasonable price makes up a large portion of the global QSR market, which is currently estimated to generate $225 billion in sales annually ($141 billion in the United States). Specifically, younger males account for almost one quarter of all QSR visits and have the highest frequency of any demographic group at almost 17 visits per month. We believe our focus on this customer type is anchored by our menu of high quality, premium products, and enhanced through edgy, breakthrough advertising. According to QSR Magazine (Top 50 Rankings, March 7, 2012), we are the fifth largest hamburger QSR operator globally. We have a large and rapidly growing international presence (consisting of 441 restaurants in 25 foreign countries, an 85% increase in the number of international restaurants since the end of fiscal 2007) and believe there are significant opportunities to continue to grow our brands in various markets around the world.
1
Table of Contents
As of May 21, 2012, the end of our first quarter of fiscal 2013, our system-wide restaurant portfolio consisted of:
| Carl’s Jr. | Hardee’s | Other | Total | |||||||||||||
| Company-operated |
424 | 468 | — | 892 | ||||||||||||
| Domestic franchised |
694 | 1,227 | 9 | 1,930 | ||||||||||||
| International franchised |
204 | 237 | — | 441 | ||||||||||||
|
|
|
|
|
|
|
|
|
|||||||||
| Total |
1,322 | 1,932 | 9 | 3,263 | ||||||||||||
|
|
|
|
|
|
|
|
|
|||||||||
Our primary brands, Carl’s Jr. and Hardee’s, both have a rich heritage dating back over 50 years, when Carl Karcher opened the first Carl’s Jr. restaurant in 1956 and Wilbur Hardee opened the first Hardee’s restaurant in 1960. We believe Carl’s Jr. and Hardee’s are both well recognized for their high-quality product offerings. Sandelman Quick Track reports for the first calendar quarter of 2012 ranked each of our brands #1 or #2 in their markets among national or regional hamburger QSRs in taste or flavor of food, quality of ingredients and temperature of food. Although we operate under two brands, the management, menus, operations, marketing campaigns and logos of our two primary brands are substantially similar. We are evolving into a national chain operating under two banners because each has long-standing brand equity in its respective markets. The brands often market identical new products with identical advertising campaigns and use national cable to promote these products in ads that identify both brands.
Our business objective is to continue growing our average unit volumes (“AUV”), calculated as described below, and expanding both Carl’s Jr. and Hardee’s in new and existing markets throughout the world by leveraging what we believe to be our unique brand positioning, high-quality product offerings, compelling restaurant economics and established global footprint. Our business strategy focuses on the growth of our franchise restaurant base, which provides a more stable, capital efficient income stream than company-operated restaurants. Franchise royalties are based on a percentage of our franchisees’ sales, and are thus not susceptible to fluctuations in restaurant operating costs. In addition, franchisees are responsible for making capital investments, enabling us to accelerate the growth of our restaurant system without incremental capital expenditures. From the end of fiscal 2007 through May 21, 2012, we have grown our franchise restaurants from 1,904 units (64% of total) to 2,371 units (73% of total), and we have grown our international restaurants by 85% from 238 units (8% of total) to 441 units (14% of total) over the same period.
For fiscal 2012 and the quarter ended May 21, 2012, we generated total revenue of $1.3 billion and $412.3 million, Adjusted EBITDA of $165.9 million and $61.6 million and a net (loss) income of $(19.3) million and $6.7 million, respectively. See Note 5 under “—Summary Historical and Pro Forma Financial and Other Data” for an explanation of Adjusted EBITDA and a reconciliation to net (loss) income.
What We Have Accomplished
Guided by our revitalization plan and our management team, our recent accomplishments include:
| • | Remodeled or developed over 90% of our company-operated restaurants since the end of fiscal 2005; |
| • | Achieved a 10 percentage point improvement in customer satisfaction scores across our concepts since the end of fiscal 2007; |
| • | Opened over 600 new restaurants system-wide since the end of fiscal 2007; |
| • | Signed over 875 franchise development commitments with a broad group of franchisees in the United States and internationally with over 600 of these commitments signed in the last three years; |
| • | Increased franchised restaurants from 64% of total restaurants at the end of fiscal 2007 to 73% as of May 21, 2012; |
2
Table of Contents
| • | Increased our international restaurant base by 85% from 238 restaurants in 13 foreign countries at the end of fiscal 2007 to 441 restaurants in 25 foreign countries as of May 21, 2012; |
| • | Achieved positive blended same-store sales (i.e., blended for Carl’s Jr. and Hardee’s company-operated restaurants) for the most recent seven consecutive quarters, including an increase of 3.5% in blended same-store sales for fiscal 2012 and an increase of 2.6% for the first quarter of fiscal 2013. Prior to the economic downturn, we posted six consecutive fiscal years of blended same-store sales growth from fiscal 2004 to fiscal 2009; and |
| • | Exhibited a long track-record of AUV growth at company-operated restaurants. As shown in the table below, the blended AUV at company-operated restaurants has grown from $832,000 in fiscal 2001 to $1,257,000 in fiscal 2012, an increase of $425,000, and over the same period we have increased our blended AUV in every year except fiscal 2010. |
Blended Company-Operated Average Unit Volume
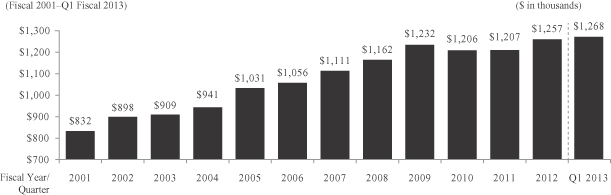
We calculate AUV for each of Carl’s Jr. and Hardee’s by dividing the aggregate revenues of all of the brand’s company-operated restaurants during a fiscal year by the number of the brand’s company-operated restaurants open during that period. Blended AUV is calculated in the same manner using the aggregate revenue and number of company-operated restaurants of both brands on a combined basis. Blended AUV is calculated on a trailing-52 week basis.
3
Table of Contents
One Powerful Concept, Two Global Brands
We operate one global restaurant platform. The management, menus, operations, marketing campaigns and logos of our two primary brands are substantially similar. However, we have chosen to capitalize on the strong heritage and loyal customer base of Carl’s Jr. and Hardee’s by maintaining both brands. The brands often market identical new products with identical advertising campaigns and use national cable to promote these products in advertisements that identify both brands.

|
Carl’s Jr. has a total of 1,322 company-operated and franchised restaurants located in 14 states and 14 foreign countries as of May 21, 2012. Domestic Carl’s Jr. restaurants are predominantly located in the Western United States, with a growing presence in Texas. International Carl’s Jr. restaurants are located primarily in Mexico, with a growing presence in the rest of Latin America, Russia and Asia. Carl’s Jr. focuses on selling its signature products, such as the Western Bacon Cheeseburger® and a full line of 100% Black Angus Beef Six Dollar Burgers®, and on developing what we believe to be innovative new products, including the Steakhouse Six Dollar Burger®, Hand-Breaded Chicken Tenders™ and its line of Charbroiled Turkey Burgers. As of May 21, 2012, 549 of the domestic Carl’s Jr. restaurants were dual-branded with our Green Burrito® concept, which offers Mexican-inspired products, such as burritos, tacos and quesadillas, from a separate Green Burrito menu. At dual-branded restaurants, customers can order both Carl’s Jr. and Green Burrito product offerings at the same counter. While the target market is substantially similar, the dual-branding broadens the restaurant’s product offering. In addition, there are nine stand-alone franchised Green Burrito restaurants. | |
| We believe, based on our internal market research, that Carl’s Jr. is widely regarded by our customers as the premium choice for lunch and dinner in the QSR industry, with approximately 85% of fiscal 2012 company-operated restaurants revenue coming from the lunch and dinner day parts. Recently, Carl’s Jr. expanded its breakfast offering through the launch of Hardee’s breakfast menu featuring its Made From Scratch Biscuits™. We believe that substantial opportunity exists to further build the brand by capturing greater market share during the breakfast day part at our existing restaurants through offering Hardee’s breakfast menu. We initially tested the biscuit rollout in select markets in fiscal 2011 and then launched a larger scale rollout of these products in the second half of fiscal 2012. As of May 21, 2012, approximately 49% of our domestic restaurants offered this breakfast product line, including 72% of our company-operated locations. The launch of Hardee’s breakfast menu, featuring Made From Scratch Biscuits, at Carl’s Jr. is another meaningful step in nationalizing our brands, and we expect the rollout to be essentially complete by the end of the first quarter of fiscal 2014. | ||
| As of May 21, 2012, approximately 68% of Carl’s Jr. restaurants were franchised and the remaining 32% were company-operated. Approximately 15% of Carl’s Jr. restaurants were located outside of the U.S. as of May 21, 2012, compared to 8% at the end of fiscal 2007. We expect the Carl’s Jr. brand to be the primary driver of our international expansion in Asia, Latin America and Russia over the next several years. | ||

|
Hardee’s has a total of 1,932 company-operated and franchised restaurants located in 30 states and 11 foreign countries as of May 21, 2012. Domestic Hardee’s restaurants are located predominantly in the Southeastern and Midwestern United States, with a growing international presence in the Middle East and Central Asia. Hardee’s | |
4
Table of Contents
| primarily focuses on selling its signature products, such as its line of 100% Black Angus Beef Thickburgers® and Made From Scratch Biscuits and on developing what we believe to be innovative new products, such as the Steakhouse Thickburger®, Hand-Breaded Chicken Tenders, the Monster Biscuit® and its line of Charbroiled Turkey Burgers.
We believe, based on our internal market research, that Hardee’s is widely regarded by our customers as the best choice for breakfast in the QSR industry, with approximately 48% of company-operated restaurants revenue in fiscal 2012 and the first quarter of fiscal 2013 coming from breakfast. We also believe that substantial opportunity exists to further build the brand by capturing greater market share during the lunch and dinner day parts at our existing restaurants through offering new, high-quality products in conjunction with Carl’s Jr. and expanding the number of dual-branded locations with our Red Burrito® Mexican-inspired concept. As of May 21, 2012, 326 of the domestic Hardee’s restaurants were dual-branded with Red Burrito. As at our Carl’s Jr. restaurants, dual-branding offers Hardee’s customers broader menu choices from a separate Red Burrito menu. | ||
| As of May 21, 2012, approximately 76% of Hardee’s restaurants were franchised and the remaining 24% were company-operated. From the end of fiscal 2007 to May 21, 2012, Hardee’s international restaurants grew from 8% to 12% of the system primarily as a result of continued expansion in the Middle East and Central Asia, where we expect growth. | ||
Why We Are “The Star”
We attribute our success in the QSR industry to the following strengths:
Leader in the Premium Segment of the QSR Industry with Two Strong, Global Brands
We believe our two primary brands, Carl’s Jr. and Hardee’s, are uniquely positioned to appeal to the target audience we refer to as “young, hungry guys” and those who aspire to be youthful. We believe that our intense focus on our target audience affords us a competitive advantage, as many competitors in the QSR industry focus on the family market, which we view as more competitive and over saturated. We believe we are known for high-quality, great-tasting products that serve the premium segment of the QSR industry. Sandelman Quick-Track reports for the first calendar quarter of 2012 ranked each of our brands #1 or #2 in their markets among national or regional hamburger QSRs in taste or flavor of food, quality of ingredients and temperature of food. We have a strong market position in all day parts with Hardee’s dominant at breakfast and both Carl’s Jr. and Hardee’s having strong lunch and dinner offerings. Hardee’s breakfast offerings are differentiated by its signature Made From Scratch Biscuits, which we believe have helped make the brand known as the best choice for breakfast in the QSR industry. We recently introduced Hardee’s breakfast menu and its Made From Scratch Biscuits at Carl’s Jr. In markets where biscuits were introduced at least one year ago, breakfast sales have increased from 12% of total sales in fiscal 2010 prior to the rollout to 18% of total sales in fiscal 2012 and in the first quarter of fiscal 2013. We believe our menu innovation, focus on our targeted audience and emphasis on quality and value have allowed us to maintain our differentiated, premium position and avoid extensive price discounting. We believe that our unique, edgy advertising campaigns also help build our brands. Our advertising is generally intended to create buzz around our promotional product offerings as well as emphasize the quality and taste of our premium menu items.
5
Table of Contents
Established and Rapidly Growing International Presence
Since establishing our first international restaurant in 1978, our international strategy has been focused on countries where we believe there are significant opportunities to grow our brands rapidly. We have been particularly focused on growing our international presence since our CEO took the leadership position in fiscal 2001. We had 441 restaurants franchised in 25 foreign countries as of May 21, 2012, which compares to 238 franchised restaurants in 13 foreign countries at the end of fiscal 2007. During fiscal 2012, our international franchisees opened a total of 72 restaurants outside of the United States, eclipsing our domestic development totals for the first time in our history. This included the opening of locations in seven countries in which we had not previously operated. In the first quarter of fiscal 2013, our international franchisees opened a total of 20 restaurants outside of the United States. We expect this trend to continue and the number of international restaurant openings to continue to grow. Currently, we have franchise development commitments to build over 500 new international restaurants. As of May 21, 2012, we had Carl’s Jr. franchised restaurants in American Samoa, Canada, China, Costa Rica, Ecuador, Indonesia, Malaysia, Mexico, New Zealand, Panama, Russia, Singapore, Turkey and Vietnam and Hardee’s franchised restaurants in Bahrain, Egypt, Jordan, Kazakhstan, Kuwait, Lebanon, Oman, Pakistan, Qatar, Saudi Arabia and the United Arab Emirates.
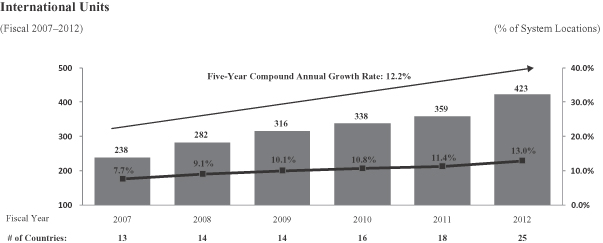
As of May 21, 2012, there were 441 international franchise restaurants, representing 13.5% of our total restaurants, in 25 countries.
Attractive Restaurant-Level Economics Drives Franchisee Development
We believe that the economic returns from opening new restaurants offer franchisees a compelling investment opportunity. Over the past several years, we have redesigned our domestic restaurant prototypes at both Carl’s Jr. and Hardee’s to reduce the initial building construction costs for new restaurants while maintaining the expected performance from our new company-operated restaurants. The cost to develop a new Carl’s Jr. or Hardee’s restaurant, excluding land value, generally ranges from $950,000 to $1,300,000. We believe that our franchisees can achieve attractive returns from new restaurant development as demonstrated by our signing of over 600 new franchise development commitments during the last three years. In addition, our franchisees have opened a total of 273 new restaurants since the end of fiscal 2009, including 113 openings in fiscal 2012, representing the highest number of openings over the past decade, and 33 openings in the first quarter of fiscal 2013. These franchise restaurant openings in fiscal 2012 and the first quarter of fiscal 2013 represented 96% and 94% of the total new restaurant openings for the year and quarter, respectively, and further
6
Table of Contents
increased the percentage of our system that is franchised. We believe that the performance and overall health of our franchise network continues to be strong and is evidenced by our collection of greater than 99% of our royalties during fiscal 2012.
Attractive Free Cash Flow Generation
We believe our company-operated restaurant-level adjusted EBITDA margin, stable and growing franchise base and our nearly completed capital program result in attractive free cash flow (operating cash flow minus capital expenditures) generation. Over the past seven years, we have focused on improving the customer experience through the remodeling of our company-operated restaurant base. We have also focused on new franchise restaurant openings and a refranchising program. With over 2,370 franchised restaurants domestically and internationally, we have a franchisee network that generated approximately $94 million of royalties from franchises in fiscal 2012 and approximately $31 million in the first quarter of fiscal 2013. We believe the shift from a company-operated model to a predominantly franchise model allows for a more stable business since we are less impacted by changes in restaurant level profitability, including the impact of commodity costs. Further, we believe the franchise model will allow us to significantly expand our global footprint with minimal investment. Because we have remodeled or developed over 90% of our company-operated restaurants since the end of fiscal 2005, reduced the construction costs required to refresh our restaurants and shifted to a predominantly franchised model, we expect future capital expenditure requirements to be significantly lower than our average capital expenditures from fiscal 2007 to fiscal 2010. Capital expenditures in fiscal 2012 decreased to $52 million from $117 million in fiscal year 2007. Based on our current capital spending projections, we expect capital expenditures to be between $60 million and $70 million for fiscal 2013.
Proven Management Team Has Longstanding History with CKE
Our management team has been together at CKE Restaurants since fiscal 2001 and has an average of 25 years experience in the restaurant industry. During their tenure, our AUV has increased by 51%. Since our CEO took the leadership position in fiscal 2001, our franchise restaurants have increased from 47% of total units to 73% as of May 21, 2012. The management team has also significantly accelerated international unit development over the past few years.
How We Plan to Feed More “Young, Hungry Guys” Globally
We believe there are significant opportunities to grow our brands globally, improve our operating results and deliver stockholder value by executing the following strategies:
Continue Our International Growth
We believe we have demonstrated a strong track record of growing our brands into new international markets over the past five years. Since the end of fiscal 2007, the total number of international franchise restaurants has grown by 85% from 238 units (8% of total) to 441 units (14% of total), including an increase of nearly 18% during fiscal 2012. In addition, we have expanded into a total of 25 foreign countries compared to 13 at the end of fiscal 2007. We have invested in and developed the necessary infrastructure to support and continue growing our international operations. To date, our international development strategy has been primarily focused on what we believe are high growth, emerging markets in Asia, Latin America and Russia for Carl’s Jr. and the Middle East and Central Asia for Hardee’s. We plan to continue expansion in these and new international markets through the use of development agreements. We expect to accelerate franchise growth in a number of new markets with significant growth coming from Brazil, Canada, China and Russia, although we can provide no guarantee such growth will occur or will be significant. The recent signing of a 100 restaurant
7
Table of Contents
development agreement with a new franchisee in Brazil is an example of our continued progress in achieving this goal. As of May 21, 2012, we had 25 international franchise development agreements representing commitments to build over 500 franchise restaurants. We entered into approximately 80% of these development agreements in the last three years.
Accelerate Our Domestic Franchise Development
In addition to international openings, we are focused on growing our overall franchise base in the U.S. Franchises, as compared to company-operated restaurants, provide a more stable, capital efficient income stream in the form of royalties, which are insulated from fluctuations in restaurant-level costs and profitability and do not require incremental capital expenditures from our company. Increasing our scale by adding system-wide restaurants will also enable us to leverage our corporate infrastructure over a larger restaurant base. Franchising also expands the brands’ marketing reach as franchisees are required to contribute to advertising both nationally and locally. Our overall mix of franchise restaurants has increased from 64% of system restaurants at the end of fiscal 2007 to 73% as of May 21, 2012, with approximately 81% of our total franchise restaurants located in the U.S. We believe our overall franchise mix will continue to increase as our restaurant-level economics continue to entice franchisees to open new restaurants, and we expect the number of new franchise restaurant openings to significantly exceed the number of company-operated restaurant openings. We believe our system-wide mix can exceed 80% franchised over the long-term as we work with both existing and new franchisees to develop new restaurants. Domestically, we continue to focus on developing certain existing markets, such as Texas, and expanding into new and underpenetrated markets, such as the Northeastern United States. As of May 21, 2012, we had 48 domestic franchise development agreements representing commitments to build over 375 restaurants.
Continue to Increase Same-Store Sales and Free Cash Flow
We intend to continue building on our same-store sales growth momentum through the following initiatives:
Continue developing and offering innovative products: We believe we have historically had a strong track record of developing new and innovative products targeted towards “young, hungry guys” and plan to drive same-store sales growth through utilizing this expertise. We intend to continue developing and promoting what we believe to be innovative, premium burgers, supplemented by our chicken products and healthful products such as our turkey burgers. We have introduced new products at both brands including our lines of 100% Black Angus Beef Burgers, Hardee’s Made From Scratch Biscuits, Hand-Scooped Ice Cream Shakes and Malts®, Charbroiled Turkey Burgers and Hand-Breaded Chicken products. While maintaining our “young, hungry guys” focus, we plan to continue to develop and increase customer awareness of our healthful products which have historically included our Charbroiled Chicken Sandwiches and Premium Entrée Salads. More recently, we partnered with Men’s Health and the creators of the bestselling Eat This, Not That! ® brand to develop a line of Charbroiled Turkey Burgers that all have less than 500 calories.
Expand breakfast offering and cross roll-out of popular items: We have regularly rolled out popular items from one of our brands to the other since both concepts have similar market positionings. Currently, our lunch and dinner menus at both brands are centered around our line of 100% Black Angus Beef Burgers and other sandwiches. More recently, we have rolled out new products such as our line of Charbroiled Turkey Burgers and Hand-Breaded Chicken Tenders concurrently at both brands. We believe Hardee’s is regarded as the best choice for breakfast in the QSR industry, with approximately 48% of company-operated restaurant revenue in fiscal 2012 and the first quarter of fiscal 2013 coming from breakfast. Much of the success of Hardee’s breakfast menu can be attributed to its Made From Scratch Biscuits and biscuit breakfast sandwiches. Recently, Carl’s Jr. launched the roll-out of Hardee’s Made From Scratch Biscuits in the Los Angeles market in the second half of fiscal 2012 after completing the launch of these premium breakfast products in selected other markets. We anticipate offering these products at substantially all of our company-operated Carl’s Jr. restaurants and at approximately 70% of the total domestic Carl’s Jr. restaurants by the end of fiscal 2013. During the year after
8
Table of Contents
the introduction of Hardee’s Made From Scratch Biscuits at select Carl’s Jr. locations, the share of sales occurring at breakfast increased by approximately 48%. We believe Hardee’s breakfast menu is a logical extension of Carl’s Jr.’s offerings that can increase our sales and overall market share in the breakfast hours.
Emphasize and capitalize on our unique brand positioning: We believe our new product introductions are enhanced through edgy, breakthrough advertising, high visibility sports sponsorships in major markets and a creative internet presence. By introducing new products at both brands simultaneously, we have also been able to more efficiently purchase national cable television media, which has not only increased our media presence in our well-penetrated markets, but also provided a solid base of media in our under-penetrated and newer markets, which we believe will help establish demand in potential future expansion markets. In addition, our plans for continued use and focus on digital marketing, including social media and mobile channels, help to increase overall brand awareness, drive traffic into our restaurants and effectively reach our target demographic of “young, hungry guys.” As of May 21, 2012, our digital following included approximately 1.8 million total followers on Facebook and there had been nearly 700,000 downloads of our iPhone and Android mobile applications.
Capitalize on dual-branding opportunities: As of May 21, 2012, approximately 56% of our company-operated units were dual-branded with our Green Burrito and Red Burrito concepts. At a dual-branded restaurant, a customer can order Mexican-inspired Green Burrito or Red Burrito products, such as burritos, tacos and quesadillas, at the same counter as our Carl’s Jr. or Hardee’s products. We believe there is an opportunity to increase the number of dual-branded company-operated locations in the future. In addition, we believe there is an opportunity for our royalties to increase as our franchisees continue to dual-brand their locations with the Green Burrito and Red Burrito concepts. In particular, we believe that there is an attractive opportunity for our Hardee’s franchisees to dual-brand additional locations based on the financial results from recent conversions at company-operated Hardee’s units and the fact that only approximately 7% of our 1,227 domestic franchised Hardee’s restaurants were dual-branded as of May 21, 2012. With respect to the performance of recent company-operated dual-branded conversions, 47 company-operated Hardee’s restaurants were converted to dual-branded locations with Red Burrito in fiscal 2011. In fiscal 2012, these restaurants, on average, achieved an increase in sales that was 6.5% greater than comparable Hardee’s restaurants that were not dual-branded. The increase in sales also translated to an increase in profitability and greater than a 40% cash-on-cash return on the capital invested to convert these restaurants.
Continued focus on operational excellence: We also plan to remain focused on our core restaurant fundamentals of quality, service and cleanliness. From fiscal 2007 through May 21, 2012, we spent approximately $148 million on a significant remodeling of our company-operated restaurants, which we believe has improved the customer experience. Restaurants that have been remodeled have demonstrated significantly improved sales and customer satisfaction scores as reflected by a 10 percentage point improvement in customer satisfaction scores across our concepts since the end of fiscal 2007. We also stand to benefit as franchisees continue to remodel their restaurants, as the anticipated sales lift from franchise remodels increases the royalty payments to our company. As of May 21, 2012, only 64% of our domestic franchised units have been remodeled or developed since the end of fiscal 2005 compared to 93% of our company-operated restaurants. Our franchisees are obligated under their franchise agreements to remodel their restaurants to the current image, although in certain circumstances we have granted exceptions or extensions, such as where the unit is newer or where the franchisee needs to obtain additional lease term. By the end of fiscal 2014, many of the extensions will expire and, as a result, we expect that over 85% of our franchised restaurants in the U.S. will have been remodeled or developed since the end of fiscal 2005. We expect these improvements will further benefit our customer satisfaction scores and overall brand image.
9
Table of Contents
Merger and Related Transactions
On July 12, 2010, we acquired CKE Restaurants pursuant to an Agreement and Plan of Merger (the “Merger Agreement”). CKE Restaurants merged with a wholly-owned subsidiary of ours (the “Merger”), and became our wholly-owned subsidiary.
In connection with the Merger, investment funds managed by Apollo Management VII, L.P. (the “Apollo Funds”), and members of our senior management invested in our equity indirectly through a holding company, and CKE Restaurants issued $600.0 million aggregate principal amount of senior secured second lien notes (the “Senior Secured Notes”) and entered into a $100.0 million senior secured revolving credit facility (the “Credit Facility”), which was undrawn at closing. These transactions, including the Merger and payment of costs related to these transactions, are collectively referred to as the “Transactions.”
Subsequently, on March 14, 2011, CKE completed an offering of $200.0 million of its 10.50%/11.25% senior unsecured PIK toggle notes due March 14, 2016 (the “Toggle Notes,” and collectively with the Senior Secured Notes, the “Notes”).
Our Principal Stockholders
The Apollo Funds and our management own their equity interests in us through a holding company, the selling stockholder in this offering, which is the record holder of all of our issued and outstanding shares.
The principal beneficial owners of our common stock are the Apollo Funds, investment funds managed by Apollo Management VII, L.P. (“Apollo Management”), an affiliate of Apollo Management, L.P., which we collectively refer to in this prospectus as “Apollo.” Apollo will beneficially own % or shares of our common stock after this offering, assuming the underwriters do not exercise their option to purchase up to additional shares. Apollo Investment Fund VII, L.P. is an investment fund with committed capital, along with its parallel investment funds, of approximately $14.7 billion. Apollo Management, L.P., is an affiliate of Apollo Global Management, LLC, a leading global alternative asset manager with offices in New York, Los Angeles, London, Frankfurt, Luxembourg, Singapore, Hong Kong and Mumbai. As of March 31, 2012, Apollo Global Management, LLC and its subsidiaries had assets under management of approximately $86 billion across all of their businesses.
We currently have a management services agreement with Apollo Management for advisory services. In fiscal 2012, we incurred $2.5 million in fees and out-of-pocket expenses under this agreement, which Apollo Management intends to terminate upon completion of this offering. Upon the termination of this agreement, Apollo Management will receive a fee of $ million (plus any unreimbursed expenses) from us. See “Certain Relationships and Related Party Transactions—Management Services Fee” for more detail regarding our arrangements with Apollo.
10
Table of Contents
Our Ownership Structure
The chart below is a summary of our organizational structure after giving effect to this offering.
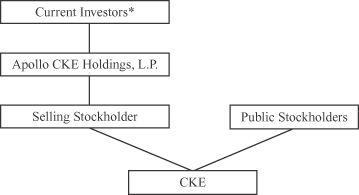
| * | Current investors consist of the Apollo Funds, members of our management and board of directors and certain other investors, all of whom are limited partners of Apollo CKE Holdings, L.P., which is the sole member of CH Restaurant Holdings, LLC, our direct stockholder and the selling stockholder in this offering. See “Principal and Selling Stockholders.” |
Risk Factors
Investing in our common stock involves substantial risk. Our ability to execute our strategy is also subject to certain risks. The risks described under the heading “Risk Factors” immediately following this summary may cause us not to realize the full benefits of our strengths or may cause us to be unable to successfully execute all or part of our strategy. If any of the risks or the risks described under the heading “Risk Factors” were to occur, you may lose part or all of your investment. You should carefully consider all the information in this prospectus, including matters set forth under the heading “Risk Factors” before making an investment decision.
Additional Information
Our principal executive offices are located at 6307 Carpinteria Avenue, Suite A, Carpinteria, California, 93013, and our telephone number is (805) 745-7500.
CKE Inc. was incorporated in Delaware on April 15, 2010 to effect the Transactions.
11
Table of Contents
The Offering
| Issuer |
CKE Inc. |
| Common stock offered by us |
shares. |
| Common stock offered by selling stockholder |
shares. |
| Common stock to be outstanding immediately after the offering |
shares. |
| Underwriters’ option to purchase additional shares of common stock in this offering |
We and the selling stockholder have granted to the underwriters a 30-day option to purchase up to and additional shares, respectively, at the initial public offering price less underwriting discounts and commissions. |
| Common stock voting rights |
Each share of our common stock will entitle its holder to one vote. |
| Dividend policy |
We currently intend to retain all future earnings, if any, for use in the operation of our business and to fund future growth. The decision whether to pay dividends will be made by our board of directors in light of conditions then existing, including factors such as our results of operations, financial condition and requirements, business conditions and covenants under any applicable contractual arrangements, including our indebtedness. See “Dividend Policy.” |
| Use of proceeds |
We estimate that our net proceeds from this offering will be approximately $ million after deducting the estimated underwriting discounts and commissions and other expenses of $ million payable by us, assuming the shares are offered at $ per share, which represents the midpoint of the range set forth on the front cover of this prospectus. We intend to use these net proceeds (i) to repay a portion of the outstanding Senior Secured Notes and to pay the related early redemption premiums and accrued interest and (ii) for general corporate purposes. The Senior Secured Notes were issued in connection with the Merger. We will not receive any proceeds from the sale of our common stock by the selling stockholder. For sensitivity analyses as to the offering price and other information, see “Use of Proceeds.” In addition, upon the completion of this offering, we will pay from cash on hand Apollo Management or its affiliates a fee of $ million (plus any unreimbursed expenses) in connection with the termination of our management services agreement, as described under “Certain Relationships and Related Party Transactions—Management Services Fee.” |
| NYSE symbol |
“CK” |
| Risk factors |
You should carefully read and consider the information set forth under “Risk Factors” beginning on page 19 of this prospectus and all other information set forth in this prospectus before deciding to invest in our common stock. |
12
Table of Contents
| Conflicts of Interest |
Apollo Global Securities, LLC, an underwriter of this offering, is an affiliate of Apollo, our controlling stockholder. Since Apollo beneficially owns more than 10% of our outstanding common stock, a “conflict of interest” is deemed to exist under Rule 5121(f)(5)(B) of the Conduct Rules of the Financial Industry Regulatory Authority, or FINRA. As such, any underwriter that has a conflict of interest pursuant to Rule 5121 will not confirm sales to accounts in which it exercises discretionary authority without the prior written consent of the customer. Pursuant to Rule 5121, a “qualified independent underwriter” (as defined in Rule 5121) must participate in the preparation of the prospectus and perform its usual standard of due diligence with respect to the registration statement and this prospectus. has agreed to act as qualified independent underwriter for the offering. See “Underwriting (Conflicts of Interest).” |
Except as otherwise indicated, all of the information in this prospectus assumes:
| • | the for one stock split described below has been completed; |
| • | no exercise of the underwriters’ option to purchase up to additional shares of common stock; |
| • | an initial offering price of $ per share, the midpoint of the range set forth on the cover page of this prospectus; and |
| • | our amended and restated certificate of incorporation and amended and restated bylaws are in effect, pursuant to which the provisions described under “Description of Capital Stock” will become operative. |
Prior to completion of this offering, we will increase our authorized shares of common stock and effect a stock split, whereby our stockholder will receive shares of common stock for each share it currently holds. The number of shares of common stock to be outstanding after completion of this offering is based on shares of our common stock to be sold by us and the selling stockholder in this offering and, except where we state otherwise, the information with respect to our common stock we present in this prospectus does not give effect to shares of common stock reserved for future issuance under our Stock Incentive Plan (as defined in “Executive Compensation—Stock Incentive Plan”).
13
Table of Contents
Summary Historical and Pro Forma Financial and Other Data
The summary historical financial data for the fiscal year ended January 31, 2012, the twenty-nine weeks ended January 31, 2011, the twenty-four weeks ended July 12, 2010 and the fiscal year ended January 31, 2010 and as of January 31, 2012 and 2011 have been derived from our Consolidated Financial Statements, including the related notes thereto, which have been audited by KPMG LLP, an independent registered public accounting firm, and are included elsewhere in this prospectus. The summary historical financial data as of May 21, 2012 and for the sixteen weeks ended May 21, 2012 and May 23, 2011 have been derived from our unaudited Condensed Consolidated Financial Statements, including the related notes thereto, which are included elsewhere in this prospectus and have been prepared on a basis consistent with our annual audited Consolidated Financial Statements. Periods ended on or prior to July 12, 2010 reflect the consolidated results of our subsidiary, CKE Restaurants, prior to the Merger, and the periods beginning after July 12, 2010 reflect the results of CKE and its consolidated subsidiaries after the Merger. We refer to the financial statements prior to the Merger as “Predecessor” and to those after the Merger as “Successor.”
We have also presented on a supplemental basis in “Management’s Discussion and Analysis of Financial Condition and Results of Operations,” pro forma condensed consolidated financial information for the fiscal year ended January 31, 2011, which combines the Predecessor twenty-four weeks ended July 12, 2010 and the Successor twenty-nine weeks ended January 31, 2011, adjusted to give effect to the Transactions as if they had occurred on January 26, 2010, the first day of our fiscal year ended January 31, 2011. The pro forma adjustments relate primarily to interest expense, share-based compensation expense, transaction-related costs and depreciation and amortization. The summary pro forma financial data presented below has been derived from this pro forma condensed consolidated financial information. We believe this supplemental pro forma financial data will assist in comparing our results of operations between periods. See “Management’s Discussion and Analysis of Financial Condition and Results of Operations – Supplemental Discussion of Historical and Pro Forma Financial Information” for further discussion.
The following data should be read in conjunction with “Risk Factors,” “Selected Historical Financial Information and Other Data,” “Management’s Discussion and Analysis of Financial Condition and Results of Operations” and our consolidated financial statements and related notes thereto included elsewhere in this prospectus.
14
Table of Contents
| Successor | Pro Forma(1) | Predecessor | ||||||||||||||||||
| Sixteen Weeks Ended May 21, 2012 |
Sixteen Weeks Ended May 23, 2011 |
Fiscal Year Ended January 31, 2012(2) |
Fiscal Year Ended January 31, 2011(2) |
Fiscal Year Ended January 31, 2010(2) |
||||||||||||||||
| (dollars in thousands, except per share amounts) | ||||||||||||||||||||
| Consolidated Statements of Operations Data: |
||||||||||||||||||||
| Revenue: |
||||||||||||||||||||
| Company-operated restaurants |
$ | 361,466 | $ | 351,604 | $ | 1,122,430 | $ | 1,099,284 | $ | 1,084,474 | ||||||||||
| Franchised restaurants and other |
50,865 | 48,979 | 157,897 | 233,518 | 334,259 | |||||||||||||||
|
|
|
|
|
|
|
|
|
|
|
|||||||||||
| Total revenue |
412,331 | 400,583 | 1,280,327 | 1,332,802 | 1,418,733 | |||||||||||||||
|
|
|
|
|
|
|
|
|
|
|
|||||||||||
| Operating cost and expenses: |
||||||||||||||||||||
| Restaurant operating costs |
292,752 | 293,248 | 939,615 | 911,020 | 881,397 | |||||||||||||||
| Franchise restaurants and other |
25,629 | 25,878 | 81,372 | 158,916 | 254,124 | |||||||||||||||
| Advertising |
20,852 | 20,061 | 65,061 | 64,128 | 64,443 | |||||||||||||||
| General and administrative |
41,791 | 40,961 | 130,858 | 133,810 | 134,579 | |||||||||||||||
| Facility action charges, net |
401 | 511 | (6,018 | ) | 2,273 | 4,695 | ||||||||||||||
| Other operating expenses (income), net(3) |
— | 351 | 545 | (3,442 | ) | — | ||||||||||||||
|
|
|
|
|
|
|
|
|
|
|
|||||||||||
| Total operating costs and expenses |
381,425 | 381,010 | 1,211,433 | 1,266,705 | 1,339,238 | |||||||||||||||
|
|
|
|
|
|
|
|
|
|
|
|||||||||||
| Operating income |
30,906 | 19,573 | 68,894 | 66,097 | 79,495 | |||||||||||||||
| Interest expense(4) |
(31,310 | ) | (28,850 | ) | (98,124 | ) | (79,842 | ) | (19,254 | ) | ||||||||||
| Other income (expense), net |
1,149 | 799 | (1,658 | ) | 2,279 | 2,935 | ||||||||||||||
|
|
|
|
|
|
|
|
|
|
|
|||||||||||
| Income (loss) before income taxes |
745 | (8,478 | ) | (30,888 | ) | (11,466 | ) | 63,176 | ||||||||||||
| Income tax (benefit) expense |
(5,951 | ) | (3,176 | ) | (11,609 | ) | (4,391 | ) | 14,978 | |||||||||||
|
|
|
|
|
|
|
|
|
|
|
|||||||||||
| Net income (loss) |
$ | 6,696 | $ | (5,302 | ) | $ | (19,279 | ) | $ | (7,075 | ) | $ | 48,198 | |||||||
|
|
|
|
|
|
|
|
|
|
|
|||||||||||
| Net income (loss) per share (basic and diluted) |
||||||||||||||||||||
|
|
|
|
|
|
|
|
|
|
|
|||||||||||
| Other Financial Data: |
||||||||||||||||||||
| Adjusted EBITDA(5) |
$ | 61,574 | $ | 51,499 | $ | 165,878 | $ | 163,977 | $ | 165,464 | ||||||||||
| Adjusted EBITDA margin(5) |
14.9 | % | 12.9 | % | 13.0 | % | 12.3 | % | 11.7 | % | ||||||||||
| Total capital expenditures |
$ | 15,725 | $ | 13,581 | $ | 52,423 | $ | 63,098 | $ | 102,428 | ||||||||||
| Cash paid for interest, net of amounts capitalized |
3,549 | 1,656 | 72,944 | 19,590 | ||||||||||||||||
15
Table of Contents
| Sixteen Weeks Ended May 21, 2012 |
Fiscal Year Ended January 31, 2012 |
Fiscal Year Ended January 31, 2011 |
Fiscal Year Ended January 31, 2010 |
|||||||||||||
| (dollars in thousands) |
||||||||||||||||
| Other Operating Data: |
||||||||||||||||
| Franchised Carl’s Jr. and Hardee’s restaurant sales(6) |
$ | 2,481,092 | $ | 2,367,172 | $ | 2,240,175 | ||||||||||
| Blended company-operated average unit volume (trailing-52 weeks) |
$ | 1,268 | 1,257 | 1,207 | 1,206 | |||||||||||
| Blended company-operated same-store sales increase (decrease) |
2.6 | % | 3.5 | % | (0.8 | )% | (3.9 | )% | ||||||||
| Restaurants open (at end of period): |
||||||||||||||||
| Company-operated |
892 | 892 | 890 | 898 | ||||||||||||
| Domestic franchised |
1,930 | 1,928 | 1,910 | 1,905 | ||||||||||||
| International franchised |
441 | 423 | 359 | 338 | ||||||||||||
|
|
|
|
|
|
|
|
|
|||||||||
| Total restaurants |
3,263 | 3,243 | 3,159 | 3,141 | ||||||||||||
|
|
|
|
|
|
|
|
|
|||||||||
| International franchise restaurants as % of total restaurants (at end of period) |
13.5 | % | 13.0 | % | 11.4 | % | 10.8 | % | ||||||||
| Number of foreign countries with restaurants (at end of period) |
25 | 25 | 18 | 16 | ||||||||||||
| Successor | ||||||||||||
| May 21, 2012 |
January 31, 2012 |
January 31, 2011 |
||||||||||
| (dollars in thousands) | ||||||||||||
| Consolidated Balance Sheet Data: |
||||||||||||
| Cash and cash equivalents |
$ | 125,447 | $ | 64,585 | $ | 42,586 | ||||||
| Total assets |
1,521,524 | 1,478,087 | 1,496,166 | |||||||||
| Total long-term debt and capital lease obligations, including current portion |
774,090 | 764,703 | 638,532 | |||||||||
| Stockholder’s equity |
228,008 | 219,895 | 424,769 | |||||||||
| (1) | The summary pro forma financial data for the fiscal year ended January 31, 2011 has been derived from our financial results for the Successor twenty-nine weeks ended January 31, 2011 and the Predecessor twenty-four weeks ended July 12, 2010, adjusted to reflect the pro forma effect of the Transactions as if they had occurred on January 26, 2010. See “Management’s Discussion and Analysis of Financial Condition and Results of Operations—Supplemental Discussion of Historical and Pro Forma Financial Information.” Summary historical consolidated statements of operations data for the Successor twenty-nine weeks ended January 31, 2011 and the Predecessor twenty-four weeks ended July 12, 2010 is provided in the following table. |
16
Table of Contents
| Successor | Predecessor | |||||||
| Twenty-Nine Weeks Ended January 31, 2011 |
Twenty-Four Weeks Ended July 12, 2010 |
|||||||
| (dollars in thousands, except per share amounts) |
||||||||
| Revenue: |
||||||||
| Company-operated restaurants |
$ | 598,753 | $ | 500,531 | ||||
| Franchised restaurants and other |
80,355 | 151,588 | ||||||
|
|
|
|
|
|||||
| Total revenue |
679,108 | 652,119 | ||||||
|
|
|
|
|
|||||
| Operating cost and expenses: |
||||||||
| Restaurant operating costs |
495,909 | 414,171 | ||||||
| Franchise restaurants and other |
39,464 | 115,120 | ||||||
| Advertising |
34,481 | 29,647 | ||||||
| General and administrative(a) |
84,833 | 59,859 | ||||||
| Facility action charges, net |
1,683 | 590 | ||||||
| Other operating expenses, net(b) |
20,003 | 10,249 | ||||||
|
|
|
|
|
|||||
| Total operating costs and expenses |
676,373 | 629,636 | ||||||
|
|
|
|
|
|||||
| Operating income |
2,735 | 22,483 | ||||||
| Interest expense(c) |
(43,681 | ) | (8,617 | ) | ||||
| Other (expense) income, net(d) |
1,645 | (13,609 | ) | |||||
|
|
|
|
|
|||||
| (Loss) income before income taxes |
(39,301 | ) | 257 | |||||
| Income tax (benefit) expense |
(11,411 | ) | 7,772 | |||||
|
|
|
|
|
|||||
| Net loss |
$ | (27,890 | ) | $ | (7,515 | ) | ||
|
|
|
|
|
|||||
| Net loss per share (basic and diluted) |
||||||||
|
|
|
|
|
|||||
| (a) | The Successor twenty-nine weeks ended January 31, 2011 and the Predecessor twenty-four weeks ended July 12, 2010 include $10,587 and $1,521, respectively, of share-based compensation expense related to the acceleration of vesting of stock options and awards in connection with the Merger. |
| (b) | Other operating expenses, net includes transaction-related costs of $20,003 and $13,691 for the Successor twenty-nine weeks ended January 31, 2011 and the Predecessor twenty-four weeks ended July 12, 2010, respectively. Additionally, the Predecessor twenty-four weeks ended July 12, 2010 includes a gain of $3,442 on the sale of our Carl’s Jr. distribution center assets on July 2, 2010. |
| (c) | The Predecessor twenty-four weeks ended July 12, 2010 includes $3,113 of interest expense related to changes in the fair value of our Predecessor interest rate swap agreements. |
| (d) | The Predecessor twenty-four weeks ended July 12, 2010 includes a termination fee of $14,283 related to a prior merger agreement. |
| (2) | Our fiscal year is 52 or 53 weeks, ending the last Monday in January. For clarity of presentation, we generally label all fiscal years presented as if the fiscal year ended January 31. The pro forma fiscal year ended January 31, 2011 contains 53 weeks; all other fiscal years presented contain 52 weeks. |
| (3) | Other operating expenses (income), net consists of transaction-related costs of $351 and $545 for the sixteen weeks ended May 23, 2011 and fiscal 2012, respectively, and a gain of $3,442 on the sale of our Carl’s Jr. distribution center assets on July 2, 2010 in pro forma fiscal 2011. |
| (4) | Fiscal 2010 includes $6,803 of interest expense related to changes in the fair value of our Predecessor interest rate swap agreements. |
| (5) | “Adjusted EBITDA” represents net income (loss), adjusted to exclude income taxes, interest income and expense, asset impairments, facility action charges, depreciation and amortization, management fees, the effects of acquisition accounting adjustments, and certain non-cash and other items described below. |
17
Table of Contents
| “Adjusted EBITDA margin” is defined as Adjusted EBITDA divided by total revenue. We believe that the presentation of Adjusted EBITDA provides investors with a meaningful measure of operating performance, and we use it for planning purposes. In addition, our calculation of Adjusted EBITDA is consistent with the equivalent measurement in the covenants contained in agreements respecting certain of our indebtedness. See “Description of Indebtedness.” Adjusted EBITDA is not a measurement of operating performance computed in accordance with U.S. GAAP and should not be considered as a substitute for operating income, net income or cash flows from operating activities computed in accordance with U.S. GAAP. Adjusted EBITDA may not be comparable to similarly titled measures of other companies. See “Non-GAAP Financial Measures.” |
A reconciliation of net income (loss) to Adjusted EBITDA is provided below.
| Successor | Pro Forma | Predecessor | ||||||||||||||||||
| Sixteen Weeks Ended May 21, 2012 |
Sixteen Weeks Ended May 23, 2011 |
Fiscal Year Ended January 31, 2012 |
Fiscal Year Ended January 31, 2011(a) |
Fiscal Year Ended January 31, 2010 |
||||||||||||||||
| (dollars in thousands) | ||||||||||||||||||||
| Net income (loss) |
$ | 6,696 | $ | (5,302 | ) | $ | (19,279 | ) | $ | (7,075 | ) | $ | 48,198 | |||||||
| Interest expense |
31,310 | 28,850 | 98,124 | 79,842 | 19,254 | |||||||||||||||
| Income tax (benefit) expense |
(5,951 | ) | (3,176 | ) | (11,609 | ) | (4,391 | ) | 14,978 | |||||||||||
| Depreciation and amortization |
25,467 | 24,938 | 82,044 | 77,780 | 71,064 | |||||||||||||||
| Facility action charges, net |
401 | 511 | (6,018 | ) | 2,273 | 4,695 | ||||||||||||||
| Gain on sale of distribution center assets |
— | — | — | (3,442 | ) | — | ||||||||||||||
| Transaction-related costs(b) |
— | 351 | 545 | — | 823 | |||||||||||||||
| Management fees(c) |
765 | 767 | 2,490 | 2,541 | — | |||||||||||||||
| Share-based compensation expense |
1,417 | 1,469 | 4,593 | 4,774 | 8,156 | |||||||||||||||
| Losses on asset and other disposals |
221 | 713 | 1,801 | 6,500 | 2,341 | |||||||||||||||
| Difference between U.S. GAAP rent and cash rent |
835 | 618 | 2,690 | 2,360 | 989 | |||||||||||||||
| Other, net(d) |
413 | 1,760 | 10,497 | 2,815 | (5,034 | ) | ||||||||||||||
|
|
|
|
|
|
|
|
|
|
|
|||||||||||
| Adjusted EBITDA(e) |
$ | 61,574 | $ | 51,499 | $ | 165,878 | $ | 163,977 | $ | 165,464 | ||||||||||
|
|
|
|
|
|
|
|
|
|
|
|||||||||||
| (a) | Pro forma fiscal 2011 contained 53 weeks. We estimate the extra week resulted in additional Adjusted EBITDA of approximately $2,000. |
| (b) | Transaction-related costs include investment banking, legal, and other costs related to the Merger. |
| (c) | Represents the amounts associated with the management services agreement with Apollo Management for on-going investment banking, consulting, and financial planning services, which are included in general and administrative expense. |
| (d) | Other, net includes the net impact of acquisition accounting, early extinguishment of debt, executive retention bonus, severance costs and disposition business expense. For the fiscal year ended January 31, 2012, other, net also includes a charge of $1,976 related to the out-of-period Insurance Reserve Adjustment described in more detail in Note 1 of Notes to Consolidated Financial Statements included elsewhere in this prospectus. For the pro forma fiscal year ended January 31, 2011 and the fiscal year ended January 31, 2010, other, net also includes an adjustment to remove the Adjusted EBITDA associated with our Carl’s Jr. distribution centers, which we sold on July 2, 2010. |
| (e) | In comparing Adjusted EBITDA for periods before and after the Merger, we estimate that we would have had cost savings of $970 and $1,510 in fiscal 2011 and fiscal 2010, respectively, had we been a privately held company for those years. Adjusted EBITDA would have been $164,947 and $166,974, respectively, for such fiscal years had those estimated cost savings been realized. |
| (6) | Franchised restaurant operations are not included in our Consolidated Statements of Operations; however, franchised restaurants sales result in royalties and rental revenues, which are included in franchised restaurant and other revenue. |
18
Table of Contents
Investing in our common stock involves a high degree of risk. You should carefully consider the risk factors set forth below as well as the other information contained in this prospectus before investing in our common stock. We describe below those risks that are known to us and which we believe are material to our business. However, these risks are not the only risks facing us, and any of the following risks, and any additional risks or uncertainties not currently known to us or those we currently view as immaterial, could materially and adversely affect our business, financial condition, results of operations or cash flows. In such a case, you may lose part or all of your original investment.
Risks Relating to our Business
Competition is intense and may harm our business and results of operations.
The foodservice industry is intensely competitive with respect to the quality and value of food products offered, service, price, convenience, and dining experience. We compete with major restaurant chains, some of which dominate the QSR industry. Our competitors also include a variety of mid-price, full-service casual-dining restaurants, health and nutrition-oriented restaurants, delicatessens and prepared food restaurants, take-out food service companies, fast food restaurants, supermarkets and convenience stores. In addition to competing with such companies for customers, we also must compete with them for access to qualified employees and management personnel, suitable restaurant locations and capable franchisees. Many of our competitors have substantially greater brand recognition, as well as greater financial, marketing, operating and other resources than we have, which may give them competitive advantages with respect to some or all of these areas of competition. Some of our competitors have engaged and may continue to engage in substantial price discounting in response to the ongoing economic weakness and uncertainty, which may adversely impact our sales and operating results. As our competitors expand operations and marketing campaigns, we expect competition to intensify. Such increased competition could have a material adverse effect on our business and results of operations.
Changes in consumer preferences and perceptions, economic, market and other conditions could adversely affect our operating results.
The QSR industry is affected by changes in economic conditions, consumer preferences and spending patterns, demographic trends, consumer perceptions of food safety and nutrition, weather, traffic patterns, the type, number and location of competing restaurants, and other factors. Multi-location foodservice businesses such as ours can also be materially and adversely affected by publicity resulting from poor food quality, food tampering, illness, injury or other health concerns or operating issues stemming from one or a limited number of restaurants.
In addition, the ongoing economic weakness and uncertainty may cause changes in consumer preferences, and if such economic conditions persist for an extended period of time, this may result in consumers making long-lasting changes to their spending behaviors. A number of our major competitors have been increasing their “value item” offerings and implementing certain pricing promotions for various other menu items. If consumer preference continues to shift towards these “value items,” it may become necessary for us to implement temporary promotional pricing offerings. If we implement such promotional offerings, our operating margins may be adversely impacted. Any promotional offerings or temporary price cuts implemented by us are not expected to represent a permanent change in our business strategy, and would only be temporary in duration.
Changes in interest rates, commodity prices, labor costs, energy costs and other expenses could adversely affect our operating results.
Increases in interest rates, gasoline prices, commodity costs, labor and benefits costs, legal claims, as well as inflation and the availability of management and hourly employees affect our restaurant operations and administrative expenses.
19
Table of Contents
In particular, increases in interest rates may impact land and construction costs and the cost and availability of borrowed funds, and thereby adversely affect our ability and our franchisees’ ability to finance new restaurant development and improve existing restaurants. In addition, inflation can cause increased commodity and labor and benefits costs and can increase our operating expenses.
Increases in energy costs for our company-operated restaurants, principally electricity for lighting restaurants and natural gas for our broilers, could reduce our operating margins and financial results if we choose not, or are unable, to pass the increased costs to our customers. In addition, our distributors purchase gasoline needed to transport food and other supplies to us. These distributors may charge fuel surcharges if energy costs significantly increase, which could reduce our operating margins and financial results if we choose not, or are unable, to pass the increased costs to our customers.
Changes in food, packaging and supply costs could adversely affect our results of operations.
Our profitability depends in part on our ability to anticipate and react to changes in food, packaging and supply costs. We, along with our franchisees, purchase large quantities of food, packaging and supplies; and like all restaurant companies, we are susceptible to increases in food, packaging and supply costs as a result of factors beyond our control, such as general economic conditions, significant variations in supply and demand, seasonal fluctuations, weather conditions, food safety concerns, food-borne diseases, fluctuations in the value of the U.S. dollar, commodity market speculation and government regulations. Since we have a higher concentration of company-operated restaurants than many of our competitors, we may have greater volatility in our operating costs than those competitors who are more heavily franchised.
The predominant food commodities purchased by our restaurants include beef, chicken, potatoes, pork, dairy, cheese, produce, wheat flour and soybean oil. The cost of food commodities has increased markedly over the last two years, resulting in upward pricing pressure on many of our raw ingredients, and thereby increasing our food costs. For example, the cost of beef, our largest commodity expenditure and the only commodity that accounts for more than twenty percent of our total food and packaging costs, has increased between ten and fifteen percent over the past year as a result of a reduction in U.S. cattle supply, a trend which we expect to continue for several years, and an increase in world demand. We expect that there may be additional pricing pressure on some of our key ingredients, most notably beef, during fiscal 2013. Material increases in the prices of the ingredients most critical to our menu, particularly beef, could adversely affect our operating results or cause us to consider changes to our product delivery strategy and adjustments to our menu pricing.
We depend on a limited number of key suppliers to deliver quality products to us at moderate prices.
Our profitability is dependent on, among other things, our continuing ability to offer premium-quality food at moderate prices. Our Carl’s Jr. and Hardee’s restaurants depend on the distribution services of Meadowbrook Meat Company, Inc. (“MBM”), a third party, national distributor of food and other products. MBM is responsible for delivering food, packaging and other products from our suppliers to our restaurants on a frequent and routine basis. MBM also provides distribution services to nearly all of our domestic Carl’s Jr. and Hardee’s franchisees. Pursuant to the terms of our distribution agreements, we are obligated to purchase substantially all of the food, packaging and supplies sold or used in our Carl’s Jr. and Hardee’s restaurants from MBM through June 30, 2017.
Our suppliers may be adversely impacted by the ongoing economic weakness and uncertainty, such as increased commodity prices, increased fuel costs, tight credit markets and various other factors. As a result, our suppliers may seek to change the terms on which they do business with us in order to lessen the impact of any current and future economic challenges on their businesses. If we are forced to renegotiate the terms upon which we conduct business with our suppliers or find alternative suppliers to provide key products or services, it could adversely impact our financial condition or results of operations.
In addition, the ongoing economic weakness and uncertainty have forced some food suppliers to seek financing in order to stabilize their businesses, and others have ceased operations completely. If MBM or a large
20
Table of Contents
number of other suppliers suspend or cease operations, we may have difficulty keeping our restaurants fully supplied with the high quality ingredients we require. If we were forced to suspend serving one or more of our menu items that could have a significant adverse impact on our restaurant traffic and our public perception, which would be harmful to our business.
Our financial results may be impacted by our ability to successfully enter new markets, select appropriate restaurant locations, construct new restaurants, complete remodels or renew leases with desirable terms.
Our growth strategy includes opening new restaurants in markets, including international markets, where we have relatively few or no existing restaurants. There can be no assurance that we will be able to successfully expand or acquire critical market presence for our brands in new geographical markets either in the United States or abroad. Consumer characteristics and competition in new markets may differ substantially from those in the markets where we currently operate. Additionally, we may be unable to identify appropriate locations, develop brand recognition, successfully market our products or attract new customers. It may also be difficult for us to recruit and retain qualified personnel to manage restaurants. Should we not succeed in entering new markets, there may be adverse impacts to our growth strategy and to our consolidated financial position and results of operations.
Our strategic plan, and a component of our business strategy, includes the construction of new restaurants and the remodeling of existing restaurants. We face competition from other restaurant operators, retail chains, companies and developers for desirable site locations, which may adversely affect the cost, implementation and timing of our expansion plans. If we experience delays in the construction or remodel processes, we may be unable to complete such activities at the planned cost, which would adversely affect our future results of operations. Additionally, we cannot guarantee that such remodels will increase the revenues generated by these restaurants or that any such increases will be sustainable. Likewise, we cannot be sure that the sites we select for new restaurants will result in restaurants whose sales results meet our expectations.
We lease a substantial number of our restaurant properties. The terms of our leases and subleases vary in length, with primary terms (i.e., before consideration of option periods) expiring on various dates through fiscal 2036. We do not expect the expiration of these leases to have a material impact on our operations in any particular year, as the expiration dates are staggered over a number of years and many of the leases contain renewal options. As our leases and available option periods expire, we will need to negotiate new leases with our landlords for those leased restaurants that we intend to continue operating. If we are unable to negotiate acceptable lease terms for them, we may decide to close the restaurants, or the new lease terms may negatively impact our consolidated results of operations.
Our business may be adversely impacted by economic conditions and the geographic concentration of our restaurants.
Our financial condition and results of operations are dependent upon consumer confidence and discretionary spending, which are influenced by general economic conditions and other factors, including the ongoing macroeconomic challenges in the U.S. and elsewhere in the world. Negative consumer sentiment in the wake of the recent economic recession has been widely reported over the past three years and, according to some economic forecasts, may continue during fiscal 2013. Our sales may decline during this period of economic uncertainty, or during future economic downturns, which can be caused by various factors such as high gasoline prices, increasing commodity prices, high unemployment rates, declining home prices or tight credit markets. Any material decline in consumer confidence or discretionary spending could cause our financial results to decline.
In addition, unfavorable macroeconomic trends or developments concerning factors such as increased food, commodity, fuel, utilities, labor and benefits costs may also adversely affect our financial condition and results of operations. Current or future economic conditions may prevent us from increasing prices to address increased
21
Table of Contents
costs without negatively impacting our sales or market share. If we were unable to raise prices or alter our product mix in order to recover increased costs for food, packaging, fuel, utilities, wages, clothing and equipment, our profitability would be negatively affected.
We have a geographic concentration of restaurants in certain states and regions, which can cause economic conditions in particular areas to have a disproportionate impact on our overall results of operations. As of May 21, 2012, we and our franchisees operated restaurants in 42 states and 25 foreign countries. By number of restaurants, our domestic operations are most concentrated in California, North Carolina and Virginia, and our international franchisees are most concentrated in Mexico, the Middle East and Central Asia. Adverse economic conditions in states or regions that contain a high concentration of Carl’s Jr. and Hardee’s restaurants could have a material adverse impact on our results of operations in the future. In particular, continuing high unemployment rates in California, especially among our core customer demographic of young men, has had, and may continue to have, a negative impact on our results of operations. In addition, economic, political, legal and other conditions in Mexico, the Middle East and Central Asia, where a significant number of our international franchisees are located, could have an adverse impact on the operations of such international franchisees and, accordingly, could negatively impact our ability to execute our international growth strategy.
If we are unable to attract and retain key personnel, our business would be harmed.
We believe that our success will depend, in part, on continuing services from the members of our key senior management team. The failure by us to retain members of our senior management team could adversely affect our ability to successfully execute key strategic business decisions and negatively impact the profitability of our business. Additionally, our success may depend on our ability to attract and retain additional skilled senior management personnel.
If our franchisees do not participate in our strategy, our business would be harmed.
Our franchisees are an integral part of our business. We may be unable to successfully implement our brand strategies if our franchisees do not actively participate in such implementation. The failure of our franchisees to focus on the fundamentals of restaurant operations, such as quality, service and cleanliness, would have a negative impact on our success. It may be more difficult for us to monitor our international franchisees’ implementation of our brand strategies due to our lack of personnel in the markets served by such franchisees. One of our strategies is to increase the ratio of franchise restaurants to company-operated restaurants, which could further reduce our influence over the operations of our total restaurant base.
If we fail to successfully open new domestic and international restaurants, our ability to increase our revenues and operating profits could be adversely affected.
Our growth strategy relies in part upon new restaurant development by existing and new franchisees, or by us. We and our franchisees face many challenges in opening new restaurants, including:
| • | availability of financing; |
| • | selection and availability of suitable restaurant locations; |
| • | competition for restaurant sites; |
| • | negotiation of acceptable lease and financing terms; |
| • | securing required domestic or foreign governmental permits and approvals; |
| • | consumer preferences in new geographic regions and acceptance of our products; |
| • | employment and training of qualified personnel; |
| • | impact of inclement weather, natural disasters and other acts of nature; and |
| • | general economic and business conditions. |
22
Table of Contents
In particular, because the majority of our new restaurant development is likely to be funded by franchisee investment, our growth strategy is dependent on our franchisees’ (or prospective franchisees’) ability to access funds to finance such development. We do not provide our franchisees with direct financing and therefore their ability to access borrowed funds generally depends on their independent relationships with various financial institutions. If our franchisees (or prospective franchisees) are not able to obtain financing at commercially reasonable rates, or at all, they may be unwilling or unable to invest in the development of new restaurants, and our future growth could be adversely affected.
To the extent we or our franchisees are unable to open new restaurants as we anticipate, our revenue growth would be limited to growth in comparable store sales. Our failure to add a significant number of new restaurants or grow comparable store sales would adversely affect our ability to increase our revenues and operating income and could materially and adversely impact our business and operating results.
Our financial results are affected by the financial results of our franchisees.
We receive royalties and other fees from our franchisees. As a result, our financial results are impacted by the operational and financial success of our franchisees, including their implementation of our strategic plans, and their ability to secure adequate financing. If our franchisees continue to be impacted by the continuing weak economic conditions, and they are unable to secure adequate sources of financing, their financial health may worsen, our collection rates may decline and we may be required to assume the responsibility for additional lease payments on franchised restaurants, offer extended payment terms or make other concessions. Additionally, refusal on the part of franchisees to renew their franchise agreements may result in decreased royalties. Entering into restructured franchise agreements may result in reduced franchise royalty rates in the future. Furthermore, if our franchisees are not able to obtain the financing necessary to complete planned remodel and construction projects, they may be forced to postpone or cancel such projects.
The financial conditions of our international franchisees may also be adversely impacted by political, economic or other changes in the global markets in which they operate. As a result, the royalties we receive from our international franchisees may be affected by recessionary or expansive trends in international markets, increasing labor costs in certain international markets, changes in applicable tax laws, changes in inflation rates, changes in exchange rates and the imposition of restrictions on currency conversion or the transfer of funds, expropriation of private enterprises, political and economic instability and other external factors.
Our business depends on the willingness of vendors and service providers to supply us with goods and services pursuant to customary credit arrangements which may not be available to us in the future.
Like many companies in the foodservice industry, we purchase goods and services from vendors and service providers pursuant to customary credit arrangements. Changes in our capital structure, or other factors outside our control, may cause our vendors and service providers to change our customary credit arrangements. If we are unable to maintain or obtain trade credit from vendors and service providers on terms favorable to us, or at all, or if vendors and service providers are unable to obtain trade credit or factor their receivables, then we may not be able to execute our business plan, develop or enhance our products or services, take advantage of business opportunities or respond to competitive pressures, any of which could have a material adverse affect on our business. In addition, the tightening of trade credit could limit our available liquidity.
Our international operations are subject to various risks and uncertainties, and there is no assurance that they will be successful.
An important component of our growth strategy involves increasing our net restaurant count in international markets. The execution of this growth strategy depends upon the opening of new restaurants by our existing international franchisees and by new international franchisees. We and our current or future franchisees face many risks and uncertainties in opening new restaurants internationally, including economic and political conditions,
23
Table of Contents
differing cultures and consumer preferences, diverse government regulations and tax systems, securing acceptable suppliers, difficulty in collecting our royalties and longer payment cycles, uncertain or differing interpretations of rights and obligations in connection with international franchise agreements, the selection and availability of suitable restaurant locations, currency regulation and fluctuation, changing labor conditions and difficulties in staffing international franchises and other external factors.
In addition, our current international franchisees may be unwilling or unable to increase their investment in our system by opening new restaurants. Moreover, our international growth also depends upon the availability of prospective franchisees or joint venture partners with the experience and financial resources to be effective operators of our restaurants. There can be no assurance that we will be able to identify future international franchisees who meet our criteria, or that, once identified, they will successfully implement their expansion plans.
Events reported in the media, such as incidents involving food-borne illnesses or food tampering, whether accurate or not, could reduce the production and supply of important food products, cause damage to our reputation and adversely affect our sales and profitability.
Reports, whether true or not, of food-borne illnesses, such as those caused by E. coli, Listeria or Salmonella, in addition to Avian Influenza (commonly known as bird flu) and Bovine Spongiform Encephalopathy (commonly known as BSE or mad cow disease), and injuries caused by food tampering have, in the past, severely impacted the production and supply of certain food products, including beef and poultry. A reduction in the supply of such food products could have a material effect on the price at which we could obtain them, particularly in an environment of already inflated commodity prices. Failure to procure food products, such as beef or poultry, at reasonable terms and prices or any reduction in consumption of such food products by consumers could have a material adverse effect on our consolidated financial condition and results of operations.
In addition, reports, whether or not true, of food-borne illnesses or the use of hormones, antibiotics or pesticides in the production of certain food products may cause consumers to reduce or avoid consumption of such food products. Our brands’ reputations are important assets to us, and any such reports could damage our brands’ reputations and immediately and severely hurt sales and profits. If customers become ill from food-borne illnesses or food tampering, we could be forced to temporarily close some, or all, of our restaurants. While we have implemented a quality assurance program that is designed to verify that the food products prepared in our restaurants are prepared in a manner which complies with, or exceeds, all regulatory standards for food safety, there can be no assurance that we can detect or prevent all incidences of food-borne illnesses or food tampering. In addition, instances of food-borne illnesses or food tampering occurring at the restaurants of competitors, could, by resulting in negative publicity about the QSR industry, adversely affect our sales on a local, regional, or national basis.
Recent public and private concerns about the health risks associated with fast food may adversely affect our financial results.
Recently, class action lawsuits have been filed, and may continue to be filed, against various QSRs alleging, among other things, that QSRs have failed to disclose the health risks associated with high-fat or high-sodium foods and have encouraged obesity. Adverse publicity about these allegations may discourage customers from buying our products, even if we are not the subject of a class action lawsuit.
Our success depends on the effectiveness of our marketing and advertising programs.
Brand marketing and advertising significantly affect our revenues. Our marketing and advertising programs may not be successful, which may prevent us from attracting new customers and retaining existing customers. Also, because franchisees contribute to our advertising fund based on a percentage of their gross sales, our advertising budget depends on sales volumes at these franchised restaurants. If sales decline, we will have less funds available for marketing and advertising, which will harm our business.
24
Table of Contents
Our operations are seasonal and heavily influenced by weather conditions.
Weather, which is unpredictable, can adversely impact our sales. Harsh weather conditions may discourage customers from dining out and result in lost opportunities for our restaurants. For example, a heavy snowstorm can leave an entire metropolitan area snowbound, resulting in a reduction in sales. Our first and fourth quarters, most notably the fourth quarter, include winter months when there is historically a lower level of sales. Because a significant portion of our restaurant operating costs is fixed or semi-fixed in nature, the loss of sales during these periods adversely impacts our profitability. These adverse, weather-driven events have a more pronounced impact on our Hardee’s restaurants. For these reasons, sequential quarter-to-quarter comparisons may not be a good indication of our performance or how we may perform in the future.
Our business may suffer due to our inability to hire and retain qualified personnel and due to higher labor costs.
Our restaurant-level workforce requires large numbers of both entry-level and skilled employees. From time to time, we have had difficulty hiring and maintaining qualified restaurant management personnel. In addition, due to the labor-intensive nature of our business, increases in minimum wage levels have negatively impacted our labor costs, and further increases in minimum wage levels could have additional negative effects on our consolidated results of operations.
Higher health care costs could adversely affect our business.
We offer access to healthcare benefits to certain of our employees. Changes in legislation may cause us to provide health insurance to employees on terms that differ significantly from our existing programs. We will be impacted by the passage of the U.S. Patient Protection and Affordable Care Act (the “Act”). Under the Act, we may be required to amend our health care plans to, among other things, provide affordable coverage, as defined in the Act, to all employees, or otherwise be subject to a payment per employee based on the affordability criteria in the Act, cover adult children of our employees to age 26, delete lifetime limits, and delete pre-existing condition limitations. Many of these requirements will be phased in over a period of time. Additionally, some states and localities have passed state and local laws mandating the provision of certain levels of health benefits by some employers. Increased health care costs could have a material adverse effect on our business, financial condition and results of operations.
Our business may be impacted by increased insurance and/or self-insurance costs.
From time to time, we have been negatively affected by increases in both workers’ compensation and general liability insurance and claims expense due to our claims experience and rising healthcare costs. Although we seek to manage our claims to prevent increases, such increases can occur unexpectedly and without regard to our efforts to limit them. If such increases occur, we may be unable to pass them along to the consumer through product price increases, resulting in decreased operating results.
We are subject to certain health, employment, environmental and other government regulations, and failure to comply with existing or future government regulations could expose us to litigation, damage to our reputation and lower profits.
We, and our franchisees, are subject to various federal, state and local laws. The successful development and operation of restaurants depend to a significant extent on the selection and acquisition of suitable sites, which are subject to zoning, land use, environmental, traffic and other regulations. Restaurant operations are also subject to licensing and regulation by state and local departments relating to health, food preparation, sanitation and safety standards, federal and state labor and immigration law (including applicable minimum wage requirements, overtime pay practices, working and safety conditions and citizenship requirements), federal and state laws prohibiting discrimination and other laws regulating the design and operation of facilities, such as the Americans with Disabilities Act of 1990 (“ADA”). If we fail to comply with any of these laws, we may be subject to governmental action or litigation, and our reputation could be harmed. Injury to our reputation could negatively impact our operating results.
25
Table of Contents
In recent years, there has been an increased legislative, regulatory and consumer focus on nutrition and advertising practices in the food industry, particularly among restaurants. As a result, we have recently become subject to regulatory initiatives in the area of nutrition disclosure including requirements to provide information about the nutritional content of our food products. Some jurisdictions are also beginning to regulate portions and promotions at QSRs that could impact our revenues.
The operation of our franchise system is also subject to franchise laws and regulations enacted by a number of states and rules promulgated by the U.S. Federal Trade Commission. Any future legislation regulating franchise relationships may negatively affect our operations, particularly our relationships with our franchisees. Failure to comply with new or existing franchise laws and regulations in any jurisdiction or to obtain required government approvals could result in a ban or temporary suspension on future franchise sales.
We are subject to the Fair Labor Standards Act (“FLSA”), which governs such matters as minimum wage, overtime and other working conditions, along with the ADA, various family leave mandates and a variety of other laws enacted, or rules and regulations promulgated, by federal, state and local governmental authorities that govern these and other employment matters. We have experienced and expect further increases in payroll expenses as a result of federal and state mandated increases in the minimum wage. In addition, our vendors may be affected by higher minimum wage standards, which may increase the price of goods and services they supply to us.
We are also subject to various federal, state and local environmental laws and regulations that govern discharges to air and water, as well as handling and disposal practices for solid and hazardous wastes. These laws may also impose liability for damages from and the costs of cleaning up sites of spills, disposals or other releases of hazardous materials. We may be responsible for environmental conditions or contamination relating to our restaurants and the land on which our restaurants are located, regardless of whether we lease or own the restaurant or land in question and regardless of whether such environmental conditions were created by us or by a prior owner or tenant. The costs of any cleanup could be significant and could have a material adverse effect on our consolidated financial position and results of operations.
We may not be able to adequately protect our intellectual property, which could decrease the value of our brands and products.
The success of our business depends on the continued ability to use existing trademarks, service marks, trade secrets and other intellectual property rights in order to increase brand awareness and further develop branded products. All of the steps we have taken to protect our intellectual property may not be adequate. The loss of our intellectual property, or our inability to enforce it, may harm the value of our brands and products. Also, third parties may assert infringement claims against us, and we may be unable to successfully defend against these claims. Any litigation, regardless of whether we prevail, could result in substantial costs and a diversion of our resources, which may harm our business.
We are subject to litigation in the ordinary course of business that could adversely affect us.
We may be subject to claims, including class action lawsuits, filed by customers, franchisees, employees, suppliers, landlords and others in the ordinary course of business. Significant claims may be expensive to defend and may divert time and money away from our operations causing adverse impacts to our operating results. In addition, adverse publicity or a substantial judgment against us could negatively impact our brand reputation resulting in further adverse impacts to our financial condition and results of operations.
In addition, the restaurant industry has been subject to claims that relate to the nutritional content of food products, as well as claims that the menus and practices of restaurant chains have led to the obesity of some customers. We may also be subject to this type of claim in the future and, even if we are not specifically named, publicity about these matters may harm our reputation and have adverse impacts on our financial condition and results of operations.
26
Table of Contents
A significant failure, interruption or security breach of our computer systems or information technology may adversely affect our business.
We are significantly dependent upon our computer systems and information technology to properly conduct our business. A significant failure or interruption of service, or a breach in security of our computer systems could cause reduced efficiency in operations, loss of data and business interruptions, and significant capital investment could be required to rectify the problems. In addition, any security breach involving our point of sale or other systems could result in loss of consumer confidence and potential costs associated with consumer fraud.
Catastrophic events may disrupt our business.
Unforeseen events, including war, terrorism and other international conflicts, public health issues, and natural disasters such as hurricanes, earthquakes, or other adverse weather and climate conditions, whether occurring in the U.S. or abroad, could disrupt our operations, disrupt the operations of franchisees, distributors, suppliers or customers, or result in political or economic instability. These events could reduce demand for our products or make it difficult or impossible to receive products from our distributors or suppliers.
Risks Relating to Our Indebtedness
Our substantial leverage could adversely affect our ability to raise additional capital to fund our operations, limit our ability to react to changes in the economy or our industry and prevent us from meeting our obligations under our Notes and Credit Facility.
Our substantial leverage could adversely affect our ability to raise additional capital to fund our operations, limit our ability to react to changes in the economy or our industry, expose us to interest rate risk to the extent of our variable rate debt and prevent us from meeting our obligations under the Toggle Notes (which are obligations of CKE only), the Senior Secured Notes (which are obligations of CKE Restaurants and its subsidiaries only) and the Credit Facility. Our high degree of leverage could have important consequences for our creditors and stockholders, including:
| • | increasing our vulnerability to adverse economic, industry or competitive developments; |
| • | requiring a substantial portion of our cash flow from operations to be dedicated to the payment of principal and interest on our indebtedness, therefore reducing our ability to use our cash flow to fund our operations, capital expenditures and future business opportunities; |
| • | exposing us to the risk of increased interest rates because certain of our borrowings, including borrowings under our Credit Facility, will be at variable rates of interest; |
| • | making it more difficult for us to satisfy our obligations with respect to our indebtedness, including the Notes, and any failure to comply with the obligations of any of our debt instruments, including restrictive covenants and borrowing conditions, could result in an event of default under the indentures governing the Notes and the agreements governing such other indebtedness; |
| • | restricting us from making strategic acquisitions or causing us to make non-strategic divestitures; |
| • | limiting our ability to obtain additional financing for working capital, capital expenditures, product development, debt service requirements, acquisitions and general corporate or other purposes; and |
| • | limiting our flexibility in planning for, or reacting to, changes in our business or market conditions and placing us at a competitive disadvantage compared to our competitors who are less highly leveraged and who therefore, may be able to take advantage of opportunities that our leverage prevents us from exploiting. |
27
Table of Contents
If we are unable to generate sufficient cash flow and are otherwise unable to obtain funds necessary to meet required payments of principal and interest on our indebtedness, or if we otherwise fail to comply with any of the covenants in the indentures governing the Notes or the Credit Facility, we could be in default under one or more of these agreements. In the event of such a default:
| • | the lenders under our Credit Facility could elect to terminate their commitments thereunder and cease making further loans to us; |
| • | the holders of such indebtedness could elect to declare all the indebtedness thereunder to be immediately due and payable, together with accrued and unpaid interest, which would prevent us from using our cash flows for other purposes; |
| • | if we are unable to pay amounts outstanding and declared immediately due and payable, the holders of such indebtedness could proceed against the collateral granted to them to secure the indebtedness; and |
| • | we could ultimately be forced into bankruptcy or liquidation. |
See “Description of Indebtedness” for further discussion of the Toggle Notes, the Senior Secured Notes and the Credit Facility.
Despite our high indebtedness level, we are still able to incur significant additional amounts of debt, which could further exacerbate the risks associated with our substantial indebtedness.
We may be able to incur substantial additional indebtedness in the future. Although the indentures governing the Notes and the Credit Facility contain restrictions on the incurrence of additional indebtedness, these restrictions are subject to a number of significant qualifications and exceptions, and under certain circumstances, the amount of indebtedness that could be incurred in compliance with these restrictions could be substantial. If new debt is added to our and our subsidiaries’ existing debt levels, the related risks that we now face would increase. In addition, the indentures governing the Notes do not prevent us from incurring obligations that do not constitute indebtedness under the indentures.
Our debt agreements contain restrictions that limit our flexibility in operating our business.
Our Credit Facility and the indentures governing the Notes contain various covenants that limit our ability to engage in specified types of transactions. For example, the indentures contain covenants that, among other things, restrict, subject to certain exceptions, our ability and the ability of our restricted subsidiaries to:
| • | incur or guarantee additional debt or issue certain preferred equity; |
| • | pay dividends on or make distributions to holders of our common stock or make other restricted payments; |
| • | sell certain assets; |
| • | create or incur liens on certain assets to secure debt; |
| • | make certain investments; |
| • | designate subsidiaries as unrestricted subsidiaries; |
| • | consolidate, merge, sell or otherwise dispose of all or substantially all of our assets; or |
| • | enter into certain transactions with affiliates. |
The terms of the Credit Facility also include financial performance covenants applicable to CKE Restaurants and its consolidated subsidiaries, which include a maximum secured leverage ratio and a minimum interest coverage ratio. A breach of these or other covenants could allow the lenders to accelerate all amounts due under the Credit Agreement.
See “Description of Indebtedness” for further discussion of the Toggle Notes, the Senior Secured Notes and the Credit Facility.
28
Table of Contents
We may not be able to generate sufficient cash to service all of our indebtedness, and may be forced to take other actions to satisfy our obligations under our indebtedness, which may not be successful.
Our ability to make scheduled payments on or to refinance our debt obligations depends on our financial condition and operating performance, which is subject to prevailing economic and competitive conditions and to certain financial, business and other factors beyond our control. As a result, we may not be able to maintain a level of cash flows from operating activities sufficient to permit us to pay the principal and interest on our indebtedness. In addition, because our subsidiaries conduct all of our operations, repayment of our indebtedness is dependent on the generation of cash flow by our subsidiaries and their ability to make such cash available to CKE Restaurants or CKE, as the case may be, to pay such indebtedness. While the indentures governing the Notes limit the ability of our subsidiaries to incur consensual restrictions on their ability to pay dividends or make other intercompany payments to CKE Restaurants and CKE, these limitations are subject to certain qualifications and exceptions. In particular, the indenture governing the Senior Secured Notes and the Credit Facility contain restrictions on the ability of CKE Restaurants to make distributions to CKE, which restrictions may prevent CKE Restaurants from making distributions to CKE in an amount sufficient to enable CKE to repay the Toggle Notes when the Toggle Notes mature in 2016 or to enable CKE to pay interest on those Toggle Notes in cash. In the event that CKE Restaurants or CKE does not receive distributions from their respective subsidiaries, CKE Restaurants or CKE, as the case may be, may be unable to make required principal and interest payments on their respective indebtedness.
If our cash flows and capital resources are insufficient to fund our debt service obligations, we may be forced to reduce or delay investments and capital expenditures, or to sell assets, seek additional capital or restructure or refinance our indebtedness, including the Notes. Our ability to restructure or refinance our debt will depend on the condition of the capital markets and our financial condition at such time. Any refinancing of our debt could be at higher interest rates and may require us to comply with more onerous covenants, which could further restrict our business operations. The terms of existing or future debt instruments and the indentures governing the Notes may restrict us from adopting some of these alternatives. In addition, any failure to make payments of interest and principal on our outstanding indebtedness on a timely basis would likely result in a reduction of our credit rating, which could harm our ability to incur additional indebtedness. These alternative measures may not be successful and may not permit us to meet our scheduled debt service obligations.
Substantially all of material assets owned by CKE Restaurants and its wholly owned domestic subsidiaries, and CKE Restaurants’ common stock, are subject to a lien to secure obligations under the Credit Facility.
Obligations under our Credit Facility are secured by substantially all material assets owned by CKE Restaurants and its wholly owned domestic subsidiaries and by CKE Restaurants’ common stock. If CKE Restaurants is unable to repay all secured borrowings when due, whether at maturity or if declared due and payable following a default, the lenders would have the right to proceed against the assets securing the indebtedness and may sell these assets in order to repay those borrowings, which could materially harm our business, financial condition and results of operations. If the lenders proceed against CKE Restaurants’ common stock, then we may lose our ownership interests CKE Restaurants, which may significantly harm our business, financial condition and results of operations.
Risks Related to This Offering
There is no existing market for our common stock and we do not know if one will develop, which could impede your ability to sell your shares and may depress the market price of our common stock.
There has not been a public market for our common stock prior to this offering. We cannot predict the extent to which investor interest in us will lead to the development of an active trading market or how liquid that market might become. If an active trading market does not develop, you may have difficulty selling any of our common stock that you buy. The initial public offering price for the common stock will be determined by
29
Table of Contents
negotiations between us and the underwriters and may not be indicative of prices that will prevail in the open market following this offering. See “Underwriting.” Consequently, you may be unable to sell our common stock at prices equal to or greater than the price you pay in this offering.
Apollo controls us, and its interests may conflict with or differ from your interests as a stockholder.
After the consummation of this offering, Apollo will beneficially own approximately % of our common stock, assuming the underwriters do not exercise their option to purchase additional shares, or % if the underwriters exercise their option in full. As a result, Apollo will continue to have the ability to prevent any transaction that requires the approval of our stockholders, including the approval of significant corporate transactions such as mergers and the sale of substantially all of our assets.
The interests of Apollo could conflict with or differ from your interests as a holder of our common stock. For example, the concentration of ownership held by Apollo could delay, defer or prevent a change of control of us or impede a merger, takeover or other business combination that you as a stockholder may otherwise view favorably. Apollo is in the business of making or advising on investments in companies and holds, and may from time to time in the future acquire, interests in or provide advice to businesses that directly or indirectly compete with certain portions of our business or are suppliers or customers of ours. They may also pursue acquisitions that may be complementary to our business, and, as a result, those acquisition opportunities may not be available to us.
Our certificate of incorporation will provide that we expressly renounce any interest or expectancy in any business opportunity, transaction or other matter in which Apollo Management or any of its members, directors, employees or other affiliates (the “Apollo Group”) participates or desires or seeks to participate in, even if the opportunity is one that we would reasonably be deemed to have pursued if given the opportunity to do so. The renouncement does not apply to any business opportunities that are presented to an Apollo Group member solely in such person’s capacity as a member of our board of directors and with respect to which no other member of the Apollo Group independently receives notice or otherwise identifies such business opportunity prior to us becoming aware of it, or if the business opportunity is initially identified by the Apollo Group solely through the disclosure of information by or on behalf of us. See “Management—Apollo Approval of Certain Matters and Rights to Nominate Certain Directors,” “Certain Relationships and Related Party Transactions—Nominating Agreement” and “Description of Capital Stock—Certain Anti-Takeover, Limited Liability and Indemnification Provisions—Apollo Approval Rights.”
Apollo will continue to strongly influence or effectively control our decisions for so long as it beneficially owns a significant amount of our outstanding common stock.
So long as Apollo continues to beneficially own a significant amount of our equity, even if such amount is less than 50%, it may continue to be able to strongly influence or effectively control our decisions. For example, our bylaws will require the approval of a majority of the directors nominated by Apollo Management voting on the matter for certain important matters, including mergers and acquisitions, issuances of equity and the incurrence of debt, so long as Apollo beneficially owns at least 33 1/3% of our outstanding common stock. Upon completion of this offering, Apollo will continue to beneficially own more than 50% of our common stock. See “Management—Apollo Approval of Certain Matters and Rights to Nominate Certain Directors,” “Certain Relationships and Related Party Transactions—Nominating Agreement” and “Description of Capital Stock—Certain Anti-Takeover, Limited Liability and Indemnification Provisions—Apollo Approval Rights.”
We will be a “controlled company” within the meaning of the New York Stock Exchange rules and, as a result, will qualify for, and intend to rely on, exemptions from certain corporate governance requirements.
Upon the closing of this offering, Apollo will continue to control a majority of our voting common stock. As a result, we will be a “controlled company” within the meaning of the New York Stock Exchange corporate governance standards. Under the rules, a company of which more than 50% of the voting power is held by an
30
Table of Contents
individual, group or another company is a “controlled company” and may elect not to comply with certain New York Stock Exchange corporate governance requirements, including:
| • | the requirement that we have a majority of independent directors on our board of directors; |
| • | the requirement that we have a nominating and corporate governance committee that is composed entirely of independent directors with a written charter addressing the committee’s purpose and responsibilities; and |
| • | the requirement that we have a compensation committee that is composed entirely of independent directors with a written charter addressing the committee’s purpose and responsibilities. |
Following this offering, we intend to utilize the foregoing exemptions from the New York Stock Exchange corporate governance requirements. As a result, we will not have a majority of independent directors nor will our nominating and corporate governance and compensation committees consist entirely of independent directors and we will not be required to have an annual performance evaluation of the nominating and corporate governance and compensation committees. See “Management.” Accordingly, you will not have the same protections afforded to stockholders of companies that are subject to all of the New York Stock Exchange corporate governance requirements.
Certain underwriters are affiliates of our controlling stockholder and have interests in this offering beyond customary underwriting discounts and commissions.
Apollo Global Securities, LLC, an underwriter of this offering, is an affiliate of Apollo, our controlling stockholder. Since Apollo beneficially owns more than 10% of our outstanding common stock, a “conflict of interest” is deemed to exist under Rule 5121(f)(5)(B) of the Conduct Rules of the Financial Industry Regulatory Authority, or FINRA. Accordingly, this offering will be made in compliance with the applicable provisions of Rule 5121. Pursuant to Rule 5121, a “qualified independent underwriter” (as defined in Rule 5121) must participate in the preparation of the prospectus and perform its usual standard of due diligence with respect to the registration statement and this prospectus. has agreed to act as qualified independent underwriter for the offering. Although the qualified independent underwriter has participated in the preparation of the prospectus and conducted due diligence, we cannot assure you that this will adequately address any potential conflicts of interest. See “Underwriting (Conflicts of Interest).”
The price of our common stock may fluctuate significantly and you could lose all or part of your investment.
Volatility in the market price of our common stock may prevent you from being able to sell your common stock at or above the price you paid for your common stock. The market price for our common stock could fluctuate significantly for various reasons, including:
| • | our operating and financial performance and prospects; |
| • | changes in earnings estimates or recommendations by securities analysts who track our common stock or industry; |
| • | market and industry perception of our success, or lack thereof, in pursuing our growth strategy; |
| • | the number of shares to be publicly traded after this offering; and |
| • | sales of common stock by us, our stockholder, the Apollo Funds or its affiliated funds or members of our management team. |
In addition, the stock market has experienced significant price and volume fluctuations in recent years. This volatility has had a significant impact on the market price of securities issued by many companies, including companies in our industries. The changes frequently appear to occur without regard to the operating performance of the affected companies. Hence, the price of our common stock could fluctuate based upon factors that have little or nothing to do with us, and these fluctuations could materially reduce our share price.
31
Table of Contents
We currently have no plans to pay regular dividends on our common stock, so you may not receive funds without selling your common stock.
We currently have no plans to pay regular dividends on our common stock. Any payment of future dividends will be at the discretion of our board of directors and will depend on, among other things, our earnings, financial condition, capital requirements, level of indebtedness, contractual restrictions applying to the payment of dividends, and other considerations that our board of directors deems relevant. The terms of our Credit Facility and the indentures governing the Notes include limitations on our ability to pay dividends and/or the ability of our subsidiaries to pay dividends to us. Accordingly, you may have to sell some or all of your common stock in order to generate cash flow from your investment.
Future sales or the possibility of future sales of a substantial amount of our common stock may depress the price of shares of our common stock.
We may sell additional shares of common stock in subsequent public offerings or otherwise, including to finance acquisitions. We have authorized shares of common stock, of which shares will be outstanding upon consummation of this offering. The outstanding share number includes shares that we or the selling stockholder are selling in this offering, which may be resold immediately in the public market. The remaining outstanding shares are restricted from immediate resale under the lock-up agreements with the underwriters described in the “Underwriting” section of this prospectus, but may be sold into the market in the near future. These shares will become available for sale following the expiration of the lock-up agreements, which, without the prior consent of , is days after the date of this prospectus, subject to certain exceptions. Immediately after the expiration of the lock-up period, the shares will be eligible for resale under Rule 144 of the Securities Act of 1933, as amended (the “Securities Act”), subject to volume limitations.
As soon as practicable after the completion of this offering, we intend to file a registration statement on Form S-8 under the Securities Act covering shares of our common stock reserved for issuance under our Stock Incentive Plan, our new long-term incentive plan. Accordingly, shares of our common stock registered under such registration statement may become available for sale in the open market upon grants under the plan, subject to vesting restrictions, Rule 144 limitations applicable to our affiliates and the contractual lock-up provisions described below.
We cannot predict the size of future issuances of our common stock or the effect, if any, that future issuances and sales of our common stock will have on the market price of our common stock. Sales of substantial amounts of our common stock (including any shares issued in connection with an acquisition), or the perception that such sales could occur, may adversely affect prevailing market prices for our common stock.
Our organizational documents may impede or discourage a takeover, which could deprive our investors of the opportunity to receive a premium for their shares.
Provisions of our certificate of incorporation and bylaws may make it more difficult for, or prevent a third party from, acquiring control of us without the approval of our board of directors. These provisions include:
| • | having a classified board of directors; |
| • | establishing limitations on the removal of directors; |
| • | prohibiting cumulative voting in the election of directors; |
| • | empowering only the board to fill any vacancy on our board of directors, whether such vacancy occurs as a result of an increase in the number of directors or otherwise, and requiring that, as long as Apollo continues to beneficially own at least 33 1/3% of our common stock, any vacancy resulting from the death, removal or resignation of an Apollo Management designee be filled by a majority of the remaining directors nominated by Apollo Management; |
32
Table of Contents
| • | as long as Apollo continues to beneficially own more than 50.1% of our common stock, granting Apollo Management the right to increase the size of our board of directors and to fill the resulting vacancies at any time; |
| • | authorizing the issuance of “blank check” preferred stock without any need for action by stockholders; |
| • | prohibiting stockholders from acting by written consent or calling a special meeting if less than 50.1% of our outstanding common stock is beneficially owned by Apollo; |
| • | requiring the approval of a majority of the directors nominated by Apollo Management voting on the matter to approve certain business combinations and certain other significant matters so long as Apollo beneficially owns at least 33 1/3% of our common stock; and |
| • | establishing advance notice requirements for nominations for election to our board of directors or for proposing matters that can be acted on by stockholders at stockholder meetings. |
Our issuance of shares of preferred stock could delay or prevent a change in control of us. Our board of directors has the authority to cause us to issue, without any further vote or action by the stockholders, shares of preferred stock, par value $0.01 per share, in one or more series, to designate the number of shares constituting any series, and to fix the rights, preferences, privileges and restrictions thereof, including dividend rights, voting rights, rights and terms of redemption, redemption price or prices and liquidation preferences of such series. The issuance of shares of our preferred stock may have the effect of delaying, deferring or preventing a change in control without further action by the stockholders, even where stockholders are offered a premium for their shares.
Our bylaws will also require the approval of a majority of directors nominated by Apollo Management voting on the matter for certain important matters, including mergers and acquisitions, issuances of equity and the incurrence of debt, as long as Apollo beneficially owns at least 33 1/3% of our outstanding common stock. In addition, as long as Apollo beneficially owns a majority of our outstanding common stock, Apollo Management will be able to control all matters requiring stockholder approval, including the election of directors, amendment of our certificate of incorporation and certain corporate transactions. See “Management—Apollo Approval of Certain Matters and Rights to Nominate Certain Directors.” Together, these charter, bylaw and statutory provisions could make the removal of management more difficult and may discourage transactions that otherwise could involve payment of a premium over prevailing market prices for our common stock. Furthermore, the existence of the foregoing provisions, as well as the significant common stock beneficially owned by Apollo and its rights to nominate a specified number of directors in certain circumstances, could limit the price that investors might be willing to pay in the future for shares of our common stock. They could also deter potential acquirers of us, thereby reducing the likelihood that you could receive a premium for your common stock in an acquisition.
You will experience an immediate and substantial dilution in the net tangible book deficit of the common stock you purchase.
We expect to have a net tangible book deficit after this offering of $ per share. Based on an assumed initial public offering price of $ per share, the midpoint of the estimated offering range set forth on the cover page of this prospectus, you will experience immediate and substantial dilution of approximately $ per share in net tangible book deficit of the common stock you purchase in this offering. See “Dilution,” including the discussion of the effects on dilution from a change in the price of this offering.
The additional requirements of having a class of publicly traded equity securities may strain our resources and distract management.
Even though CKE Restaurants currently files reports with the SEC, after the consummation of this offering, we will be subject to additional reporting requirements of the Securities Exchange Act of 1934 (“the Exchange Act”), the Sarbanes-Oxley Act of 2002, (the “Sarbanes-Oxley Act”), and the Dodd-Frank Wall Street Reform
33
Table of Contents
and Consumer Protection Act (“the Dodd-Frank Act”). The Dodd-Frank Act effects comprehensive changes to public company governance and disclosures in the United States and will subject us to additional federal regulation. We cannot predict with any certainty the requirements of the regulations ultimately adopted or how the Dodd-Frank Act and such regulations will impact the cost of compliance for a company with publicly traded common stock. We are currently evaluating and monitoring developments with respect to the Dodd-Frank Act and other new and proposed rules and cannot predict or estimate the amount of the additional costs we may incur or the timing of such costs. These laws, regulations and standards are subject to varying interpretations, in many cases due to their lack of specificity, and, as a result, their application in practice may evolve over time as new guidance is provided by regulatory and governing bodies. This could result in continuing uncertainty regarding compliance matters and higher costs necessitated by ongoing revisions to disclosure and governance practices. We intend to invest resources to comply with evolving laws, regulations and standards, and this investment may result in increased general and administrative expenses and a diversion of management’s time and attention from revenue-generating activities to compliance activities. If our efforts to comply with new laws, regulations and standards differ from the activities intended by regulatory or governing bodies due to ambiguities related to practice, regulatory authorities may initiate legal proceedings against us and our business may be harmed. We also expect that being a company with publicly traded common stock and these new rules and regulations will make it more expensive for us to obtain director and officer liability insurance, and we may be required to accept reduced coverage or incur substantially higher costs to obtain coverage. These factors could also make it more difficult for us to attract and retain qualified members of our board of directors, particularly to serve on our audit committee, and qualified executive officers.
The Sarbanes-Oxley Act requires that we maintain effective disclosure controls and procedures and internal control for financial reporting. These requirements may place a strain on our systems and resources. Under Section 404 of the Sarbanes-Oxley Act, we will be required to include a report of management on our internal control over financial reporting in our Annual Reports on Form 10-K. After consummation of this offering, our independent public accountants auditing our financial statements must attest to the effectiveness of our internal control over financial reporting. This requirement will first apply to our Annual Report on Form 10-K for our fiscal year ending January 31, 2014. In order to maintain and improve the effectiveness of our disclosure controls and procedures and internal control over financial reporting, significant resources and management oversight will be required. This may divert management’s attention from other business concerns, which could have a material adverse effect on our business, financial condition, results of operations and cash flows. If we are unable to conclude that our disclosure controls and procedures and internal control over financial reporting are effective, or if our independent public accounting firm is unable to provide us with an unqualified report on our internal control over financial reporting in future years, investors may lose confidence in our financial reports and our stock price may decline.
We have broad discretion to apply the proceeds to us from this offering, and we may use them in ways that may not enhance our operating results or the price of our common stock.
Our management will have broad discretion over the use of proceeds from this offering, and we could spend the proceeds from this offering in ways our stockholders may not agree with or that do not yield a favorable return, if at all. If we do not invest or apply the proceeds of this offering in ways that improve our operating results, we may fail to achieve expected financial results, which could cause our stock price to decline.
34
Table of Contents
CAUTIONARY NOTICE REGARDING FORWARD-LOOKING STATEMENTS
This prospectus includes statements relating to our future plans and developments, financial goals and operating performance that are based on our current beliefs and assumptions. Although we do not make forward-looking statements unless we believe we have a reasonable basis for doing so, we cannot guarantee their accuracy. Such statements are subject to risks and uncertainties that are often difficult to predict, are beyond our control, and which may cause results to differ materially from expectations. Factors that could cause our results to differ materially from those described include, but are not limited to:
| • | our ability to compete with other restaurants, supermarkets and convenience stores for customers, employees, restaurant locations and franchisees; |
| • | changes in consumer preferences, perceptions and spending patterns; |
| • | changes in food, packaging and supply costs; |
| • | the ability of our key suppliers to continue to deliver premium-quality products to us at moderate prices; |
| • | our ability to successfully enter new markets, complete construction of new restaurants and complete remodels of existing restaurants; |
| • | changes in general economic conditions and the geographic concentration of our restaurants, which may affect our business; |
| • | our ability to attract and retain key personnel; |
| • | our franchisees’ willingness to participate in our strategy; |
| • | risks associated with implementing our growth strategy; |
| • | the operational and financial success of our franchisees; |
| • | the willingness of our vendors and service providers to supply us with goods and services pursuant to customary credit arrangements; |
| • | risks associated with operating in international locations; |
| • | the effect of the media’s reports regarding food-borne illnesses, food tampering and other health-related issues on our reputation and our ability to procure or sell food products; |
| • | the seasonality of our operations; |
| • | the effect of increasing labor costs including healthcare related costs; |
| • | increased insurance and/or self-insurance costs; |
| • | our ability to comply with existing and future health, employment, environmental and other government regulations; |
| • | our ability to adequately protect our intellectual property; |
| • | the adverse affect of litigation in the ordinary course of business; |
| • | a significant failure, interruption or security breach of our computer systems or information technology; |
| • | catastrophic events, including war, terrorism and other international conflicts, public health issues or natural causes; |
| • | our substantial leverage, which could limit our ability to raise capital, react to economic changes or meet obligations under our indebtedness; |
35
Table of Contents
| • | the effect of restrictive covenants in the indentures governing the Notes and the Credit Facility on our business; |
| • | the potentially conflicting interests of our controlling stockholder and our creditors; and |
| • | other factors as discussed under the caption “Risk Factors” in this prospectus. |
Investors are urged to carefully review and consider the various disclosures made by us, which attempt to advise interested parties of the risks, uncertainties, and other factors that may affect our future plans and developments, financial goals, operating performance, and the value of our securities. As a result of these and other factors, we cannot assure you that the forward-looking statements in this prospectus will prove to be accurate. Furthermore, if our forward-looking statements prove to be inaccurate, the impact may be material. In light of the significant uncertainties in these forward-looking statements, you should not regard these statements as a representation or warranty by us or any other person that we will achieve our objectives and plans in any specified time frame, or at all.
The forward looking statements in this prospectus speak only as of the date of this prospectus. We expressly disclaim any obligation to publicly update or revise any forward looking statement, whether to conform such statement to actual results or as a result of changes in our opinions or expectations, new information, future events or otherwise, in each case except as required by law.
36
Table of Contents
Assuming an initial public offering price of $ per share, the midpoint of the range set forth on the cover page of this prospectus, we estimate that we will receive net proceeds from this offering of approximately $ million, after deducting underwriting discounts and commissions and other estimated expenses of $ million payable by us. We will not receive any net proceeds from the sale by the selling stockholder.
Each $1.00 increase (decrease) in the assumed initial public offering price of $ per share would increase (decrease) the net proceeds to us from this offering by $ million, assuming the number of shares offered by us, as set forth on the cover page of this prospectus, remains the same and after deducting the estimated underwriting discounts and commissions and estimated expenses payable by us. An increase (decrease) of 1,000,000 in the number of shares we are offering would increase (decrease) the net proceeds to us from this offering, after deducting the estimated underwriting discounts and commissions and estimated expenses payable by us, by approximately $ million, assuming the initial public offering price per share remains the same.
We intend to use the net proceeds that we receive (i) to repay a portion of the Senior Secured Notes and to pay the related early redemption premiums and accrued interest and (ii) for general corporate purposes. The indenture governing the Senior Secured Notes allows us to redeem up to 35% of the original aggregate principal amount of those notes with the net proceeds of certain equity offerings, including this offering, at a redemption price of 111.375% of the aggregate principal amount of the Senior Secured Notes being redeemed (plus accrued and unpaid interest); provided that at least 65% of the original aggregate principal amount of the Senior Secured Notes ($390 million) remains outstanding after such redemption. The Senior Secured Notes were issued in connection with the Merger. The Senior Secured Notes mature on July 15, 2018, and bear interest at a rate of 11.375% per annum. In addition, upon the completion of this offering, we will pay from cash on hand Apollo Management or its affiliates a fee of $ million (plus any unreimbursed expenses) in connection with the termination of our management services agreement, as described under “Certain Relationships and Related Party Transactions—Management Services Fee.”
We currently intend to retain all future earnings, if any, for use in the operation of our business and to fund future growth. In addition, our Credit Facility and the indentures governing the Notes limit our ability to pay dividends or other distributions on our common stock. See “Description of Indebtedness.” The decision whether to pay dividends will be made by our board of directors in light of conditions then existing, including factors such as our results of operations, financial condition and requirements, business conditions and covenants under any applicable contractual arrangements.
37
Table of Contents
The following table sets forth our cash and cash equivalents and our capitalization as of May 21, 2012:
| • | on an actual basis; |
| • | on an as adjusted basis giving effect to our sale of shares of common stock in this offering at an assumed offering price of $ , which is the midpoint of the range listed on the cover page of this prospectus, and our expected use of the net proceeds of this offering. |
You should read this table in conjunction with our unaudited condensed consolidated financial statements as of and for the sixteen weeks ended May 21, 2012 and related notes thereto, “Management’s Discussion and Analysis of Financial Condition and Results of Operations” and “Use of Proceeds” included elsewhere in this prospectus.
| As of May 21, 2012 | ||||||||
| Actual | As Adjusted(1) |
|||||||
| (dollars in thousands, except par values) |
||||||||
| Cash and cash equivalents |
$ | 125,447 | $ | |||||
|
|
|
|
|
|||||
| Long-term debt and capital lease obligations: |
||||||||
| Toggle Notes(2) |
$ | 209,556 | $ | |||||
| Senior Secured Notes(3) |
523,544 | |||||||
| Borrowing under Credit Facility(4) |
— | |||||||
| Capital lease obligations |
40,602 | |||||||
| Other indebtedness |
388 | |||||||
|
|
|
|
|
|||||
| Total long-term debt and capital lease obligations |
774,090 | |||||||
|
|
|
|
|
|||||
| Stockholder’s equity: |
||||||||
| Common stock, $0.01 par value; 100 shares authorized, issued and outstanding, actual; shares issued, as adjusted(5) |
— | |||||||
| Additional paid-in capital |
458,669 | |||||||
| Accumulated deficit |
(230,661 | ) | ||||||
|
|
|
|
|
|||||
| Total stockholder’s equity |
228,008 | |||||||
|
|
|
|
|
|||||
| Total capitalization |
$ | 1,002,098 | $ | |||||
|
|
|
|
|
|||||
| (1) | Each $1.00 increase (decrease) in the assumed initial public offering price of $ per share (the midpoint of the range set forth on the cover page of this prospectus) would increase (decrease) each of as adjusted cash and cash equivalents, additional paid-in capital, total stockholders’ equity and total capitalization by $ million, assuming the number of shares offered by us, as set forth on the cover page of this prospectus, remains the same and after deducting the estimated underwriting discounts and commissions and estimated expenses payable by us. An increase (decrease) of 1,000,000 in the number of shares we are offering would increase (decrease) each of as adjusted cash and cash equivalents, additional paid in capital, total stockholders’ equity and total capitalization by approximately $ million, assuming the initial public offering price per share remains the same, after deducting the estimated underwriting discounts and commissions and estimated expenses payable by us. |
| (2) | The $212,691 aggregate principal amount of the Toggle Notes is reduced by the remaining original issue discount of $3,135 as of May 21, 2012 that will accrete and be recorded to interest expense through the maturity of the Toggle Notes. The Toggle Notes exclude the $10,508 principal amount of Toggle Notes held by CKE Restaurants since these Toggle Notes have been constructively retired. |
| (3) | The $532,122 aggregate principal amount of the Senior Secured Notes is reduced by the remaining original issue discount of $8,578 as of May 21, 2012 that will accrete and be recorded to interest expense through the |
38
Table of Contents
| maturity of the Senior Secured Notes. On June 15, 2012, the holders of the Senior Secured Notes were notified that we will redeem $60,000 aggregate principal amount of Senior Secured Notes on July 16, 2012 at a redemption price of 103% of their principal amount. |
| (4) | The Credit Facility provides for facility loans, swingline loans and letters of credit, in an aggregate amount of up to $100,000. As of May 21, 2012, we had no outstanding loan borrowings, $30,913 of outstanding letters of credit, and remaining availability of $69,087 under the Credit Facility. |
| (5) | We intend to complete a for one stock split of our common stock prior to the completion of this offering. All share amounts have been retroactively adjusted to give effect to this stock split. |
39
Table of Contents
Dilution is the amount by which the offering price paid by the purchasers of the common stock to be sold in this offering exceeds the net tangible book value (deficit) per share of common stock after the offering. Net tangible book value per share is determined at any date by subtracting our total liabilities from the total book value of our tangible assets and dividing the difference by the number of shares of common stock deemed to be outstanding at that date. There will be shares of our common stock reserved for future awards under our Stock Incentive Plan as of the consummation of this offering.
Our net tangible book deficit as of May 21, 2012 was $409.3 million, or $ per share. After giving effect to the receipt of approximately $ million of estimated net proceeds from our sale of shares of common stock in this offering at an assumed offering price of $ per share, which represents the midpoint of the range set forth on the front cover of this prospectus, our as adjusted net tangible book deficit as of May 21, 2012 would have been approximately $ million, or $ per share. This represents an immediate decrease in our net tangible book deficit of $ per share to our existing stockholder and an immediate dilution of $ per share to new investors purchasing shares of common stock in the offering. The following table illustrates this substantial and immediate per share dilution to new investors:
| Per Share | ||||||
| Assumed initial public offering price per share |
$ | |||||
| Net tangible book value (deficit) before the offering |
||||||
|
|
||||||
| Increase per share attributable to investors in the offering |
||||||
|
|
||||||
| As adjusted net tangible book value (deficit) after the offering |
||||||
|
|
|
|||||
| Dilution per share to new investors |
$ | |||||
|
|
|
|||||
A $1.00 increase (decrease) in the assumed initial public offering price of $ per share would decrease (increase) our as adjusted net tangible book value (deficit) by $ million, or $ per share, and increase (decrease) the dilution per share to new investors in this offering by $ , assuming the number of shares offered by us, as set forth on the cover page of this prospectus, remains the same and after deducting the estimated underwriting discounts and commissions and estimated expenses payable by us. An increase (decrease) of 1,000,000 in the number of shares we are offering would decrease (increase) our as adjusted net tangible book deficit by approximately $ million, or $ per share, and would decrease (increase) dilution to investors in this offering by $ per share, assuming the initial public offering price per share remains the same.
The following table summarizes on an as adjusted basis as of May 21, 2012, giving effect to:
| • | the total number of shares of common stock purchased from us; |
| • | the total consideration paid to us, assuming an initial public offering price of $ per share (before deducting the estimated underwriting discount and commissions and offering expenses payable by us in connection with this offering); and |
| • | the average price per share paid by our existing stockholder and by new investors purchasing shares in this offering: |
| Shares Purchased | Total Consideration | Average Price Per Share |
||||||||||||||||
| Number | Percent | Amount | Percent | |||||||||||||||
| Existing stockholder |
$ | % | $ | |||||||||||||||
| Investors in the offering |
% | |||||||||||||||||
|
|
|
|
|
|
|
|
||||||||||||
| Total |
100 | % | $ | 100 | % | $ | ||||||||||||
|
|
|
|
|
|
|
|
||||||||||||
40
Table of Contents
A $1.00 increase (decrease) in the assumed initial public offering price of $ per share (the midpoint of the range set forth on the cover page of this prospectus) would increase (decrease) total consideration paid by new investors, total consideration paid by all stockholders and the average price per share by $ million, $ million and $ , respectively, assuming the number of shares offered by us, as set forth on the cover page of this prospectus, remains the same. An increase of 1,000,000 in the number of shares we are offering would increase total consideration paid by new investors, total consideration paid by all stockholders and the average price per share paid by all stockholders by $ million, $ million and $ , respectively, assuming the initial public offering price stays the same. A decrease of 1,000,000 in the number of shares we are offering would decrease total consideration paid by new investors, total consideration paid by all stockholders and the average price per share paid by all stockholders by $ million, $ million and $ , respectively, assuming the initial offering price stays the same.
The tables and calculations above also assume no exercise of the underwriters’ option to purchase additional shares. If the underwriters exercise their option to purchase additional shares in full, then new investors would purchase shares, or approximately % of shares outstanding, the total consideration paid by new investors would increase to $ , or % of the total consideration paid (based on the midpoint of the range set forth on the cover page of this prospectus), and the additional dilution per share to new investors would be $ .
41
Table of Contents
SELECTED HISTORICAL FINANCIAL INFORMATION AND OTHER DATA
The selected financial information for the fiscal year ended January 31, 2012, the twenty-nine weeks ended January 31, 2011, the twenty-four weeks ended July 12, 2010 and the fiscal year ended January 31, 2010 and as of January 31, 2012 and 2011 have been derived from our Consolidated Financial Statements, including the related notes thereto, which have been audited by KPMG LLP, an independent registered public accounting firm, and are included elsewhere in this prospectus. The selected financial data as of May 21, 2012 and for the sixteen weeks ended May 21, 2012 and May 23, 2011 have been derived from our unaudited Condensed Consolidated Financial Statements, including the related notes thereto, which are included elsewhere in this prospectus and have been prepared on a basis consistent with our annual audited Consolidated Financial Statements. The selected financial information for the fiscal years ended January 31, 2009 and 2008 and as of January 31, 2010, 2009 and 2008, have been derived from our audited consolidated financial statements, including the related notes thereto, which are not included in this prospectus. Periods ended on or prior to July 12, 2010 reflect the consolidated results of our subsidiary, CKE Restaurants, prior to the Merger, and the periods beginning after July 12, 2010 reflect the results of CKE and its consolidated subsidiaries after the Merger. We refer to the financial statements prior to the Merger as “Predecessor” and to those after the Merger as “Successor.”
The following information should be read in conjunction with “Risk Factors,” “Management’s Discussion and Analysis of Financial Condition and Results of Operations” and our consolidated financial statements and related notes thereto included elsewhere in this prospectus.
| Successor | Predecessor | |||||||||||||||||||||||||||||||
| Sixteen Weeks Ended May 21, 2012 |
Sixteen Weeks Ended May 23, 2011 |
Fiscal Year Ended January 31, 2012(1) |
Twenty- Nine Weeks Ended January 31, 2011(1)(2) |
Twenty- Four Weeks Ended July 12, 2010(1)(2) |
Fiscal Year Ended January 31, 2010(1) |
Fiscal Year Ended January 31, 2009(1) |
Fiscal Year Ended January 31, 2008(1) |
|||||||||||||||||||||||||
| (dollars in thousands, except per share amounts) | ||||||||||||||||||||||||||||||||
| Consolidated Statements of Operations Data: |
||||||||||||||||||||||||||||||||
| Revenue: |
||||||||||||||||||||||||||||||||
| Company-operated restaurants |
$ | 361,466 | $ | 351,604 | $ | 1,122,430 | $ | 598,753 | $ | 500,531 | $ | 1,084,474 | $ | 1,131,312 | $ | 1,201,577 | ||||||||||||||||
| Franchised restaurants and other |
50,865 | 48,979 | 157,897 | 80,355 | 151,588 | 334,259 | 351,398 | 333,057 | ||||||||||||||||||||||||
|
|
|
|
|
|
|
|
|
|
|
|
|
|
|
|
|
|||||||||||||||||
| Total revenue |
$ | 412,331 | $ | 400,583 | $ | 1,280,327 | $ | 679,108 | $ | 652,119 | $ | 1,418,733 | $ | 1,482,710 | $ | 1,534,634 | ||||||||||||||||
|
|
|
|
|
|
|
|
|
|
|
|
|
|
|
|
|
|||||||||||||||||
| Operating income(3) |
$ | 30,906 | $ | 19,573 | $ | 68,894 | $ | 2,735 | $ | 22,483 | $ | 79,495 | $ | 84,020 | $ | 88,327 | ||||||||||||||||
| Interest expense(4) |
(31,310 | ) | (28,850 | ) | (98,124 | ) | (43,681 | ) | (8,617 | ) | (19,254 | ) | (28,609 | ) | (33,033 | ) | ||||||||||||||||
| Income tax (benefit) expense |
(5,951 | ) | (3,176 | ) | (11,609 | ) | (11,411 | ) | 7,772 | 14,978 | 21,533 | 24,659 | ||||||||||||||||||||
| Income (loss) from continuing operations(5) |
6,696 | (5,302 | ) | (19,279 | ) | (27,890 | ) | (7,515 | ) | 48,198 | 36,956 | 35,072 | ||||||||||||||||||||
| Earnings (loss) per share from continuing operations (basic and diluted) |
||||||||||||||||||||||||||||||||
| Other Financial Data: |
||||||||||||||||||||||||||||||||
| Adjusted EBITDA(6) |
$ | 61,574 | $ | 51,499 | $ | 165,878 | $ | 90,216 | $ | 73,761 | $ | 165,464 | $ | 169,495 | $ | 171,359 | ||||||||||||||||
| Adjusted EBITDA margin(6) |
14.9 | % | 12.9 | % | 13.0 | % | 13.3 | % | 11.3 | % | 11.7 | % | 11.4 | % | 11.2 | % | ||||||||||||||||
| Total capital expenditures |
$ | 15,725 | $ | 13,581 | $ | 52,423 | $ | 29,360 | $ | 33,738 | $ | 102,428 | $ | 116,513 | $ | 133,816 | ||||||||||||||||
| Cash paid for interest, net of amounts capitalized |
3,549 | 1,656 | 72,944 | 53,374 | 8,299 | 19,590 | 21,753 | 20,235 | ||||||||||||||||||||||||
42
Table of Contents
| Sixteen Weeks Ended May 21, 2012 |
Fiscal Year Ended January 31, | |||||||||||||||||||||||
| 2012 | 2011 | 2010 | 2009 | 2008 | ||||||||||||||||||||
| (dollars in thousands) | ||||||||||||||||||||||||
| Other Operating Data: |
||||||||||||||||||||||||
| Franchised Carl’s Jr. and Hardee’s restaurant sales(6) |
$ | 2,481,092 | $ | 2,367,172 | $ | 2,240,175 | $ | 2,209,235 | $ | 2,049,896 | ||||||||||||||
| Blended company-operated average unit volume (trailing-52 weeks) |
$ | 1,268 | 1,257 | 1,207 | 1,206 | 1,232 | 1,162 | |||||||||||||||||
| Blended company-operated same-store sales increase (decrease) |
2.6 | % | 3.5 | % | (0.8 | )% | (3.9 | )% | 1.7 | % | 1.5 | % | ||||||||||||
| Restaurants open (at end of period): |
||||||||||||||||||||||||
| Company-operated |
892 | 892 | 890 | 898 | 899 | 967 | ||||||||||||||||||
| Domestic franchised |
1,930 | 1,928 | 1,910 | 1,905 | 1,901 | 1,834 | ||||||||||||||||||
| International franchised |
441 | 423 | 359 | 338 | 316 | 282 | ||||||||||||||||||
|
|
|
|
|
|
|
|
|
|
|
|
|
|||||||||||||
| Total restaurants |
3,263 | 3,243 | 3,159 | 3,141 | 3,116 | 3,083 | ||||||||||||||||||
|
|
|
|
|
|
|
|
|
|
|
|
|
|||||||||||||
| International franchise restaurants as % of total restaurants (at end of period) |
13.5 | % | 13.0 | % | 11.4 | % | 10.8 | % | 10.1 | % | 9.1 | % | ||||||||||||
| Number of foreign countries with restaurants (at end of period) |
25 | 25 | 18 | 16 | 14 | 14 | ||||||||||||||||||
| Successor | Predecessor | |||||||||||||||||||||||
| May 21, 2012 |
January 31, 2012 |
January 31, 2011 |
January 31, 2010 |
January 31, 2009 |
January 31, 2008 |
|||||||||||||||||||
| (dollars in thousands) | ||||||||||||||||||||||||
| Consolidated Balance Sheet Data: |
||||||||||||||||||||||||
| Cash and cash equivalents |
$ | 125,447 | $ | 64,585 | $ | 42,586 | $ | 18,246 | $ | 17,869 | $ | 19,993 | ||||||||||||
| Total assets |
1,521,524 | 1,478,087 | 1,496,166 | 823,543 | 804,687 | 791,711 | ||||||||||||||||||
| Total long-term debt and capital lease obligations, including current portion |
774,090 | 764,703 | 638,532 | 329,008 | 357,450 | 392,036 | ||||||||||||||||||
| Stockholders’ equity |
228,008 | 219,895 | 424,769 | 236,175 | 194,276 | 145,242 | ||||||||||||||||||
| (1) | Our fiscal year is 52 or 53 weeks, ending the last Monday in January. For clarity of presentation, we generally label all fiscal years presented as if the fiscal year ended January 31. The combined Successor twenty-nine weeks ended January 31, 2011 and Predecessor twenty-four weeks ended July 12, 2010 contain 53 weeks; all other fiscal years presented contain 52 weeks. |
| (2) | See “Management’s Discussion and Analysis of Financial Condition and Results of Operations — Supplemental Discussion of Historical and Pro Forma Financial Information” for a supplemental discussion of pro forma condensed consolidated financial information for the fiscal year ended January 31, 2011, which combines the Predecessor twenty-four weeks ended July 12, 2010 and Successor twenty-nine weeks ended January 31, 2011, adjusted to give effect to the Transactions as if they had occurred on January 26, 2010, the first day of our fiscal year ended January 31, 2011. |
| (3) | The sixteen weeks ended May 21, 2012, the sixteen weeks ended May 23, 2011, fiscal 2012, the Successor twenty-nine weeks ended January 31, 2011, the Predecessor twenty-four weeks ended July 12, 2010, fiscal 2010, fiscal 2009 and fiscal 2008 include $401, $511, $(6,018), $1,683, $590, $4,695, $4,139 and $(577), respectively, of facility action charges, net, which are included in operating income. Additionally, $10,587 and $1,521 of share-based compensation expense related to the acceleration of vesting of stock options and awards in connection with the Merger are included in operating income for the Successor twenty-nine weeks ended January 31, 2011 and Predecessor twenty-four weeks ended July 12, 2010, respectively. Operating income also includes transaction-related costs of $351, $545, $20,003 and $13,691 for the sixteen weeks ended May 23, 2011, fiscal 2012, the Successor twenty-nine weeks ended January 31, 2011 and the |
43
Table of Contents
| Predecessor twenty-four weeks ended July 12, 2010, respectively, and a gain of $3,442 on the sale of our Carl’s Jr. distribution center assets in the Predecessor twenty-four weeks ended July 12, 2010. |
| (4) | The Predecessor twenty-four weeks ended July 12, 2010, fiscal 2010, fiscal 2009 and fiscal 2008 include $3,113, $6,803, $9,010 and $11,380, respectively, of interest expense related to changes in the fair value of our Predecessor interest rate swap agreements. |
| (5) | The Predecessor twenty-four weeks ended July 12, 2010 includes a termination fee of $14,283 related to a prior merger agreement. |
| (6) | “Adjusted EBITDA” represents net income (loss), adjusted to exclude income taxes, interest income and expense, asset impairments, facility action charges, depreciation and amortization, management fees, the effects of acquisition accounting adjustments, and certain non-cash and other items described below. “Adjusted EBITDA margin” is defined as Adjusted EBITDA divided by total revenue. See “Non-GAAP Financial Measures.” |
A reconciliation of net income (loss) to Adjusted EBITDA is provided below.
| Successor | Predecessor | |||||||||||||||||||||||||||||||
| Sixteen Weeks Ended May 21, 2012 |
Sixteen Weeks Ended May 23, 2011 |
Fiscal Year Ended January 31, 2012 |
Twenty-Nine Weeks Ended January 31, 2011(a) |
Twenty-Four Weeks Ended July 12, 2010(a) |
Fiscal Year Ended January 31, 2010 |
Fiscal Year Ended January 31, 2009 |
Fiscal Year Ended January 31, 2008 |
|||||||||||||||||||||||||
| (dollars in thousands) | ||||||||||||||||||||||||||||||||
| Net income (loss) |
$ | 6,696 | $ | (5,302 | ) | $ | (19,279 | ) | $ | (27,890 | ) | $ | (7,515 | ) | $ | 48,198 | $ | 36,956 | $ | 31,076 | ||||||||||||
| Interest expense |
31,310 | 28,850 | 98,124 | 43,681 | 8,617 | 19,254 | 28,609 | 33,055 | ||||||||||||||||||||||||
| Income tax (benefit) expense |
(5,951 | ) | (3,176 | ) | (11,609 | ) | (11,411 | ) | 7,772 | 14,978 | 21,533 | 26,612 | ||||||||||||||||||||
| Depreciation and amortization |
25,467 | 24,938 | 82,044 | 41,881 | 33,703 | 71,064 | 63,497 | 64,102 | ||||||||||||||||||||||||
| Facility action charges, net |
401 | 511 | (6,018 | ) | 1,683 | 590 | 4,695 | 4,139 | (1,282 | ) | ||||||||||||||||||||||
| Gain on sale of distribution center assets |
— | — | — | — | (3,442 | ) | — | — | — | |||||||||||||||||||||||
| Transaction-related costs(b) |
— | 351 | 545 | 20,003 | 27,974 | 823 | — | — | ||||||||||||||||||||||||
| Management fees(c) |
765 | 767 | 2,490 | 1,260 | — | — | — | — | ||||||||||||||||||||||||
| Share-based compensation expense |
1,417 | 1,469 | 4,593 | 13,246 | 4,710 | 8,156 | 12,534 | 11,378 | ||||||||||||||||||||||||
| Losses on asset and other disposals |
221 | 713 | 1,801 | 4,384 | 2,116 | 2,341 | 2,353 | 4,429 | ||||||||||||||||||||||||
| Difference between U.S. GAAP rent and cash rent |
835 | 618 | 2,690 | 1,833 | 527 | 989 | 2,729 | 2,902 | ||||||||||||||||||||||||
| Other, net(d) |
413 | 1,760 | 10,497 | 1,546 | (1,291 | ) | (5,034 | ) | (2,855 | ) | (913 | ) | ||||||||||||||||||||
|
|
|
|
|
|
|
|
|
|
|
|
|
|
|
|
|
|||||||||||||||||
| Adjusted EBITDA(e) |
$ | 61,574 | $ | 51,499 | $ | 165,878 | $ | 90,216 | $ | 73,761 | $ | 165,464 | $ | 169,495 | $ | 171,359 | ||||||||||||||||
|
|
|
|
|
|
|
|
|
|
|
|
|
|
|
|
|
|||||||||||||||||
| (a) | The combined successor twenty-nine weeks ended January 31, 2011 and Predecessor twenty-four weeks ended July 12, 2010 contain 53 weeks. We estimate the extra week resulted in additional Adjusted EBITDA of approximately $2,000. |
| (b) | Transaction-related costs include investment banking, legal, and other costs related to the Merger, as well as costs related to the termination of a prior merger agreement. |
44
Table of Contents
| (c) | Represents the amounts associated with the management services agreement with Apollo Management for on-going investment banking, consulting, and financial planning services, which are included in general and administrative expense. |
| (d) | Other, net includes the net impact of acquisition accounting, early extinguishment of debt, executive retention bonus, severance costs and disposition business expense. For the fiscal year ended January 31, 2012, other, net also includes a charge of $1,976 related to the out-of-period Insurance Reserve Adjustment described in more detail in Note 1 of Notes to Consolidated Financial Statements included elsewhere in this prospectus. For the Predecessor twenty-four weeks ended July 12, 2010 and the fiscal years ended January 31, 2010, 2009 and 2008, other, net also includes an adjustment to remove the Adjusted EBITDA associated with our Carl’s Jr. distribution centers, which we sold on July 2, 2010. |
| (e) | In comparing Adjusted EBITDA for periods before and after the Merger, we estimate that we would have had cost savings of $15, $955, $1,510, $1,470 and $1,535 in the Successor twenty-nine weeks ended January 31, 2011, the Predecessor twenty-four weeks ended July 12, 2010, fiscal 2010, fiscal 2009 and fiscal 2008, respectively, had we been a privately held company for those years. Adjusted EBITDA would have been $90,231, $74,716, $166,974, $170,965 and $172,894, respectively, for such fiscal periods had those estimated cost savings been realized. |
| (6) | Franchised restaurant operations are not included in our Consolidated Statements of Operations; however, franchised restaurants sales result in royalties and rental revenues, which are included in franchised restaurant and other revenue. |
45
Table of Contents
MANAGEMENT’S DISCUSSION AND ANALYSIS OF FINANCIAL CONDITION AND RESULTS OF OPERATIONS
Management’s Discussion and Analysis of Financial Condition and Results of Operations (“MD&A”) is intended to provide a reader of our financial statements with a narrative from the perspective of our management on our financial condition, results of operations, liquidity and certain other factors that may affect our future results. Our MD&A is presented in the following sections:
| • | Overview |
| • | Trends and Uncertainties |
| • | Operating Review |
| • | Supplemental Discussion of Historical and Pro Forma Financial Information |
| • | Liquidity and Capital Resources |
| • | Long-Term Obligations |
| • | Critical Accounting Policies and Estimates |
| • | New Accounting Pronouncements |
| • | Presentation of Non-GAAP Measures |
| • | Impact of Inflation |
| • | Quantitative and Qualitative Disclosures About Market Risk |
The MD&A should be read in conjunction with “Cautionary Notice Regarding Forward-Looking Statements,” “Selected Historical and Other Data,” and our consolidated financial statements and related notes included elsewhere in this prospectus.
All dollar amounts, except per share amounts, presented in this MD&A are in thousands, unless the context indicates otherwise.
Overview
We are an owner, operator and franchisor of QSRs in the United States and 25 other countries, operating principally under the Carl’s Jr. and Hardee’s brand names. As of May 21, 2012, we operated 892 restaurants and our franchisees operated 1,930 domestic and 441 international restaurants, primarily under the Carl’s Jr. and Hardee’s brands. Domestic Carl’s Jr. restaurants are predominately located in the Western United States, primarily in California, with a growing presence in Texas. International Carl’s Jr. restaurants are located primarily in Mexico, with a growing presence in the rest of Latin America, Russia and Asia. Hardee’s restaurants are located predominately throughout the Southeastern and Midwestern United States, with a growing international presence in the Middle East and Central Asia. Our Green Burrito restaurants are primarily located in dual-branded Carl’s Jr. restaurants and our Red Burrito restaurants are exclusively located in dual-branded Hardee’s restaurants.
We derive our revenue primarily from sales at company-operated restaurants and from our franchisees. Franchise restaurants and other revenue includes franchise and royalty fees, rental revenue under real property leases and revenue from the sale of equipment to our franchisees. Restaurant operating expenses consist primarily of food and packaging costs, payroll and other employee benefits and occupancy and other operating expenses of company-operated restaurants. Franchise operating costs include depreciation expense or lease payments on properties leased or subleased to our franchisees, the cost of equipment sold to franchisees and
46
Table of Contents
franchise administrative support. Our revenue and expenses are directly affected by the number and sales volume of company-operated restaurants and, to a lesser extent, by the number and sales volume of franchised restaurants.
On July 2, 2010, we sold to MBM our Carl’s Jr. distribution center assets located in Ontario, California and Manteca, California. Prior to the sale of our Carl’s Jr. distribution center assets on July 2, 2010, we derived sales from food and packaging products to Carl’s Jr. franchisees and incurred the associated franchise operating costs for food and packaging products.
Merger Agreement
On July 12, 2010, we acquired CKE Restaurants pursuant to the Merger Agreement, with CKE Restaurants becoming our wholly-owned subsidiary through the Merger.
The aggregate consideration for all equity securities of CKE Restaurants was $704,065, including $10,587 of post-combination share-based compensation expense, and the total debt assumed and refinanced in connection with the Merger was $270,487. The Merger was funded by (i) equity contributions from the Apollo Funds, indirectly through a holding company, of $436,645; (ii) equity contributions from our senior management, indirectly through a holding company, of $13,355; and (iii) proceeds of $588,510 from the issuance of our $600,000 Senior Secured Notes. In addition, we entered into our $100,000 Credit Facility, which was undrawn at closing.
The aforementioned transactions, including the Merger and payment of costs related to these transactions, are collectively referred to as the “Transactions.”
During fiscal 2012, we completed the acquisition accounting for the Merger and retrospectively adjusted post-combination amounts previously reported to reflect our final accounting for the Merger. See Note 2 of Notes to Consolidated Financial Statements included elsewhere in this prospectus for further discussion.
Subsequently, on March 14, 2012, CKE completed an offering of $200,000 of its Toggle Notes.
Presentation of Historical and Pro Forma Operating Results
Since the Merger occurred on July 12, 2010, our operating results for the three years ended January 31, 2012 discussed in this prospectus include both Successor and Predecessor periods. The operating results for the Predecessor periods reflect the consolidated results of our subsidiary, CKE Restaurants, prior to the Merger. Operating results for Successor periods reflect the results of CKE and its consolidated subsidiaries after the Merger. Due to the significant impact of acquisition accounting and Merger related expenses, most notably interest expense, share-based compensation expense and transaction-related costs, on our consolidated operating results, there is a lack of comparability between Successor and Predecessor periods. Accordingly, we have separately discussed our consolidated results of operations for each period. Both the sixteen weeks ended May 21, 2012 and the sixteen weeks ended May 23, 2011 include only Successor periods and are more directly comparable than the periods referred to above.
In addition, in the section of this MD&A captioned “Supplemental Discussion of Historical and Pro Forma Financial Information,” we have included pro forma condensed consolidated financial information for the fiscal year ended January 31, 2011, which combines the Predecessor twenty-four weeks ended July 12, 2010 and Successor twenty-nine weeks ended January 31, 2011, adjusted to give effect to the Transactions as if they had occurred on January 26, 2010, the first day of our fiscal year ended January 31, 2011. We have also included supplemental discussions comparing our condensed consolidated results of operations for fiscal 2012 and fiscal 2010 with such pro forma results of operations for fiscal 2011. We have included this pro forma presentation, which is not required by U.S GAAP, because we believe this supplemental disclosure, including the related discussion, will assist in comparing our results of operations between periods.
47
Table of Contents
Fiscal 2011 Additional Week
Our fiscal year ends on the last Monday in January in each year, which resulted in an extra week during fiscal 2011. As a result, our fourth quarter and fiscal year ended January 31, 2011 included 13 weeks and 53 weeks, respectively, as compared to 12 weeks and 52 weeks in the fourth quarter and fiscal year ended January 30, 2012. The fiscal year ended January 25, 2010 included 52 weeks.
Within this MD&A, management has estimated the impact of the additional week on our operating results by analyzing the last accounting period of fiscal 2011, excluding the impact of certain year-end and quarter-end adjustments, and making various assumptions that management deemed reasonable and appropriate.
Recent Highlights
Highlights from the sixteen weeks ended May 21, 2012 include:
| • | Our system-wide restaurant count increased by 20 restaurants. |
| • | Our franchisees opened 20 international and 13 domestic restaurants. |
| • | Blended same-store sales for company-operated restaurants increased 2.6%. |
| • | Blended average unit volumes for company-operated restaurants increased to $1,268. |
| • | Consolidated revenue of $412,331 for the sixteen weeks ended May 21, 2012 increased $11,748, or 2.9%, as compared to the prior year period. |
| • | Operating income of $30,906 for the sixteen weeks ended May 21, 2012 increased $11,333, or 57.9%, as compared to the prior year period. |
| • | Consolidated company-operated restaurant-level adjusted EBITDA margin(1) was 19.3% for the sixteen weeks ended May 21, 2012, as compared to 17.0% for the sixteen weeks ended May 23, 2011. |
| • | Franchise restaurant adjusted EBITDA(1) increased $2,069, or 8.1%, to $27,549, as compared to the prior year period. |
| • | We received proceeds of $29,946 from the sale and leaseback of 20 properties(2). |
Highlights from fiscal 2012 include:
| • | Our system-wide restaurant count for our two major brands increased by 86 restaurants, marking our fifth straight year of net restaurant growth. |
| • | Our franchisees opened 72 international and 41 domestic restaurants, and we opened 5 domestic company-operated restaurants. |
| • | We, through our franchisees, opened restaurants in seven new countries. |
| • | Blended same-store sales for company-operated restaurants increased 3.5%. |
| • | Blended average unit volumes for company-operated restaurants increased to $1,257. |
| • | We signed development agreements with 17 new and three existing franchisees representing commitments to build over 300 restaurants domestically and internationally over the next seven years. |
| • | We remodeled 65 company-operated restaurants. |
| • | Our domestic franchisees remodeled 284 restaurants. |
| • | We completed a combined 67 dual-branded Green Burrito and Red Burrito company-operated restaurant conversions, and our domestic franchisees completed 45 dual-branded restaurant conversions. |
48
Table of Contents
| • | Consolidated revenue of $1,280,327 for fiscal 2012 benefited from an increase in company-operated same-store sales and an increase in the number of our franchised restaurants. Consolidated revenue for fiscal 2012 was unfavorably impacted by the sale of our Carl’s Jr. distribution center assets on July 2, 2010. |
| • | Operating income of $68,894 for fiscal 2012 was primarily comprised of operating income generated by our Carl’s Jr. and Hardee’s operating segments of $30,232 and $38,687, respectively. Operating income for fiscal 2012 includes a charge of $1,976 in the Hardee’s operating segment related to the out-of-period Insurance Reserve Adjustment described in more detail in Note 1 of Notes to Consolidated Financial Statements included elsewhere in this prospectus. |
| • | Consolidated company-operated restaurant-level adjusted EBITDA margin(1) of 16.8% for fiscal 2012 was unfavorably impacted by increases in commodity costs and by the Insurance Reserve Adjustment, which were partially offset by favorability in other components of labor costs. Excluding the Insurance Reserve Adjustment, consolidated company-operated restaurant-level adjusted EBITDA margin for fiscal 2012 was 17.0%. |
| • | Consolidated franchise restaurant adjusted EBITDA(1) of $84,204 for fiscal 2012 benefited from royalties generated from the increase in our franchised restaurant count and was adversely impacted by higher franchise administrative costs to support our long-term growth strategy. |
| • | We extinguished through redemptions and open market purchases a total of $67,878 of the principal amount of our Senior Secured Notes and $9,948 of the principal amount of our Toggle Notes. |
| • | We received proceeds of $67,454 from the sale and leaseback of 47 restaurant properties(3). |
| (1) | Refer to definitions of company-operated restaurant-level non-GAAP measures and franchise restaurant adjusted EBITDA within the subheading “Presentation of Non-GAAP Measures” in this MD&A. |
| (2) | See Note 5 of Notes to Condensed Consolidated Financial Statements included elsewhere in this prospectus for additional discussion of sale-leaseback transactions. |
| (3) | See Note 11 of Notes to Consolidated Financial Statements included elsewhere in this prospectus for additional discussion of sale-leaseback transactions. |
Trends and Uncertainties
The following represent some of the most significant trends and uncertainties that management believes could reasonably be expected to impact our future plans and developments, financial goals and operating performance. This section should be read in conjunction with “Cautionary Notice Regarding Forward-Looking Statements” and “Risk Factors.”
| • | The continuing economic uncertainty affecting consumer confidence and discretionary spending may cause long-term changes in the preferences and perceptions of our customers; |
| • | The cost of food commodities has increased markedly over the last two years and we expect that there may be additional pricing pressure on some of our key ingredients, most notably beef, during fiscal 2013, which may adversely affect our operating results or cause us to consider changes to our product delivery strategy and adjustments to our menu pricing; |
| • | We expect to continue to grow our restaurant base, and currently have more than 75 franchise development agreements representing commitments (which we, but not our franchisees, may terminate under certain circumstances) to build over 875 franchised restaurants domestically and internationally over the next ten years; |
| • | Changes in employment and other governmental regulations could result in additional costs to us and cause adverse impacts on our future operating results; and |
| • | Changes in consumer focus on nutrition, food content and food safety could result in loss of market share and adversely impact our operating results. |
49
Table of Contents
Operating Review
The following tables present the change in our restaurant portfolios, consolidated and by brand, for the sixteen weeks ended May 21, 2012, fiscal 2012 and fiscal 2011:
| Company- operated |
Domestic Franchised |
International Franchised |
Total | |||||||||||||
| Consolidated: |
||||||||||||||||
| Open as of January 31, 2010 |
898 | 1,905 | 338 | 3,141 | ||||||||||||
| New |
7 | 32 | 30 | 69 | ||||||||||||
| Closed |
(15 | ) | (27 | ) | (9 | ) | (51 | ) | ||||||||
|
|
|
|
|
|
|
|
|
|||||||||
| Open as of January 31, 2011 |
890 | 1,910 | 359 | 3,159 | ||||||||||||
| New |
5 | 41 | 72 | 118 | ||||||||||||
| Closed |
(6 | ) | (20 | ) | (8 | ) | (34 | ) | ||||||||
| Divested |
— | (3 | ) | — | (3 | ) | ||||||||||
| Acquired |
3 | — | — | 3 | ||||||||||||
|
|
|
|
|
|
|
|
|
|||||||||
| Open as of January 31, 2012 |
892 | 1,928 | 423 | 3,243 | ||||||||||||
| New |
2 | 13 | 20 | 35 | ||||||||||||
| Closed |
(2 | ) | (11 | ) | (2 | ) | (15 | ) | ||||||||
|
|
|
|
|
|
|
|
|
|||||||||
| Open at May 21, 2012 |
892 | 1,930 | 441 | 3,263 | ||||||||||||
|
|
|
|
|
|
|
|
|
|||||||||
| Carl’s Jr.: |
||||||||||||||||
| Open as of January 31, 2010 |
422 | 666 | 136 | 1,224 | ||||||||||||
| New |
7 | 20 | 19 | 46 | ||||||||||||
| Closed |
(6 | ) | (12 | ) | (3 | ) | (21 | ) | ||||||||
|
|
|
|
|
|
|
|
|
|||||||||
| Open as of January 31, 2011 |
423 | 674 | 152 | 1,249 | ||||||||||||
| New |
3 | 25 | 48 | 76 | ||||||||||||
| Closed |
(3 | ) | (6 | ) | (3 | ) | (12 | ) | ||||||||
| Divested |
— | — | — | — | ||||||||||||
| Acquired |
— | — | — | — | ||||||||||||
|
|
|
|
|
|
|
|
|
|||||||||
| Open as of January 31, 2012 |
423 | 693 | 197 | 1,313 | ||||||||||||
| New |
2 | 8 | 7 | 17 | ||||||||||||
| Closed |
(1 | ) | (7 | ) | — | (8 | ) | |||||||||
|
|
|
|
|
|
|
|
|
|||||||||
| Open at May 21, 2012 |
424 | 694 | 204 | 1,322 | ||||||||||||
|
|
|
|
|
|
|
|
|
|||||||||
| Hardee’s: |
||||||||||||||||
| Open as of January 31, 2010 |
475 | 1,228 | 202 | 1,905 | ||||||||||||
| New |
— | 12 | 11 | 23 | ||||||||||||
| Closed |
(9 | ) | (14 | ) | (6 | ) | (29 | ) | ||||||||
|
|
|
|
|
|
|
|
|
|||||||||
| Open as of January 31, 2011 |
466 | 1,226 | 207 | 1,899 | ||||||||||||
| New |
2 | 16 | 24 | 42 | ||||||||||||
| Closed |
(2 | ) | (13 | ) | (5 | ) | (20 | ) | ||||||||
| Divested |
— | (3 | ) | — | (3 | ) | ||||||||||
| Acquired |
3 | — | — | 3 | ||||||||||||
|
|
|
|
|
|
|
|
|
|||||||||
| Open as of January 31, 2012 |
469 | 1,226 | 226 | 1,921 | ||||||||||||
| New |
— | 5 | 13 | 18 | ||||||||||||
| Closed |
(1 | ) | (4 | ) | (2 | ) | (7 | ) | ||||||||
|
|
|
|
|
|
|
|
|
|||||||||
| Open at May 21, 2012 |
468 | 1,227 | 237 | 1,932 | ||||||||||||
|
|
|
|
|
|
|
|
|
|||||||||
50
Table of Contents
Fiscal Quarter—Consolidated
| Sixteen Weeks Ended |
Sixteen Weeks Ended |
|||||||
| May 21, 2012 | May 23, 2011 | |||||||
| Revenue: |
||||||||
| Company-operated restaurants |
$ | 361,466 | $ | 351,604 | ||||
| Franchised restaurants and other |
50,865 | 48,979 | ||||||
|
|
|
|
|
|||||
| Total revenue |
412,331 | 400,583 | ||||||
|
|
|
|
|
|||||
| Operating costs and expenses: |
||||||||
| Restaurant operating costs |
292,752 | 293,248 | ||||||
| Franchised restaurants and other |
25,629 | 25,878 | ||||||
| Advertising |
20,852 | 20,061 | ||||||
| General and administrative |
41,791 | 40,961 | ||||||
| Facility action charges, net |
401 | 511 | ||||||
| Other operating expenses |
— | 351 | ||||||
|
|
|
|
|
|||||
| Total operating costs and expenses |
381,425 | 381,010 | ||||||
|
|
|
|
|
|||||
| Operating income |
30,906 | 19,573 | ||||||
| Interest expense |
(31,310 | ) | (28,850 | ) | ||||
| Other income, net |
1,149 | 799 | ||||||
|
|
|
|
|
|||||
| Income (loss) before income taxes |
745 | (8,478 | ) | |||||
| Income tax benefit |
(5,951 | ) | (3,176 | ) | ||||
|
|
|
|
|
|||||
| Net income (loss) |
$ | 6,696 | $ | (5,302 | ) | |||
|
|
|
|
|
|||||
| Blended company-operated average unit volume (trailing-52 weeks) |
$ | 1,268 | $ | 1,231 | ||||
| Blended domestic franchise-operated average unit volume (trailing-52 weeks) |
1,080 | 1,058 | ||||||
| Blended company-operated same-store sales increase |
2.6 | % | 5.5 | % | ||||
| Blended domestic franchise-operated same-store sales increase |
2.1 | % | 3.8 | % | ||||
| Company-operated restaurant-level adjusted EBITDA(1): |
||||||||
| Company-operated restaurants revenue |
$ | 361,466 | $ | 351,604 | ||||
| Less: restaurant operating costs |
(292,752 | ) | (293,248 | ) | ||||
| Add: depreciation and amortization expense |
22,069 | 21,600 | ||||||
| Less: advertising expense |
(20,852 | ) | (20,061 | ) | ||||
|
|
|
|
|
|||||
| Company-operated restaurant-level adjusted EBITDA |
$ | 69,931 | $ | 59,895 | ||||
|
|
|
|
|
|||||
| Company-operated restaurant-level adjusted EBITDA margin |
19.3 | % | 17.0 | % | ||||
| Franchise restaurant adjusted EBITDA(1): |
||||||||
| Franchised restaurants and other revenue |
$ | 50,865 | $ | 48,979 | ||||
| Less: franchised restaurants and other expense |
(25,629 | ) | (25,878 | ) | ||||
| Add: depreciation and amortization expense |
2,313 | 2,379 | ||||||
|
|
|
|
|
|||||
| Franchise restaurant adjusted EBITDA |
$ | 27,549 | $ | 25,480 | ||||
|
|
|
|
|
|||||
| (1) | Refer to definitions of company-operated restaurant-level non-GAAP measures and franchise restaurant adjusted EBITDA within “—Presentation of Non-GAAP Measures.” |
51
Table of Contents
Fiscal Quarter—Segments
| Carl’s Jr. | Hardee’s | |||||||||||||||
| Sixteen Weeks Ended |
Sixteen Weeks Ended |
|||||||||||||||
| May 21, 2012 |
May 23, 2011 |
May 21, 2012 |
May 23, 2011 |
|||||||||||||
| Company-operated restaurants revenue |
$ | 192,916 | $ | 188,288 | $ | 168,550 | $ | 163,250 | ||||||||
| Franchised restaurants and other revenue |
18,608 | 17,846 | 32,115 | 30,966 | ||||||||||||
|
|
|
|
|
|
|
|
|
|||||||||
| Total revenue |
211,524 | 206,134 | 200,665 | 194,216 | ||||||||||||
|
|
|
|
|
|
|
|
|
|||||||||
| Restaurant operating costs: |
||||||||||||||||
| Food and packaging |
57,263 | 57,556 | 51,239 | 51,317 | ||||||||||||
| Payroll and other employee benefits |
54,580 | 53,679 | 48,185 | 47,941 | ||||||||||||
| Occupancy and other |
45,231 | 46,318 | 36,254 | 36,337 | ||||||||||||
|
|
|
|
|
|
|
|
|
|||||||||
| Total restaurant operating costs |
157,074 | 157,553 | 135,678 | 135,595 | ||||||||||||
|
|
|
|
|
|
|
|
|
|||||||||
| Franchised restaurants and other expense |
10,111 | 9,985 | 15,515 | 15,893 | ||||||||||||
| Advertising expense |
11,575 | 11,175 | 9,277 | 8,886 | ||||||||||||
| General and administrative expense |
20,142 | 19,299 | 21,574 | 21,662 | ||||||||||||
| Facility action charges, net |
32 | 359 | 369 | 151 | ||||||||||||
|
|
|
|
|
|
|
|
|
|||||||||
| Operating income |
$ | 12,590 | $ | 7,763 | $ | 18,252 | $ | 12,029 | ||||||||
|
|
|
|
|
|
|
|
|
|||||||||
| Company-operated average unit volume (trailing-52 weeks) |
$ | 1,424 | $ | 1,389 | $ | 1,128 | $ | 1,088 | ||||||||
| Domestic franchise-operated average unit volume (trailing-52 weeks) |
1,093 | 1,102 | 1,072 | 1,035 | ||||||||||||
| Company-operated same-store sales increase |
2.6 | % | 2.1 | % | 2.6 | % | 9.6 | % | ||||||||
| Domestic franchise-operated same-store sales (decrease) increase |
(0.4 | )% | 0.4 | % | 4.0 | % | 5.9 | % | ||||||||
| Company-operated same-store transaction increase (decrease) |
2.8 | % | (0.1 | )% | (2.2 | )% | 3.0 | % | ||||||||
| Company-operated average check (actual $) |
$ | 6.98 | $ | 6.97 | $ | 5.57 | $ | 5.30 | ||||||||
| Restaurant operating costs as a percentage of company-operated restaurants revenue: |
||||||||||||||||
| Food and packaging |
29.7 | % | 30.6 | % | 30.4 | % | 31.4 | % | ||||||||
| Payroll and other employee benefits |
28.3 | % | 28.5 | % | 28.6 | % | 29.4 | % | ||||||||
| Occupancy and other |
23.4 | % | 24.6 | % | 21.5 | % | 22.3 | % | ||||||||
| Total restaurant operating costs |
81.4 | % | 83.7 | % | 80.5 | % | 83.1 | % | ||||||||
| Advertising expense as a percentage of company-operated restaurants revenue |
6.0 | % | 5.9 | % | 5.5 | % | 5.4 | % | ||||||||
| Company-operated restaurant-level adjusted EBITDA(1): |
||||||||||||||||
| Company-operated restaurants revenue |
$ | 192,916 | $ | 188,288 | $ | 168,550 | $ | 163,250 | ||||||||
| Less: restaurant operating costs |
(157,074 | ) | (157,553 | ) | (135,678 | ) | (135,595 | ) | ||||||||
| Add: depreciation and amortization expense |
10,498 | 10,836 | 11,571 | 10,764 | ||||||||||||
| Less: advertising expense |
(11,575 | ) | (11,175 | ) | (9,277 | ) | (8,886 | ) | ||||||||
|
|
|
|
|
|
|
|
|
|||||||||
| Company-operated restaurant-level adjusted EBITDA |
$ | 34,765 | $ | 30,396 | $ | 35,166 | $ | 29,533 | ||||||||
|
|
|
|
|
|
|
|
|
|||||||||
| Company-operated restaurant-level adjusted EBITDA margin |
18.0 | % | 16.1 | % | 20.9 | % | 18.1 | % | ||||||||
| Franchise restaurant adjusted EBITDA(1): |
||||||||||||||||
| Franchised restaurants and other revenue |
$ | 18,608 | $ | 17,846 | $ | 32,115 | $ | 30,966 | ||||||||
| Less: franchised restaurants and other expense |
(10,111 | ) | (9,985 | ) | (15,515 | ) | (15,893 | ) | ||||||||
| Add: depreciation and amortization expense |
1,062 | 1,088 | 1,251 | 1,291 | ||||||||||||
|
|
|
|
|
|
|
|
|
|||||||||
| Franchise restaurant adjusted EBITDA |
$ | 9,559 | $ | 8,949 | $ | 17,851 | $ | 16,364 | ||||||||
|
|
|
|
|
|
|
|
|
|||||||||
| (1) | Refer to definitions of company-operated restaurant-level non-GAAP measures and franchise restaurant adjusted EBITDA within “—Presentation of Non-GAAP Measures.” |
52
Table of Contents
Sixteen Weeks Ended May 21, 2012 Compared with Sixteen Weeks Ended May 23, 2011
Consolidated
Total Revenue
Total revenue increased $11,748, or 2.9%, to $412,331 during the sixteen weeks ended May 21, 2012, as compared to the prior year period, due to the increase in company-operated restaurants revenue of $9,862 and the increase in franchised restaurants and other revenue of $1,886. Blended company-operated same-store sales increased 2.6% and blended domestic franchise-operated same-store sales increased 2.1%.
Restaurant Operating Costs
Restaurant operating costs decreased $496, or 0.2%, to $292,752 during the sixteen weeks ended May 21, 2012, as compared to the prior year period. Restaurant operating costs as a percentage of company-operated restaurants revenue were 81.0% during for the sixteen weeks ended May 21, 2012, as compared to 83.4% for the sixteen weeks ended May 23, 2011. This decrease in restaurant operating costs as a percentage of company-operated restaurants revenue was in part due to higher company-operated average unit volumes, which benefited from price increases implemented over the past year. Occupancy and other expense as a percentage of company-operated restaurants revenue decreased 1.0% compared to the prior year period, primarily as a result of lower repairs and maintenance expense. Food and packaging costs as a percentage of company-operated restaurants revenue decreased 1.0% from the prior year period, primarily as a result of higher restaurant pricing and lower commodity costs for produce, pork, and dairy, partially offset by higher commodity costs for beef. Payroll and other employee benefits as a percentage of company-operated restaurants revenue decreased 0.5% from the prior year period.
Franchised Restaurants and Other Expense
During the sixteen weeks ended May 21, 2012, franchised restaurants and other expense of $25,629 was comparable with the prior year period.
Advertising Expense
Advertising expense increased $791, or 3.9%, to $20,852 during the sixteen weeks ended May 21, 2012, as compared to the prior year period. Advertising expense as a percentage of company-operated restaurants revenue was 5.8% during the sixteen weeks ended May 21, 2012, as compared to 5.7% during the prior year period.
General and Administrative Expense
General and administrative expense increased $830, or 2.0%, to $41,791 in the sixteen weeks ended May 21, 2012 from the prior year period. This increase was mainly due to an increase of $629 in bonus expense, which is based on our performance relative to executive management and operations bonus criteria.
Interest Expense
During the sixteen weeks ended May 21, 2012, interest expense increased $2,460, or 8.5%, to $31,310, as compared to the prior year period. This increase was primarily due to an increase in interest expense related to our Toggle Notes of $2,877, which were issued during the sixteen weeks ended May 23, 2011, and an increase in interest expense of $2,090 related to our financing method sale-leaseback transactions. These increases were partially offset by a decrease in interest expense of $2,492 related to our Senior Secured Notes caused by the early extinguishment of $67,878 of principal amount of our Senior Secured Notes during fiscal 2012.
Income Tax Benefit
Our effective income tax rate for the sixteen weeks ended May 21, 2012 differs from the federal statutory rate primarily as a result of non-deductible share-based compensation expense, state income taxes, federal
53
Table of Contents
income tax credits and the release of $5,969 of valuation allowance on state income tax credit and net operating loss (“NOL”) carryforwards. Our effective income tax rate for the sixteen weeks ended May 23, 2011 differs from the federal statutory rate primarily as a result of non-deductible share-based compensation expense, state income taxes and federal income tax credits and the release of $328 of valuation allowance on state NOL and income tax credit carryforwards.
Carl’s Jr.
Company-Operated Restaurants Revenue
Revenue from company-operated Carl’s Jr. restaurants increased $4,628, or 2.5%, to $192,916 during the sixteen weeks ended May 21, 2012, as compared to the sixteen weeks ended May 23, 2011. This increase was primarily due to the 2.6% increase in company-operated same-store sales for the quarter, which was driven, in part, by price increases taken over the past year.
Company-Operated Restaurant-Level Adjusted EBITDA Margin
The changes in the company-operated restaurant-level adjusted EBITDA margin are summarized as follows:
| Company-operated restaurant-level adjusted EBITDA margin for the period ended May 23, 2011 |
16.1 | % | ||
| Decrease in food and packaging costs |
0.9 | |||
| Payroll and other employee benefits: |
||||
| Decrease in workers’ compensation expense |
0.1 | |||
| Decrease in labor costs, excluding workers’ compensation |
0.1 | |||
| Occupancy and other (excluding depreciation and amortization): |
||||
| Decrease in repairs and maintenance expense |
0.6 | |||
| Decrease in utilities expense |
0.2 | |||
| Other, net |
0.1 | |||
| Increase in advertising expense |
(0.1 | ) | ||
|
|
|
|||
| Company-operated restaurant-level adjusted EBITDA margin for the period ended May 21, 2012 |
18.0 | % | ||
|
|
|
Food and Packaging Costs
Food and packaging costs decreased as a percentage of company-operated restaurants revenue during the sixteen weeks ended May 21, 2012, as compared to the prior year period, mainly due to the impact of price increases taken over the past year and decreased commodity costs for produce, pork, chicken and cheese products, partially offset by increased commodity costs for beef and potato products.
Occupancy and Other Costs
Repairs and maintenance expense decreased as a percentage of company-operated restaurants revenue during the sixteen weeks ended May 21, 2012, as compared to the prior year period, mainly due to decreased spending on contract services, repairs of restaurant equipment and building maintenance.
Depreciation and amortization expense decreased as a percentage of company-operated restaurants revenue during the sixteen weeks ended May 21, 2012, as compared to the prior fiscal year, due primarily to sales leverage and the acceleration of depreciation expense in the prior year period for certain restaurants.
54
Table of Contents
Franchised Restaurants
| Sixteen Weeks Ended |
Sixteen Weeks Ended |
|||||||
| May 21, 2012 | May 23, 2011 | |||||||
| Franchised restaurants and other revenue: |
||||||||
| Royalties |
$ | 11,655 | $ | 10,672 | ||||
| Rent and other occupancy |
6,474 | 6,746 | ||||||
| Franchise fees |
479 | 428 | ||||||
|
|
|
|
|
|||||
| Total franchised restaurants and other revenue |
$ | 18,608 | $ | 17,846 | ||||
|
|
|
|
|
|||||
| Franchised restaurants and other expense: |
||||||||
| Administrative expense (including provision for bad debts) |
$ | 3,607 | $ | 3,436 | ||||
| Rent and other occupancy |
6,504 | 6,549 | ||||||
|
|
|
|
|
|||||
| Total franchised restaurants and other expense |
$ | 10,111 | $ | 9,985 | ||||
|
|
|
|
|
|||||
Franchised restaurants and other revenue increased $762, or 4.3%, to $18,608 during the sixteen weeks ended May 21, 2012, as compared to the prior year period. Royalty revenues increased $983, or 9.2%, to $11,655, due primarily to the net increase of 46 international and 14 domestic franchised restaurants since the end of the first quarter of fiscal 2012.
Franchised restaurants and other expense increased $126, or 1.3%, to $10,111 during the sixteen weeks ended May 21, 2012, from the comparable prior year period. Administrative expense increased $171, or 5.0%, from the comparable prior year period, due primarily to increased franchise operations and administration costs related to our international growth strategy.
Hardee’s
Company-Operated Restaurants Revenue
Revenue from company-operated Hardee’s restaurants increased $5,300, or 3.2%, to $168,550 during the sixteen weeks ended May 21, 2012, as compared to the sixteen weeks ended May 23, 2011. This increase was primarily due to the 2.6% increase in company-operated same-store sales for the quarter, which was driven, in part, by price increases taken over the past year and revenue generated from five restaurants opened or acquired during the sixteen weeks ended May 23, 2011 that were only open for a portion of the comparable prior year period.
55
Table of Contents
Company-Operated Restaurant-Level Adjusted EBITDA Margin
The changes in the company-operated restaurant-level adjusted EBITDA margin are summarized as follows:
| Company-operated restaurant-level adjusted EBITDA margin for the period ended May 23, 2011 |
18.1 | % | ||
| Decrease in food and packaging costs |
1.0 | |||
| Payroll and other employee benefits: |
||||
| Decrease in labor costs, excluding workers’ compensation |
0.9 | |||
| Increase in workers’ compensation expense |
(0.1 | ) | ||
| Occupancy and other (excluding depreciation and amortization): |
||||
| Decrease in repairs and maintenance expense |
0.4 | |||
| Decrease in general liability insurance expense |
0.3 | |||
| Decrease in asset disposal expense |
0.3 | |||
| Other, net |
0.1 | |||
| Increase in advertising expense |
(0.1 | ) | ||
|
|
|
|||
| Company-operated restaurant-level adjusted EBITDA margin for the period ended May 21, 2012 |
20.9 | % | ||
|
|
|
Food and Packaging Costs
Food and packaging costs decreased as a percentage of company-operated restaurants revenue during the sixteen weeks ended May 21, 2012, as compared to the prior year period, mainly due to the impact of price increases taken over the past year and decreased commodity costs for produce, pork, dairy and cheese products, partially offset by increased commodity costs for beef and potato products.
Labor Costs
Labor costs, excluding workers’ compensation expense, decreased as a percentage of company-operated restaurants revenue during the sixteen weeks ended May 21, 2012, as compared to the prior year period, due primarily to more efficient use of labor in the restaurants and sales leverage resulting from the same-store sales increase.
Occupancy and Other Costs
Repairs and maintenance expense decreased as a percentage of company-operated restaurants revenue during the sixteen weeks ended May 21, 2012, as compared to the prior year period, mainly due to decreased spending on contract services, repairs of restaurant equipment and building maintenance.
General liability insurance expense decreased as a percentage of company-operated restaurants revenue during the sixteen weeks ended May 21, 2012, as compared to the prior year period, due primarily to favorable claims reserve adjustments as a result of actuarial analyses of outstanding claims reserves in the current year period and unfavorable claims reserve adjustments in the comparable prior year period.
Asset disposal expense decreased as a percentage of company-operated restaurants revenue during the sixteen weeks ended May 21, 2012, as compared to the prior year period, due primarily to lower asset disposals resulting from a reduction in restaurant remodels in the current year period.
Depreciation and amortization expense increased as a percentage of company-operated restaurants revenue during the sixteen weeks ended May 21, 2012, as compared to the prior year period, due primarily to the impact of fixed asset additions.
56
Table of Contents
Franchised Restaurants
| Sixteen Weeks Ended |
Sixteen Weeks Ended |
|||||||
| May 21, 2012 | May 23, 2011 | |||||||
| Franchised restaurants and other revenue: |
||||||||
| Royalties |
$ | 19,435 | $ | 17,971 | ||||
| Equipment sales |
8,367 | 8,571 | ||||||
| Rent and other occupancy |
3,828 | 4,023 | ||||||
| Franchise fees |
485 | 401 | ||||||
|
|
|
|
|
|||||
| Total franchised restaurants and other revenue |
$ | 32,115 | $ | 30,966 | ||||
|
|
|
|
|
|||||
| Franchised restaurants and other expense: |
||||||||
| Administrative expense (including provision for bad debts) |
$ | 3,820 | $ | 3,964 | ||||
| Equipment distribution center |
8,399 | 8,532 | ||||||
| Rent and other occupancy |
3,296 | 3,397 | ||||||
|
|
|
|
|
|||||
| Total franchised restaurants and other expense |
$ | 15,515 | $ | 15,893 | ||||
|
|
|
|
|
|||||
Total franchised restaurants and other revenue increased $1,149, or 3.7%, to $32,115 during the sixteen weeks ended May 21, 2012, as compared to the prior year period. Royalty revenues increased $1,464, or 8.1%, to $19,435 from the comparable prior year period, due primarily to a net increase of 23 international and 2 domestic franchised restaurants since the end of the first quarter of fiscal 2012 and an increase in domestic franchise-operated same-store sales of 4.0%. Equipment sales decreased $204, or 2.4%, to $8,367, from the comparable prior year period, primarily due to a decrease in equipment sales to franchisees.
Franchised restaurants and other expense decreased $378, or 2.4%, to $15,515, during the sixteen weeks ended May 21, 2012, as compared to the prior year period. The decrease in administrative expense of $144, or 3.6%, to $3,820 was primarily due to reduced travel and meeting costs. The decrease in equipment distribution center costs of $133, or 1.6%, resulted directly from the decrease in equipment sales to franchisees.
57
Table of Contents
Fiscal Year—Consolidated
| Successor | Predecessor | |||||||||||||||
| Fiscal 2012 | Twenty-Nine Weeks Ended January 31, 2011(1) |
Twenty-Four Weeks Ended July 12, 2010(1) |
Fiscal 2010 | |||||||||||||
| Revenue: |
||||||||||||||||
| Company-operated restaurants |
$ | 1,122,430 | $ | 598,753 | $ | 500,531 | $ | 1,084,474 | ||||||||
| Franchised restaurants and other |
157,897 | 80,355 | 151,588 | 334,259 | ||||||||||||
|
|
|
|
|
|
|
|
|
|||||||||
| Total revenue |
1,280,327 | 679,108 | 652,119 | 1,418,733 | ||||||||||||
|
|
|
|
|
|
|
|
|
|||||||||
| Operating costs and expenses: |
||||||||||||||||
| Restaurant operating costs |
939,615 | 495,909 | 414,171 | 881,397 | ||||||||||||
| Franchised restaurants and other |
81,372 | 39,464 | 115,120 | 254,124 | ||||||||||||
| Advertising |
65,061 | 34,481 | 29,647 | 64,443 | ||||||||||||
| General and administrative |
130,858 | 84,833 | 59,859 | 134,579 | ||||||||||||
| Facility action charges, net |
(6,018 | ) | 1,683 | 590 | 4,695 | |||||||||||
| Other operating expenses, net |
545 | 20,003 | 10,249 | — | ||||||||||||
|
|
|
|
|
|
|
|
|
|||||||||
| Total operating costs and expenses |
1,211,433 | 676,373 | 629,636 | 1,339,238 | ||||||||||||
|
|
|
|
|
|
|
|
|
|||||||||
| Operating income |
68,894 | 2,735 | 22,483 | 79,495 | ||||||||||||
| Interest expense |
(98,124 | ) | (43,681 | ) | (8,617 | ) | (19,254 | ) | ||||||||
| Other (expense) income, net |
(1,658 | ) | 1,645 | (13,609 | ) | 2,935 | ||||||||||
|
|
|
|
|
|
|
|
|
|||||||||
| (Loss) income before income taxes |
(30,888 | ) | (39,301 | ) | 257 | 63,176 | ||||||||||
| Income tax (benefit) expense |
(11,609 | ) | (11,411 | ) | 7,772 | 14,978 | ||||||||||
|
|
|
|
|
|
|
|
|
|||||||||
| Net (loss) income |
$ | (19,279 | ) | $ | (27,890 | ) | $ | (7,515 | ) | $ | 48,198 | |||||
|
|
|
|
|
|
|
|
|
|||||||||
| Company-operated restaurant-level adjusted EBITDA(2): |
||||||||||||||||
| Company-operated restaurants revenue |
$ | 1,122,430 | $ | 598,753 | $ | 500,531 | $ | 1,084,474 | ||||||||
| Less: restaurant operating costs |
(939,615 | ) | (495,909 | ) | (414,171 | ) | (881,397 | ) | ||||||||
| Add: depreciation and amortization expense |
70,994 | 35,750 | 30,412 | 63,096 | ||||||||||||
| Less: advertising expense |
(65,061 | ) | (34,481 | ) | (29,647 | ) | (64,443 | ) | ||||||||
|
|
|
|
|
|
|
|
|
|||||||||
| Company-operated restaurant-level adjusted EBITDA |
$ | 188,748 | $ | 104,113 | $ | 87,125 | $ | 201,730 | ||||||||
|
|
|
|
|
|
|
|
|
|||||||||
| Company-operated restaurant-level adjusted EBITDA margin |
16.8 | % | 17.4 | % | 17.4 | % | 18.6 | % | ||||||||
| Franchise restaurant adjusted EBITDA(2) |
||||||||||||||||
| Franchised restaurants and other revenue |
$ | 157,897 | $ | 80,355 | $ | 151,588 | $ | 334,259 | ||||||||
| Less: franchised restaurants and other expense |
(81,372 | ) | (39,464 | ) | (115,120 | ) | (254,124 | ) | ||||||||
| Add: depreciation and amortization expense |
7,679 | 4,266 | 1,388 | 3,130 | ||||||||||||
|
|
|
|
|
|
|
|
|
|||||||||
| Franchise restaurant adjusted EBITDA |
$ | 84,204 | $ | 45,157 | $ | 37,856 | $ | 83,265 | ||||||||
|
|
|
|
|
|
|
|
|
|||||||||
| (1) | Refer to discussion of unaudited pro forma condensed consolidated statement of operations for fiscal 2011 within “— Supplemental Discussion of Historical and Pro Forma Financial Information.” The pro forma condensed consolidated financial information for the fiscal year ended January 31, 2011 combines the Predecessor twenty-four weeks ended July 12, 2010 and Successor twenty-nine weeks ended January 31, 2011, adjusted to give effect to the Transactions as if they had occurred on January 26, 2010, the first day of our fiscal year ended January 31, 2011. |
| (2) | Refer to definitions of company-operated restaurant-level non-GAAP measures and franchise restaurant adjusted EBITDA within “—Presentation of Non-GAAP Measures.” |
58
Table of Contents
Fiscal Year—Segments
| Successor | Predecessor | |||||||||||||||
| Fiscal 2012 | Twenty-Nine Weeks Ended January 31, 2011(1) |
Twenty-Four Weeks Ended July 12, 2010(1) |
Fiscal 2010 | |||||||||||||
| Carl’s Jr. |
||||||||||||||||
| Revenue: |
||||||||||||||||
| Company-operated restaurants |
$ | 598,234 | $ | 321,525 | $ | 271,379 | $ | 604,937 | ||||||||
| Franchised restaurants and other |
59,666 | 31,967 | 111,855 | 247,542 | ||||||||||||
|
|
|
|
|
|
|
|
|
|||||||||
| Total revenue |
657,900 | 353,492 | 383,234 | 852,479 | ||||||||||||
| Operating costs and expenses: |
||||||||||||||||
| Restaurant operating costs |
502,397 | 266,686 | 223,299 | 482,100 | ||||||||||||
| Franchised restaurants and other |
32,824 | 17,534 | 98,035 | 214,971 | ||||||||||||
| Advertising |
36,065 | 18,496 | 16,620 | 36,730 | ||||||||||||
| General and administrative |
62,083 | 39,620 | 28,523 | 63,032 | ||||||||||||
| Facility action charges, net |
(5,701 | ) | 366 | 168 | 2,219 | |||||||||||
| Gain on sale of distribution center assets |
— | — | (3,442 | ) | — | |||||||||||
|
|
|
|
|
|
|
|
|
|||||||||
| Operating income |
$ | 30,232 | $ | 10,790 | $ | 20,031 | $ | 53,427 | ||||||||
|
|
|
|
|
|
|
|
|
|||||||||
| Company-operated restaurant-level adjusted EBITDA(2): |
||||||||||||||||
| Company-operated restaurants revenue |
$ | 598,234 | $ | 321,525 | $ | 271,379 | $ | 604,937 | ||||||||
| Less: restaurant operating costs |
(502,397 | ) | (266,686 | ) | (223,299 | ) | (482,100 | ) | ||||||||
| Add: depreciation and amortization expense |
34,366 | 17,723 | 14,834 | 31,113 | ||||||||||||
| Less: advertising expense |
(36,065 | ) | (18,496 | ) | (16,620 | ) | (36,730 | ) | ||||||||
|
|
|
|
|
|
|
|
|
|||||||||
| Company-operated restaurant-level adjusted EBITDA |
$ | 94,138 | $ | 54,066 | $ | 46,294 | $ | 117,220 | ||||||||
|
|
|
|
|
|
|
|
|
|||||||||
| Company-operated restaurant-level adjusted EBITDA margin |
15.7 | % | 16.8 | % | 17.1 | % | 19.4 | % | ||||||||
| Franchise restaurant adjusted EBITDA(2): |
||||||||||||||||
| Franchised restaurants and other revenue |
$ | 59,666 | $ | 31,967 | $ | 111,855 | $ | 247,542 | ||||||||
| Less: franchised restaurants and other expense |
(32,824 | ) | (17,534 | ) | (98,035 | ) | (214,971 | ) | ||||||||
| Add: depreciation and amortization expense |
3,419 | 1,914 | 752 | 1,889 | ||||||||||||
|
|
|
|
|
|
|
|
|
|||||||||
| Franchise restaurant adjusted EBITDA |
$ | 30,261 | $ | 16,347 | $ | 14,572 | $ | 34,460 | ||||||||
|
|
|
|
|
|
|
|
|
|||||||||
| Hardee’s |
||||||||||||||||
| Revenue: |
||||||||||||||||
| Company-operated restaurants |
$ | 524,084 | $ | 277,110 | $ | 229,043 | $ | 479,289 | ||||||||
| Franchised restaurants and other |
97,698 | 48,103 | 39,480 | 86,173 | ||||||||||||
|
|
|
|
|
|
|
|
|
|||||||||
| Total revenue |
621,782 | 325,213 | 268,523 | 565,462 | ||||||||||||
| Operating costs and expenses: |
||||||||||||||||
| Restaurant operating costs |
437,074 | 229,045 | 190,718 | 398,981 | ||||||||||||
| Franchised restaurants and other |
48,548 | 21,930 | 17,085 | 39,149 | ||||||||||||
| Advertising |
28,996 | 15,985 | 13,027 | 27,713 | ||||||||||||
| General and administrative |
68,774 | 45,214 | 31,266 | 71,383 | ||||||||||||
| Facility action charges, net |
(297 | ) | 1,316 | 369 | 2,476 | |||||||||||
|
|
|
|
|
|
|
|
|
|||||||||
| Operating income |
$ | 38,687 | $ | 11,723 | $ | 16,058 | $ | 25,760 | ||||||||
|
|
|
|
|
|
|
|
|
|||||||||
| Company-operated restaurant-level adjusted EBITDA(2): |
||||||||||||||||
| Company-operated restaurants revenue |
$ | 524,084 | $ | 277,110 | $ | 229,043 | $ | 479,289 | ||||||||
| Less: restaurant operating costs |
(437,074 | ) | (229,045 | ) | (190,718 | ) | (398,981 | ) | ||||||||
| Add: depreciation and amortization expense |
36,628 | 18,027 | 15,578 | 31,983 | ||||||||||||
| Less: advertising expense |
(28,996 | ) | (15,985 | ) | (13,027 | ) | (27,713 | ) | ||||||||
|
|
|
|
|
|
|
|
|
|||||||||
| Company-operated restaurant-level adjusted EBITDA |
$ | 94,642 | $ | 50,107 | $ | 40,876 | $ | 84,578 | ||||||||
|
|
|
|
|
|
|
|
|
|||||||||
| Company-operated restaurant-level adjusted EBITDA margin |
18.1 | % | 18.1 | % | 17.8 | % | 17.6 | % | ||||||||
59
Table of Contents
| Successor | Predecessor | |||||||||||||||
| Fiscal 2012 |
Twenty-Nine Weeks Ended January 31, 2011(1) |
Twenty-Four Weeks Ended July 12, 2010(1) |
Fiscal 2010 |
|||||||||||||
| Franchise restaurant adjusted EBITDA(2): |
||||||||||||||||
| Franchised restaurants and other revenue |
$ | 97,698 | $ | 48,103 | $ | 39,480 | $ | 86,173 | ||||||||
| Less: franchised restaurants and other expense |
(48,548 | ) | (21,930 | ) | (17,085 | ) | (39,149 | ) | ||||||||
| Add: depreciation and amortization expense |
4,260 | 2,352 | 636 | 1,241 | ||||||||||||
|
|
|
|
|
|
|
|
|
|||||||||
| Franchise restaurant adjusted EBITDA |
$ | 53,410 | $ | 28,525 | $ | 23,031 | $ | 48,265 | ||||||||
|
|
|
|
|
|
|
|
|
|||||||||
| (1) | Refer to discussion of unaudited pro forma condensed consolidated statement of operations for fiscal 2011 within “—Supplemental Discussion of Historical and Pro Forma Financial Information.” The pro forma condensed consolidated financial information for the fiscal year ended January 31, 2011 combines the Predecessor twenty-four weeks ended July 12, 2010 and Successor twenty-nine weeks ended January 31, 2011, adjusted to give effect to the Transactions as if they had occurred on January 26, 2010, the first day of our fiscal year ended January 31, 2011. |
| (2) | Refer to definitions of company-operated restaurant-level non-GAAP measures and franchise restaurant adjusted EBITDA within “—Presentation of Non-GAAP Measures.” |
Discussion of Fiscal Year Operating Results
Total Revenue
Total revenue for fiscal 2012 was $1,280,327, which was primarily comprised of revenue generated by our Carl’s Jr. and Hardee’s operating segments of $657,900 and $621,782, respectively. Carl’s Jr. and Hardee’s company-operated same-store sales for fiscal 2012 increased by 1.9% and 5.2%, respectively. During fiscal 2012, Carl’s Jr. and Hardee’s total revenue as a percentage of total consolidated revenue was 51.4% and 48.6%, respectively.
Total revenue for the Successor twenty-nine weeks ended January 31, 2011 was $679,108, which was primarily comprised of revenue generated by our Carl’s Jr. and Hardee’s operating segments of $353,492 and $325,213, respectively. During the Successor twenty-nine weeks ended January 31, 2011, Carl’s Jr. and Hardee’s total revenue as a percentage of total consolidated revenue was 52.1% and 47.9%, respectively.
Total revenue for the Predecessor twenty-four weeks ended July 12, 2010 was $652,119, which was primarily comprised of revenue generated by our Carl’s Jr. and Hardee’s operating segments of $383,234 and $268,523, respectively. During the Predecessor twenty-four weeks ended July 12, 2010, Carl’s Jr. and Hardee’s total revenue as a percentage of total consolidated revenue was 58.8% and 41.2%, respectively. Our Carl’s Jr. distribution centers, which were sold on July 2, 2010, generated revenues of $86,891, or 13.3% of total revenue, during the period.
Total revenue for fiscal 2010 was $1,418,733, which was primarily comprised of revenue generated by our Carl’s Jr. and Hardee’s operating segments of $852,479 and $565,462, respectively. During fiscal 2010, Carl’s Jr. and Hardee’s total revenue as a percentage of total consolidated revenue was 60.1% and 39.9%, respectively. Our Carl’s Jr. distribution centers generated revenues of $192,188, or 13.5% of total revenue, during fiscal 2010.
Restaurant Operating Costs
During fiscal 2012, the Successor twenty-nine weeks ended January 31, 2011, the Predecessor twenty-four weeks ended July 12, 2010 and fiscal 2010, restaurant operating costs were $939,615, $495,909, $414,171 and $881,397, respectively. Restaurant operating costs as a percentage of company-operated restaurants revenue were 83.7%, 82.8%, 82.7% and 81.3% for fiscal 2012, the Successor twenty-nine weeks ended January 31, 2011, the Predecessor twenty-four weeks ended July 12, 2010 and fiscal 2010, respectively.
60
Table of Contents
During fiscal 2012, the Successor twenty-nine weeks ended January 31, 2011, the Predecessor twenty-four weeks ended July 12, 2010 and fiscal 2010, Carl’s Jr. restaurant operating costs were $502,397, $266,686, $223,299 and $482,100, respectively. Carl’s Jr. restaurant operating costs as a percentage of company-operated restaurants revenue were 84.0%, 82.9%, 82.3% and 79.7% for fiscal 2012, the Successor twenty-nine weeks ended January 31, 2011, the Predecessor twenty-four weeks ended July 12, 2010 and fiscal 2010, respectively.
During fiscal 2012, the Successor twenty-nine weeks ended January 31, 2011, the Predecessor twenty-four weeks ended July 12, 2010 and fiscal 2010, Hardee’s restaurant operating costs were $437,074, $229,045, $190,718 and $398,981, respectively. Hardee’s restaurant operating costs as a percentage of company-operated restaurants revenue were 83.4%, 82.7%, 83.3% and 83.2% for fiscal 2012, the Successor twenty-nine weeks ended January 31, 2011, the Predecessor twenty-four weeks ended July 12, 2010 and fiscal 2010, respectively. Hardee’s restaurant operating costs for fiscal 2012 includes a charge of $1,976 related to the out-of-period Insurance Reserve Adjustment described in more detail in Note 1 of Notes to Consolidated Financial Statements included elsewhere in this prospectus.
Franchised Restaurants and Other Expense
During fiscal 2012, the Successor twenty-nine weeks ended January 31, 2011, the Predecessor twenty-four weeks ended July 12, 2010 and fiscal 2010, franchised restaurants and other expense was $81,372, $39,464, $115,120 and $254,124, respectively. Franchised restaurants and other expense as a percentage franchised restaurants and other revenue was 51.5%, 49.1%, 75.9% and 76.0% for fiscal 2012, the Successor twenty-nine weeks ended January 31, 2011, the Predecessor twenty-four weeks ended July 12, 2010 and fiscal 2010, respectively.
During fiscal 2012, the Successor twenty-nine weeks ended January 31, 2011, the Predecessor twenty-four weeks ended July 12, 2010 and fiscal 2010, Carl’s Jr. franchised restaurants and other expense was $32,824, $17,534, $98,035 and $214,971, respectively. Carl’s Jr. franchised restaurants and other expense as a percentage franchised restaurants and other revenue was 55.0%, 54.9%, 87.6% and 86.8% for fiscal 2012, the Successor twenty-nine weeks ended January 31, 2011, the Predecessor twenty-four weeks ended July 12, 2010 and fiscal 2010, respectively. Our Carl’s Jr. distribution centers, which were sold on July 2, 2010, represented $86,170 and $189,346 of our franchised restaurants and other expense during the Predecessor twenty-four weeks ended July 12, 2010 and fiscal 2010, respectively.
During fiscal 2012, the Successor twenty-nine weeks ended January 31, 2011, the Predecessor twenty-four weeks ended July 12, 2010 and fiscal 2010, Hardee’s franchised restaurants and other expense was $48,548, $21,930, $17,085 and $39,149, respectively. Hardee’s franchised restaurants and other expense as a percentage franchised restaurants and other revenue was 49.7%, 45.6%, 43.3% and 45.4% for fiscal 2012, the Successor twenty-nine weeks ended January 31, 2011, the Predecessor twenty-four weeks ended July 12, 2010 and fiscal 2010, respectively.
Advertising Expense
During fiscal 2012, the Successor twenty-nine weeks ended January 31, 2011, the Predecessor twenty-four weeks ended July 12, 2010 and fiscal 2010, advertising expense was $65,061, $34,481, $29,647 and $64,443, respectively. Advertising expense as a percentage of company-operated restaurants revenue was 5.8%, 5.8%, 5.9% and 5.9% for fiscal 2012, the Successor twenty-nine weeks ended January 31, 2011, the Predecessor twenty-four weeks ended July 12, 2010 and fiscal 2010, respectively.
General and Administrative Expense
During fiscal 2012, general and administrative expense was $130,858, or 10.2% as a percentage of total revenue. Our general and administrative expense for fiscal 2012 was favorably impacted by lower share-based
61
Table of Contents
compensation expense and unfavorably impacted by management service fees paid to Apollo Management and bonus expense, which is based on our performance relative to executive management and operations bonus criteria.
During the Successor twenty-nine weeks ended January 31, 2011, general and administrative expense was $84,833, or 12.5% as a percentage of total revenue. General and administrative expense for the Successor twenty-nine weeks ended January 31, 2011 was unfavorably impacted by share-based compensation expense of $10,587 associated with the acceleration of vesting of stock options and restricted stock awards in connection with the Merger and a charge of $3,501 related to the write-off of capitalized software costs.
General and administrative expense during the period benefited from lower bonus expense, which is based on our performance relative to executive management and operations bonus criteria.
During the Predecessor twenty-four weeks ended July 12, 2010, general and administrative expense was $59,859, or 9.2% as a percentage of total revenue. General and administrative expense for the Predecessor twenty-four weeks ended July 12, 2010 was unfavorably impacted by share-based compensation expense of $1,521 associated with the acceleration of vesting of stock options and awards in connection with the Merger and favorably impacted by lower bonus expense, which is based on our performance relative to executive management and operations bonus criteria.
During fiscal 2010, general and administrative expense was $134,579, or 9.5% as a percentage of total revenue. General and administrative expense for fiscal 2010 was unfavorably impacted by higher share-based compensation expense and higher bonus expense, which is based on our performance relative to executive management and operations bonus criteria.
Facility Action Charges, Net
During fiscal 2012, net facility action charges was a gain of $6,018, which resulted primarily from a gain of $6,595 related to a lease termination and a gain of $1,024 related to an eminent domain transaction. These gains were partially offset by asset impairment charges of $766 and discount amortization of $479 related to the estimated liability for closed restaurants.
During the Successor twenty-nine weeks ended January 31, 2011, net facility action charges were $1,683, which primarily consisted of charges to adjust the estimated liability for closed restaurants of $870, asset impairment charges of $364 and discount amortization of $272 related to the estimated liability for closed restaurants.
During the Predecessor twenty-four weeks ended July 12, 2010, net facility action charges were $590, which primarily consisted of charges for new restaurant closures of $363, asset impairment charges of $317, and discount amortization of $198 related to the estimated liability for closed restaurants, which were partially offset by net gains of $323.
During fiscal 2010, net facility action charges were $4,695 and primarily consisted of asset impairment charges of $3,480, charges to adjust the estimated liability for closed restaurants of $393, charges for new restaurant closures of $525 and discount amortization of $392 related to the estimated liability for closed restaurants.
Other Operating Expenses, Net
During fiscal 2012, other operating expenses, net consisted of transaction-related costs of $545 for accounting, legal and other costs associated with the Transactions.
During the Successor twenty-nine weeks ended January 31, 2011, other operating expenses, net consisted of transaction-related costs of $20,003 for accounting, investment banking, legal and other costs associated with the Transactions.
62
Table of Contents
During the Predecessor twenty-four weeks ended July 12, 2010, other operating expenses, net consisted of transaction-related costs of $13,691 for accounting, investment banking, legal and other costs associated with the Transactions, partially offset by a gain of $3,442 on the sale of our Carl’s Jr. distribution center assets.
During fiscal 2010, we did not incur any other operating expenses.
Interest Expense
In connection with the Transactions, we issued $600,000 of Senior Secured Notes. In addition, we issued $200,000 of Toggle Notes during fiscal 2012. As a result of the issuance of the Notes, our interest expense is significantly higher in the Successor periods.
Interest expense for fiscal 2012 of $98,124 primarily consisted of interest of $65,131 incurred on our Senior Secured Notes, interest of $19,898 on our Toggle Notes, $4,821 of amortization of deferred financing costs and discount on notes, and $4,755 of interest related to capital lease obligations.
Interest expense for the Successor twenty-nine weeks ended January 31, 2011 of $43,681 primarily consisted of interest of $37,710 incurred on our Notes, $2,089 of amortization of deferred financing costs and discount on notes, and $3,039 of interest related to capital lease obligations.
Interest expense for the Predecessor twenty-four weeks ended July 12, 2010 of $8,617 primarily consisted of charges of $3,113 recorded to adjust the carrying value of our Predecessor interest rate swap agreements to fair value, interest of $2,338 associated with our Predecessor senior credit facility and $2,318 of interest related to capital lease obligations.
Interest expense for fiscal 2010 was $19,254, which primarily consisted of charges of $6,803 recorded to adjust the carrying value of our Predecessor interest rate swap agreements to fair value, $5,380 of interest related to capital lease obligations and interest of $5,174 associated with our Predecessor senior credit facility.
Other (Expense) Income, Net
During fiscal 2012, the Successor twenty-nine weeks ended January 31, 2011, the Predecessor twenty-four weeks ended July 12, 2010 and fiscal 2010, other (expense) income, net was $(1,658), $1,645, $(13,609) and $2,935, respectively. Other (expense) income, net for fiscal 2012 included a loss of $4,188 on the early extinguishment of $67,878 of the principal amount of our Senior Secured Notes and a gain of $1,212 on the early extinguishment of $9,948 of the principal amount of our Toggle Notes. During the Predecessor twenty-four weeks ended July 12, 2010, other (expense) income, net included a termination fee for a prior merger agreement of $9,283 and $5,000 in reimbursable costs.
Income Tax (Benefit) Expense
Income tax (benefit) expense consisted of the following:
| Successor | Predecessor | |||||||||||||||
| Fiscal 2012 | Twenty-Nine Weeks Ended January 31, 2011 |
Twenty-Four Weeks Ended July 12, 2010 |
Fiscal 2010 | |||||||||||||
| Federal income taxes |
$ | (12,799 | ) | $ | (10,957 | ) | $ | 5,479 | $ | 27,078 | ||||||
| State income taxes |
(453 | ) | (1,271 | ) | 1,694 | (13,130 | ) | |||||||||
| Foreign income taxes |
1,643 | 817 | 599 | 1,030 | ||||||||||||
|
|
|
|
|
|
|
|
|
|||||||||
| Income tax (benefit) expense |
$ | (11,609 | ) | $ | (11,411 | ) | $ | 7,772 | $ | 14,978 | ||||||
|
|
|
|
|
|
|
|
|
|||||||||
63
Table of Contents
Our effective income tax rates generally differ from the federal statutory rate primarily as a result of state income taxes, changes in our valuation allowance, and certain expenses that are nondeductible for income tax purposes, the impact of which can vary significantly from year to year. Our effective income tax rate is also impacted by the amount of federal and state income tax credits we are able to generate and by the relative amounts of income we earn in various state and foreign jurisdictions. Refer to additional discussion in Note 21 of Notes to Consolidated Financial Statements included elsewhere in this prospectus.
As of January 31, 2012, we maintained a valuation allowance of $10,975 against a portion of our deferred income tax assets related to certain state net operating loss (“NOL”) carryforwards and a portion of our state income tax credits. Realization of the tax benefit of such deferred income tax assets may remain uncertain for the foreseeable future, even if we generate consolidated taxable income, since certain deferred income tax assets are subject to various limitations and may only be used to offset income of certain entities and in certain jurisdictions.
As of January 31, 2012, we have federal NOL carryforwards of approximately $35,852. As of January 31, 2012, we have federal alternative minimum tax (“AMT”) credit, general business tax credit and foreign tax credit carryforwards of approximately $26,274, which we expect to utilize to offset federal income taxes that would otherwise be payable in future years. As of January 31, 2012, we have recognized $1,493 of net deferred income tax assets related to our state income tax credit carryforwards and $12,296 of net deferred income tax assets related to our state NOL carryforwards, which represent our expected future tax savings from such carryforwards.
Supplemental Discussion of Historical and Pro Forma Financial Information
Our operating results for the fiscal year ended January 31, 2011 include the Predecessor twenty-four weeks ended July 12, 2010 and the Successor twenty-nine weeks ended January 31, 2011. Since the Merger occurred during our fiscal year ended January 31, 2011, we have included the following unaudited pro forma condensed consolidated financial information, which is not required by U.S. GAAP, as a supplemental disclosure because we believe it will assist in comparing our results of operations between periods. The unaudited pro forma condensed consolidated statement of operations for the fiscal year ended January 31, 2011 is based on our historical Consolidated Financial Statements appearing elsewhere in this prospectus and gives effect to the Transactions as if they had occurred on January 26, 2010, the first day of our fiscal year ended January 31, 2011.
The unaudited pro forma adjustments are based upon available information and certain assumptions that are factually supportable and that we believe are reasonable under the circumstances. The unaudited pro forma condensed consolidated financial information is presented for information purposes only and does not purport to represent what our actual consolidated results of operations would have been had the Transactions actually occurred on the date indicated, nor are they necessarily indicative of our future consolidated results of operations. The unaudited pro forma condensed consolidated financial information should be read in conjunction with the information contained in “Selected Historical Financial Information and Other Data,” and our audited Consolidated Financial Statements and related notes appearing elsewhere in this prospectus. All pro forma adjustments and their underlying assumptions are described more fully in the notes to our unaudited pro forma condensed consolidated financial information.
All references to “Predecessor” relate to CKE Restaurants and its consolidated subsidiaries for periods prior to the Merger. All references to “Successor” relate to CKE and its consolidated subsidiaries for periods subsequent to the Merger. References to “we,” “us,” “our,” and the “Company” relate to the Predecessor for the periods prior to the Merger and to the Successor for periods subsequent to the Merger. The acquisition of CKE Restaurants was accounted for as a business combination using the acquisition method of accounting, whereby the purchase price was allocated to the assets and liabilities based on the estimated fair value of assets acquired and liabilities assumed at the date of acquisition.
64
Table of Contents
Unaudited Pro Forma Condensed Consolidated Statement of Operations
| Successor | Predecessor | Pro Forma Adjustments |
Pro Forma | |||||||||||||
| Twenty-Nine Weeks Ended January, 31, 2011 |
Twenty-Four Weeks Ended July 12, 2010 |
Fiscal 2011 | ||||||||||||||
| Revenue: |
||||||||||||||||
| Company-operated restaurants |
$ | 598,753 | $ | 500,531 | $ | — | $ | 1,099,284 | ||||||||
| Franchised restaurants and other |
80,355 | 151,588 | 1,575 | (1)(2)(3) | 233,518 | |||||||||||
|
|
|
|
|
|
|
|
|
|||||||||
| Total revenue |
679,108 | 652,119 | 1,575 | 1,332,802 | ||||||||||||
|
|
|
|
|
|
|
|
|
|||||||||
| Operating costs and expenses: |
||||||||||||||||
| Restaurant operating costs |
495,909 | 414,171 | 940 | (1)(2) | 911,020 | |||||||||||
| Franchised restaurants and other |
39,464 | 115,120 | 4,332 | (1)(2) | 158,916 | |||||||||||
| Advertising |
34,481 | 29,647 | — | 64,128 | ||||||||||||
| General and administrative |
84,833 | 59,859 | (10,882 | )(1)(2)(3) | 133,810 | |||||||||||
| Facility action charges, net |
1,683 | 590 | — | 2,273 | ||||||||||||
| Other operating expenses (income), net |
20,003 | 10,249 | (33,694 | )(3) | (3,442 | ) | ||||||||||
|
|
|
|
|
|
|
|
|
|||||||||
| Total operating costs and expenses |
676,373 | 629,636 | (39,304 | ) | 1,266,705 | |||||||||||
|
|
|
|
|
|
|
|
|
|||||||||
| Operating income |
2,735 | 22,483 | 40,879 | 66,097 | ||||||||||||
| Interest expense |
(43,681 | ) | (8,617 | ) | (27,544 | )(4) | (79,842 | ) | ||||||||
| Other income (expense), net |
1,645 | (13,609 | ) | 14,243 | (1)(2)(3) | 2,279 | ||||||||||
|
|
|
|
|
|
|
|
|
|||||||||
| (Loss) income before income taxes |
(39,301 | ) | 257 | 27,578 | (11,466 | ) | ||||||||||
| Income tax (benefit) expense |
(11,411 | ) | 7,772 | (752 | )(5) | (4,391 | ) | |||||||||
|
|
|
|
|
|
|
|
|
|||||||||
| Net (loss) income |
$ | (27,890 | ) | $ | (7,515 | ) | $ | 28,330 | $ | (7,075 | ) | |||||
|
|
|
|
|
|
|
|
|
|||||||||
| (1) | Reflects the adjustment to depreciation and amortization to each of the respective statement of operations line items resulting from the acquisition accounting fair value adjustments and estimated useful lives assigned to property and equipment and intangible assets and liabilities. The useful lives used in preparing this pro forma financial information are consistent with the useful lives disclosed in our consolidated financial statements included elsewhere in this prospectus. The pro forma net increase to depreciation and amortization expense of $2,196 was adjusted in the following statement of operations line items: |
| Pro Forma Adjustments |
||||
| Increase in franchised restaurants and other revenue |
$ | 1,590 | ||
| Increase in restaurant operating costs |
231 | |||
| Increase in franchised restaurants and other expense |
4,030 | |||
| Decrease in general and administrative expense |
(385 | ) | ||
| Increase in other income (expense), net |
90 | |||
| (2) | Reflects adjustments to straight-line rent expense based on a re-assessment of remaining lease terms on the first day of the fiscal year ended January 31, 2011, adjustments to capital lease rental payments as a result of changes to reflect the revised fair values of capital lease obligations and the removal of historical income recognized for deferred rent to each of the respective statement of operations line items: |
| Pro Forma Adjustments |
||||
| Increase in franchised restaurants and other revenue |
$ | 192 | ||
| Increase in restaurant operating costs |
709 | |||
| Increase in franchised restaurants and other expense |
302 | |||
| Increase in general and administrative expense |
329 | |||
| Decrease in other income (expense), net |
(130 | ) | ||
65
Table of Contents
| (3) | Represents the following items: |
| Pro Forma Adjustments |
||||||||
| Decrease in franchised restaurants and other revenue |
(a | ) | $ | (207) | ||||
| Decrease in general and administrative expense |
(b | ) | (13,182) | |||||
| Increase in general and administrative expense |
(c | ) | 1,075 | |||||
| Increase in general and administrative expense |
(d | ) | 1,281 | |||||
| Decrease in other operating expenses (income), net |
(e | ) | (33,694) | |||||
| Increase in other income (expense), net |
(e | ) | 14,283 | |||||
| (a) | Represents the removal of historical revenue recognized for deferred development fees received in advance of restaurant openings. |
| (b) | Represents the adjustment to share-based compensation expense to reverse the expense recorded for the acceleration of options and awards in connection with the Merger, to reverse the expense recorded under our Predecessor share-based compensation plans and to add the expense associated with the post-merger share-based compensation plan. See “Executive Compensation—Compensation Discussion and Analysis for Fiscal 2012—Elements of Executive Compensation—Equity Incentive Compensation.” |
| (c) | Represents the impact on compensation expense for the retention bonuses provided to our executive officers. See “Executive Compensation—Compensation Discussion and Analysis for Fiscal 2012—Elements of Executive Compensation—Retention Bonus.” |
| (d) | Represents management fees to be paid to Apollo Management. See “Certain Relationships and Related Party Transactions—Management Services Fee.” |
| (e) | Represents the removal of historical costs related to the Transactions. |
| (4) | Pro forma adjustments were made to record incremental interest expense arising as a result of the Transactions, including the amortization of original issue discount on our Senior Secured Notes, the amortization of deferred financing costs, estimated fees under our Credit Facility and the revised fair values of capital lease obligations. |
| (5) | Pro forma adjustments were recorded to adjust our estimated effective income tax rate to our statutory income tax rate of 38.3% for the fiscal year ended January 31, 2011. |
66
Table of Contents
Fiscal Year—Consolidated
| Successor | Pro Forma | Predecessor | ||||||||||
| Fiscal 2012 | Fiscal 2011 | Fiscal 2010 | ||||||||||
| Revenue: |
||||||||||||
| Company-operated restaurants |
$ | 1,122,430 | $ | 1,099,284 | $ | 1,084,474 | ||||||
| Franchised restaurants and other |
157,897 | 233,518 | 334,259 | |||||||||
|
|
|
|
|
|
|
|||||||
| Total revenue |
1,280,327 | 1,332,802 | 1,418,733 | |||||||||
|
|
|
|
|
|
|
|||||||
| Operating costs and expenses: |
||||||||||||
| Restaurant operating costs |
939,615 | 911,020 | 881,397 | |||||||||
| Franchised restaurants and other |
81,372 | 158,916 | 254,124 | |||||||||
| Advertising |
65,061 | 64,128 | 64,443 | |||||||||
| General and administrative |
130,858 | 133,810 | 134,579 | |||||||||
| Facility action charges, net |
(6,018 | ) | 2,273 | 4,695 | ||||||||
| Other operating expenses (income), net |
545 | (3,442 | ) | — | ||||||||
|
|
|
|
|
|
|
|||||||
| Total operating costs and expenses |
1,211,433 | 1,266,705 | 1,339,238 | |||||||||
|
|
|
|
|
|
|
|||||||
| Operating income |
68,894 | 66,097 | 79,495 | |||||||||
| Interest expense |
(98,124 | ) | (79,842 | ) | (19,254 | ) | ||||||
| Other (expense) income, net |
(1,658 | ) | 2,279 | 2,935 | ||||||||
|
|
|
|
|
|
|
|||||||
| (Loss) income before income taxes |
(30,888 | ) | (11,466 | ) | 63,176 | |||||||
| Income tax (benefit) expense |
(11,609 | ) | (4,391 | ) | 14,978 | |||||||
|
|
|
|
|
|
|
|||||||
| Net (loss) income |
$ | (19,279 | ) | $ | (7,075 | ) | $ | 48,198 | ||||
|
|
|
|
|
|
|
|||||||
| Blended company-operated average unit volume (trailing-52 weeks) |
$ | 1,257 | $ | 1,207 | $ | 1,206 | ||||||
| Blended domestic franchise-operated average unit volume (trailing-52 weeks) |
1,070 | 1,042 | 1,027 | |||||||||
| Blended company-operated same-store sales increase (decrease) |
3.5 | % | (0.8 | )% | (3.9 | )% | ||||||
| Blended domestic franchise-operated same-store sales increase (decrease) |
2.2 | % | 0.7 | % | (2.4 | )% | ||||||
| Company-operated restaurant-level adjusted EBITDA(1): |
||||||||||||
| Company-operated restaurants revenue |
$ | 1,122,430 | $ | 1,099,284 | $ | 1,084,474 | ||||||
| Less: restaurant operating costs |
(939,615 | ) | (911,020 | ) | (881,397 | ) | ||||||
| Add: depreciation and amortization expense |
70,994 | 66,393 | 63,096 | |||||||||
| Less: advertising expense |
(65,061 | ) | (64,128 | ) | (64,443 | ) | ||||||
|
|
|
|
|
|
|
|||||||
| Company-operated restaurant-level adjusted EBITDA |
$ | 188,748 | $ | 190,529 | $ | 201,730 | ||||||
|
|
|
|
|
|
|
|||||||
| Company-operated restaurant-level adjusted EBITDA margin |
16.8 | % | 17.3 | % | 18.6 | % | ||||||
| Franchise restaurant adjusted EBITDA(1) : |
||||||||||||
| Franchised restaurants and other revenue |
$ | 157,897 | $ | 233,518 | $ | 334,259 | ||||||
| Less: franchised restaurants and other expense |
(81,372 | ) | (158,916 | ) | (254,124 | ) | ||||||
| Add: depreciation and amortization expense |
7,679 | 8,094 | 3,130 | |||||||||
|
|
|
|
|
|
|
|||||||
| Franchise restaurant adjusted EBITDA |
$ | 84,204 | $ | 82,696 | $ | 83,265 | ||||||
|
|
|
|
|
|
|
|||||||
| (1) | Refer to definitions of company-operated restaurant-level non-GAAP measures and franchise restaurant adjusted EBITDA within “— Presentation of Non-GAAP Measures.” |
67
Table of Contents
Fiscal Year—Carl’s Jr.
| Successor | Pro Forma | Predecessor | ||||||||||
| Fiscal 2012 | Fiscal 2011 (1) | Fiscal 2010 | ||||||||||
| Company-operated restaurants revenue |
$ | 598,234 | $ | 592,904 | $ | 604,937 | ||||||
| Franchised restaurants and other revenue |
59,666 | 144,703 | 247,542 | |||||||||
|
|
|
|
|
|
|
|||||||
| Total revenue |
657,900 | 737,607 | 852,479 | |||||||||
|
|
|
|
|
|
|
|||||||
| Restaurant operating costs: |
||||||||||||
| Food and packaging |
181,149 | 173,158 | 170,703 | |||||||||
| Payroll and other employee benefits |
170,678 | 167,149 | 165,831 | |||||||||
| Occupancy and other |
150,570 | 150,626 | 145,566 | |||||||||
|
|
|
|
|
|
|
|||||||
| Total restaurant operating costs |
502,397 | 490,933 | 482,100 | |||||||||
|
|
|
|
|
|
|
|||||||
| Franchised restaurants and other expense |
32,824 | 117,649 | 214,971 | |||||||||
| Advertising expense |
36,065 | 35,116 | 36,730 | |||||||||
| General and administrative expense |
62,083 | 62,950 | 63,032 | |||||||||
| Facility action charges, net |
(5,701 | ) | 534 | 2,219 | ||||||||
| Gain on sale of distribution center assets |
— | (3,442 | ) | — | ||||||||
|
|
|
|
|
|
|
|||||||
| Operating income |
$ | 30,232 | $ | 33,867 | $ | 53,427 | ||||||
|
|
|
|
|
|
|
|||||||
| Company-operated average unit volume (trailing-52 weeks) |
$ | 1,411 | $ | 1,375 | $ | 1,438 | ||||||
| Domestic franchise-operated average unit volume (trailing-52 weeks) |
1,091 | 1,095 | 1,123 | |||||||||
| Company-operated same-store sales increase (decrease) |
1.9 | % | (4.8 | )% | (6.2 | )% | ||||||
| Domestic franchise-operated same-store sales decrease |
(0.9 | )% | (3.5 | )% | (5.6 | )% | ||||||
| Company-operated same-store transaction increase (decrease) |
0.6 | % | (3.7 | )% | (4.2 | )% | ||||||
| Company-operated average check (actual $) |
$ | 6.97 | $ | 6.85 | $ | 6.91 | ||||||
| Restaurant operating costs as a percentage of company-operated restaurants revenue: |
||||||||||||
| Food and packaging |
30.3 | % | 29.2 | % | 28.2 | % | ||||||
| Payroll and other employee benefits |
28.5 | % | 28.2 | % | 27.4 | % | ||||||
| Occupancy and other |
25.2 | % | 25.4 | % | 24.1 | % | ||||||
| Total restaurant operating costs |
84.0 | % | 82.8 | % | 79.7 | % | ||||||
| Advertising expense as a percentage of company-operated restaurants revenue |
6.0 | % | 5.9 | % | 6.1 | % | ||||||
| Company-operated restaurant-level adjusted EBITDA(2): |
||||||||||||
| Company-operated restaurants revenue |
$ | 598,234 | $ | 592,904 | $ | 604,937 | ||||||
| Less: restaurant operating costs |
(502,397 | ) | (490,933 | ) | (482,100 | ) | ||||||
| Add: depreciation and amortization expense |
34,366 | 32,913 | 31,113 | |||||||||
| Less: advertising expense |
(36,065 | ) | (35,116 | ) | (36,730 | ) | ||||||
|
|
|
|
|
|
|
|||||||
| Company-operated restaurant-level adjusted EBITDA |
$ | 94,138 | $ | 99,768 | $ | 117,220 | ||||||
|
|
|
|
|
|
|
|||||||
| Company-operated restaurant-level adjusted EBITDA margin |
15.7 | % | 16.8 | % | 19.4 | % | ||||||
| Franchise restaurant adjusted EBITDA(2): |
||||||||||||
| Franchised restaurants and other revenue |
$ | 59,666 | $ | 144,703 | $ | 247,542 | ||||||
| Less: franchised restaurants and other expense |
(32,824 | ) | (117,649 | ) | (214,971 | ) | ||||||
| Add: depreciation and amortization expense |
3,419 | 3,582 | 1,889 | |||||||||
|
|
|
|
|
|
|
|||||||
| Franchise restaurant adjusted EBITDA |
$ | 30,261 | $ | 30,636 | $ | 34,460 | ||||||
|
|
|
|
|
|
|
|||||||
| (1) | The unaudited pro forma fiscal 2011 financial information includes pro forma adjustments to reflect the impacts of acquisition accounting for depreciation and amortization, straight-line rent, capital lease rental payments, deferred rent and deferred development fees, and adjustments to give effect to the Transactions as |
68
Table of Contents
| if they had occurred on January 26, 2010 for share-based compensation expense, retention bonuses, and management fees. Refer to further discussion of the adjustments within “— Unaudited Pro Forma Condensed Consolidated Statement of Operations.” |
| (2) | Refer to definitions of company-operated restaurant-level non-GAAP measures and franchise restaurant adjusted EBITDA within the subheading “— Presentation of Non-GAAP Measures.” |
69
Table of Contents
Fiscal Year—Hardee’s
| Successor | Pro Forma |
Predecessor | ||||||||||
| Fiscal 2012 | Fiscal 2011 (1) | Fiscal 2010 | ||||||||||
| Company-operated restaurants revenue |
$ | 524,084 | $ | 506,153 | $ | 479,289 | ||||||
| Franchised restaurants and other revenue |
97,698 | 88,285 | 86,173 | |||||||||
|
|
|
|
|
|
|
|||||||
| Total revenue |
621,782 | 594,438 | 565,462 | |||||||||
|
|
|
|
|
|
|
|||||||
| Restaurant operating costs: |
||||||||||||
| Food and packaging |
163,197 | 151,700 | 138,939 | |||||||||
| Payroll and other employee benefits |
155,155 | 153,819 | 147,407 | |||||||||
| Occupancy and other |
118,722 | 114,236 | 112,635 | |||||||||
|
|
|
|
|
|
|
|||||||
| Total restaurant operating costs |
437,074 | 419,755 | 398,981 | |||||||||
|
|
|
|
|
|
|
|||||||
| Franchised restaurants and other expense |
48,548 | 41,267 | 39,149 | |||||||||
| Advertising expense |
28,996 | 29,012 | 27,713 | |||||||||
| General and administrative expense |
68,774 | 70,589 | 71,383 | |||||||||
| Facility action charges, net |
(297 | ) | 1,685 | 2,476 | ||||||||
|
|
|
|
|
|
|
|||||||
| Operating income |
$ | 38,687 | $ | 32,130 | $ | 25,760 | ||||||
|
|
|
|
|
|
|
|||||||
| Company-operated average unit volume |
$ | 1,117 | $ | 1,054 | $ | 1,002 | ||||||
| Domestic franchise-operated average unit volume (trailing-52 weeks) |
1,059 | 1,013 | 976 | |||||||||
| Company-operated same-store sales increase (decrease) |
5.2 | % | 4.4 | % | (0.9 | )% | ||||||
| Domestic franchise-operated same-store sales increase (decrease) |
4.0 | % | 3.4 | % | (0.3 | )% | ||||||
| Company-operated same-store transaction increase |
0.7 | % | 1.3 | % | 0.8 | % | ||||||
| Company-operated average check (actual $) |
$ | 5.38 | $ | 5.16 | $ | 5.03 | ||||||
| Restaurant operating costs as a percentage of company-operated restaurants revenue: |
||||||||||||
| Food and packaging |
31.1 | % | 30.0 | % | 29.0 | % | ||||||
| Payroll and other employee benefits |
29.6 | % | 30.4 | % | 30.8 | % | ||||||
| Occupancy and other |
22.7 | % | 22.6 | % | 23.5 | % | ||||||
| Total restaurant operating costs |
83.4 | % | 82.9 | % | 83.2 | % | ||||||
| Advertising expense as a percentage of company-operated restaurants revenue |
5.5 | % | 5.7 | % | 5.8 | % | ||||||
| Company-operated restaurant-level adjusted EBITDA(2): |
||||||||||||
| Company-operated restaurants revenue |
$ | 524,084 | $ | 506,153 | $ | 479,289 | ||||||
| Less: restaurant operating costs |
(437,074 | ) | (419,755 | ) | (398,981 | ) | ||||||
| Add: depreciation and amortization expense |
36,628 | 33,480 | 31,983 | |||||||||
| Less: advertising expense |
(28,996 | ) | (29,012 | ) | (27,713 | ) | ||||||
|
|
|
|
|
|
|
|||||||
| Company-operated restaurant-level adjusted EBITDA |
$ | 94,642 | $ | 90,866 | $ | 84,578 | ||||||
|
|
|
|
|
|
|
|||||||
| Company-operated restaurant-level adjusted EBITDA margin |
18.1 | % | 18.0 | % | 17.6 | % | ||||||
| Franchise restaurant adjusted EBITDA(2): |
||||||||||||
| Franchised restaurants and other revenue |
$ | 97,698 | $ | 88,285 | $ | 86,173 | ||||||
| Less: franchised restaurants and other expense |
(48,548 | ) | (41,267 | ) | (39,149 | ) | ||||||
| Add: depreciation and amortization expense |
4,260 | 4,512 | 1,241 | |||||||||
|
|
|
|
|
|
|
|||||||
| Franchise restaurant adjusted EBITDA |
$ | 53,410 | $ | 51,530 | $ | 48,265 | ||||||
|
|
|
|
|
|
|
|||||||
| (1) | The unaudited pro forma fiscal 2011 financial information includes pro forma adjustments to reflect the impacts of acquisition accounting for depreciation and amortization, straight-line rent, capital lease rental payments, deferred rent and deferred development fees, and adjustments to give effect to the Transactions as |
70
Table of Contents
| if they had occurred on January 26, 2010 for share-based compensation expense, retention bonuses, and management fees. Refer to further discussion of the adjustments within “— Unaudited Pro Forma Condensed Consolidated Statement of Operations.” |
| (2) | Refer to definitions of company-operated restaurant-level non-GAAP measures and franchise restaurant adjusted EBITDA within “— Presentation of Non-GAAP Measures.” |
Fiscal 2012 Compared with Pro Forma Fiscal 2011
Consolidated
Total Revenue
Total revenue decreased $52,475, or 3.9%, to $1,280,327 during fiscal 2012, as compared to pro forma fiscal 2011. The decrease was primarily due to a decrease of $86,891 of distribution center revenue resulting from the sale of our Carl’s Jr. distribution center assets on July 2, 2010 and the impact of fiscal 2011 containing one additional week. We estimate the additional week added approximately $22,000 to revenue in pro forma fiscal 2011. These decreases were partially offset by increases in company-operated same-store sales, which increases were 1.9% and 5.2% for Carl’s Jr. and Hardee’s, respectively. Total revenue, excluding both the Carl’s Jr. distribution center revenue and the estimated impact of the additional week in pro forma fiscal 2011, increased by $56,416, or 4.6%.
Restaurant Operating Costs
Restaurant operating costs increased $28,595, or 3.1%, to $939,615 during fiscal 2012, as compared to pro forma fiscal 2011. Restaurant operating costs as a percentage of company-operated restaurants revenue increased from 82.9% for pro forma fiscal 2011 to 83.7% for fiscal 2012. This increase in restaurant operating costs as a percentage of company-operated restaurants revenue was primarily due to a 110 basis point increase in food and packaging costs, which was partially offset by a 20 basis point decrease in payroll and other employee benefits expense and a 10 basis point decrease in occupancy and other expense. Payroll and other employee benefits expense for fiscal 2012 includes a charge of $1,976 related to the out-of-period Insurance Reserve Adjustment described in Note 1 of Notes to Consolidated Financial Statements included elsewhere in this prospectus.
Franchised Restaurants and Other Expense
Franchised restaurants and other expense decreased $77,544, or 48.8%, to $81,372 in fiscal 2012, as compared to pro forma fiscal 2011. This decrease is mainly due to an $86,170 decrease in distribution center costs resulting from the sale of our Carl’s Jr. distribution center assets on July 2, 2010. This decrease was partially offset by an increase of $5,877 in our Hardee’s equipment distribution center costs related directly to the increase in the Hardee’s equipment distribution center revenues and increased franchise operations and administration costs to support our long-term growth strategy.
Advertising Expense
Advertising expense as a percentage of company-operated restaurants revenue of 5.8% for fiscal 2012 was consistent with pro forma fiscal 2011.
General and Administrative Expense
General and administrative expense decreased $2,952, or 2.2%, to $130,858 in fiscal 2012, as compared to pro forma fiscal 2011. This decrease was primarily due to the write-off of $3,501 of capitalized software costs during pro forma fiscal 2011 that did not recur in fiscal 2012. This decrease was partially offset by an increase in bonus expense, which is based on our performance relative to executive management and operations bonus criteria.
71
Table of Contents
Facility Action Charges, Net
During fiscal 2012, net facility action charges was a gain of $6,018, which resulted primarily from a gain of $6,595 related to a lease termination and a gain of $1,024 related to an eminent domain transaction. These gains were partially offset by asset impairment charges of $766 and discount amortization of $479 related to the estimated liability for closed restaurants. For pro forma fiscal 2011, net facility action charges were $2,273, which primarily consisted of charges to adjust the estimated liability for closed restaurants of $905, asset impairment charges of $681, discount amortization of $470 related to the estimated liability for closed restaurants and charges for new restaurant closures of $462. See Note 16 of Notes to Consolidated Financial Statements included elsewhere in this prospectus for additional detail of the components of facility action charges, net.
Other Operating Expenses (Income), Net
Other operating expenses, net of $545 for fiscal 2012 was comprised entirely of transaction-related costs for accounting, legal and other costs associated with the Transactions. Other operating income, net for pro forma fiscal 2011 of $3,442 was comprised entirely of the gain on sale of our Carl’s Jr. distribution center assets.
Interest Expense
Interest expense increased $18,282, or 22.9%, in fiscal 2012, as compared with pro forma fiscal 2011, due primarily to interest expense related to our Toggle Notes that were issued during fiscal 2012. This increase was partially offset by the impact of reduced interest expense related to our Senior Secured Notes as a result of the early extinguishment of $67,878 of the principal amount of these notes during fiscal 2012.
Other (Expense) Income, Net
During fiscal 2012, we recorded $1,658 of other expense, net as compared to $2,279 of other income, net for pro forma fiscal 2011. The change in other (expense) income, net is primarily attributable to a loss of $2,976 recorded on the early extinguishment of portions of our Senior Secured Notes and Toggle Notes in fiscal 2012.
Carl’s Jr.
Company-Operated Restaurants Revenue
Revenue from company-operated Carl’s Jr. restaurants increased $5,330, or 0.9%, to $598,234 during fiscal 2012, as compared to pro forma fiscal 2011. This increase was primarily due to the 1.9% increase in company-operated same-store sales, which was partially offset by the impact of fiscal 2011 containing one additional week. We estimate the additional week added approximately $10,855 to company-operated restaurants revenue in pro forma fiscal 2011.
72
Table of Contents
Company-Operated Restaurant-Level Adjusted EBITDA Margin
The changes in company-operated restaurant-level adjusted EBITDA margin are summarized as follows:
| Company-operated restaurant-level adjusted EBITDA margin for pro forma fiscal 2011 |
16.8 | % | ||
| Increase in food and packaging costs |
(1.1 | ) | ||
| Payroll and other employee benefits: |
||||
| Increase in workers’ compensation expense |
(0.3 | ) | ||
| Occupancy and other (excluding depreciation and amortization): |
||||
| Decrease in repairs and maintenance expense |
0.3 | |||
| Decrease in general liability insurance expense |
0.2 | |||
| Increase in credit card and banking fees |
(0.2 | ) | ||
| Other, net |
0.1 | |||
| Increase in advertising expense |
(0.1 | ) | ||
|
|
|
|||
| Company-operated restaurant-level adjusted EBITDA margin for fiscal 2012 |
15.7 | % | ||
|
|
|
Food and Packaging Costs
Food and packaging costs increased as a percentage of company-operated restaurants revenue during fiscal 2012, as compared to pro forma fiscal 2011, due primarily to increased commodity costs for beef, cheese and oil products.
Labor Costs
Workers’ compensation expense increased as a percentage of company-operated restaurants revenue during fiscal 2012, as compared to pro forma fiscal 2011, due primarily to unfavorable claims reserve adjustments in fiscal 2012 as a result of actuarial analyses of outstanding claims reserves contrasted with favorable claims reserve adjustments in pro forma fiscal 2011.
Occupancy and Other Costs
Repairs and maintenance expense decreased as a percentage of company-operated restaurants revenue during fiscal 2012, as compared to pro forma fiscal 2011, due primarily to decreased spending on contract services, repairs of restaurant equipment and building maintenance in the current fiscal year.
73
Table of Contents
Franchised Restaurants
| Successor | Pro Forma | |||||||
| Fiscal 2012 |
Fiscal 2011 (1) |
|||||||
| Franchised restaurants and other revenue: |
||||||||
| Royalties |
$ | 34,685 | $ | 33,483 | ||||
| Distribution centers—food, packaging and supplies |
— | 86,891 | ||||||
| Rent and other occupancy |
22,573 | 23,580 | ||||||
| Franchise fees |
2,408 | 749 | ||||||
|
|
|
|
|
|||||
| Total franchised restaurants and other revenue |
$ | 59,666 | $ | 144,703 | ||||
|
|
|
|
|
|||||
| Franchised restaurants and other expense: |
||||||||
| Administrative expense (including provision for bad debts) |
$ | 11,678 | $ | 10,009 | ||||
| Distribution centers—food, packaging and supplies |
— | 86,170 | ||||||
| Rent and other occupancy |
21,146 | 21,470 | ||||||
|
|
|
|
|
|||||
| Total franchised restaurants and other expense |
$ | 32,824 | $ | 117,649 | ||||
|
|
|
|
|
|||||
| (1) | The unaudited pro forma fiscal 2011 financial information includes pro forma adjustments to reflect the impacts of acquisition accounting for depreciation and amortization, straight-line rent, capital lease rental payments, deferred rent and deferred development fees. Refer to further discussion of the adjustments within “— Unaudited Pro Forma Condensed Consolidated Statement of Operations.” |
Franchised restaurants and other revenue decreased $85,037, or 58.8%, to $59,666 in fiscal 2012, as compared to pro forma fiscal 2011. Distribution center sales of food, packaging and supplies to franchisees decreased by $86,891, due to the sale of our Carl’s Jr. distribution center assets on July 2, 2010. Franchise fee revenues increased by $1,659, or 221.5%, to $2,408 in fiscal 2012 due primarily to an increase in the number of franchised restaurant openings in fiscal 2012 as compared to pro forma fiscal 2011. Royalty revenues increased $1,202, or 3.6%, due primarily to the net increase of 64 franchised restaurants since the end fiscal 2011, partially offset by a 0.9% decrease in domestic franchise-operated same-store sales and the impact of fiscal 2011 containing an additional week.
Franchised restaurants and other expense decreased $84,825, or 72.1%, to $32,824 in fiscal 2012, as compared to pro forma fiscal 2011. This decrease is mainly due to an $86,170 decrease in distribution center costs resulting from the sale of our Carl’s Jr. distribution center assets. This decrease was partially offset by an increase of $1,669 in administrative expense from pro forma fiscal 2011, primarily caused by increased franchise operations and administration costs related to our international growth strategy.
Hardee’s
Company-Operated Restaurants Revenue
Revenue from company-operated restaurants increased $17,931 or 3.5%, to $524,084 in fiscal 2012, as compared to pro forma fiscal 2011. The increase is primarily due to the 5.2% increase in company-operated same-store sales, which was partially offset by the impact of fiscal 2011 containing one additional week. We estimate the additional week added approximately $8,954 to company-operated restaurants revenue in pro forma fiscal 2011.
74
Table of Contents
Company-Operated Restaurant-Level Adjusted EBITDA Margin
The changes in company-operated restaurant-level adjusted EBITDA margin are summarized as follows:
| Company-operated restaurant-level adjusted EBITDA margin for pro forma fiscal 2011 |
18.0 | % | ||
| Increase in food and packaging costs |
(1.2 | ) | ||
| Payroll and other employee benefits: |
||||
| Decrease in labor costs, excluding workers’ compensation |
1.0 | |||
| Increase in workers’ compensation expense |
(0.2 | ) | ||
| Occupancy and other (excluding depreciation and amortization): |
||||
| Decrease in utilities expense |
0.2 | |||
| Other, net |
0.1 | |||
| Decrease in advertising expense |
0.2 | |||
|
|
|
|||
| Company-operated restaurant-level adjusted EBITDA margin for fiscal 2012 |
18.1 | % | ||
|
|
|
Food and Packaging Costs
Food and packaging costs increased as a percentage of company-operated restaurants revenue during fiscal 2012, as compared to pro forma fiscal 2011, mainly due to an increase in commodity costs for beef, pork and oil products.
Labor Costs
Labor costs, excluding workers’ compensation expense, decreased as a percentage of company-operated restaurants revenue during fiscal 2012, as compared to pro forma fiscal 2011, due primarily to more efficient use of labor in the restaurants and sales leverage resulting from the same-store sales increase.
Workers’ compensation expense increased as a percentage of company-operated restaurants revenue during fiscal 2012, as compared to pro forma fiscal 2011, primarily due to a charge of $1,976 related to the out-of-period Insurance Reserve Adjustment described in more detail in Note 1 of Notes to Consolidated Financial Statements included elsewhere in this prospectus.
Occupancy and Other Costs
Depreciation and amortization expense increased as a percentage of company-operated restaurants revenue during fiscal 2012, as compared to the prior fiscal year, due primarily to fixed asset additions, partially offset by sales leverage resulting from the same-store sales increase.
75
Table of Contents
Franchised Restaurants
| Successor | Pro Forma | |||||||
| Fiscal 2012 |
Fiscal 2011 (1) |
|||||||
| Franchised restaurants and other revenue: |
||||||||
| Royalties |
$ | 58,574 | $ | 55,486 | ||||
| Equipment sales |
24,927 | 18,884 | ||||||
| Rent and other occupancy |
13,036 | 13,111 | ||||||
| Franchise fees |
1,161 | 804 | ||||||
|
|
|
|
|
|||||
| Total franchised restaurants and other revenue |
$ | 97,698 | $ | 88,285 | ||||
|
|
|
|
|
|||||
| Franchised restaurants and other expense: |
||||||||
| Administrative expense (including provision for bad debts) |
$ | 12,518 | $ | 11,081 | ||||
| Equipment distribution center |
24,937 | 19,068 | ||||||
| Rent and other occupancy |
11,093 | 11,118 | ||||||
|
|
|
|
|
|||||
| Total franchised restaurants and other expense |
$ | 48,548 | $ | 41,267 | ||||
|
|
|
|
|
|||||
| (1) | The unaudited pro forma fiscal 2011 financial information includes pro forma adjustments to reflect the impacts of acquisition accounting for depreciation and amortization, straight-line rent, capital lease rental payments, deferred rent and deferred development fees. Refer to further discussion of the adjustments within “— Unaudited Pro Forma Condensed Consolidated Statement of Operations.” |
Franchised restaurants and other revenue increased $9,413, or 10.7%, to $97,698 during fiscal 2012, as compared to pro forma fiscal 2011. Equipment sales increased $6,043, or 32.0%, primarily due to an increase in equipment sales to franchisees. Royalty revenues increased $3,088, or 5.6%, as compared to pro forma fiscal 2011, due primarily to a net increase of 19 franchised restaurants since the end of fiscal 2011 and a 4.0% increase in our domestic franchise-operated same-store sales, partially offset by the impact of fiscal 2011 containing an additional week.
Franchised restaurants and other expense increased $7,281, or 17.6%, to $48,548 in fiscal 2012, as compared to pro forma fiscal 2011. Equipment distribution center expenses increased $5,869, or 30.8%, resulting directly from the increase in equipment sales to franchisees. The increase in administrative expense of $1,437 was primarily due to increased franchise operations and administration costs to support our long-term growth strategy.
Pro Forma Fiscal 2011 Compared with Fiscal 2010
Consolidated
Total Revenue
Total revenue decreased $85,931, or 6.1%, to $1,332,802 during pro forma fiscal 2011, as compared to fiscal 2010. This decrease was primarily caused by a decrease of $105,297 in revenue from our Carl’s Jr. distribution centers due to the sale of our Carl’s Jr. distribution center assets on July 2, 2010, partially offset by the impact of fiscal 2011 containing one additional week. We estimate the additional week added approximately $22,000 to revenue in pro forma fiscal 2011.
Restaurant Operating Costs
Restaurant operating costs increased $29,623, or 3.4%, to $911,020 during pro forma fiscal 2011, as compared to fiscal 2010. Restaurant operating costs as a percentage of company-operated restaurants revenue increased from 81.3% for fiscal 2010 to 82.9% for pro forma fiscal 2011. This increase in restaurant operating
76
Table of Contents
costs as a percentage of company-operated restaurants revenue was primarily due to a 100 basis point increase in food and packaging costs, a 30 basis point increase in payroll and other employee benefits expense and a 30 basis point increase in occupancy and other expense.
Franchised Restaurants and Other Expense
Franchised restaurants and other expense decreased $95,208, or 37.5%, to $158,916 in pro forma fiscal 2011, as compared to fiscal 2010. This decrease is mainly due to a decrease of $103,176 in distribution center costs resulting from the sale of our Carl’s Jr. distribution center assets on July 2, 2010. This decrease was partially offset by an increase in administrative expense resulting from an increase in amortization expense related to franchise agreements recorded in connection with the Merger.
Advertising Expense
Advertising expense decreased $315, or 0.5%, to $64,128 during pro forma fiscal 2011, as compared to fiscal 2010, and decreased 0.1% to 5.8% as a percentage of company-operated restaurants revenue from fiscal 2010 to pro forma fiscal 2011.
General and Administrative Expense
General and administrative expense decreased $769, or 0.6%, to $133,810 in pro forma fiscal 2011, as compared to fiscal 2010. This decrease was primarily due to a decrease in share-based compensation expense of $3,411 and a reduction of $2,925 in general corporate expenses resulting from various cost reduction initiatives in pro forma fiscal 2011. These decreases were partially offset by the write-off of $3,501 of capitalized software costs during pro forma fiscal 2011 and the management service fees of $2,541 recorded during pro forma fiscal 2011 pursuant to our management services agreement with Apollo Management VII, L.P. that did not occur in fiscal 2010.
Facility Action Charges, Net
Net facility action charges decreased $2,422 or 51.6%, to $2,273 in pro forma fiscal 2011 from fiscal 2010. The decrease is mainly due to a $2,799 decrease in impairment charges, which was partially offset by a $512 increase in adjustments to previously established liabilities for closed restaurants.
Other Operating Expenses, Net
During pro forma fiscal 2011, we recorded a gain of $3,442 for the sale of our Carl’s Jr. distribution center assets on July 2, 2010.
Interest Expense
Interest expense increased $60,588, or 314.7% in pro forma fiscal 2011, as compared with 2010. This increase was primarily caused by the interest incurred on the Senior Secured Notes.
Carl’s Jr.
Company-Operated Restaurants Revenue
Revenue from company-operated restaurants decreased $12,033 or 2.0%, to $592,904 during pro forma fiscal 2011, as compared to the prior year. This decrease was primarily due to the 4.8% decrease in company-operated same-store sales, which was partially offset by the impact of fiscal 2011 containing one additional week and the revenues generated from new company-operated restaurants opened since the end of fiscal 2010. We estimate the additional week added approximately $10,855 to company-operated restaurants revenue in pro forma fiscal 2011. Sales at Carl’s Jr. were negatively impacted during pro forma fiscal 2011 by the continued
77
Table of Contents
weakness in the overall economy and the resulting impact on unemployment rates and consumer spending, particularly in California where we had more than 360 company-operated Carl’s Jr. restaurants.
Company-Operated Restaurant-Level Adjusted EBITDA Margin
The changes in company-operated restaurant-level adjusted EBITDA margin are summarized as follows:
| Company-operated restaurant-level adjusted EBITDA margin for fiscal 2010 |
19.4 | % | ||
| Increase in food and packaging costs |
(1.0 | ) | ||
| Payroll and other employee benefits: |
||||
| Increase in labor costs, excluding workers’ compensation |
(0.7 | ) | ||
| Increase in workers’ compensation expense |
(0.1 | ) | ||
| Occupancy and other (excluding depreciation and amortization): |
||||
| Increase in rent expense |
(0.7 | ) | ||
| Increase in property tax expense |
(0.1 | ) | ||
| Other, net |
(0.2 | ) | ||
| Decrease in advertising expense |
0.2 | |||
|
|
|
|||
| Company-operated restaurant-level adjusted EBITDA margin for pro forma fiscal 2011 |
16.8 | % | ||
|
|
|
Food and Packaging Costs
Food and packaging costs increased as a percentage of company-operated restaurants revenue during pro forma fiscal 2011, as compared to fiscal 2010, due primarily to increased commodity costs for beef, pork and cheese products.
Labor Costs
Labor costs, excluding workers’ compensation, increased as a percentage of company-operated restaurants revenue during pro forma fiscal 2011, as compared to fiscal 2010, due primarily to the deleveraging impact of the decrease in same-store sales and the relatively fixed nature of restaurant management costs.
Occupancy and Other Costs
Rent expense increased as a percentage of company-operated restaurants revenue during pro forma fiscal 2011, as compared to fiscal 2010, due mainly to impacts of acquisition accounting related to the Merger and the deleveraging impact of the decrease in same-store sales and the relatively fixed nature of rent expense.
Depreciation and amortization expense increased as a percentage of company-operated restaurants revenue during pro forma fiscal 2011, as compared to fiscal 2010, mainly due to impacts of acquisition accounting related to the Merger, asset additions related to remodels, new store openings and equipment upgrades, as well as the deleveraging impact of the decrease in same-store sales and the relatively fixed nature of depreciation and amortization expense.
78
Table of Contents
Franchised Restaurants
| Pro Forma | Predecessor | |||||||
| Fiscal 2011 (1) | Fiscal 2010 | |||||||
| Franchised restaurants and other revenue: |
||||||||
| Royalties |
$ | 33,483 | $ | 32,346 | ||||
| Distribution centers—food, packaging and supplies |
86,891 | 192,188 | ||||||
| Rent and other occupancy |
23,580 | 21,674 | ||||||
| Franchise fees |
749 | 1,334 | ||||||
|
|
|
|
|
|||||
| Total franchised restaurants and other revenue |
$ | 144,703 | $ | 247,542 | ||||
|
|
|
|
|
|||||
| Franchised restaurants and other expense: |
||||||||
| Administrative expense (including provision for bad debts) |
$ | 10,009 | $ | 6,560 | ||||
| Distribution centers—food, packaging and supplies |
86,170 | 189,346 | ||||||
| Rent and other occupancy |
21,470 | 19,065 | ||||||
|
|
|
|
|
|||||
| Total franchised restaurants and other expense |
$ | 117,649 | $ | 214,971 | ||||
|
|
|
|
|
|||||
| (1) | The unaudited pro forma fiscal 2011 financial information includes pro forma adjustments to reflect the impacts of acquisition accounting for depreciation and amortization, straight-line rent, capital lease rental payments, deferred rent and deferred development fees. Refer to further discussion of the adjustments within “—Unaudited Pro Forma Condensed Consolidated Statement of Operations.” |
Franchised restaurants and other revenue decreased by $102,839, or 41.5%, to $144,703 in pro forma fiscal 2011, as compared to fiscal 2010. Distribution center sales of food, packaging and supplies to franchisees decreased by $105,297, due to the sale of our Carl’s Jr. distribution center assets on July 2, 2010. Rent and other occupancy revenue increased $1,906 primarily as a result of the net impact of the amortization of favorable and unfavorable leases and subleases recorded in connection with the Merger. Royalty revenues increased by $1,137, or 3.5%, due to a net increase of 24 franchised restaurants in fiscal 2011 and the additional week included in fiscal 2011, partially offset by a decrease of 3.5% in franchise-operated same-store sales.
Franchised restaurants and other expense decreased by $97,322, or 45.3%, to $117,649 in pro forma fiscal 2011, as compared to fiscal 2010. This decrease is mainly due to a $103,176 decrease in distribution center costs resulting from the sale of our Carl’s Jr. distribution center assets. This decrease was partially offset by an increase of $3,449 in administrative expense caused primarily as a result of the impact of the amortization of franchise agreements recorded in connection with the Merger. Rent and other occupancy expense increased $2,405 in pro forma fiscal 2011, as compared to fiscal 2010, primarily as a result of the net impact of the amortization of favorable and unfavorable leases recorded in connection with the Merger.
Hardee’s
Company-Operated Restaurants Revenue
Revenue from company-operated restaurants increased $26,864, or 5.6%, to $506,153 in pro forma fiscal 2011 from fiscal 2010. The increase is primarily due to the 4.4% increase in company-operated same-store sales and the additional week included in fiscal 2011, partially offset by the net decrease of nine restaurants during pro forma fiscal 2011. We estimate the additional week added approximately $8,954 to company-operated restaurants revenue in fiscal 2011. Our successful promotion of premium products such as the Hand-Breaded Chicken Tenders and popular breakfast items including Biscuit Holes and Made from Scratch Biscuits helped to offset the negative impacts caused by continued economic weakness.
79
Table of Contents
Company-Operated Restaurant-Level Adjusted EBITDA Margin
The changes in company-operated restaurant-level adjusted EBITDA margin are summarized as follows:
| Company-operated restaurant-level adjusted EBITDA margin for fiscal 2010 |
17.6 | % | ||
| Increase in food and packaging costs |
(1.0 | ) | ||
| Payroll and other employee benefits: |
||||
| Decrease in labor costs, excluding workers’ compensation |
0.6 | |||
| Increase in workers’ compensation expense |
(0.2 | ) | ||
| Occupancy and other (excluding depreciation and amortization): |
||||
| Decrease in utilities expense |
0.4 | |||
| Decrease in repairs and maintenance expense |
0.2 | |||
| Decrease in general liability insurance |
0.1 | |||
| Other, net |
0.2 | |||
| Decrease in advertising expense |
0.1 | |||
|
|
|
|||
| Company-operated restaurant-level adjusted EBITDA margin for pro forma fiscal 2011 |
18.0 | % | ||
|
|
|
Food and Packaging Costs
Food and packaging costs increased as a percentage of company-operated restaurants revenue during pro forma fiscal 2011, as compared to fiscal 2010, mainly due to an increase in commodity costs for pork, beef, cheese and dairy products.
Labor Costs
Labor costs, excluding workers’ compensation expense, decreased as a percentage of company-operated restaurants revenue during pro forma fiscal 2011, as compared to fiscal 2010, due primarily to the favorable impact from additional sales leverage and favorable employer payroll tax legislation, partially offset by the impact of minimum wage rate increases that took place in the second quarter of fiscal 2010.
Occupancy and Other Costs
Utilities expense decreased as a percentage of company-operated restaurants revenue during pro forma fiscal 2011, as compared to fiscal 2010, mainly due a decrease in natural gas rates and sales leverage caused by the increase in company-operated same-store sales.
80
Table of Contents
Franchised Restaurants
| Pro Forma | Predecessor | |||||||
| Fiscal 2011 (1) | Fiscal 2010 | |||||||
| Franchised restaurants and other revenue: |
||||||||
| Royalties |
$ | 55,486 | $ | 51,557 | ||||
| Equipment sales |
18,884 | 21,630 | ||||||
| Rent and other occupancy |
13,111 | 11,922 | ||||||
| Franchise fees |
804 | 1,064 | ||||||
|
|
|
|
|
|||||
| Total franchised restaurants and other revenue |
$ | 88,285 | $ | 86,173 | ||||
|
|
|
|
|
|||||
| Franchised restaurants and other expense: |
||||||||
| Administrative expense (including provision for bad debts) |
$ | 11,081 | $ | 9,297 | ||||
| Equipment distribution center |
19,068 | 21,199 | ||||||
| Rent and other occupancy |
11,118 | 8,653 | ||||||
|
|
|
|||||||
| Total franchised restaurants and other expense |
$ | 41,267 | $ | 39,149 | ||||
|
|
|
|
|
|||||
| (1) | The unaudited pro forma fiscal 2011 financial information includes pro forma adjustments to reflect the impacts of acquisition accounting for depreciation and amortization, straight-line rent, capital lease rental payments, deferred rent and deferred development fees. Refer to further discussion of the adjustments within “—Unaudited Pro Forma Condensed Consolidated Statement of Operations.” |
Liquidity and Capital Resources
Overview
Our cash requirements consist principally of our food and packaging purchases; labor, and occupancy costs; capital expenditures for restaurant remodels and refreshes, new restaurant construction and replacement of equipment; debt service requirements; advertising expenditures; and general and administrative expenses. In addition, on June 15, 2012, the holders of the Senior Secured Notes were notified that we will redeem $60,000 of the principal amount of our Senior Secured Notes on July 16, 2012, at a redemption price of 103% of the principal amount of the Senior Secured Notes being redeemed. On July 16, 2012, we will be required to make an interest payment of $30,264 on our Senior Secured Notes. Following the partial redemption of $60,000 of our Senior Secured Notes on July 16, 2012, and assuming no other redemptions, we will be required to make semi-annual interest payments on our Senior Secured Notes of approximately $26,852. As discussed below, our Credit Facility matures on July 12, 2015, our Senior Secured Notes mature on July 15, 2018 and our Toggle Notes mature on March 14, 2016. Based on our current capital spending projections, we expect capital expenditures to be between $60,000 and $70,000 for fiscal 2013.
We expect that our cash on hand and future cash flows from operations will provide sufficient liquidity to allow us to meet our operating and capital requirements, service our existing debt and complete the partial redemption of our Senior Secured Notes on July 16, 2012. As of May 21, 2012, we had $125,447 in cash and cash equivalents and $69,087 in available commitments under our Credit Facility to help meet our operating and capital requirements.
Credit Facility
Our Credit Facility provides for senior secured revolving facility loans, swingline loans and letters of credit, in an aggregate amount of up to $100,000. The Credit Facility bears interest at a rate equal to, at our option, either: (1) the higher of Morgan Stanley’s “prime rate” plus 2.75% or the federal funds rate, as defined in our
81
Table of Contents
Credit Facility, plus 3.25%, or (2) the LIBOR plus 3.75%. The Credit Facility matures on July 12, 2015, at which time all outstanding revolving facility loans and accrued and unpaid interest must be repaid. As of May 21, 2012, we had no outstanding loan borrowings, $30,913 of outstanding letters of credit, and remaining availability of $69,087 under our Credit Facility.
All obligations under the Credit Facility are unconditionally guaranteed by CKE and by CKE Restaurants’ existing and future wholly-owned domestic subsidiaries. In addition, all obligations are secured by CKE Restaurants’ common stock, substantially all of CKE Restaurants’ material owned assets and substantially all of the material owned assets of the subsidiary guarantors.
Pursuant to the terms of our Credit Facility, during each fiscal year, the capital expenditures of CKE Restaurants and its consolidated subsidiaries cannot exceed the sum of (1) the greater of (i) $100,000 and (ii) 8.5% of CKE Restaurants’ consolidated gross total tangible assets as of the end of such fiscal year plus, without duplication, (2) 10% of certain assets acquired in permitted acquisitions during such fiscal year (the “Acquired Assets Amount”) and (3) 5% of the Acquired Assets Amount for the preceding fiscal year, calculated on a cumulative basis. In addition, the annual base amount of permitted capital expenditures may be increased by an amount equal to any cumulative credit (as defined in the Credit Facility) which we elect to apply for this purpose and may be carried-back and/or carried-forward subject to the terms set forth in the Credit Facility.
The Credit Facility contains covenants that restrict the ability of CKE Restaurants and its consolidated subsidiaries to: incur additional indebtedness; pay dividends on its capital stock or redeem, repurchase or retire its capital stock or indebtedness; make investments, loans, advances and acquisitions; create restrictions on the payment of dividends or other amounts to us from our subsidiaries; sell assets, including capital stock of our subsidiaries; consolidate or merge; create liens; enter into sale and leaseback transactions; amend, modify or permit the amendment or modification of any senior secured second lien note documents; engage in certain transactions with our affiliates; issue capital stock; create subsidiaries; and change the business conducted by CKE Restaurants or its subsidiaries.
The terms of our Credit Facility also include financial performance covenants applicable to CKE Restaurants and its consolidated subsidiaries, which include a maximum secured leverage ratio and a specified minimum interest coverage ratio. Our Credit Facility defines CKE Restaurants’ consolidated secured leverage ratio as the ratio of its: (1) Total Secured Debt plus eight times Net Rent less Unrestricted Cash and Permitted Investments; over (2) Adjusted EBITDAR, each as defined in our Credit Facility. In determining CKE Restaurants’ consolidated Total Secured Debt for the purpose of these financial covenants, we include the Senior Secured Notes and its other long-term secured debt, capital lease obligations and the portion of the proceeds from financing method sale-leaseback transactions equal to the net book value of the associated properties. As of May 21, 2012, the net book value of the assets associated with financing method sale-leaseback transactions was $71,580. See “—Sale-Leaseback Transactions” below and Note 5 of Notes to Condensed Consolidated Financial Statements included elsewhere in this prospectus for further discussion of these sale-leaseback transactions. Our Credit Facility defines CKE Restaurants’ consolidated interest coverage ratio as the ratio of its Adjusted EBITDA to its Cash Interest Expense, each as defined in our Credit Facility. As of May 21, 2012, these financial performance covenants did not limit our ability to draw on the remaining availability of $69,087 under our Credit Facility.
We are currently in compliance with the covenants of our Credit Facility.
The terms of our Credit Facility are not impacted by any changes in our credit rating. We believe the key company-specific factors affecting our ability to maintain our existing debt financing relationships and to access such capital in the future are our present and expected levels of profitability, cash flows from operations, capital expenditures, asset collateral bases and the level of our Adjusted EBITDA relative to our debt obligations. In addition, as noted above, our Credit Facility includes significant restrictions on future financings including, among others, limits on the amount of indebtedness CKE Restaurants and its consolidated subsidiaries may incur or which may be secured by any of the assets of CKE Restaurants and its consolidated subsidiaries.
82
Table of Contents
Senior Secured Second Lien Notes
In connection with the Merger, on July 12, 2010, CKE Restaurants issued $600,000 aggregate principal amount of the Senior Secured Notes in a private placement to qualified institutional buyers. These Senior Secured Notes were exchanged in December 2010 for substantially identical Senior Secured Notes that were registered with the SEC. The Senior Secured Notes are guaranteed by each domestic subsidiary of CKE Restaurants and are secured by a second priority lien on all assets of CKE Restaurants and its subsidiaries that secure the Credit Facility. During fiscal 2012, we extinguished through redemptions (in accordance with the terms of the indenture governing the Senior Secured Notes) and an open market purchase a total of $67,878 of the principal amount of the Senior Secured Notes for cash payments of $69,685, plus $1,264 of accrued and unpaid interest. As of May 21, 2012, the aggregate principal amount of the Senior Secured Notes outstanding was $532,122. The Senior Secured Notes bear interest at a rate of 11.375% per annum, payable semi-annually in arrears on January 15 and July 15. As of May 21, 2012, the carrying value of the Senior Secured Notes was $523,544, which is presented net of the remaining unamortized original issue discount of $8,578. The Senior Secured Notes mature on July 15, 2018.
The indenture governing the Senior Secured Notes contains restrictive covenants that limit CKE Restaurants’ and its guarantor subsidiaries’ ability to, among other things: incur or guarantee additional debt or issue certain preferred equity; pay dividends, make capital stock distributions or other restricted payments; make certain investments; sell certain assets; create or incur liens on certain assets to secure debt; consolidate, merge, sell or otherwise dispose of all or substantially all of their assets; enter into certain transactions with affiliates; and designate subsidiaries as unrestricted subsidiaries. Failure to comply with these covenants constitutes a default and may lead to the acceleration of the principal amount and accrued but unpaid interest on the Senior Secured Notes.
We are currently in compliance with the covenants included in the indenture governing Senior Secured Notes.
On June 15, 2012, the holders of the Senior Secured Notes were notified that we will redeem $60,000 aggregate principal amount of Senior Secured Notes outstanding on July 16, 2012, at a redemption price of 103% of the principal amount of the Senior Secured Notes being redeemed, pursuant to the terms of the indenture governing the Senior Secured Notes.
Additionally, in accordance with the indenture governing the Senior Secured Notes, we are required to make offers to repurchase a portion of the Senior Secured Notes at a price of 103% of the principal amount of the Senior Secured Notes with a portion of the net proceeds received from sale-leaseback transactions. Pursuant to these requirements, on December 1, 2011, we commenced a tender offer to purchase up to $27,871 of the principal amount of the Senior Secured Notes, which tender offer expired on December 29, 2011, with no Senior Secured Notes tendered. As a result of further sale-leaseback transactions completed since the December 2011 tender offer and expected to be completed during the second quarter of fiscal 2013, we expect we will be required to commence a second tender offer to purchase Senior Secured Notes. However, this requirement is dependent upon the completion of future sale-leaseback transactions, which may or may not be completed.
We may make further redemptions of the Senior Secured Notes prior to the maturity date in the following circumstances: (1) on or prior to July 15, 2013, we may redeem up to 35% of the original aggregate principal amount of the Senior Secured Notes (provided at least 65% of the original aggregate principal amount of the Senior Secured Notes remains outstanding after such redemption) with the proceeds of certain equity offerings, including this offering, at a redemption price of 111.375% of the aggregate principal amount of the Senior Secured Notes being redeemed plus accrued and unpaid interest, (2) during the 12-month period beginning July 15, 2013, we may redeem up to $60,000 of the aggregate principal amount of the Senior Secured Notes at a redemption price of 103% of the aggregate principal amount of the Senior Secured Notes being redeemed plus accrued and unpaid interest, (3) on or after July 15, 2014, we may redeem all or any portion of the Senior Secured Notes during the 12-month periods commencing July 15, 2014, July 15, 2015, July 15, 2016 and July 15,
83
Table of Contents
2017 and thereafter at redemption prices of 105.688%, 102.844%, 101.422% and 100%, respectively, of the aggregate principal amount of the Senior Secured Notes being redeemed plus accrued and unpaid interest, and (4) prior to July 15, 2014, we may redeem all or any portion of the Senior Secured Notes at a price equal to 100% of the aggregate principal amount of the Senior Secured Notes being redeemed plus a make-whole premium and accrued and unpaid interest. Upon a change in control, the holders of the Senior Secured Notes each have the right to require us to redeem their Senior Secured Notes at a redemption price of 101% of the aggregate principal amount of the Senior Secured Notes being redeemed plus accrued and unpaid interest.
Senior Unsecured PIK Toggle Notes
On March 14, 2011, CKE issued $200,000 aggregate principal amount of the Toggle Notes. The net proceeds, after payment of offering expenses, were distributed to our corporate parent. The Toggle Notes were issued with an original issue discount of 1.885%, or $3,770. The interest on the Toggle Notes, which is payable semi-annually on March 15 and September 15 of each year, can, at CKE’s option, be paid (1) entirely in cash, at a rate of 10.50% (“Cash Interest”), (2) entirely by increasing the principal amount of the Toggle Notes or by issuing new Toggle Notes for the entire amount of the interest payment, at a rate per annum equal to the cash interest rate of 10.50% plus 0.75% (“PIK Interest”) or (3) with a 25%/75%, 50%/50% or 75%/25% combination of Cash Interest and PIK Interest. The Toggle Notes (and PIK Interest thereon) mature on March 14, 2016.
During the sixteen weeks ended May 21, 2012 and fiscal 2012, we made our March 15, 2012 and September 15, 2011 interest payments on the Toggle Notes of $11,326 and $11,313, respectively, entirely in PIK Interest. We have also elected to pay the September 15, 2012, interest payment entirely in PIK Interest. In addition, CKE Restaurants purchased, in open market transactions, a total of $9,948 principal amount of the Toggle Notes (the “Purchased Toggle Notes”) for $8,362 during fiscal 2012. For accounting purposes, the Purchased Toggle Notes were constructively retired at the time of purchase. As of May 21, 2012, the remaining aggregate principal amount of the Toggle Notes outstanding was $212,691. The carrying value of the Toggle Notes as of May 21, 2012, was $209,556, which is presented net of the remaining unamortized original issue discount on the Toggle Notes of $3,135.
The indenture governing the Toggle Notes contains restrictive covenants that limit our and our subsidiaries’ ability to, among other things: incur or guarantee additional debt or issue certain preferred equity; pay dividends, make capital distributions or other restricted payments; make certain investments; sell certain assets; create or incur liens on certain assets to secure debt; consolidate, merge, sell or otherwise dispose of all or substantially all of our assets; enter into certain transactions with affiliates; and designate subsidiaries as unrestricted subsidiaries. Failure to comply with these covenants constitutes a default and may lead to acceleration of the principal amount and accrued but unpaid interest on the Toggle Notes.
We are currently in compliance with the covenants included in the indenture governing the Toggle Notes.
We may redeem the Toggle Notes prior to the maturity date in the following circumstances: (1) prior to March 14, 2013, we may redeem up to 35% of the original aggregate principal amount of the Toggle Notes with the proceeds of certain equity offerings, including this offering, at a redemption price of 110.500% of the aggregate principal amount of the Toggle Notes being redeemed plus accrued and unpaid interest, (2) on or after March 14, 2013, we may redeem all or a portion of the Toggle Notes during the 12-month periods commencing March 14, 2013, March 14, 2014 and March 14, 2015 and thereafter at redemption prices of 105.250%, 102.625%, and 100%, respectively, of the aggregate principal amount of the Toggle Notes being redeemed plus accrued and unpaid interest, and (3) prior to March 14, 2013, we may redeem all or a portion of the Toggle Notes at a price equal to 100% of the aggregate principal amount of the Toggle Notes being redeemed plus a make-whole premium and accrued and unpaid interest. Upon a change of control, the holders of the Toggle Notes have the right to require us to redeem their Toggle Notes at a redemption price of 101% of the aggregate principal amount of the Toggle Notes being purchased plus accrued and unpaid interest.
84
Table of Contents
Sale-Leaseback Transactions
During the sixteen weeks ended May 21, 2012 and fiscal 2012, we entered into agreements with independent third parties under which we sold and leased back 20 and 47 restaurant properties, respectively. The initial minimum lease terms are 20 years, and the leases include renewal options and right of first offer provisions that, for accounting purposes, constitute continuing involvement with the associated restaurant properties. Due to this continuing involvement, these sale-leaseback transactions are accounted for under the financing method, rather than as completed sales. Under the financing method, we include the sales proceeds received in other long-term liabilities until our continuing involvement with the properties is terminated, report the associated property as owned assets, continue to depreciate the assets over their remaining useful lives, and record the rental payments as interest expense. Closing costs and other fees related to these sale-leaseback transactions are recorded as deferred financing costs and amortized to interest expense over the initial minimum lease term. When and if our continuing involvement with a property terminates and the sale of that property is recognized for accounting purposes, we expect to record a gain equal to the excess of the proceeds received over the remaining net book value of the associated restaurant property and any unamortized deferred financing costs. During the sixteen weeks ended May 21, 2012 and fiscal 2012, we received proceeds of $29,946 and $67,454, respectively, in connection with these transactions.
The cumulative proceeds received in connection with financing method sale-leaseback transactions of $97,400 and $67,454 are included in other long-term liabilities in our Condensed Consolidated Balance Sheets as of May 21, 2012 and January 31, 2012, respectively. The net book value of the associated assets, which is included in property and equipment, net of accumulated depreciation and amortization in our Condensed Consolidated Balance Sheets, was $71,580 and $48,722 as of May 21, 2012 and January 31, 2012, respectively.
We expect that we will sell and leaseback additional restaurant properties in the future; however, there can be no assurance as to the number of transactions we will be able to complete, the amount of proceeds we will generate or whether we will be able to complete additional sale-leaseback transactions at all. See Note 5 of Notes to Condensed Consolidated Financial Statements included elsewhere in this prospectus for further discussion.
Cash Flows
Fiscal Quarter Discussion
During the sixteen weeks ended May 21, 2012, cash provided by operating activities was $58,369, an increase of $4,072, or 7.5%, compared with the sixteen weeks ended May 23, 2011. Net income of $6,696 for the sixteen weeks ended May 21, 2012 includes certain income and expense items that are excluded in deriving cash flows from operations, including depreciation and amortization expense of $25,467, interest expense converted to long-term debt of $11,326, share-based compensation expense of $1,417, amortization of $1,682 for deferred financing costs and discount on notes and a deferred income tax benefit of $6,402. Additionally, changes in our operating assets and liabilities of $17,910 resulted in an increase to cash flows from operations. The amounts of our operating assets and liabilities can vary significantly from quarter to quarter, depending upon the timing of large customer receipts and payments to vendors, but they are not anticipated to be a significant source or use of cash over the long term.
Cash used in investing activities during the sixteen weeks ended May 21, 2012 totaled $14,461, which principally consisted of purchases of property and equipment of $15,725, partially offset by $841 of collections of non-trade notes receivable and $350 of proceeds from the sale of property and equipment.
85
Table of Contents
Capital expenditures were as follows:
| Sixteen Weeks Ended May 21, 2012 |
Sixteen Weeks Ended May 23, 2011 |
|||||||
| Remodels: |
||||||||
| Carl’s Jr. |
$ | 980 | $ | 44 | ||||
| Hardee’s |
2,148 | 4,282 | ||||||
| Capital maintenance: |
||||||||
| Carl’s Jr. |
1,969 | 1,849 | ||||||
| Hardee’s |
2,591 | 3,392 | ||||||
| New restaurants and rebuilds: |
||||||||
| Carl’s Jr. |
4,538 | 1,968 | ||||||
| Hardee’s |
138 | 1,190 | ||||||
| Dual-branding: |
||||||||
| Carl’s Jr. |
16 | 244 | ||||||
| Hardee’s |
772 | 234 | ||||||
| Real estate |
1,984 | 11 | ||||||
| Corporate and other |
589 | 367 | ||||||
|
|
|
|
|
|||||
| Total |
$ | 15,725 | $ | 13,581 | ||||
|
|
|
|
|
|||||
Capital expenditures for the sixteen weeks ended May 21, 2012 increased $2,144, or 15.8%, from the comparable prior year period, mainly due to increases of $1,973 in real estate acquisitions and $1,518 in new restaurants and rebuilds, partially offset by decreases of $1,198 in remodels and $681 in capital maintenance. Based on our current capital spending projections, we expect capital expenditures to be between $60,000 and $70,000 for fiscal 2013.
Cash provided by financing activities during the sixteen weeks ended May 21, 2012 totaled $16,954, which principally consisted of proceeds of $29,946 from financing method sale-leaseback transactions, partially offset by $8,790 for net changes in bank overdraft, $2,524 for repayments of capital lease obligations and $1,676 for payment of deferred financing costs.
Fiscal Year Discussion
During fiscal 2012, cash provided by operating activities was $95,341. The net loss of $19,279 for fiscal 2012 includes certain income and expense items that are excluded in deriving cash flows from operations, including depreciation and amortization expense of $82,044, interest expense converted to long-term debt of $11,313, share-based compensation expense of $4,593, a loss of $2,976 recorded for the early extinguishment of notes and amortization of deferred financing costs and discount on notes of $4,821. Additionally, changes in our operating assets and liabilities resulted in an increase to cash flows from operations of $14,494. The amounts of our operating assets and liabilities can vary significantly from year to year, depending upon the timing of large customer receipts and payments to vendors, but they are not anticipated to be a significant source or use of cash over the long term.
Cash used in investing activities during fiscal 2012 totaled $49,505, which principally consisted of purchases of property and equipment of $52,423, partially offset by $1,985 of proceeds from the sale of property and equipment and $749 of collections of non-trade notes receivable.
86
Table of Contents
Capital expenditures for fiscal 2012 and 2011 were as follows:
| Successor | Successor/ Predecessor |
|||||||
| 2012 | 2011 | |||||||
| Remodels: |
||||||||
| Carl’s Jr. |
$ | 3,231 | $ | 2,617 | ||||
| Hardee’s |
10,477 | 15,537 | ||||||
| Capital maintenance: |
||||||||
| Carl’s Jr. |
12,573 | 11,051 | ||||||
| Hardee’s |
11,512 | 14,806 | ||||||
| New restaurants and rebuilds: |
||||||||
| Carl’s Jr. |
7,036 | 10,889 | ||||||
| Hardee’s |
2,142 | 3,602 | ||||||
| Dual-branding: |
||||||||
| Carl’s Jr. |
457 | 858 | ||||||
| Hardee’s |
2,069 | 2,346 | ||||||
| Real estate |
1,086 | 20 | ||||||
| Corporate and other |
1,840 | 1,372 | ||||||
|
|
|
|
|
|||||
| Total |
$ | 52,423 | $ | 63,098 | ||||
|
|
|
|
|
|||||
Capital expenditures for fiscal 2012 decreased $10,675, or 16.9%, from the prior year mainly due to decreases of $5,313 in new restaurants and rebuilds, $4,446 in restaurant remodels and $1,772 in capital maintenance, which were partially offset by a $1,066 increase in real estate and franchise acquisitions. Based on our current capital spending projections, we expect capital expenditures to be between $60,000 and $70,000 for fiscal 2013. During the last seven years we have remodeled or developed 384 of our 423 company-operated Carl’s Jr. restaurants, and 424 of our 469 company-operated Hardee’s restaurants. We expect to remodel between 40 and 50 company-operated restaurants during the fiscal year ending January 31, 2013.
Cash used in financing activities during fiscal 2012 was $23,837, which principally consisted of dividends of $190,188 paid on common stock, the payment of $78,047 for the early extinguishment of notes, $8,011 of repayments of capital lease obligations and $9,930 for payment of deferred financing costs. These cash uses were largely offset by proceeds of $196,230 from the issuance of our Toggle Notes and $67,454 from financing method sale-leaseback transactions.
Long-Term Obligations
Contractual Cash Obligations
The following table presents our long-term contractual cash obligations as of January 31, 2012:
| Payments Due by Periods | ||||||||||||||||||||
| Total | Less Than One Year |
1-3 Years | 3-5 Years | After 5 Years |
||||||||||||||||
| Long-term debt(1) |
$ | 862,032 | $ | 3 | $ | 8 | $ | 329,530 | $ | 532,491 | ||||||||||
| Interest and commitment fees on long-term debt(2) |
400,181 | 62,467 | 124,933 | 121,951 | 90,830 | |||||||||||||||
| Capital lease obligations(3)(4) |
59,814 | 12,007 | 18,649 | 15,033 | 14,125 | |||||||||||||||
| Operating lease obligations(3) |
709,109 | 89,779 | 163,240 | 129,565 | 326,525 | |||||||||||||||
| Financing method sale-leaseback obligations(5) |
109,506 | 4,794 | 9,588 | 9,761 | 85,363 | |||||||||||||||
| Unconditional purchase obligations(6) |
87,168 | 75,063 | 7,430 | 2,384 | 2,291 | |||||||||||||||
| Other commitments(7) |
4,213 | 2,183 | 1,921 | 109 | — | |||||||||||||||
|
|
|
|
|
|
|
|
|
|
|
|||||||||||
| Total contractual cash obligations |
$ | 2,232,023 | $ | 246,296 | $ | 325,769 | $ | 608,333 | $ | 1,051,625 | ||||||||||
|
|
|
|
|
|
|
|
|
|
|
|||||||||||
87
Table of Contents
| (1) | For the purposes of this table, we have assumed that all future interest payments on our Toggle Notes will be paid entirely in PIK Interest, resulting in all interest being added to the principal amount of the Toggle Notes and due at maturity on March 14, 2016. |
| (2) | Represents our cash interest obligations on our long-term debt, commitment fees related to the unused portion of our Credit Facility and fees related to our outstanding letters of credit. The amounts included above assume no changes to the borrowings on our Credit Facility through maturity or early redemption of our Senior Secured Notes. |
| (3) | The amounts reported above as operating lease and capital lease obligations include leases contained in the estimated liability for closed restaurants and leases for which we sublease the related properties to others. Additional information regarding operating lease and capital lease obligations can be found in Note 10 of Notes to Consolidated Financial Statements included elsewhere in this prospectus. |
| (4) | Capital lease obligations consist of the undiscounted value of the future principal and interest payments. |
| (5) | Additional information regarding our sale-leaseback financing obligations can be found in Note 11 of Notes to Consolidated Financial Statements included elsewhere in this prospectus. |
| (6) | Unconditional purchase obligations include contracts for goods and services, primarily related to system restaurant operations and contractual commitments for marketing and sponsorship arrangements. |
| (7) | Other commitments shown in the table above are comprised of executive retention bonuses and obligations which represent uncertain tax positions. The years for which the uncertain tax positions will be effectively settled or paid have been estimated in scheduling the obligations within the table. In addition to the obligations in the table above, approximately $3,870 of unrecognized tax benefits have been recorded as an offset to deferred income tax assets, of which $1,342 is anticipated to be effectively settled or paid within one year. Additionally, we have $9,867 of unrecognized tax positions which are fully offset by a valuation allowance of which we are uncertain as to if or when such amounts may be settled. |
Other Commercial Commitments
The following table presents our other commercial commitments as of January 31, 2012. See Note 15 of Notes to Consolidated Financial Statements included elsewhere in this prospectus for additional discussion.
| Amount of Commitment Expirations Per Period | ||||||||||||||||||||
| Total Amounts Committed |
Less Than One Year |
1-3 Years |
3-5 Years |
After 5 Years |
||||||||||||||||
| Outstanding letters of credit |
$ | 30,913 | $ | 30,913 | $ | — | $ | — | $ | — | ||||||||||
|
Other(1) |
1,016 | 675 | 302 | 19 | 20 | |||||||||||||||
|
|
|
|
|
|
|
|
|
|
|
|||||||||||
| Total other commercial commitments |
$ | 31,929 | $ | 31,588 | $ | 302 | $ | 19 | $ | 20 | ||||||||||
|
|
|
|
|
|
|
|
|
|
|
|||||||||||
| (1) | Other includes commitments retained in connection with the sale of La Salsa in fiscal 2008 and consists of contingent liabilities related to guarantees and assignments of La Salsa leases and self-insured workers’ compensation, general and auto liability claims that arose prior to the completion of the sale of La Salsa. |
Critical Accounting Policies and Estimates
Our reported results are impacted by the application of certain accounting policies that require us to make subjective or complex judgments. These judgments involve making estimates about the effect of matters that are inherently uncertain and may significantly impact our consolidated financial position and results of operations. Information regarding our significant accounting policies and estimates can be found in Note 1 of Notes to Consolidated Financial Statements included elsewhere in this prospectus. Our most critical accounting policies and estimations are described in the following paragraphs.
88
Table of Contents
Business Combinations
We allocate the purchase price of business combinations to tangible and intangible assets acquired and liabilities assumed based on their estimated fair values. The excess, if any, of the purchase price over these fair values is recorded as goodwill. Management is required to make certain estimates and assumptions in determining the fair values of assets acquired and liabilities assumed, especially with respect to intangible assets. The significant purchased intangible assets recorded by us in connection with the Merger include trademarks/tradenames, franchise agreements, and favorable lease agreements. The fair values assigned to these identified intangible assets are discussed in detail in Note 2 of Notes to Consolidated Financial Statements included elsewhere in this prospectus.
Critical estimates in valuing certain tangible and intangible assets for business combinations include:
| • | future expected brand-level cash flows related to our trademarks/tradenames and franchise agreements; |
| • | market value of lease arrangements and the expected term, including available option periods, of such leasing arrangements; |
| • | assumptions likely to be used by market participants in valuing in-service restaurant-level assets; |
| • | determination of the estimated useful lives of the assets acquired; and |
| • | discount rates used in valuing such assets. |
Management’s estimates of fair value are based upon assumptions believed to be reasonable, but which are inherently uncertain and unpredictable and, as a result, actual results may differ from estimates. Refer to additional discussion in Note 2 of Notes to Consolidated Financial Statements included elsewhere in this prospectus.
Impairment of Restaurant-Level Long-Lived Assets
During the second and fourth quarter of each fiscal year, and whenever events or circumstances indicate that the carrying value of assets may be impaired, we evaluate our restaurant-level long-lived assets for impairment. For purposes of impairment testing, assets are grouped at the lowest level for which identifiable cash flows are largely independent of the cash flows of other assets and liabilities, which is generally the individual restaurant level for property and equipment and favorable leases. For each asset group, we evaluate whether there are indicators of impairment such as sequential annual cash flow losses or adverse changes in the physical condition or expected use of the asset group. When indicators of impairment exist, we evaluate whether the assets are recoverable by comparing the undiscounted future cash flows that we expect to generate from their use and disposal to their carrying value. Restaurant-level assets that are not deemed to be recoverable are written down to their estimated fair value, which is determined by assessing the highest and best use of the assets and the amounts that would be received for such assets in an orderly transaction between market participants.
In connection with analyzing restaurant-level long-lived assets to determine if they have been impaired, we make certain estimates and assumptions, including estimates of future cash flows, assumptions of future same-store sales and projected operating expenses for each of our restaurants over their estimated useful life in order to evaluate recoverability and estimate fair value. Future cash flows are estimated based upon experience gained, current intentions about refranchising restaurants and closures, recent and expected sales trends, internal plans, the period of time since the restaurant was opened or remodeled, the maturity of the related market and other relevant information. If our future cash flows or same-store sales do not meet or exceed our forecasted levels, or if restaurant operating cost increases exceed our forecast and we are unable to recover such costs through price increases, the carrying value of certain of our restaurants may prove to be unrecoverable, and we may incur additional impairment charges in the future.
As of the date of our fourth quarter fiscal 2012 impairment evaluation, we had a total of 35 restaurants within our two major restaurant concepts that generated negative cash flows on a trailing-13 period basis. The
89
Table of Contents
asset groups, which include property and equipment and favorable lease assets, had combined net book values of $13,321. If these negative cash flow restaurants do not begin generating positive cash flows within a reasonable period of time, the carrying value of the assets associated with these restaurants may prove to not be fully recoverable, and we may recognize additional impairment charges in the future. During the sixteen weeks ended May 21, 2012 and fiscal 2012, we recorded impairment charges of $109 and $766, respectively, related to restaurant-level long-lived assets.
Impairment of Goodwill and Intangible Assets
We test goodwill for impairment on an annual basis, or more frequently if events and/or circumstances indicate that goodwill might be impaired. The impairment test is performed at the reporting unit level, and an impairment loss is recognized to the extent that the carrying amount of goodwill exceeds the fair value. We consider the reporting unit level to be the brand level as the components (e.g., restaurants) within each brand have similar economic characteristics, including products and services, production processes, types or classes of customers and distribution methods. In accordance with the authoritative accounting guidance, we use a two-step test to identify the potential impairment and to measure the amount of goodwill impairment, if any. We first identify any potential impairment by comparing the estimated fair value of the reporting unit with its carrying amount, including goodwill. If the estimated fair value of the reporting unit exceeds its carrying amount, there is no impairment and the second step is not required. If step two is required, we measure impairment by comparing the implied fair value of the reporting unit goodwill with the carrying amount of goodwill.
As of May 21, 2012, our goodwill consisted of $199,166 for our Carl’s Jr. reporting unit and $9,719 for our Hardee’s reporting unit. The goodwill for both reporting units resulted primarily from the Merger on July 12, 2010. During the fourth quarter of fiscal 2012, we performed our goodwill impairment test for our Carl’s Jr. and Hardee’s reporting units. As of the date of the annual impairment test, the fair values of both the Carl’s Jr. and Hardee’s reporting units exceeded their respective carrying values by more than 20%. The excess of the fair value as compared to the carrying value is attributed primarily to the general improvement in financial markets between the date of the acquisition and the date of the impairment test, and improvements in operating results and cash flows. However, future declines in market conditions and the actual future performance of our reporting units could negatively impact the results of future impairment tests.
As of May 21, 2012, our indefinite-lived intangible assets consisted of Carl’s Jr. trademarks/tradenames of $144,000 and Hardee’s trademarks / tradenames of $134,000. We test our indefinite-lived intangible assets for impairment on an annual basis or more frequently if events or changes in circumstances indicate that the carrying amount of the intangible asset may not be recoverable. During the fourth quarter of fiscal 2012, we performed our impairment test for trademarks/tradenames at both Carl’s Jr. and Hardee’s and concluded that no impairment charge was required. However, any future declines in our system-wide restaurant portfolio at either concept, declines in company-operated or franchised revenues or increases to the discount rate used in our impairment test could negatively impact the results of future impairment tests.
Our definite-lived intangible assets are amortized utilizing a straight-line basis over their estimated useful lives and are tested for impairment when events or circumstances indicate the carrying value may be impaired. Refer to discussion of long-lived assets for a discussion of impairment of restaurant-level long-lived assets.
Estimated Liability for Closed Restaurants
We use certain assumptions to determine the amount of the estimated liability for closed restaurants. The most significant assumptions relate to the determination of the estimated liability for future lease payments and other contractual obligations on vacant restaurants, and the extent to which these costs may be reasonably expected to be recovered by future sublease income. We estimate the cost to maintain leased vacant properties until the lease can be abated. If the costs to maintain properties increase, or it takes longer than anticipated to sublease such properties, we may need to record additional estimated liabilities. If the vacant restaurants are not subleased on the terms that we used to estimate the liabilities, we may be required to record losses in future
90
Table of Contents
periods. Conversely, if the leases on the vacant restaurants are terminated or subleased on more favorable terms than we used to estimate the liabilities, we reverse previously established estimated liabilities, resulting in an increase in operating income. Our estimated liability for closed restaurants was $3,456 and $3,912 as of May 21, 2012 and January 31, 2012, respectively.
Estimated Liability for Self-Insurance
We are self-insured for a portion of our current and prior years’ losses related to workers’ compensation, general and auto liability insurance programs. We generally have stop loss insurance for individual workers’ compensation and general liability claims over $500 and auto liability claims over $250; however, our retained risk is substantially higher for a small number of older claims. We estimate our self-insurance exposure based on the average historical losses on claims we have incurred and on actuarial observations of historical claim loss development and our actuary’s estimate of unpaid losses for each loss category. We record our accrued liabilities for self-insurance at present value, based on an estimated risk-free interest rate at the balance sheet date. Our actual future claim loss development may be better or worse than the development we estimated in conjunction with our actuary, in which case our reserves would require adjustment. If we experience a higher than expected number of claims or the costs of claims rise more than expected, then we would be required to adjust the expected losses upward and increase our future self-insurance expense. Our estimated liability for self-insurance was $42,073 and $41,466 as of May 21, 2012 and January 31, 2012, respectively.
Loss Contingencies
The assessment of contingencies is highly subjective and requires judgments about future events. We review loss contingencies at least quarterly to develop estimates of the likelihood and range of possible settlement. Those contingencies that are deemed to be probable, and for which the expected loss is reasonably estimable, are accrued in our Consolidated Financial Statements. If only a range of loss can be determined, with no amount in the range representing a better estimate than any other amount within the range, we record an accrued liability equal to the low end of the range. The ultimate resolution of such loss contingencies may differ materially from amounts we have accrued in our Consolidated Financial Statements. As of May 21, 2012, we have recorded an accrued liability for contingencies related to litigation in the amount of $2,395, with an expected range of losses from $2,395 to $5,530. As of January 31, 2012, our accrued liability for loss contingencies related to litigation was $2,409.
In addition, as of May 21, 2012, we estimated the contingent liability of losses related to litigation claims that are not accrued, but that we believe are reasonably possible to result in an adverse outcome and for which a range of loss can be reasonably estimated, to be in the range of $2,135 to $10,425. We are also involved in legal matters where the likelihood of loss has been judged to be reasonably possible, but for which a range of the potential loss cannot be reasonably estimated. We expense our legal defense costs as incurred.
See Note 7 of Notes to Condensed Consolidated Financial Statements and Note 15 of Notes to Consolidated Financial Statements included elsewhere in this prospectus for further information.
Accounting for Lease Obligations
We lease a substantial number of our restaurant properties. At the inception of the lease, each property is evaluated to determine whether the lease is an operating or capital lease. The lease accounting evaluation may require significant judgment in estimating the fair value and useful life of the leased property and to establish the appropriate lease term. The lease term used for this evaluation includes renewal option periods only in instances in which the exercise of the renewal option can be reasonably assured because failure to exercise such option would result in an economic penalty. Such economic penalty would typically result from our having to abandon buildings and other non-detachable improvements with remaining economic value upon vacating the property.
The lease term may also include a “rent holiday”, which begins on the date we are given control of the leased premises and typically ends upon restaurant opening. Factors that may affect the length of the rent holiday
91
Table of Contents
period include construction-related delays. Extension of the rent holiday period due to such delays would result in greater rent expense recognized during the rent holiday period.
Franchise Operations
We sublease a number of restaurant properties to our franchisees. As such, we remain principally liable for these leases. If sales trends or economic conditions worsen for our franchisees, their financial health may worsen, our collection rates may decline and we may be required to assume the responsibility for additional lease payments on franchised restaurants.
Our franchising income is dependent on both the number of restaurants operated by our franchisees and their operational and financial success, such that they can make their royalty and rent payments to us. When appropriate, we establish notes receivable pursuant to completing workout agreements with financially troubled franchisees. We cease accruing royalties and rental revenue from franchisees during the fiscal quarter in which we determine that collectability of such revenue is not reasonably assured.
Our consolidated allowances for doubtful accounts on accounts receivable and notes receivable are 0.2% and 1.3% of the gross accounts and notes receivable balances, respectively, as of January 31, 2012. Although we regularly review the allowances for doubtful accounts, there can be no assurance that the number of franchisees or franchised restaurants experiencing financial difficulties will not increase from our current assessments, nor can there be any assurance that we will be successful in resolving financial issues relating to any specific franchisee.
In addition to the sublease arrangements with franchisees described above, we also lease land and buildings to franchisees. As of January 31, 2012, the net book value of property under lease to Hardee’s and Carl’s Jr. franchisees was $41,027 and $12,682, respectively. Financially troubled franchisees include those with whom we have entered into workout agreements and who may have liquidity problems in the future. In the event that a financially troubled franchisee closes a restaurant for which we own the property, our options are to operate the restaurant as a company-operated restaurant, transfer the restaurant to another franchisee, lease the property to another tenant or sell the property. These circumstances would cause us to consider whether the carrying value of the land and building was impaired. If we determined the property’s carrying value was impaired, we would record a charge to operations for the amount the carrying value of the property that exceeds its fair value. As of January 31, 2012, the net book value of properties under lease to Hardee’s and Carl’s Jr. franchisees that were considered to be financially troubled franchisees was approximately $3,467 and $718, respectively, which are also included in the amounts above.
Income Taxes
Significant judgments and estimates are required in determining our consolidated income tax expense. These estimates include, among other items, depreciation and amortization expense allowable for tax purposes, allowable tax credits, effective rates for state and local income taxes and the deductibility of other items. Our income tax (benefit) expense, deferred income tax assets and liabilities, valuation allowance against deferred income tax assets, and reserves for uncertain tax positions reflect management’s best assessment of estimated current and future taxes attributable to our operations.
We record deferred income taxes for the estimated income tax effect of temporary differences between the financial and tax bases of assets and liabilities using the asset and liability method. Deferred income tax assets are also recorded for NOL and income tax credit carryforwards. A valuation allowance to reduce the carrying amount of deferred income tax assets is established when it is more likely than not that we will not realize some portion or all of the tax benefit of our deferred income tax assets. We evaluate, on a quarterly basis, whether it is more likely than not that our deferred income tax assets are realizable. In performing this analysis, we consider all available evidence, both positive and negative, including historical operating results, the estimated timing of future reversals of existing taxable temporary differences, estimated future taxable income exclusive of reversing
92
Table of Contents
temporary differences and carryforwards, and potential tax planning strategies that may be employed to prevent operating loss or tax credit carryforwards from expiring unused.
As of May 21, 2012, our valuation allowance of $5,006 against deferred income tax assets relates to certain state NOL carryforwards and a portion of our state income tax credits. Realization of the tax benefit of such deferred income tax assets may remain uncertain for the foreseeable future, even if we generate consolidated taxable income, since certain deferred income tax assets are subject to various limitations and may only be used to offset income of certain entities and in certain jurisdictions.
From time to time, we may take positions for filing our tax returns which may differ from the treatment of the same item for financial reporting purposes. The ultimate outcome of these items will not be known until the Internal Revenue Service, or similar state taxing authority, has completed its examination or until the statute of limitations has expired.
We maintain a liability for underpayment of income taxes and related interest and penalties, if any, for uncertain income tax positions. In considering the need for and magnitude of a liability for uncertain income tax positions, we must make certain estimates and assumptions regarding the amount of income tax benefit that will ultimately be realized. The ultimate resolution of an uncertain tax position may not be known for a number of years, during which time we may be required to adjust these reserves in light of changing facts and circumstances.
New Accounting Pronouncements
See Note 2 of Notes to Condensed Consolidated Financial Statements and Note 3 of Notes to Consolidated Financial Statements included elsewhere in this prospectus.
Presentation of Non-GAAP Measures
We have included in this MD&A certain measures of financial performance that are not defined by U.S. GAAP. Company-operated restaurant-level adjusted EBITDA, company-operated restaurant-level adjusted EBITDA margin and franchise restaurant adjusted EBITDA are non-GAAP measures utilized by management internally to evaluate and compare our operating performance for company-operated restaurants and franchised restaurants between periods. Each of these non-GAAP financial measures is derived from amounts reported within our Consolidated Financial Statements, and the computations of each of these measures have been included within our “Operating Review” section of this MD&A.
These non-GAAP measures should be viewed in addition to, and not in lieu of, the comparable U.S. GAAP measures. These non-GAAP measures have certain limitations including the following:
| • | Because not all companies calculate these measures identically, our presentation of such measures may not be comparable to similarly titled measures of other companies; |
| • | These measures exclude certain general and administrative and other operating costs, which should also be considered when assessing our operating performance; and |
| • | These measures exclude depreciation and amortization, and although they are non-cash charges, the assets being depreciated or amortized will often have to be replaced and new investments made to support the operations of our restaurant portfolio. |
Company-Operated Restaurant-Level Non-GAAP Measures
We define company-operated restaurant-level adjusted EBITDA, which is expressed in dollars, as company-operated restaurants revenue (i) less restaurant operating costs excluding depreciation and amortization expense and (ii) less advertising expense. Restaurant operating costs are the expenses incurred directly by our company-operated restaurants in generating revenues and do not include advertising costs, general and administrative
93
Table of Contents
expenses or facility action charges. We define company-operated restaurant-level adjusted EBITDA margin, which is expressed as a percentage, as company-operated restaurant-level adjusted EBITDA divided by company-operated restaurants revenue.
Franchise Restaurant Adjusted EBITDA
We define franchise restaurant adjusted EBITDA, which is expressed in dollars, as franchised restaurants and other revenue less franchised restaurants and other expense excluding depreciation and amortization expense.
Impact of Inflation
Inflation has an impact on food and packaging, construction, occupancy, labor and benefits, and general and administrative costs, all of which can significantly affect our operating results. In particular, the cost of food commodities has increased markedly over the last two years, resulting in upward pricing pressure on many of our raw ingredients, and thereby increasing our food costs. We expect that there may be additional pricing pressure on some of our key ingredients, most notably beef, during fiscal 2013. Historically, consistent with others in the QSR industry, we have generally been able to pass along to our customers, through price increases, higher costs arising from these inflationary factors. In addition, we routinely enter into purchasing contracts or pricing arrangements for certain commodities that set in advance the price of a given commodity for a fixed period of time, which are designed to mitigate the effects of cost volatility. Significant and/or prolonged increases in the prices of the ingredients most critical to our menu, particularly beef, could significantly affect our operating results or cause us to consider changes to our product delivery strategy and adjustments to our menu pricing.
Quantitative and Qualitative Disclosures About Market Risk
We are exposed to the impact of interest rate changes, foreign currency fluctuations and changes in commodity prices. In the normal course of business, we may employ policies and procedures to manage our exposure to these changes.
Interest Rate Risk
Our principal exposures to financial market risks relate to the impact that interest rate changes could have on our Credit Facility, which bears interest at a floating interest rate and, therefore, our results of operations and cash flows will be exposed to changes in interest rates. As of May 21, 2012, our Credit Facility remained undrawn. Accordingly, a hypothetical increase of 100 basis points in short-term interest rates in our floating rate would not have an impact on our interest expense. This sensitivity analysis assumes all other variables will remain constant in future periods.
Foreign Currency Risk
Our business at company-operated restaurants is transacted in U.S. dollars. Exposure outside of the U.S. relates primarily to the effect of foreign currency rate fluctuations on royalties paid to us by our international franchisees. Our objective in managing our exposure to foreign currency fluctuations is to limit the impact of such fluctuations on earnings and cash flows. As of May 21, 2012, our most significant exposure related to the Mexican Peso. Foreign exchange rate fluctuations have not historically had a significant impact on our results of operations. During the sixteen weeks ended May 21, 2012 and fiscal 2012, if all foreign currencies had uniformly weakened 10% relative to the U.S. dollar, our franchised restaurants and other revenue would have decreased $591 and $1,675, respectively.
Commodity Price Risk
We, along with our franchisees, purchase large quantities of food, packaging and supplies. The predominant food commodities purchased by our restaurants include beef, chicken, potatoes, pork, dairy, cheese, produce, wheat flour and soybean oil. The cost of food commodities has increased markedly over the last two years, resulting in
94
Table of Contents
upward pricing pressure on many of our raw ingredients, and thereby increasing our food costs. Furthermore, we expect that there may be additional pricing pressure on beef costs during the remainder of fiscal 2013.
Like all restaurant companies, we are susceptible to commodity price risks as a result of factors beyond our control, such as general economic conditions, significant variations in supply and demand, seasonal fluctuations, weather conditions, food safety concerns, food-borne diseases, fluctuations in the value of the U.S. dollar, commodity market speculation and government regulations. For example, the cost of beef, our largest commodity expenditure and the only commodity that accounts for more than twenty percent of our total food and packaging costs, has increased between 4 and 6 percent since the beginning of fiscal 2012 as a result of a reduction in beef production in the United States, a trend which we expect to continue for several years, and an increase in world demand. To mitigate these risks, we routinely enter into purchasing contracts or pricing arrangements for certain commodities that contain commodity risk management techniques designed to minimize price volatility. The purchasing contracts and pricing arrangements we use for certain commodities set in advance the price of a given commodity for a fixed period of time, which helps to mitigate the effects of commodities price volatility. These purchasing contracts and pricing arrangements may result in unconditional purchase obligations, which are not reflected in our Consolidated Balance Sheets. Typically, we use these types of purchasing techniques to control costs as an alternative to directly managing financial instruments to hedge commodity prices. In many cases, including with respect to the increase in beef costs, we believe we will be able to address material commodity cost increases by adjusting our menu pricing, or changing our product delivery strategy. However, increases in commodity prices, without adjustments to our menu prices, could increase restaurant operating costs as a percentage of company-operated restaurants revenue, which could negatively impact our operating results.
95
Table of Contents
Home of the Big, Juicy Burger
We are one of the world’s largest operators and franchisors of quick service restaurants (“QSR”) with 3,263 owned or franchised locations operating in 42 states and 25 foreign countries primarily under our Carl’s Jr. and Hardee’s brands. We believe we offer innovative, premium products that we develop for a target demographic we refer to as “young, hungry guys” but that we believe also appeal to a broader customer base of individuals who aspire to be youthful. Our target demographic of 18 to 34 year old males who enjoy premium food at a reasonable price makes up a large portion of the global QSR market, which is currently estimated to generate $225 billion in sales annually ($141 billion in the United States). Specifically, younger males account for almost one quarter of all QSR visits and have the highest frequency of any demographic group at almost 17 visits per month. We believe our focus on this customer type is anchored by our menu of high quality, premium products, and enhanced through edgy, breakthrough advertising. According to QSR Magazine (Top 50 Rankings, March 7, 2012), we are the fifth largest hamburger QSR operator globally. We have a large and rapidly growing international presence (consisting of 441 restaurants in 25 foreign countries, an 85% increase in the number of international restaurants since the end of fiscal 2007) and believe there are significant opportunities to continue to grow our brands in various markets around the world.
As of May 21, 2012, the end of our first quarter of fiscal 2013, our system-wide restaurant portfolio consisted of:
| Carl’s Jr. | Hardee’s | Other | Total | |||||||||||||
| Company-operated |
424 | 468 | — | 892 | ||||||||||||
| Domestic franchised |
694 | 1,227 | 9 | 1,930 | ||||||||||||
| International franchised |
204 | 237 | — | 441 | ||||||||||||
|
|
|
|
|
|
|
|
|
|||||||||
| Total |
1,322 | 1,932 | 9 | 3,263 | ||||||||||||
|
|
|
|
|
|
|
|
|
|||||||||
Our primary brands, Carl’s Jr. and Hardee’s, both have a rich heritage dating back over 50 years, when Carl Karcher opened the first Carl’s Jr. restaurant in 1956 and Wilbur Hardee opened the first Hardee’s restaurant in 1960. We believe Carl’s Jr. and Hardee’s are both well recognized for their high-quality product offerings. Sandelman Quick Track reports for the first calendar quarter of 2012 ranked each of our brands #1 or #2 in their markets among national or regional hamburger QSRs in taste or flavor of food, quality of ingredients and temperature of food. Although we operate under two brands, the management, menus, operations, marketing campaigns and logos of our two primary brands are substantially similar. We are evolving into a national chain operating under two banners because each has long-standing brand equity in its respective markets. The brands often market identical new products with identical advertising campaigns and use national cable to promote these products in ads that identify both brands.
Our business objective is to continue growing our average unit volumes (“AUV”), calculated as described below, and expanding both Carl’s Jr. and Hardee’s in new and existing markets throughout the world by leveraging what we believe to be our unique brand positioning, high-quality product offerings, compelling restaurant economics and established global footprint. Our business strategy focuses on the growth of our franchise restaurant base, which provides a more stable, capital efficient income stream than company-operated restaurants. Franchise royalties are based on a percentage of our franchisees’ sales, and are thus not susceptible to fluctuations in restaurant operating costs. In addition, franchisees are responsible for making capital investments, enabling us to accelerate the growth of our restaurant system without incremental capital expenditures. From the end of fiscal 2007 through May 21, 2012, we have grown our franchise restaurants from 1,904 units (64% of total) to 2,371 units (73% of total), and we have grown our international restaurants by 85% from 238 units (8% of total) to 441 units (14% of total) over the same period.
For fiscal 2012 and the quarter ended May 21, 2012, we generated total revenue of $1.3 billion and $412.3 million, Adjusted EBITDA of $165.9 million and $61.6 million and a net (loss) income of $(19.3) million and $6.7 million, respectively. See Note 5 under “—Summary Historical and Pro Forma Financial and Other Data” for an explanation of Adjusted EBITDA and a reconciliation to net (loss) income.
96
Table of Contents
What We Have Accomplished
Guided by our revitalization plan and our management team, our recent accomplishments include:
| • | Remodeled or developed over 90% of our company-operated restaurants since the end of fiscal 2005; |
| • | Achieved a 10 percentage point improvement in customer satisfaction scores across our concepts since the end of fiscal 2007; |
| • | Opened over 600 new restaurants system-wide since the end of fiscal 2007; |
| • | Signed over 875 franchise development commitments with a broad group of franchisees in the United States and internationally with over 600 of these commitments signed in the last three years; |
| • | Increased franchised restaurants from 64% of total restaurants at the end of fiscal 2007 to 73% as of May 21, 2012; |
| • | Increased our international restaurant base by 85% from 238 restaurants in 13 foreign countries at the end of fiscal 2007 to 441 restaurants in 25 foreign countries as of May 21, 2012; |
| • | Achieved positive blended same-store sales (i.e., blended for Carl’s Jr. and Hardee’s company-operated restaurants) for the most recent seven consecutive quarters, including an increase of 3.5% in blended same-store sales for fiscal 2012 and an increase of 2.6% for the first quarter of fiscal 2013. Prior to the economic downturn, we posted six consecutive fiscal years of blended same-store sales growth from fiscal 2004 to fiscal 2009; and |
| • | Exhibited a long track-record of AUV growth at company-operated restaurants. As shown in the table below, the blended AUV at company-operated restaurants has grown from $832,000 in fiscal 2001 to $1,257,000 in fiscal 2012, an increase of $425,000, and over the same period we have increased our blended AUV in every year except fiscal 2010. |
Blended Company-Operated Average Unit Volume
We calculate AUV for each of Carl’s Jr. and Hardee’s by dividing the aggregate revenues of all of the brand’s company-operated restaurants during a fiscal year by the number of the brand’s company-operated restaurants open during that period. Blended AUV is calculated in the same manner using the aggregate revenue and number of company-operated restaurants of both brands on a combined basis. Blended AUV is calculated on a trailing-52 week basis.
One Powerful Concept, Two Global Brands
We operate one global restaurant platform. The management, menus, operations, marketing campaigns and logos of our two primary brands are substantially similar. However, we have chosen to capitalize on the strong heritage and loyal customer base of Carl’s Jr. and Hardee’s by maintaining both brands. The brands often market identical new products with identical advertising campaigns and use national cable to promote these products in advertisements that identify both brands.
97
Table of Contents
|
|
Carl’s Jr. has a total of 1,322 company-operated and franchised restaurants located in 14 states and 14 foreign countries as of May 21, 2012. Domestic Carl’s Jr. restaurants are predominantly located in the Western United States, with a growing presence in Texas. International Carl’s Jr. restaurants are located primarily in Mexico, with a growing presence in the rest of Latin America, Russia and Asia. Carl’s Jr. focuses on selling its signature products, such as the Western Bacon Cheeseburger and a full line of 100% Black Angus Beef Six Dollar Burgers, and on developing what we believe to be innovative new products, including the Steakhouse Six Dollar Burger, Hand-Breaded Chicken Tenders and its line of Charbroiled Turkey Burgers. As of May 21, 2012, 549 of the domestic Carl’s Jr. restaurants were dual-branded with our Green Burrito concept, which offers Mexican-inspired products, such as burritos, tacos and quesadillas, from a separate Green Burrito menu. At dual-branded restaurants, customers can order both Carl’s Jr. and Green Burrito product offerings at the same counter. While the target market is substantially similar, the dual-branding broadens the restaurant’s product offering. In addition, there are nine stand-alone franchised Green Burrito restaurants. | |
| We believe, based on our internal market research, that Carl’s Jr. is widely regarded by our customers as the premium choice for lunch and dinner in the QSR industry, with approximately 85% of fiscal 2012 company-operated restaurants revenue coming from the lunch and dinner day parts. Recently, Carl’s Jr. expanded its breakfast offering through the launch of Hardee’s breakfast menu featuring its Made From Scratch Biscuits. We believe that substantial opportunity exists to further build the brand by capturing greater market share during the breakfast day part at our existing restaurants through offering Hardee’s breakfast menu. We initially tested the biscuit rollout in select markets in fiscal 2011 and then launched a larger scale rollout of these products in the second half of fiscal 2012. As of May 21, 2012, approximately 49% of our domestic restaurants offered this breakfast product line, including 72% of our company-operated locations. The launch of Hardee’s breakfast menu, featuring Made From Scratch Biscuits, at Carl’s Jr. is another meaningful step in nationalizing our brands, and we expect the rollout to be essentially complete by the end of the first quarter of fiscal 2014. | ||
| As of May 21, 2012, approximately 68% of Carl’s Jr. restaurants were franchised and the remaining 32% were company-operated. Approximately 15% of Carl’s Jr. restaurants were located outside of the U.S. as of May 21, 2012, compared to 8% at the end of fiscal 2007. We expect the Carl’s Jr. brand to be the primary driver of our international expansion in Asia, Latin America and Russia over the next several years. | ||
|
|
Hardee’s has a total of 1,932 company-operated and franchised restaurants located in 30 states and 11 foreign countries as of May 21, 2012. Domestic Hardee’s restaurants are located predominantly in the Southeastern and Midwestern United States, with a growing international presence in the Middle East and Central Asia. Hardee’s primarily focuses on selling its signature products, such as its line of 100% Black Angus Beef Thickburgers and Made From Scratch Biscuits and on developing what we believe to be innovative new products, such as the Steakhouse Thickburger, Hand-Breaded Chicken Tenders, the Monster Biscuit and its line of Charbroiled Turkey Burgers. | |
98
Table of Contents
| We believe, based on our internal market research, that Hardee’s is widely regarded by our customers as the best choice for breakfast in the QSR industry, with approximately 48% of company-operated restaurants revenue in fiscal 2012 and the first quarter of fiscal 2013 coming from breakfast. We also believe that substantial opportunity exists to further build the brand by capturing greater market share during the lunch and dinner day parts at our existing restaurants through offering new, high-quality products in conjunction with Carl’s Jr. and expanding the number of dual-branded locations with our Red Burrito Mexican-inspired concept. As of May 21, 2012, 326 of the domestic Hardee’s restaurants were dual-branded with Red Burrito. As at our Carl’s Jr. restaurants, dual-branding offers Hardee’s customers broader menu choices from a separate Red Burrito menu. | ||
| As of May 21, 2012, approximately 76% of Hardee’s restaurants were franchised and the remaining 24% were company-operated. From the end of fiscal 2007 to May 21, 2012, Hardee’s international restaurants grew from 8% to 12% of the system primarily as a result of continued expansion in the Middle East and Central Asia, where we expect growth. | ||
Why We Are “The Star”
We attribute our success in the QSR industry to the following strengths:
Leader in the Premium Segment of the QSR Industry with Two Strong, Global Brands
We believe our two primary brands, Carl’s Jr. and Hardee’s, are uniquely positioned to appeal to the target audience we refer to as “young, hungry guys” and those who aspire to be youthful. We believe that our intense focus on our target audience affords us a competitive advantage, as many competitors in the QSR industry focus on the family market, which we view as more competitive and over saturated. We believe we are known for high-quality, great-tasting products that serve the premium segment of the QSR industry. Sandelman Quick-Track reports for the first calendar quarter of 2012 ranked each of our brands #1 or #2 in their markets among national or regional hamburger QSRs in taste or flavor of food, quality of ingredients and temperature of food. We have a strong market position in all day parts with Hardee’s dominant at breakfast and both Carl’s Jr. and Hardee’s having strong lunch and dinner offerings. Hardee’s breakfast offerings are differentiated by its signature Made From Scratch Biscuits, which we believe have helped make the brand known as the best choice for breakfast in the QSR industry. We recently introduced Hardee’s breakfast menu and its Made From Scratch Biscuits at Carl’s Jr. In markets where biscuits were introduced at least one year ago, breakfast sales have increased from 12% of total sales in fiscal 2010 prior to the rollout to 18% of total sales in fiscal 2012 and in the first quarter of fiscal 2013. We believe our menu innovation, focus on our targeted audience and emphasis on quality and value have allowed us to maintain our differentiated, premium position and avoid extensive price discounting. We believe that our unique, edgy advertising campaigns also help build our brands. Our advertising is generally intended to create buzz around our promotional product offerings as well as emphasize the quality and taste of our premium menu items.
Established and Rapidly Growing International Presence
Since establishing our first international restaurant in 1978, our international strategy has been focused on countries where we believe there are significant opportunities to grow our brands rapidly. We have been particularly focused on growing our international presence since our CEO took the leadership position in fiscal 2001. We had 441 restaurants franchised in 25 foreign countries as of May 21, 2012, which compares to 238 franchised restaurants in 13 foreign countries at the end of fiscal 2007. During fiscal 2012, our international franchisees opened a total of 72 restaurants outside of the United States, eclipsing our domestic development totals for the first time in our history. This included the opening of locations in seven countries in which we had not previously operated. In the first quarter of fiscal 2013, our international franchisees opened a total of 20
99
Table of Contents
restaurants outside of the United States. We expect this trend to continue and the number of international restaurant openings to continue to grow. Currently, we have franchise development commitments to build over 500 new international restaurants. As of May 21, 2012, we had Carl’s Jr. franchised restaurants in American Samoa, Canada, China, Costa Rica, Ecuador, Indonesia, Malaysia, Mexico, New Zealand, Panama, Russia, Singapore, Turkey and Vietnam and Hardee’s franchised restaurants in Bahrain, Egypt, Jordan, Kazakhstan, Kuwait, Lebanon, Oman, Pakistan, Qatar, Saudi Arabia and the United Arab Emirates.
As of May 21, 2012, there were 441 international franchise restaurants, representing 13.5% of our total restaurants, in 25 countries.
Attractive Restaurant-Level Economics Drives Franchisee Development
We believe that the economic returns from opening new restaurants offer franchisees a compelling investment opportunity. Over the past several years, we have redesigned our domestic restaurant prototypes at both Carl’s Jr. and Hardee’s to reduce the initial building construction costs for new restaurants while maintaining the expected performance from our new company-operated restaurants. The cost to develop a new Carl’s Jr. or Hardee’s restaurant, excluding land value, generally ranges from $950,000 to $1,300,000. We believe that our franchisees can achieve attractive returns from new restaurant development as demonstrated by our signing of over 600 new franchise development commitments during the last three years. In addition, our franchisees have opened a total of 273 new restaurants since the end of fiscal 2009, including 113 openings in fiscal 2012, representing the highest number of openings over the past decade, and 33 openings in the first quarter of fiscal 2013. These franchise restaurant openings in fiscal 2012 and the first quarter of fiscal 2013 represented 96% and 94% of the total new restaurant openings for the year and quarter, respectively, and further increased the percentage of our system that is franchised. We believe that the performance and overall health of our franchise network continues to be strong and is evidenced by our collection of greater than 99% of our royalties during fiscal 2012.
Attractive Free Cash Flow Generation
We believe our company-operated restaurant-level adjusted EBITDA margin, stable and growing franchise base and our nearly completed capital program result in attractive free cash flow (operating cash flow minus capital expenditures) generation. Over the past seven years, we have focused on improving the customer experience through the remodeling of our company-operated restaurant base. We have also focused on new franchise restaurant openings and a refranchising program. With over 2,370 franchised restaurants domestically and internationally, we have a franchisee network that generated approximately $94 million of royalties from franchises in fiscal 2012 and approximately $31 million in the first quarter of fiscal 2013. We believe the shift from a company-operated model
100
Table of Contents
to a predominantly franchise model allows for a more stable business since we are less impacted by changes in restaurant level profitability, including the impact of commodity costs. Further, we believe the franchise model will allow us to significantly expand our global footprint with minimal investment. Because we have remodeled or developed over 90% of our company-operated restaurants since the end of fiscal 2005, reduced the construction costs required to refresh our restaurants and shifted to a predominantly franchised model, we expect future capital expenditure requirements to be significantly lower than our average capital expenditures from fiscal 2007 to fiscal 2010. Capital expenditures in fiscal 2012 decreased to $52 million from $117 million in fiscal year 2007. Based on our current capital spending projections, we expect capital expenditures to be between $60 million and $70 million for fiscal 2013.
Proven Management Team Has Longstanding History with CKE
Our management team has been together at CKE Restaurants since fiscal 2001 and has an average of 25 years experience in the restaurant industry. During their tenure, our AUV has increased by 51%. Since our CEO took the leadership position in fiscal 2001, our franchise restaurants have increased from 47% of total units to 73% as of May 21, 2012. The management team has also significantly accelerated international unit development over the past few years.
How We Plan to Feed More “Young, Hungry Guys” Globally
We believe there are significant opportunities to grow our brands globally, improve our operating results and deliver stockholder value by executing the following strategies:
Continue Our International Growth
We believe we have demonstrated a strong track record of growing our brands into new international markets over the past five years. Since the end of fiscal 2007, the total number of international franchise restaurants has grown by 85% from 238 units (8% of total) to 441 units (14% of total), including an increase of nearly 18% during fiscal 2012. In addition, we have expanded into a total of 25 foreign countries compared to 13 at the end of fiscal 2007. We have invested in and developed the necessary infrastructure to support and continue growing our international operations. To date, our international development strategy has been primarily focused on what we believe are high growth, emerging markets in Asia, Latin America and Russia for Carl’s Jr. and the Middle East and Central Asia for Hardee’s. We plan to continue expansion in these and new international markets through the use of development agreements. We expect to accelerate franchise growth in a number of new markets with significant growth coming from Brazil, Canada, China and Russia, although we can provide no guarantee such growth will occur or will be significant. The recent signing of a 100 restaurant development agreement with a new franchisee in Brazil is an example of our continued progress in achieving this goal. As of May 21, 2012, we had 25 international franchise development agreements representing commitments to build over 500 franchise restaurants. We entered into approximately 80% of these development agreements in the last three years.
Accelerate Our Domestic Franchise Development
In addition to international openings, we are focused on growing our overall franchise base in the U.S. Franchises, as compared to company-operated restaurants, provide a more stable, capital efficient income stream in the form of royalties, which are insulated from fluctuations in restaurant-level costs and profitability and do not require incremental capital expenditures from our company. Increasing our scale by adding system-wide restaurants will also enable us to leverage our corporate infrastructure over a larger restaurant base. Franchising also expands the brands’ marketing reach as franchisees are required to contribute to advertising both nationally and locally. Our overall mix of franchise restaurants has increased from 64% of system restaurants at the end of fiscal 2007 to 73% as of May 21, 2012, with approximately 81% of our total franchise restaurants located in the U.S. We believe our overall franchise mix will continue to increase as our restaurant-level economics continue to
101
Table of Contents
entice franchisees to open new restaurants, and we expect the number of new franchise restaurant openings to significantly exceed the number of company-operated restaurant openings. We believe our system-wide mix can exceed 80% franchised over the long-term as we work with both existing and new franchisees to develop new restaurants. Domestically, we continue to focus on developing certain existing markets, such as Texas, and expanding into new and underpenetrated markets, such as the Northeastern United States. As of May 21, 2012, we had 48 domestic franchise development agreements representing commitments to build over 375 restaurants.
Continue to Increase Same-Store Sales and Free Cash Flow
We intend to continue building on our same-store sales growth momentum through the following initiatives:
Continue developing and offering innovative products: We believe we have historically had a strong track record of developing new and innovative products targeted towards “young, hungry guys” and plan to drive same-store sales growth through utilizing this expertise. We intend to continue developing and promoting what we believe to be innovative, premium burgers, supplemented by our chicken products and healthful products such as our turkey burgers. We have introduced new products at both brands including our lines of 100% Black Angus Beef Burgers, Hardee’s Made From Scratch Biscuits, Hand-Scooped Ice Cream Shakes and Malts, Charbroiled Turkey Burgers and Hand-Breaded Chicken products. While maintaining our “young, hungry guys” focus, we plan to continue to develop and increase customer awareness of our healthful products which have historically included our Charbroiled Chicken Sandwiches and Premium Entrée Salads. More recently, we partnered with Men’s Health and the creators of the bestselling Eat This, Not That! brand to develop a line of Charbroiled Turkey Burgers that all have less than 500 calories.
Expand breakfast offering and cross roll-out of popular items: We have regularly rolled out popular items from one of our brands to the other since both concepts have similar market positionings. Currently, our lunch and dinner menus at both brands are centered around our line of 100% Black Angus Beef Burgers and other sandwiches. More recently, we have rolled out new products such as our line of Charbroiled Turkey Burgers and Hand-Breaded Chicken Tenders concurrently at both brands. We believe Hardee’s is regarded as the best choice for breakfast in the QSR industry, with approximately 48% of company-operated restaurant revenue in fiscal 2012 and the first quarter of fiscal 2013 coming from breakfast. Much of the success of Hardee’s breakfast menu can be attributed to its Made From Scratch Biscuits and biscuit breakfast sandwiches. Recently, Carl’s Jr. launched the roll-out of Hardee’s Made From Scratch Biscuits in the Los Angeles market in the second half of fiscal 2012 after completing the launch of these premium breakfast products in selected other markets. We anticipate offering these products at substantially all of our company-operated Carl’s Jr. restaurants and at approximately 70% of the total domestic Carl’s Jr. restaurants by the end of fiscal 2013. During the year after the introduction of Hardee’s Made From Scratch Biscuits at select Carl’s Jr. locations, the share of sales occurring at breakfast increased by approximately 48%. We believe Hardee’s breakfast menu is a logical extension of Carl’s Jr.’s offerings that can increase our sales and overall market share in the breakfast hours.
Emphasize and capitalize on our unique brand positioning: We believe our new product introductions are enhanced through edgy, breakthrough advertising, high visibility sports sponsorships in major markets and a creative internet presence. By introducing new products at both brands simultaneously, we have also been able to more efficiently purchase national cable television media, which has not only increased our media presence in our well-penetrated markets, but also provided a solid base of media in our under-penetrated and newer markets, which we believe will help establish demand in potential future expansion markets. In addition, our plans for continued use and focus on digital marketing, including social media and mobile channels, help to increase overall brand awareness, drive traffic into our restaurants and effectively reach our target demographic of “young, hungry guys.” As of May 21, 2012, our digital following included approximately 1.8 million total followers on Facebook and there had been nearly 700,000 downloads of our iPhone and Android mobile applications.
Capitalize on dual-branding opportunities: As of May 21, 2012, approximately 56% of our company-operated units were dual-branded with our Green Burrito and Red Burrito concepts. At a dual-branded restaurant,
102
Table of Contents
a customer can order Mexican-inspired Green Burrito or Red Burrito products, such as burritos, tacos and quesadillas, at the same counter as our Carl’s Jr. or Hardee’s products. We believe there is an opportunity to increase the number of dual-branded company-operated locations in the future. In addition, we believe there is an opportunity for our royalties to increase as our franchisees continue to dual-brand their locations with the Green Burrito and Red Burrito concepts. In particular, we believe that there is an attractive opportunity for our Hardee’s franchisees to dual-brand additional locations based on the financial results from recent conversions at company-operated Hardee’s units and the fact that only approximately 7% of our 1,227 domestic franchised Hardee’s restaurants were dual-branded as of May 21, 2012. With respect to the performance of recent company-operated dual-branded conversions, 47 company-operated Hardee’s restaurants were converted to dual-branded locations with Red Burrito in fiscal 2011. In fiscal 2012, these restaurants, on average, achieved an increase in sales that was 6.5% greater than comparable Hardee’s restaurants that were not dual-branded. The increase in sales also translated to an increase in profitability and greater than a 40% cash-on-cash return on the capital invested to convert these restaurants.
Continued focus on operational excellence: We also plan to remain focused on our core restaurant fundamentals of quality, service and cleanliness. From fiscal 2007 through May 21, 2012, we spent approximately $148 million on a significant remodeling of our company-operated restaurants, which we believe has improved the customer experience. Restaurants that have been remodeled have demonstrated significantly improved sales and customer satisfaction scores as reflected by a 10 percentage point improvement in customer satisfaction scores across our concepts since the end of fiscal 2007. We also stand to benefit as franchisees continue to remodel their restaurants, as the anticipated sales lift from franchise remodels increases the royalty payments to our company. As of May 21, 2012, only 64% of our domestic franchised units have been remodeled or developed since the end of fiscal 2005 compared to 93% of our company-operated restaurants. Our franchisees are obligated under their franchise agreements to remodel their restaurants to the current image, although in certain circumstances we have granted exceptions or extensions, such as where the unit is newer or where the franchisee needs to obtain additional lease term. By the end of fiscal 2014, many of the extensions will expire and, as a result, we expect that over 85% of our franchised restaurants in the U.S. will have been remodeled or developed since the end of fiscal 2005. We expect these improvements will further benefit our customer satisfaction scores and overall brand image.
Merger and Related Transactions
We were incorporated in Delaware in 2010. On July 12, 2010, we acquired CKE Restaurants through the Merger, with CKE Restaurants becoming our wholly-owned subsidiary.
In connection with the Merger, the Apollo Funds and members of our senior management invested in our equity indirectly through a holding company, and CKE Restaurants issued $600.0 million Senior Secured Notes (the “Senior Secured Notes”) and entered into a $100.0 million Credit Facility, which was undrawn at closing.
Subsequently, on March 14, 2011, CKE completed an offering of $200.0 million of its Toggle Notes.
Our Principal Stockholders
The Apollo Funds and our management own their equity interests in us through a holding company, the selling stockholder in this offering, which is the record holder of all of our issued and outstanding shares.
The principal beneficial owners of our common stock are the Apollo Funds, investment funds managed by Apollo Management VII, L.P. (“Apollo Management”), an affiliate of Apollo Management, L.P., which we collectively refer to in this prospectus as “Apollo.” Apollo will beneficially own % or shares of our common stock after this offering, assuming the underwriters do not exercise their option to purchase up to additional shares. Apollo Investment Fund VII, L.P. is an investment fund with committed capital, along with its parallel investment funds, of approximately $14.7 billion. Apollo Management, L.P., is an affiliate
103
Table of Contents
of Apollo Global Management, LLC, a leading global alternative asset manager with offices in New York, Los Angeles, London, Frankfurt, Luxembourg, Singapore, Hong Kong and Mumbai. As of March 31, 2012, Apollo Global Management, LLC and its subsidiaries had assets under management of approximately $86 billion across all of their businesses.
We currently have a management services agreement with Apollo Management for advisory services. In fiscal 2012, we incurred $2.5 million in fees and out-of-pocket expenses under this agreement, which Apollo Management intends to terminate upon completion of this offering. Upon the termination of this agreement, Apollo Management will receive a fee of $ million (plus any unreimbursed expenses) from us. See “Certain Relationships and Related Party Transactions—Management Services Fee” for more detail regarding our arrangements with Apollo.
Our Ownership Structure
The chart below is a summary of our organizational structure after giving effect to this offering.
| * | Current investors consist of the Apollo Funds, members of our management and board of directors and certain other investors, all of whom are limited partners of Apollo CKE Holdings, L.P., which is the sole member of CH Restaurant Holdings, LLC, our direct stockholder and the selling stockholder in this offering. See “Principal and Selling Stockholders.” |
Restaurant Development and Capital Spending
When developing our capital spending plan for new company-operated restaurants and existing company-operated restaurant remodels, we consider many factors including analysis of the optimization of our asset base, expected return on invested capital and restaurant profitability. Based on our current capital spending projections for fiscal 2013, we expect capital expenditures to be between $60.0 million and $70.0 million.
We perform extensive due diligence on prospective restaurant sites before we commit to opening or permitting a franchisee to open a restaurant at a location. We intend to continue to penetrate existing markets, while exploring new market opportunities as they arise. In fiscal 2012, our franchisees opened 113 new restaurants and we opened 5 new company-operated restaurants. Over the past several years, we have redesigned our restaurant prototypes at both Carl’s Jr. and Hardee’s to reduce the building costs for new restaurants. The cost to develop a new Carl’s Jr. or Hardee’s restaurant, excluding land value, generally ranges from $950,000 to $1,300,000. The cost of building a new restaurant varies based upon a number of factors, including the building specifications, amount of site work, local and state regulations, and labor markets.
104
Table of Contents
Restaurant Operations and Support
Our goal is to quickly serve the highest quality products to our guests in a clean and inviting environment with superior customer service. We charbroil our burgers for maximum flavor. We cook all of our fried foods in zero trans fat shortening. We cook, heat and assemble our lunch and dinner burgers and sandwiches after our guests place their orders for guaranteed freshness. We adhere to very strict procedures for cleanliness, food preparation, safety and sanitation, food quality and guest service. This is accomplished through two guiding principles—Operation QSC and Six Dollar Service.
“Operation QSC” puts in place the processes and procedures to operate our restaurants in the most efficient manner. ”Six Dollar Service” refers to our signature premium, high-quality guest service, which is based on our philosophy of providing the type of service a guest would expect to receive at a sit-down style restaurant without the need to wait for a table or provide a tip. This philosophy is supported by policies designed to ensure that our crew members are doing everything possible to exceed our guests’ expectations while providing a very pleasant QSR dining experience, and is named to complement the premium, high-quality nature of our 100% Black Angus Beef Six Dollar Burgers.
Our commitment to quality in both our products and operations is supported by a variety of training programs. A general manager oversees the operation of each company-operated Carl’s Jr. and Hardee’s restaurant. Our general managers are required to complete a comprehensive training course which covers restaurant operations, product quality, safety awareness, inter-personal skills and food safety. These training programs include a combination of instructor-led classroom training and in-restaurant, hands-on experience in a certified training restaurant.
We have a Learning Management System (“LMS”), which is a web-based tool that enables us to deliver and track learning and training throughout the organization. The benefits of LMS include consistent delivery of training, an audit trail for compliance, a culture of recognition and accountability, and talent management to develop management from within. The LMS training kiosks are fully integrated in all company-operated restaurants, and LMS is available to all franchise-operated restaurants for a small monthly service fee.
At the restaurant level, our general managers hire, train and supervise our crew members in accordance with our operations’ guidelines. Crew members who demonstrate a desire and aptitude for advancement can enter our Shift Leader Development Program to begin their careers in management. General managers are supervised, coached and developed by district managers, who are typically responsible for six to eight restaurants each. District managers are, in turn, supervised, coached and developed by either a Vice President of Operations or a Director of Operations.
Franchise Agreements
Our franchise and license agreements give us control over all critical aspects of operating a CKE-branded restaurant, including, without limitation, menu, ingredients, food preparation, method of operations, appearance of restaurants and advertising. Our franchise and license agreements also give us the authority to require from time to time that our franchisees comply, at their expense, with changes to our system, such as modifications to the operating manual, menu, equipment, signage building and proprietary marks. We do not, however, set pricing in franchised restaurants or exercise control over our franchisees’ hiring, firing or other employee matters. Generally, our franchise agreements are for a term of 20 years (less in the case of captive markets such as airports or sport venues), with renewal rights. The franchise agreements do not give the franchisees and licensees any exclusive territory rights, although a franchisee who signs a development agreement will receive the exclusive right to develop in their development territory for the term of their development agreement. Most of our franchise agreements contain in-term and post-term restrictions against competition, and in most of our agreements, we have a right of first refusal to purchase in the event the franchisee proposes to sell his restaurant and/or an option to purchase upon termination of the franchise agreement. We believe these provisions allow us the means to preserve successful locations and the goodwill that our brand has established there.
105
Table of Contents
Supply Chain
We seek competitive bids from suppliers of our products, and we require approved suppliers of those products to comply with certain quality assurance requirements including, but not limited to, facility standards and product specifications.
Excluding fresh baked buns, we purchase substantially all of the food, packaging and supplies sold or used in our Carl’s Jr. and Hardee’s restaurants from MBM. During fiscal 2011, we and our franchisees entered into distribution agreements with MBM to provide distribution services to our Carl’s Jr. and Hardee’s restaurants through June 30, 2017. The prices and delivery fees we pay for products distributed by MBM are subject to adjustment in certain circumstances, which may include increases or decreases resulting from changes in MBM’s cost structure.
The predominant food commodities purchased by our restaurants include beef, chicken, potatoes, pork, dairy, cheese, produce, wheat flour and soybean oil. In certain circumstances, we may enter into purchasing contracts and pricing arrangements, which contain commodity risk management techniques designed to minimize price volatility. Typically, we use these types of purchasing techniques to control costs as an alternative to directly managing financial instruments to hedge commodity prices. Information about our unconditional purchase obligations can be found in “Management’s Discussion and Analysis of Financial Condition and Results of Operations—Long-Term Obligations.”
We expect that there may be additional pricing pressure on some of our key ingredients, most notably beef, during fiscal 2013. As we have a higher concentration of company-operated restaurants than many of our competitors, we may have greater volatility in our operating costs going forward than those competitors who are more heavily franchised. This volatility could cause us to consider changes to our product delivery strategy and adjustments to our menu pricing.
Quality Assurance
We maintain a comprehensive quality assurance (“QA”) program that is designed to verify that the food products supplied to our restaurants are processed in a safe and sanitary environment and are in compliance with both regulatory requirements and our internal food quality and safety standards. All meat products are purchased from U.S. Department of Agriculture (“USDA”) approved facilities and must conform to USDA requirements. All food and packaging suppliers are prequalified by QA and must comply with our requirements including, but not limited to, providing product guarantees, certificates of liability insurance and product safety, and Hazard Analysis and Critical Control Point programs. We routinely perform supplier inspections and conduct ongoing product audits to evaluate suppliers and products for compliance with our company standards and specifications. Additionally, we monitor health inspection reports and provide information to the restaurants to maintain compliance with regulatory requirements.
Our QA program is also designed to verify that food products are prepared in our restaurants in a manner which complies with, or exceeds, all regulatory standards for food safety. Our restaurant managers are trained in the critical components of safe food handling by attending an in-depth food safety training program and passing a nationally-recognized food safety certification exam. In addition, all new employees must participate in a safe food handling orientation, have all necessary state and local certifications and are provided on-going food safety training. Each of our employees are trained to ensure that we meet or exceed state and local food regulations.
We engage a nationally respected, independent, food safety and sanitation audit service provider to perform unannounced audits to evaluate restaurant food safety practices, safe product cook temperatures, equipment condition, cleanliness, food safety monitoring processes and other key food safety concerns. During these audits, restaurant staff are evaluated on their food safety knowledge, product-handling practices and compliance with standards.
106
Table of Contents
Finally, in addition to the supplier and restaurant QA programs, we also operate a toll free, customer call center to capture and address telephonic and electronic customer complaints and utilize an independent agency’s automated messaging system to assist in providing timely notification to company and franchised restaurants in the event of a product withdrawal or recall.
Marketing and Advertising
Our marketing and advertising initiatives focus on building brand awareness and image through the balanced use of television, radio, internet and print advertising and outdoor marketing. Our on-air advertising campaigns are generally intended to create buzz around our promotional product offerings and are often eye-catching or edgy. Our advertising messages seek to emphasize the quality and taste of our premium menu items and to correct consumers’ misperceptions regarding the affordability of our products by emphasizing value-for-the-money.
During fiscal 2012, Carl’s Jr. company-operated restaurants contributed 4.6% of their sales for television, radio, internet and print advertising and spent an additional 1.4% of sales on local advertising, billboards and point of purchase materials. Carl’s Jr. franchised restaurants contributed 5.8% of their sales for advertising during fiscal 2012.
During fiscal 2012, Hardee’s company-operated restaurants contributed 4.3% of their sales for television, radio, internet and print advertising and spent an additional 1.2% of sales on local advertising, billboards and point of purchase materials. Hardee’s franchised restaurants contributed 3.8% to 5.6% of their sales for advertising during fiscal 2012.
Competition and Markets
The restaurant business and the QSR industry are intensely competitive and affected by many factors, including changes in geographic competition, changes in the public’s eating habits and preferences, local and national economic conditions affecting consumer spending habits, population trends and local traffic patterns. Key elements of competition in our industry are the price, quality and value of food products offered; quality and speed of service; advertising effectiveness; brand name awareness; media spending levels; restaurant location and convenience; and attractiveness of facilities.
We primarily compete with major restaurant chains, some of which dominate the QSR industry, and also compete with a variety of other take-out foodservice companies and fast-food restaurants. The four largest hamburger QSRs are McDonald’s, Burger King, Jack in the Box and Wendy’s. Our competitors also include a variety of mid-price, full-service casual-dining restaurants; health and nutrition-oriented restaurants; delicatessens and prepared food restaurants; supermarkets; and convenience stores. In selling franchises, we compete with many other restaurant franchisors, some of which have substantially greater financial resources and higher franchise AUVs.
Financial Information about Operating Segments
We are engaged in the development, operation and franchising of QSRs, primarily under the brand names Carl’s Jr. and Hardee’s, principally in the U.S. Information about our revenues, operating results and assets is set forth in this prospectus under “Management’s Discussion and Analysis of Financial Condition and Results of Operations” and in Note 22 of Notes to Consolidated Financial Statements included elsewhere in this prospectus.
107
Table of Contents
Our same-store sales trends for company-operated restaurants, for each brand and blended by quarter were:
| Carl’s Jr. | Hardee’s | Blended | ||||||||||
| Fiscal 2013: |
||||||||||||
| First Quarter |
2.6 | % | 2.6 | % | 2.6 | % | ||||||
| Fiscal 2012: |
||||||||||||
| Fourth Quarter |
1.7 | % | 6.1 | % | 3.6 | % | ||||||
| Third Quarter |
2.0 | % | 1.8 | % | 1.9 | % | ||||||
| Second Quarter |
2.0 | % | 2.5 | % | 2.2 | % | ||||||
| First Quarter |
2.1 | % | 9.6 | % | 5.5 | % | ||||||
| Fiscal 2011: |
||||||||||||
| Fourth Quarter |
(0.4 | )% | 5.7 | % | 2.3 | % | ||||||
| Third Quarter |
(5.0 | )% | 8.3 | % | 0.9 | % | ||||||
| Second Quarter |
(7.4 | )% | 6.8 | % | (1.1 | )% | ||||||
| First Quarter |
(6.1 | )% | (1.2 | )% | (3.9 | )% | ||||||
Investments in Other Restaurant Concepts
We selectively evaluate opportunities to acquire additional interests in other restaurant concepts, and we may make such investments and/or acquisitions in the future depending on the business prospects of the restaurant concept, the availability of financing at attractive terms, alternative business opportunities available to us, the consent of our lenders, if required, and general economic conditions.
Trademarks and Service Marks
We own numerous trademarks and service marks, and have registered many of those marks with the United States Patent and Trademark Office, including Carl’s Jr., the Happy Star logo, Hardee’s, Green Burrito, Red Burrito and proprietary names for a number of our menu items. We believe our trademarks and service marks have value and play an important role in our marketing efforts.
Government Regulation
Each company-operated and franchised restaurant must comply with regulations adopted by federal agencies and with licensing and other regulations enforced by state and local health, sanitation, safety, fire and other departments. Stringent and varied requirements of local governmental bodies with respect to zoning, land use and environmental factors can delay and sometimes prevent development of new restaurants and remodeling of existing restaurants in particular locations.
We are also subject to federal laws and a substantial number of state laws regulating the offer and sale of franchises. Such laws impose registration and disclosure requirements on franchisors in the offer and sale of franchises and may include substantive standards regarding the relationship between franchisor and franchisee, including limitations on the ability of franchisors to terminate franchise agreements or otherwise alter franchise arrangements. We believe we are operating in substantial compliance with applicable laws and regulations governing our franchise operations.
We are subject to a number of food safety regulations, including the Federal Food, Drug and Cosmetic Act and the Federal Food Safety Modernization Act. This comprehensive regulatory framework governs the manufacture (including composition and ingredients), labeling, packaging and safety of food in the U.S. In addition, several states and local jurisdictions have adopted or are considering various food and menu nutritional
108
Table of Contents
labeling requirements, many of which are inconsistent or are interpreted differently from one jurisdiction to another. Recently enacted federal health care reform laws include new uniform federal nutrition labeling requirements. However, these requirements have not yet taken effect, and we currently are subject to a variety of state and local nutrition labeling requirements.
We, and our franchisees, must comply with the FLSA and various federal and state laws governing employment matters, such as minimum wage, overtime pay practices, child labor laws, citizenship requirements and other working conditions. Many of our employees are paid hourly rates related to the federal and state minimum wage laws; accordingly, increases in the minimum wage increase our labor costs. Federal and state laws may also require us to provide new or increased levels of employee benefits to our employees, many of whom are not currently eligible for such benefits. We believe we are operating in substantial compliance with all such laws and regulations.
We monitor our facilities for compliance with the ADA in order to conform to its requirements. Under the ADA, we could be required to expend funds to modify our restaurants to better provide service to, or make reasonable accommodation for the employment of, disabled persons. We believe that such expenditures, if required, would not have a material adverse effect on our consolidated financial position or results of operations.
We are also subject to laws relating to information security, privacy, cashless payments, consumer credit, protection, and fraud. We believe we are operating in substantial compliance with all such laws and regulations.
Environmental Matters
We are subject to various federal, state and local environmental laws and regulations that govern discharges to air and water from our restaurants, as well as handling and disposal practices for solid and hazardous wastes. These laws may impose liability for damages from and the costs of cleaning up sites of spills, disposals or other releases of hazardous materials. We may be responsible for environmental conditions relating to our restaurants and the land on which our restaurants are located, regardless of whether we lease or own the restaurants or land in question and regardless of whether such environmental conditions were created by us or by a prior owner or tenant.
We cannot provide assurance that all such environmental conditions have been identified by us. These conditions may include the presence of asbestos-containing materials, leaking underground storage tanks and on-site spills. Further, certain properties formerly had landfills, historic industrial use, gasoline stations and/or dry cleaning businesses located on or near the premises. Corrective action, as required by the regulatory agencies, has been undertaken at some of the sites by former landowners or tenants. The enforcement of our rights against third parties for environmental conditions, such as off-site sources of contamination, may result in additional costs for us. However, we do not believe that any such costs, if incurred, would have a material adverse effect on our consolidated financial position or results of operations.
Seasonality
Our restaurant sales and, therefore, our profitability are subject to seasonal fluctuations and are traditionally higher during the spring and summer months because of factors such as increased travel during school vacations and improved weather conditions, which affect the public’s dining habits.
Government Contracts
No material portion of our business is subject to renegotiation of profits or termination of contracts or subcontracts at the election of the U.S. government.
109
Table of Contents
Employees
As of May 21, 2012, we employed approximately 20,300 persons, primarily in company-operated restaurants and in our corporate offices. We do not have any collective bargaining agreements with any labor unions, and we consider employee relations to be good.
Working Capital Practices
Information about our liquidity is set forth under “Management’s Discussion and Analysis of Financial Condition and Results of Operations—Liquidity and Capital Resources” in this prospectus and the Consolidated Statements of Cash Flows included elsewhere in this prospectus.
Properties
The following table sets forth information regarding our restaurant properties as of January 31, 2012:
| Land
and Building Owned(1) |
Land Leased and Building Owned(1) |
Land
and Building Leased(1) |
Total | |||||||||||||
| Carl’s Jr.: |
||||||||||||||||
| Company-operated |
14 | 154 | 255 | 423 | ||||||||||||
| Franchise-operated(2) |
9 | 43 | 147 | 199 | ||||||||||||
| Third party-operated/vacant(3) |
4 | 2 | 7 | 13 | ||||||||||||
|
|
|
|
|
|
|
|
|
|||||||||
| Subtotal |
27 | 199 | 409 | 635 | ||||||||||||
|
|
|
|
|
|
|
|
|
|||||||||
| Hardees: |
||||||||||||||||
| Company-operated |
214 | 99 | 156 | 469 | ||||||||||||
| Franchise-operated(2) |
48 | 58 | 116 | 222 | ||||||||||||
| Third party-operated/vacant(3) |
7 | 5 | 26 | 38 | ||||||||||||
|
|
|
|
|
|
|
|
|
|||||||||
| Subtotal |
269 | 162 | 298 | 729 | ||||||||||||
|
|
|
|
|
|
|
|
|
|||||||||
| Total: |
||||||||||||||||
| Company-operated |
228 | 253 | 411 | 892 | ||||||||||||
| Franchise-operated(2) |
57 | 101 | 263 | 421 | ||||||||||||
| Third party-operated/vacant(3) |
11 | 7 | 33 | 51 | ||||||||||||
|
|
|
|
|
|
|
|
|
|||||||||
| Subtotal |
296 | 361 | 707 | 1,364 | ||||||||||||
|
|
|
|
|
|
|
|
|
|||||||||
| (1) | During fiscal 2012, we entered into agreements under which we sold and leased back 47 restaurant properties. We have presented the associated restaurant properties as leased properties in the table above since legal title of the associated restaurant properties transferred to the buyers. However, for accounting purposes, these transactions have not been treated as completed sales and we continue to report the associated restaurant properties as owned assets. See Note 11 of Notes to Consolidated Financial Statements included elsewhere in this prospectus for further discussion. |
| (2) | “Franchise-operated” properties are those which we own and lease to franchisees, or lease and sublease to franchisees. |
| (3) | “Third party-operated/vacant” properties are those we own or lease that are either leased or subleased to unaffiliated entities or are currently vacant. |
The terms of our leases and subleases vary in length, with primary terms (i.e., before consideration of option periods) expiring on various dates through fiscal 2036. We do not expect the expiration of these leases to have a material impact on our operations in any particular year, as the expiration dates are staggered over a number of years and many of the leases contain renewal options.
110
Table of Contents
Our corporate headquarters and Carl’s Jr. brand headquarters are both located in Carpinteria, California, and combined they contain approximately 78,000 square feet of space. Our primary administrative service center is located in Anaheim, California and contains approximately 90,000 square feet of space. Our Hardee’s corporate facility is located in St. Louis, Missouri, and contains approximately 54,000 square feet of space. Our Hardee’s Equipment Division (“HED”) primary distribution center is located in Rocky Mount, North Carolina, and contains approximately 82,000 square feet of space. HED’s west coast distribution center is located in Ontario, California and contains approximately 24,000 square feet of space. We sublease a facility to MBM, which is located in Ontario, California and has approximately 184,000 square feet of space. We are principally liable for the lease obligations for this facility.
Legal Proceedings
We are subject to legal proceedings and claims in the ordinary course of our business. These claims potentially cover a variety of allegations spanning our entire business. The following is a brief discussion of the most significant categories of claims that have been brought or that we believe are likely to be brought against us in the operation of our business. To the extent applicable, we also discuss the nature of any currently pending claims relating to each category. We are currently vigorously defending these pending claims. See Note 15 of Notes to Consolidated Financial Statements included elsewhere in this prospectus for additional discussion of legal matters.
Employees
We employ many thousands of persons in our company-operated restaurants and corporate offices, both by us and in restaurants owned and operated by our subsidiaries. In addition, thousands of persons from time to time seek employment in such restaurants. In the ordinary course of business, disputes arise regarding hiring, firing, harassment, rest breaks, promotion practices and other employee related matters. With respect to employment matters, our most significant legal disputes relate to employee meal and rest breaks, and wage and hour disputes. Several potential class action lawsuits have been filed in the State of California, each of which is seeking injunctive relief and monetary compensation on behalf of current and former employees.
Customers
Our restaurants serve a large cross-section of the public and, in the course of serving that many people, disputes arise as to products, services, accidents and other matters typical of an extensive restaurant business such as ours.
Suppliers
We rely on large numbers of suppliers who are required to meet and maintain our high standards. On occasion, disputes may arise with our suppliers on a number of issues including, but not limited to, compliance with product specifications and certain business concerns. Additionally, disputes may arise on a number of issues between us and individuals or entities who claim they should have been granted the approval or opportunity to supply products or provide services to our restaurants.
Franchising
A substantial number of our restaurants are franchised to independent entrepreneurs operating under contractual arrangements with us. In the course of the franchise relationship, disputes occasionally arise between us and our franchisees relating to a broad range of subjects including, without limitation, quality, service and cleanliness issues, contentions regarding terminations of franchises, and delinquent payments. Additionally, occasional disputes arise between us and individuals who claim they should have been granted a franchise.
111
Table of Contents
Intellectual Property
We have registered trademarks and service marks, patents and copyrights, some of which are of material importance to our business. From time to time, we may become involved in litigation to defend and protect our use of our intellectual property.
Real Property
We have various leasing arrangements related to our company-operated restaurants, franchised restaurants and other properties. In the course of managing these various leasing arrangements, disputes occasionally arise with respect to rental payments, property improvements, abandonment of property and the interpretation of lease provisions.
112
Table of Contents
Board of Directors and Executive Officers
The following table sets forth information concerning our directors and executive officers as of the date of this prospectus:
| Name |
Age | Position | ||||
| Andrew F. Puzder |
61 | Director and Chief Executive Officer (“CEO”) | ||||
| E. Michael Murphy |
60 | President, Chief Legal Officer and Secretary | ||||
| Theodore Abajian |
48 | Executive Vice President and Chief Financial Officer (“CFO”) | ||||
| Bradford R. Haley |
54 | Chief Marketing Officer, Carl’s Jr. and Hardee’s | ||||
| Eric F. Williams |
49 | Executive Vice President, Carl’s Jr. Operations | ||||
| Robert J. Starke |
59 | Executive Vice President, Hardee’s Operations | ||||
| Reese Stewart |
45 | Senior Vice President and Chief Accounting Officer | ||||
| Peter P. Copses |
53 | Chairman of the Board; Director | ||||
| Robert J. DiNicola |
64 | Director | ||||
| George G. Golleher |
64 | Director | ||||
| Lance A. Milken |
36 | Director | ||||
| Daniel E. Ponder |
57 | Director | ||||
| Jerold H. Rubinstein |
73 | Director | ||||
| C. Thomas Thompson |
62 | Director | ||||
The following is information about the experience and attributes of the members of our board of directors and our executive officers as of the date of this prospectus.
Andrew F. Puzder has been our CEO since September 2000 and a member of CKE Restaurants’ board of directors since May 2001. From September 2000 to January 2009, he also served as our President and from February 1997 to September 2000, he served as our Executive Vice President, General Counsel and Secretary. Mr. Puzder was also Executive Vice President of Fidelity National Financial, Inc. (“FNF”) from January 1995 to June 2000. Mr. Puzder was a partner in the Costa Mesa, California law firm of Lewis, D’Amato, Brisbois & Bisgaard from September 1991 to March 1994, and a shareholder in the Newport Beach, California law firm of Stradling Yocca Carlson & Rauth from March 1994 until joining FNF in 1995. Mr. Puzder was appointed to our board of directors in 2010. In light of our ownership structure and Mr. Puzder’s extensive experience and knowledge of our operations, competitive challenges and opportunities gained through his position as CEO of CKE Restaurants and as a member of CKE Restaurants’ board of directors, the board believes that it is appropriate for Mr. Puzder to serve as our director.
E. Michael Murphy has been our President and Chief Legal Officer since January 2009 and also serves as our Secretary. From January 2001 to January 2009, he served as our Executive Vice President, General Counsel, and previously served as our Senior Vice President and as Senior Vice President, General Counsel of Hardee’s Food Systems, Inc. from July 1998. He also served as our Chief Administrative Officer from August 2006 to January 2009. For the ten years prior to 1998, Mr. Murphy was a partner of The Stolar Partnership law firm in St. Louis, Missouri.
Theodore Abajian has been our Executive Vice President and CFO since May 2003. From March 2002 to May 2003, he served as our Executive Vice President, Chief Administrative Officer. From November 2000 to March 2002, Mr. Abajian served as President and CEO of Santa Barbara Restaurant Group, and as its Executive Vice President and CFO from May 1998. In addition, from January 2000 to October 2000, Mr. Abajian held the position of Senior Vice President and CFO for Checkers Drive-In Restaurants, Inc., and served as the CFO of Star Buffet, Inc. from July 1997 to May 1998. Mr. Abajian also served as a director of Staceys Buffet, Inc. from October 1997 to February 1998, and was Vice President and Controller with Summit Family Restaurants, Inc. from 1994 to 1998.
113
Table of Contents
Bradford R. Haley has been our Chief Marketing Officer since August 2011. From January 2004 to August 2011, Mr. Haley served as Executive Vice President, Marketing for Carl’s Jr. and Hardee’s, and from September 2000 to January 2004 served as our Executive Vice President, Marketing for Hardee’s. Prior to joining Hardee’s, Mr. Haley worked as Chief Marketing Officer for Church’s Chicken. From 1992 to 1999, Mr. Haley served as Corporate Vice President of Marketing Communications for Jack in the Box, Inc.
Eric F. Williams has been Executive Vice President, Operations for Carl’s Jr. since August 2011. Before assuming this position, Mr. Williams served as a Senior Vice President for Hardee’s from February 2011 to August 2011 and as a Vice President for Hardee’s from November 2003 to February 2011. Mr. Williams first joined the Company in 1983 beginning in the restaurants and has held various management positions within our Hardee’s operations.
Robert J. Starke has been Executive Vice President, Hardee’s Operations since May 2007. Mr. Starke first joined Hardee’s in 1975 and has had a long career in Hardee’s operations. He began his career with Hardee’s in the restaurants and later became a Regional Vice President. He had served as CKE Restaurants’ Senior Vice President of Restaurant Operations from July 2002 until being promoted to his current position.
Reese Stewart has been our Senior Vice President and Chief Accounting Officer since November 2008. From August 2005 to November 2008, he served as our Vice President and Corporate Controller. Prior to joining us, Mr. Stewart served as Reporting Director for Infonet Services Corporation and held positions in the audit departments of Deloitte & Touche LLP and Windes & McClaughry Accountancy Corporation. Mr. Stewart is a certified public accountant.
Peter P. Copses co-founded Apollo Management, L.P. in 1990. Prior to joining Apollo, Mr. Copses was an investment banker at Drexel Burnham Lambert Incorporated, and subsequently at Donaldson, Lufkin, & Jenrette Securities, concentrating on the structuring, financing and negotiation of mergers and acquisitions. Mr. Copses has served as the Chairman of the board of directors of Claire’s Stores, Inc., a leading specialty retailer offering value-priced accessories and jewelry, since May 2007. Mr. Copses has also served as a director of Rexnord Corporation, a diversified, multi-platform industrial company, since July 2006. Mr. Copses served as a director of Linens ‘n Things, Inc. (“LNT”), a retailer of home textiles, housewares and decorative home accessories, from February 2006 until February 2010. Mr. Copses also served as a director of Rent-A-Center, Inc., the nation’s largest operator of rent-to-own stores, from August 1998 to December 2007. Over the course of the past 20 years, Mr. Copses has served on the board of directors of several other retail businesses, including General Nutrition Centers, Inc. (“GNC”) and Zale Corporation. Mr. Copses was appointed to our board of directors in 2010. In light of our ownership structure and Mr. Copses’ position with Apollo, his knowledge of the retail industry and his extensive financial and business experience, including his background as an investment banker, the board believes it is appropriate for Mr. Copses to serve as our director.
Robert J. DiNicola is a director of Claire’s Stores, Inc. and also serves as the Senior Retail Advisor for Apollo. Mr. DiNicola served as Chief Executive Officer and Chairman of the Board of LNT from February 2006 until May 2008, when LNT and its parent company filed a voluntary petition under Chapter 11 of the U.S. Bankruptcy Code in U.S. Bankruptcy Court, District of Delaware, which was converted to a Chapter 7 liquidation in February 2010. Mr. DiNicola served as Executive Chairman of GNC from December 2004 to March 2007, and as the interim CEO and Chairman of GNC from December 2004 to June 2005. Mr. DiNicola also held numerous positions with Zale Corporation, including Chief Executive Officer from April 1994 to 2002, and Chairman of the Board from April 1994 to 2004. Prior to joining Zale Corporation, Mr. DiNicola served as the Chairman and Chief Executive Officer of the Bon Marché, a division of Federated Department Stores. Beginning his retail career in 1972, Mr. DiNicola has also worked for Macy’s and The May Department Stores Company. Mr. DiNicola was appointed to the board of directors of CKE Restaurants in 2010 upon completion of the Merger, and to our board of directors in 2012. In light of our ownership structure and Mr. DiNicola’s knowledge of the retail industry and our competitive challenges and opportunities gained through his executive leadership and management experience in the retail industry, the board believes it is appropriate for Mr. DiNicola to serve as our director.
114
Table of Contents
George G. Golleher is Chairman of Smart & Final Inc., an operator of warehouse grocery stores, and was also its chief executive officer until January 2012. He is also a director of Claire’s Stores, Inc. and Sprouts Farmers Markets, LLC. Mr. Golleher was a director of Simon Worldwide, Inc., a promotional marketing company, from September 1999 to April 2006, and was also its Chief Executive Officer from March 2003 to April 2006. From March 1998 to May 1999, Mr. Golleher served as President, Chief Operating Officer and director of Fred Meyer, Inc., a food and drug retailer. Prior to joining Fred Meyer, Inc., Mr. Golleher served for 15 years with Ralphs Grocery Company until March 1998, ultimately as the Chief Executive Officer and Vice Chairman of the Board. From 2002 until April 2009, Mr. Golleher served as a director of Rite Aid Corporation, one of the largest retail drugstore chains in the United States. Mr. Golleher has also been a business consultant and private equity investor since June 1999. Mr. Golleher was appointed to the board of directors of CKE Restaurants in 2010 upon completion of the Merger, and to our board of directors in 2012. In light of our ownership structure and Mr. Golleher’s knowledge of the food industry and our competitive challenges and opportunities gained through his executive leadership and management experience in the retail industry, the board believes it is appropriate for Mr. Golleher to serve as our director.
Lance A. Milken is a Partner at Apollo Management, L.P., where he has worked since 1998. Mr. Milken has served as a director of Claire’s Stores, Inc. since May 2007 and also serves as a member of the Milken Institute board of trustees. Mr. Milken was appointed to our board of directors in 2010. In light of our ownership structure and Mr. Milken’s position with Apollo and his extensive financial and business experience, including his experience in leveraged finance, the board believes it is appropriate for Mr. Milken to serve as our director.
Daniel E. Ponder, Jr. is currently the President and Chairman of the board of directors of Ponder Enterprises, Inc., a franchisee of Hardee’s restaurants. He has been a Hardee’s franchisee for over 25 years. Mr. Ponder served in the Georgia legislature until January 2001. Mr. Ponder was the 2003 recipient of the John F. Kennedy Profile in Courage Award. Mr. Ponder has served as a member of CKE Restaurants’ board of directors since 2001, and was appointed to our board of directors in 2012. In light of our ownership structure and Mr. Ponder’s extensive experience and knowledge of our operations, competitive challenges and opportunities gained through his position as a member of CKE Restaurants’ board of directors and as a franchisee, the board believes that it is appropriate for Mr. Ponder to serve as our director.
Jerold H. Rubinstein is Chairman of U.S. Global Investors, Inc., a mutual fund advisory company, and Chairman of the Board and Chief Executive Officer of Stratus Media Group, Inc., a producer of live entertainment events. Mr. Rubinstein has started and sold many companies over the years, including Bel Air Savings and Loan and DMX, a cable and satellite music distribution company. Most recently, Mr. Rubinstein consults with and serves as a director at three small start-up companies. Mr. Rubinstein started and sold XTRA Music Ltd., a satellite and cable music distribution company in Europe. Mr. Rubinstein is both a CPA and attorney. Mr. Rubinstein has served as a member of CKE Restaurants’ board of directors and Chairman of its Audit Committee since 2006, and was appointed to our board of directors in 2012. In light of our ownership structure and Mr. Rubinstein’s extensive experience and knowledge of our operations, competitive challenges and opportunities gained through his position as a member of CKE Restaurants’ board of directors and lengthy career as an attorney, CPA and businessman, extensive experience in the areas of operations, legal analysis, financial and accounting expertise, and business development, the board believes that it is appropriate for Mr. Rubinstein to serve as our director.
C. Thomas Thompson previously served as President and Chief Operating Officer of CKE Restaurants from 1994 until 2000, when he became Chief Executive Officer and a director of CKE Restaurants until his resignation in late 2000. Mr. Thompson has been a Carl’s Jr. franchisee since 1984 and is currently a principal in six Carl’s Jr. franchises owning 60 restaurants. Mr. Thompson has served as a member of CKE Restaurants’ board of directors since 2010, and was appointed to our board of directors in 2012. In light of our ownership structure and Mr. Thompson’s extensive experience and knowledge of our operations, competitive challenges and opportunities gained through his position as a former executive officer of CKE Restaurants and as a franchisee, the board believes that it is appropriate for Mr. Thompson to serve as our director.
115
Table of Contents
Composition of Board of Directors
We intend to avail ourselves of the “controlled company” exception under the New York Stock Exchange rules, which eliminates the requirements that we have a majority of independent directors on our board of directors and that we have compensation and nominating/corporate governance committees composed entirely of independent directors. We will be required, however, to have an audit committee with one independent director during the 90-day period beginning on the date of effectiveness of the registration statement filed with the SEC in connection with this offering and of which this prospectus is part. After such 90-day period and until one year from the date of effectiveness of the registration statement, we will be required to have a majority of independent directors on our audit committee. Thereafter, we will be required to have an audit committee comprised entirely of independent directors.
If at any time we cease to be a “controlled company” under the New York Stock Exchange rules, the board of directors will take all action necessary to comply with the applicable New York Stock Exchange rules, including appointing a majority of independent directors to the board of directors and establishing certain committees composed entirely of independent directors, subject to a permitted “phase-in” period.
Following the consummation of this offering, our board of directors will be divided into three classes. The members of each class will serve staggered, three-year terms (other than with respect to the initial terms of the Class I and Class II directors, which will be one and two years, respectively). Upon the expiration of the term of a class of directors, directors in that class will be elected for three-year terms at the annual meeting of stockholders in the year in which their term expires. Upon consummation of this offering:
| • | Messrs. Puzder, DiNicola and Golleher will be Class I directors, whose initial terms will expire at the fiscal 2013 annual meeting of stockholders; |
| • | Messrs. Ponder, Rubinstein and Thompson will be Class II directors, whose initial terms will expire at the fiscal 2014 annual meeting of stockholders; and |
| • | Messrs. Copses and Milken will be Class III directors, whose initial terms will expire at the fiscal 2015 annual meeting of stockholders. |
Any additional directorships resulting from an increase in the number of directors will be distributed among the three classes so that, as nearly as possible, each class will consist of one-third of our directors. This classification of our board of directors may have the effect of delaying or preventing changes in control.
Our board of directors has determined that Mr. Rubinstein is independent as independence is defined in Rule 10A-3 of the Exchange Act and under the New York Stock Exchange listing standards.
At each annual meeting, our stockholders will elect the successors to our directors. Apollo will beneficially own approximately % of our common stock after this offering, assuming the underwriters do not exercise their option to purchase up to additional shares. Accordingly, immediately after this offering, Apollo will have the power to control the election of directors at our annual meetings. Our executive officers and key employees serve at the discretion of our board of directors. Directors may be removed for cause by the affirmative vote of the holders of a majority of our common stock.
Apollo Approval of Certain Matters and Rights to Nominate Certain Directors
Following the consummation of this offering, the approval of a majority of a quorum of the members of our board of directors, which must include the approval of a majority of the directors nominated by Apollo Management voting on the matter, will be required by our bylaws under certain circumstances. These consist of, as to us and, to the extent applicable, each of our subsidiaries:
| • | amendment, modification or repeal of any provision of our certificate of incorporation, bylaws or similar organizational documents in a manner that adversely affects Apollo; |
116
Table of Contents
| • | the issuance of additional shares of any class of our capital stock (other than any award under any stockholder approved equity compensation plan); |
| • | a consolidation or merger of us with or into any other entity, or transfer (by lease, assignment, sale or otherwise) of all or substantially all of our and our subsidiaries’ assets, taken as a whole, to another entity, or a “Change of Control” as defined in our or our subsidiaries’ principal senior secured credit facilities or senior note indentures, including the Credit Facility and the indentures governing the Notes; |
| • | a disposition, in a single transaction or a series of related transactions, of any of our or our subsidiaries’ assets with a value in excess of $50 million in the aggregate, other than the sale of inventory or products in the ordinary course of business; |
| • | consummation of any acquisition of the stock or assets of any other entity (other than any of our subsidiaries), in a single transaction or a series of related transactions, involving consideration in excess of $50 million in the aggregate; |
| • | the incurrence of indebtedness, in a single transaction or a series of related transactions, by us or any of our subsidiaries aggregating more than $10 million, except for borrowings under a revolving credit facility that has previously been approved or is in existence (with no increase in maximum availability) on the date of closing this offering or that is otherwise approved by Apollo Management; |
| • | a termination of the chief executive officer or designation of a new chief executive officer; and |
| • | a change in size of the board of directors. |
These approval rights will terminate at such time as Apollo no longer beneficially owns at least 33 1/3% of our outstanding common stock. Upon completion of this offering, Apollo will continue to beneficially own at least 33 1/3% of our own common stock.
See “Certain Relationships and Related Party Transactions—Nominating Agreement” for a description of the rights of Apollo Management to nominate a certain number of directors.
Committees of our Board of Directors
Following the consummation of this offering, our board of directors will have three standing committees: an Audit Committee, a Compensation and Corporate Governance Committee and an Executive Committee. Our board of directors will adopt written charters for each of these committees, which will be available on our corporate website following completion of this offering.
Audit Committee
Following the consummation of this offering, our Audit Committee will consist of Messrs. Rubinstein (Chairman), Copses and Milken. Our board of directors has determined that Mr. Rubinstein qualifies as an “audit committee financial expert” as such term is defined in Item 407(d)(5) of Regulation S-K and that Mr. Rubinstein is independent as independence is defined in Rule 10A-3 of the Exchange Act and under the New York Stock Exchange listing standards. The principal duties and responsibilities of our Audit Committee will be as follows:
| • | to prepare the annual Audit Committee report to be included in our annual proxy or information statement; |
| • | to oversee and monitor our financial reporting process; |
| • | to oversee and monitor the integrity of our financial statements and internal control system; |
| • | to oversee and monitor the independence, retention, performance and compensation of our independent auditor; |
| • | to oversee and monitor the performance, appointment and retention of our senior internal audit staff person; |
117
Table of Contents
| • | to discuss, oversee and monitor policies with respect to risk assessment and risk management; |
| • | to establish procedures for the receipt and treatment of accounting complaints; |
| • | to oversee and monitor our compliance with legal and regulatory matters; and |
| • | to provide regular reports to the board. |
The Audit Committee will also have the authority to retain counsel and advisors to fulfill its responsibilities and duties and to form and delegate authority to subcommittees.
Compensation and Corporate Governance Committee
Following the consummation of this offering, our Compensation and Corporate Governance Committee will consist of Messrs. Copses (Chairman), Milken and DiNicola. The principal duties and responsibilities of the Compensation and Corporate Governance Committee will be as follows:
| • | to review, evaluate and make recommendations to the full board of directors regarding our compensation policies and programs; |
| • | to review and approve the compensation of our chief executive officer, other officers and key employees, including all material benefits, option or stock award grants and perquisites and all material employment agreements, confidentiality and non-competition agreements; |
| • | to review and recommend to the board of directors a succession plan for the chief executive officer and development plans for other key corporate positions as shall be deemed necessary from time to time; |
| • | to review and make recommendations to the board of directors with respect to our incentive compensation plans and equity-based compensation plans; |
| • | to administer incentive compensation and equity-related plans; |
| • | to review and make recommendations to the board of directors with respect to the financial and other performance targets that must be met; |
| • | to set and review the compensation of members of the board of directors; |
| • | to prepare an annual compensation committee report and take such other actions as are necessary and consistent with the governing law and our organizational documents; |
| • | to identify best practices and recommend corporate governance principles, including giving proper attention and making effective responses to stockholder concerns regarding corporate governance; |
| • | to develop and recommend to our board of directors guidelines setting forth corporate governance principles applicable to the Company; and |
| • | to oversee the evaluation of our board of directors and senior management. |
Our Compensation and Corporate Governance Committee will also perform the duties and responsibilities traditionally performed by a nominating committee, including:
| • | identifying candidates qualified to become directors of the Company, consistent with criteria approved by our board of directors; |
| • | recommending to our board of directors nominees for election as directors at the next annual meeting of stockholders or a special meeting of stockholders at which directors are to be elected, as well as to recommend directors to serve on the other committees of the board; and |
| • | recommending to our board of directors candidates to fill vacancies and newly created directorships on the board of directors. |
118
Table of Contents
We intend to avail ourselves of the “controlled company” exception under the New York Stock Exchange rules which exempts us from the requirement that we have compensation and nominating/corporate governance committees composed entirely of independent directors.
Executive Committee
Following the consummation of this offering, our Executive Committee will consist of Messrs. Puzder, Copses and Milken. The primary duty and responsibility of the Executive Committee will be to act on behalf of the board of directors in between meetings of the full board, as necessary or appropriate.
Compensation Committee Interlocks and Insider Participation
Our Compensation and Corporate Governance Committee will, upon the consummation of this offering, consist of Messrs. Copses, Milken and DiNicola. During fiscal 2012 and until the completion of this offering, the Compensation Committee of our subsidiary, CKE Restaurants, which consists of the same three individuals, was and will be responsible for determining executive compensation. At the time of the Merger and for a portion of fiscal 2012, each of Messrs. Copses and Milken served as an unpaid officer of CKE, but not as an officer or employee of CKE Restaurants or any of its subsidiaries. During fiscal 2012, none of our executive officers (i) served as a member of the compensation committee of another entity, one of whose executive officers served on CKE Restaurants’ Compensation Committee, (ii) served as a director of another entity, one of whose executive officers served on CKE Restaurants’ Compensation Committee, or (iii) served as a member of the compensation committee of another entity, one of whose executive officers served as one of our directors.
Code of Business Conduct and Ethics
Following the consummation of this offering, we will have a Code of Business Conduct and Ethics that applies to all of our officers, directors and employees, including our principal executive officer, principal financial officer and principal accounting officer, or persons performing similar functions. These standards are designed to deter wrongdoing and to promote honest and ethical conduct. Excerpts from the Code of Business Conduct and Ethics, which address the subject areas covered by the SEC’s rules, will be posted on our website. Any substantive amendment to, or waiver from, any provision of the Code of Business Ethics with respect to any senior executive or financial officer will also be posted on our website. The information contained on or accessible from our website is not part of this prospectus.
119
Table of Contents
Compensation Discussion and Analysis for Fiscal 2012
This section discusses the material elements of compensation awarded to, earned by, or paid to our executive officers during our fiscal year ended January 31, 2012. Throughout this discussion, we refer to the individuals named in the Summary Compensation Table below as our “named executive officers.” The compensation committee of the board of directors of CKE Restaurants has been responsible for determining our executive compensation programs, including making compensation decisions during the fiscal year ended January 31, 2012. Going forward, after the offering is completed, compensation decisions as to our executive officers will be made by our Compensation and Corporate Governance Committee. The Compensation Committee of CKE Restaurants is, and our Compensation and Corporate Governance Committee will be, comprised of Peter P. Copses, Lance A. Milken and Robert J. DiNicola. As used in this Discussion, the “Compensation Committee” or the “Committee” refers to the Compensation Committee of CKE Restaurants or the Compensation and Corporate Governance Committee of CKE, whichever is appropriate from the context.
Compensation Philosophy and Objectives
Our executive compensation philosophy is that executive compensation should serve to attract and retain talented employees and encourage job performance by them that enhances our financial performance and stockholder value. Accordingly, we design our compensation programs for our executive management, including our named executive officers with the overall objectives of encouraging them to be committed to the Company, contribute to the achievement of outstanding financial performance by the Company, and create value for our stockholders. To attain these overall objectives, we design our compensation programs for executive management along the following general guidelines:
| • | Annual base salaries should be competitive and create a measure of financial security for our executive officers. |
| • | Compensation should take into account the respective positions held and levels of responsibility required by members of executive management. |
| • | Compensation should consist of a combination of variable annual and long-term incentive compensation (cash and equity) that stresses the achievement of short-term and long-term financial performance objectives and provides the opportunity to earn significant additional compensation for performance that exceeds targeted levels. |
| • | Long-term compensation should include a significant equity component to align the interests of our executive officers with those of our stockholder and should include both a time-based vesting component to create a meaningful incentive to remain in the employ of the Company over a significant period of time and a performance-based vesting component to create an incentive to meet financial performance objectives that our compensation committee believes are correlated with the creation of long-term value for our stockholder. |
Our compensation philosophy and the above guidelines drive the specific elements of compensation that we choose to provide to our executive officers, including our named executive officers, as well as our decisions concerning the percentage mix of elements (e.g., cash vs. non-cash and short-term vs. long-term) that comprise each individual compensation package. How our elements of compensation are designed around our compensation philosophy and guidelines to achieve specific objectives are discussed in more detail under “—Elements of Executive Compensation” below.
We strive to set for each of our executive officers, including our named executive officers, an overall compensation package consisting of a fixed salary, variable cash incentive compensation, variable equity incentive compensation and other compensation and benefits at competitive levels that allow us to retain our executives and, to the extent necessary, attract new executive talent, while also motivating our executive management team to perform in a manner that creates value for our stockholder.
120
Table of Contents
Effect of Merger on Executive Compensation
Following completion of the Merger, the Compensation Committee determined that the compensation policies that were in place prior to completion of the Merger had largely been successful in recruiting and retaining executive-level employees who, the compensation committee believed, had displayed skill, experience, initiative and talent in managing us successfully during the period prior to the Merger. It also believed that the compensation policies were generally appropriate with respect to their focus on encouraging and rewarding achievement of our financial performance objectives with the ultimate goal of enhancing stockholder value. Therefore, the Compensation Committee did not significantly modify our executive compensation philosophies or programs following the Merger. In particular, it did not significantly adjust the mix of compensation elements (e.g., base salary, variable cash incentive compensation, variable equity incentive compensation, etc.). As a result, the executive compensation programs did not change significantly following the Merger with a few exceptions as follows:
| • | Pursuant to the new employment agreements, Messrs. Puzder, Murphy and Abajian became eligible to receive special retention bonuses if they remain employed by us as of specified future dates, as discussed in greater detail under the heading “—Elements of Executive Compensation—Retention Bonus” below. The special retention bonuses were adopted in lieu of grants of restricted stock to these named executive officers that would have been made under their prior employment agreements. |
| • | The performance metrics used to measure our financial performance for purposes of determining amounts payable under our variable cash incentive program changed and new targets were set for each of those performance metrics, as discussed in greater detail under “—Elements of Executive Compensation—Cash Incentive Compensation” below. |
| • | The type of equity securities issued to our executive officers under the variable equity incentive portion of our compensation programs changed (from restricted common stock and options to purchase common stock to limited partnership units) as a result of the change to our ownership structure following completion of the Merger, as discussed in greater detail under “—Elements of Executive Compensation—Equity Incentive Compensation” below. |
Role of Compensation Committee and Management
Our Compensation Committee has the primary authority and responsibility for determining our compensation philosophy and objectives and establishing compensation for our executive management, which includes our named executive officers. As noted above, the Compensation Committee that was appointed upon completion of the Merger did not significantly change the compensation philosophy and objectives that existed prior to completion of the Merger.
The Compensation Committee will annually review and consider the performance of our Chief Executive Officer and the other members of our executive management. Based on that annual review and in line with our compensation philosophy, our Compensation Committee will determine compensation for our Chief Executive Officer and other members of our executive management for approval by our board of directors.
Our Chief Executive Officer assists our Compensation Committee with establishing the compensation of our executive management, including our other named executive officers, by providing evaluations of their performance and recommendations to the board of directors regarding their compensation. Other members of executive management may participate in discussions about executive compensation as requested by our Compensation Committee. Executive officers do not generally participate in deliberations regarding their own compensation.
Use of Compensation Consultant and Peer Group Data
While our Compensation Committee has not utilized the services of a compensation consultant or any specific peer group data to establish or modify our executive compensation programs in the period following the
121
Table of Contents
Merger, compensation consultants and peer group data have played a significant historical role in establishing the amount and elements of executive compensation in the period prior to the Merger. Accordingly, we believe that an understanding of the prior role of compensation consultants and the use of peer group data is necessary to an understanding of our current compensation programs.
During fiscal 2007, the then-existing Compensation Committee undertook a thorough analysis of our compensation programs and engaged the services of J. Richard with J. Richard & Co., an executive compensation consultant and a Compensation Committee advisor, to assist with the analysis. Mr. Richard was retained as an independent compensation advisor reporting directly to our Compensation Committee.
In connection with the analysis in fiscal 2007, Mr. Richard selected 12 peer group companies. He then conducted an extensive analysis of their compensation practices, and compared them to our compensation practices. The 12 companies in this peer group study were Applebee’s International, Inc., Brinker International, Inc., California Pizza Kitchen, Inc., Cheesecake Factory, Incorporated, Dominos Pizza, Inc., Jack in the Box, Inc., Krispy Kreme Doughnuts, Inc., Outback Steakhouse, Inc., Panera Bread Company, Red Robin Gourmet Burgers, Inc., Ruby Tuesday, Inc. and Wendy’s International, Inc. These companies were selected as peer group companies principally because they operated in the restaurant industry and were of a similar size to us at the time.
After Mr. Richard completed his review and analysis, he rendered a report entitled “Executive Officer Total Compensation and Equity Participation Review” to the Compensation Committee in which he made certain recommendations regarding the total executive compensation packages for the named executive officers. Following extensive deliberation amongst the members of the then-existing Compensation Committee, and after soliciting feedback from the executive officers and additional advice from Mr. Richard, the Compensation Committee approved significant changes to the employment agreements with the executive officers at that time.
The Compensation Committee again solicited the services of Mr. Richard in fiscal 2009 and requested that he update his analysis and make additional recommendations regarding specific portions of the executive compensation programs. Following deliberation by the Compensation Committee, these recommendations resulted in additional changes to the employment agreements for the named executive officers as they existed at that time.
We have not utilized the services of a compensation consultant since completion of the Merger, nor do we expect to utilize such services in the foreseeable future.
Elements of Executive Compensation
In this section of our discussion, we provide relevant details about the individual elements of our executive compensation.
Salary
We determine base salaries for our executive officers, including our named executive officers, based on each of their positions and levels of responsibility. In so doing, we have historically taken into account the salary ranges for comparable positions, and the scope of duties and levels of responsibility associated with those positions, at similarly-situated companies, including the peer group companies discussed above. We intend base salaries to be competitive with salaries within our peer group generally, so that we can compete effectively in the market for talented individuals to serve as our executives and to retain those executives. We also believe that base salaries should provide financial security for our executive officers by providing a guaranteed amount of compensation in the event that incentive compensation is not earned. The Compensation Committee may, from time to time, increase the base salaries paid to our executive management in its sole discretion.
122
Table of Contents
As of the last day of fiscal 2012, the base salaries of the named executive officers were as follows:
| Executive |
Base Salary | |||
| Andrew F. Puzder |
$ | 1,070,000 | ||
| E. Michael Murphy |
$ | 636,750 | ||
| Theodore Abajian |
$ | 500,000 | ||
| Bradford R. Haley |
$ | 350,012 | ||
| Robert J. Starke |
$ | 325,000 | ||
Retention Bonus
In accordance with the terms of their respective employment agreements, each of Messrs. Puzder, Murphy and Abajian are entitled to receive up to three special retention bonuses, which we refer to as retention bonuses. The retention bonuses are intended to replace the benefit that would have accrued to these named executive officers from the grant of restricted stock awards that would have been made to these named executive officers under their prior employment agreements, but which were not ultimately granted as a result of the completion of the Merger. The retention bonuses are also designed to provide additional incentive to these executive officers to remain employed by us for a significant period of time following completion of the Merger. On October 1, 2011, we made the first of three retention bonus payments to each of Messrs. Puzder, Murphy, and Abajian of $1,255,000, $313,750 and $313,750, respectively. The remaining retention bonuses are payable in cash on the respective payment dates as set forth in the table below assuming the executive continues to be employed by us as of those dates. In addition, the executive officers may be entitled to an acceleration of some or all of any unpaid retention bonuses upon termination of employment under certain circumstances, as discussed under “—Employment Agreements” below. Any unpaid retention bonuses will be paid immediately upon the occurrence of a change of control transaction.
| Executive |
Retention Bonus Amount | Payment Dates | ||||
| Andrew F. Puzder |
$ $ |
1,255,000 1,255,000 |
|
October 1, 2012 October 1, 2013 | ||
| E. Michael Murphy |
$ $ |
313,750 313,750 |
|
October 1, 2012 October 1, 2013 | ||
| Theodore Abajian |
$ $ |
313,750 313,750 |
|
October 1, 2012 October 1, 2013 | ||
Cash Incentive Compensation
Our Compensation Committee believes that an important element of our executive officers’ compensation should be paid in the form of variable cash incentive compensation, which we refer to as cash bonuses, and that this form of compensation should be based on the achievement of specified Company financial performance targets. Our Compensation Committee also believes that, if the performance criteria is met, the cash bonus should represent a meaningful portion of the executive officers’ total compensation potential and that, to the extent actual performance is achieved at a level significantly above targeted amounts, the executive officers should have an opportunity to earn a substantial amount of additional compensation. Our Compensation Committee intends that the potential to earn these cash bonuses will encourage individual executives to contribute to our financial performance by working to help us achieve financial performance goals that our Compensation Committee determines are important for our financial success and will lead to enhanced value for our stockholder.
Messrs. Puzder, Murphy and Abajian. Based on the foregoing compensation philosophy, we have entered into employment agreements with each of Messrs. Puzder, Murphy and Abajian that include the potential that annual cash bonuses may be paid based on our financial performance. For each fiscal year during the term of the employment agreements, our Compensation Committee approves (generally at the beginning of the fiscal year) targets for our (i) same-store sales, (ii) Adjusted EBITDA, and (iii) free cash flow, as adjusted. We refer to these
123
Table of Contents
three performance measures as the “performance metrics” in this discussion. Targeted amounts for the performance metrics are determined by our Compensation Committee based on a budget presented by management. The Compensation Committee then assigns a weight to each of the three performance metrics, such that the sum of the weights equals 100%.
Following the end of each fiscal year, our achievement with respect to each performance metric is compared to the targeted amount for that performance metric. For fiscal 2012, each executive officer was able to achieve a bonus amount based upon the following achievement percentages:
| Achievement Ranges for Same-Store Sales Performance Metric(1) |
Achievement Performance Metric(1) |
Achievement Free Cash Flow Performance Metric(1) |
Resulting Cash Bonus Amount (for each Performance Metric) | |||
| Less than (2.0)% below target |
Under 90% of target | Under 86% of target | No bonus | |||
| Between (2.0)% and target |
Between 90% of target and target | Between 86% of target and target | A percentage of base salary on a sliding scale beginning at 50% and sliding to 100% | |||
| Between target and 2.0% |
Between target and 110% of target | Between target and 114% of target | A percentage of base salary on a sliding scale beginning at 100% and sliding to a maximum of 250% of base salary for Mr. Puzder, 220% of base salary for Mr. Murphy, and 200% of base salary for Mr. Abajian | |||
| More than 2.0% above target |
Greater than 110% of target | Greater than 114% of target | A maximum of 250% of base salary for Mr. Puzder, 220% of base salary for Mr. Murphy, and 200% of base salary for Mr. Abajian |
| (1) | In order to set meaningful targets and sliding scales for each of the performance metrics, the Compensation Committee and management mutually agreed on the above achievement ranges for fiscal 2012, which are different than those set forth in the employment agreements. |
In accordance with the terms of the employment agreements, actual performance with respect to the performance metrics is determined by reference to the audited financial statements for the relevant fiscal year, subject to adjustment to reflect unusual, nonrecurring or extraordinary events as determined by our Compensation Committee. The bonus amount earned in light of our actual achievement with respect to each performance metric (as calculated based on the table below) is then adjusted to reflect the weight assigned to each performance metric.
124
Table of Contents
The following table sets forth (i) the fiscal 2012 target for each of the performance metrics as established by the Compensation Committee, (ii) the actual fiscal 2012 results with respect to each of the performance metrics, (iii) the calculation of the achievement percentage for each performance metric (i.e., actual performance/targeted performance), (iv) the calculation of the payout percentage based on the achievement percentage referred to in (iii) and the table above, (v) the weighting of each of the performance metrics as set by the Compensation Committee, and (vi) the resulting calculation of the cash bonuses earned by each of Messrs. Puzder, Murphy and Abajian with respect to fiscal 2012:
| Fiscal 2012 Performance Metric |
Fiscal 2012 Actual Results |
Performance % Compared to Target |
Payout Percentage(1) |
Performance Metric Weighting % |
Total | |||||||||||||||||||
| (dollars in millions) | (dollars in millions) | |||||||||||||||||||||||
| Andrew F. Puzder |
||||||||||||||||||||||||
| Same-Store Sales |
2.9 | % | 3.5 | % | 0.6 | % | 145.0 | % | 25 | % | 36.3 | % | ||||||||||||
| Adjusted EBITDA(2) |
$ | 166.8 | $ | 165.9 | 99.5 | % | 97.4 | % | 25 | % | 24.3 | % | ||||||||||||
| Free Cash Flow(3) |
$ | 85.9 | $ | 98.7 | 114.9 | % | 250.0 | % | 50 | % | 125.0 | % | ||||||||||||
|
|
|
|||||||||||||||||||||||
| Total Payout Percentage |
185.6 | % | ||||||||||||||||||||||
| Base Salary |
$ | 1,070,000 | ||||||||||||||||||||||
|
|
|
|||||||||||||||||||||||
| Fiscal 2012 Cash Incentive Compensation |
$ | 1,985,844 | ||||||||||||||||||||||
|
|
|
|||||||||||||||||||||||
| E. Michael Murphy |
||||||||||||||||||||||||
| Same-Store Sales |
2.9 | % | 3.5 | % | 0.6 | % | 136.0 | % | 25 | % | 34.0 | % | ||||||||||||
| Adjusted EBITDA(2) |
$ | 166.8 | $ | 165.9 | 99.5 | % | 97.4 | % | 25 | % | 24.3 | % | ||||||||||||
| Free Cash Flow(3) |
$ | 85.9 | $ | 98.7 | 114.9 | % | 220.0 | % | 50 | % | 110.0 | % | ||||||||||||
|
|
|
|||||||||||||||||||||||
| Total Payout Percentage |
168.3 | % | ||||||||||||||||||||||
| Base Salary |
$ | 636,750 | ||||||||||||||||||||||
|
|
|
|||||||||||||||||||||||
| Fiscal 2012 Cash Incentive Compensation |
$ | 1,071,924 | ||||||||||||||||||||||
|
|
|
|||||||||||||||||||||||
| Theodore Abajian |
||||||||||||||||||||||||
| Same-Store Sales |
2.9 | % | 3.5 | % | 0.6 | % | 130.0 | % | 25 | % | 32.5 | % | ||||||||||||
| Adjusted EBITDA(2) |
$ | 166.8 | $ | 165.9 | 99.5 | % | 97.4 | % | 25 | % | 24.3 | % | ||||||||||||
| Free Cash Flow(3) |
$ | 85.9 | $ | 98.7 | 114.9 | % | 200.0 | % | 50 | % | 100.0 | % | ||||||||||||
|
|
|
|||||||||||||||||||||||
| Total Payout Percentage |
156.8 | % | ||||||||||||||||||||||
| Base Salary |
$ | 500,000 | ||||||||||||||||||||||
|
|
|
|||||||||||||||||||||||
| Fiscal 2012 Cash Incentive Compensation |
$ | 784,215 | ||||||||||||||||||||||
|
|
|
|||||||||||||||||||||||
| (1) | The payout percentage for each performance metric is based upon the achievement percentage as discussed above. |
| (2) | Adjusted EBITDA represents net income (loss), adjusted to exclude income taxes, interest income and expense, and depreciation and amortization, adjusted for certain non-recurring, non-cash and other expenses and income. |
| (3) | For fiscal 2012, our free cash flow was calculated using Adjusted EBITDA less capital expenditures, adjusted for certain other items as approved by the Compensation Committee. |
Messrs. Starke and Haley. The cash incentive compensation for Messrs. Starke and Haley, our other two named executive officers, is determined by and paid at the discretion of our Chief Executive Officer. While Mr. Puzder does establish certain performance criteria for each of these executives and assess performance with respect to those criteria as a factor when determining the bonus to be paid to the executives, the bonus awards are ultimately discretionary in nature. Accordingly, these bonuses are reported as discretionary bonuses in the Summary Compensation Table rather than as cash incentive plan compensation. Based on Mr. Puzder’s recommendation, for fiscal 2012, Mr. Starke was paid a discretionary bonus of $450,000 and Mr. Haley was paid a discretionary bonus of $300,000.
125
Table of Contents
Management Equity Investments
In connection with the Merger, each of our named executive officers purchased Class A Units (the “Class A Units”) of Apollo CKE Holdings, L.P., our indirect parent company, as specified in their respective employment agreements (or, in the case of Messrs. Starke and Haley, in separate subscription agreements). The Class A Units are equivalent to the securities acquired by the Apollo Funds in connection with the Merger and include the right to vote. Apollo CKE Holdings, L.P.’s indirect ownership of our common stock is its only material asset. Accordingly, an ownership interest in it represents an indirect market ownership interest in our common stock.
Upon the completion of this offering, each Class A Unit will represent an indirect ownership of shares of our common stock.
The number of Class A Units purchased by each of the named executive officers and the percentage of the currently outstanding Class A Units held by each named executive officer is set forth in the table below:
| Executive |
Number of Class A Units |
Percentage of Class A Units |
||||||
| Andrew F. Puzder |
674,000 | 1.50 | % | |||||
| E. Michael Murphy |
152,500 | 0.34 | % | |||||
| Theodore Abajian |
220,000 | 0.49 | % | |||||
| Bradford R. Haley |
40,000 | 0.09 | % | |||||
| Robert J. Starke |
8,200 | 0.02 | % | |||||
In connection with their respective investments in the Class A Units, each of our named executive officers executed the limited partnership agreement of Apollo CKE Holdings, L.P. (as amended, the “Partnership Agreement”) and became limited partners thereunder. Under the Partnership Agreement, the Class A Units are subject to (or have the benefit of) customary transfer restrictions, tag-along rights, drag-along rights, repurchase rights and registration rights.
While the purchases of the Class A Units were made directly by our named executive officers, and were not made pursuant to any particular compensation program, we believe that the purchases of the Class A Units are relevant to the discussion of our compensation philosophies because our named executive officers have made a significant personal investment in the Company. These personal investments motivate our named executive officers to contribute to the achievement of outstanding financial performance by us that creates value for our stockholders because their economic interests are aligned with those of our stockholders.
Equity Incentive Compensation
In addition to the purchase of the Class A Units, upon completion of the Merger, our named executive officers were each granted awards in the form of Class B Units (the “Class B Units”) in Apollo CKE Holdings, L.P. pursuant to the terms of their employment agreements (or, in the case of Messrs. Starke and Haley, in separate subscription agreements). The Class B Units are non-voting profit interests and entitle each executive officer to share in the future appreciation of the value of our business.
Upon the completion of this offering, each Class B Unit will represent, subject to its terms as described below, an indirect ownership of shares of our common stock.
The equity incentive compensation program pursuant to which the Class B Units were issued was designed to serve as a means through which our executive officers and senior management, including our named executive officers, can indirectly obtain an equity interest in us. By agreeing to issue the Class B Units, our Compensation Committee believes that it is promoting the fulfillment of our compensation philosophy and objectives by enhancing management retention over the long-term, creating an incentive for our senior management to work
126
Table of Contents
diligently towards the achievement of our financial goals that promote stockholder value, and aligning the interests of the senior management team with those of our stockholder. Our Compensation Committee determined the number of Class B Units to be issued to each named executive officer based upon such officer’s title, duties, level of responsibility, expected contribution to us and other factors deemed appropriate by the Compensation Committee.
Apollo CKE Holdings, L.P. granted Class B Units in the form of time vesting units (“Time Vesting Units”) and performance vesting units (“Performance Vesting Units”). The Time Vesting Units vest in four equal annual installments from the date of grant. The Performance Vesting Units will vest or convert to a time vesting schedule upon the achievement of certain financial or investment targets. Prior to a change of control transaction or qualified initial public offering (“IPO”), our performance against such targets will be determined based upon a specified formula driven by our Adjusted EBITDA. These performance criteria will be assessed on a quarterly basis beginning with the quarter ending August 13, 2012. Upon a change of control event, our performance against the specified targets will be based upon a formula driven by the proceeds generated from such transaction and after a qualified IPO, our performance against the specified targets will be based upon a calculation driven by the public stock price. The Class B Units are subject to (or have the benefit of) customary transfer restrictions, tag-along rights, drag-along rights, repurchase rights and registration rights.
The number of outstanding Class B Units for each of the named executive officers and the percentage of the currently outstanding Class B Units held by each named executive officer is set forth in the table below:
| Executive |
Number of Unvested Time Vesting Class B Units(1) |
Number of Unvested Performance Vesting Class B Units(2) |
Number of Vested Class B Units(1) |
Total Class B Units |
Percentage of Outstanding Class B Units |
|||||||||||||||
| Andrew F. Puzder |
751,250 | 1,001,666 | 250,417 | 2,003,333 | 39.83 | % | ||||||||||||||
| E. Michael Murphy |
248,851 | 331,802 | 82,951 | 663,604 | 13.19 | % | ||||||||||||||
| Theodore Abajian |
248,851 | 331,802 | 82,951 | 663,604 | 13.19 | % | ||||||||||||||
| Bradford R. Haley |
65,734 | 87,645 | 21,911 | 175,290 | 3.48 | % | ||||||||||||||
| Robert J. Starke |
65,734 | 87,645 | 21,911 | 175,290 | 3.48 | % | ||||||||||||||
| (1) | The Time Vesting Units vest in four equal annual installments from the date of grant, which was July 12, 2010. As a result, one fourth of the Time Vesting Units vested on July 12, 2011 and the remaining Time Vesting Units will vest in three equal installments on the second, third and fourth anniversaries of the date of grant. |
| (2) | The Performance Vesting Units vest as discussed above. |
Perquisites
The employment agreements with Messrs. Puzder, Murphy and Abajian provide for the following perquisites:
| • | Payment of the initiation fee and membership dues of a social or recreational club for the purpose of maintaining various business relationships on our behalf (but not the payment of any personal expenses or purchases of the executive officer at such club); |
| • | Supplemental disability insurance sufficient to provide two-thirds of the executive’s pre-disability base salary for a two-year period; and |
| • | Provision of medical and other insurance coverage provided by us to other executive officers as well as a supplemental medical expense reimbursement policy to reimburse the executives for medical, dental and vision care expenses, subject to certain limitations, incurred by the executive and his dependents that are not otherwise reimbursed or covered by the base health insurance plan. |
Except for what is provided for in their respective employment agreements, our executive officers have not requested perquisites, and our Compensation Committee’s general philosophy is to keep perquisites to a
127
Table of Contents
minimum. However, we do, consistent with what our Compensation Committee believes to be usual practices at many other companies:
| • | Pay directly or reimburse for mobile phones used by the executive officers; |
| • | Pay the costs of preparing annually the income tax returns of the executive officers; and |
| • | Provide for a modest automobile allowance or a Company leased car for each of the named executive officers. |
The only other significant perquisite provided to our executive officers relates to personal use of our aircraft. Because our executives are required to travel extensively, we have had a long-standing policy of allowing family members of executive officers to utilize any empty seats that may exist on a flight originated for business purposes. From time to time family members of our named executive officers have utilized these seats. All personal usage is (i) reported as income to the Internal Revenue Service in accordance with its guidelines, on which the executive personally pays the income taxes, and (ii) valued in the Perquisites Table in accordance with the methodology prescribed by the SEC.
Severance and Change of Control Arrangements
To support our compensation objective of attracting, retaining and motivating qualified employees, we have adopted severance and change of control policies that apply to each of our named executive officers. These policies are not contained within standalone agreements, but are instead included within certain provisions of the Partnership Agreement and, in the case of Messrs. Puzder, Murphy and Abajian, their respective employment agreements. Additional information regarding the specific employment agreement provisions that address severance and change of control arrangements is set forth under “—Employment Agreements” below.
In addition to the provisions contained in the employment agreements, the Partnership Agreement provides for accelerated vesting of certain Class B Units upon the termination of a named executive officer’s employment or upon a change of control. Generally, in the event of a termination of a named executive officer’s employment, all unvested Time Vesting Units and Performance Vesting Units will be forfeited and cancelled. However, if a named executive officer’s employment is terminated due to death or disability, then (i) the number of unvested Time Vesting Units or Performance Vesting Units subject to a time vesting schedule that would have become vested Time Vesting Units or Performance Vesting Units during the one-year period following the named executive officer’s termination on account of death or disability will be treated as vested, and (ii) the named executive officer’s unvested Performance Vesting Units will remain outstanding for the one year period following the termination on account of death or disability.
Upon a change of control, the Partnership Agreement provides that (i) all unvested Time Vesting Units will vest, (ii) all unvested Performance Vesting Units that were previously converted to a time vesting schedule will vest, (iii) all unvested Performance Vesting Units that were not previously converted to a time vesting schedule, but would otherwise convert to a time vesting schedule due to the change of control will vest, and (iv) all other unvested Performance Vesting Units will be forfeited and cancelled.
Additional information concerning the potential payments that may be made to our named executive officers in connection with their termination of employment or upon a change of control is presented in the Potential Payments Upon Termination of Employment or Change of Control Table below.
Retirement Benefits
We do not have any pension or profit sharing plans to which we make contributions for the benefit of any of our named executive officers. Additionally, we do not have any other plans or contractual obligations to pay retirement benefits of any type to any named executive officer.
The Compensation Committee does not presently foresee adopting any such benefits. The absence of these benefits has been taken into account in determining the elements of the total compensation packages of our named executive officers.
128
Table of Contents
Predecessor Employee Stock Purchase Plan
Our Predecessor Employee Stock Purchase Plan (“ESPP”) provided eligible employees, which included our executive officers, the opportunity to purchase shares of our common stock at market prices. For every dollar that an executive officer had withheld from his wages, we would contribute for the benefit of the executive officer 50% of such amount in the year following such contribution. The ESPP was terminated July 12, 2010 in connection with the Merger, and no additional employee contributions were made under the ESPP thereafter. The All Other Compensation Table below reflects cash payments made to our executive officers in lieu of an ESPP common stock match subsequent to the termination of the ESPP.
Employment Agreements
We entered into new employment agreements with each of Messrs. Puzder, Murphy and Abajian upon completion of the Merger. While certain terms of the employment arrangements were changed as a result of the new employment agreements, the principal compensation philosophies and programs underlying the agreements are similar in many respects to the employment agreements that were in place for these executive officers prior to the Merger. The principal changes to the employment agreements relate to (i) the addition of the retention bonuses, as discussed in greater detail under “—Elements of Executive Compensation—Retention Bonus” above, (ii) modifications to the cash incentive compensation portion of the employment agreements to reflect changes to the underlying performance metrics and the target amounts for those metrics, as discussed in greater detail under “—Elements of Executive Compensation—Cash Incentive Compensation” above, and (iii) the modification to the equity incentive compensation portion of the employment agreements to reflect the change in our ownership structure following completion of the Merger, as discussed in greater detail under “—Elements of Executive Compensation—Equity Incentive Compensation” above.
The employment agreements with Messrs. Starke and Haley were terminated in connection with the Merger.
A summary of the terms of each of the employment agreements entered into with Messrs. Puzder, Murphy and Abajian, as they existed as of the end of fiscal 2012, is set forth below.
Andrew F. Puzder. The employment agreement with Mr. Puzder provides that he will serve as our Chief Executive Officer for a four-year initial term commencing on the date of the closing of the Merger, provided that the term shall automatically be extended for successive one-year periods unless it is terminated by either party with six months notice. The employment agreement provides for an annual base salary of $1,070,000, three special cash retention bonuses each in the amount of $1,255,000 (one of which has been paid), a variable cash incentive compensation opportunity of between 50% and 250% of base salary, and a grant of 2,003,333 Class B Units. In addition, we shall have the right to terminate the executive for cause (as defined in the employment agreement), in which case the executive shall only be entitled to receive base salary due to the executive through the date of termination. Furthermore, in the event of a termination of the executive’s employment by us other than for cause, or by the executive for good reason (as defined in the employment agreement), or by the executive due to a change of control (as defined in the Partnership Agreement), or at the expiration of the term of the employment agreement following notice of non-renewal provided by us, we shall be obligated to pay the executive severance in the form of (i) a payment equal to six times base salary, (ii) a payment equal to 50% of any unpaid retention bonus, with the potential to receive the full 100% of any unpaid retention bonus under certain circumstances as set forth in the employment agreement, (iii) continuation of all employee benefits (except equity compensation) for the remainder of the term, and (iv) customary outplacement services in an amount not to exceed $25,000.
E. Michael Murphy. The employment agreement with Mr. Murphy provides that he will serve as our President and Chief Legal Officer for a four-year initial term commencing on the date of the closing of the Merger, provided that the term shall automatically be extended for successive one-year periods unless it is terminated by either party with six months notice. The employment agreement provides for an annual base salary
129
Table of Contents
of $636,750, three special cash retention bonuses each in the amount of $313,750 (one of which has been paid), a variable cash incentive compensation opportunity of between 50% and 220% of base salary, and a grant of 663,604 Class B Units. In addition, we shall have the right to terminate the executive for cause (as defined in the employment agreement), in which case the executive shall only be entitled to receive base salary due to the executive through the date of termination. Furthermore, in the event of a termination of the executive’s employment by us other than for cause, or by the executive for good reason (as defined in the employment agreement), or by the executive due to the departure of Mr. Puzder following a change of control (as defined in the Partnership Agreement), or at the expiration of the term of the employment agreement following notice of non-renewal provided by us, we shall be obligated to pay the executive severance in the form of (i) a payment equal to three times base salary, (ii) a prorated cash bonus based on our performance through the date of termination, (iii) a payment equal to 50% of any unpaid retention bonus, with the potential to receive the full 100% of any unpaid retention bonus under certain circumstances as set forth in the employment agreement, (iv) continuation of all employee benefits (except equity compensation) for the remainder of the term, and (v) customary outplacement services in an amount not to exceed $25,000.
Theodore Abajian. The employment agreement with Mr. Abajian provides that he will serve as our Executive Vice President and Chief Financial Officer for a four-year initial term commencing on the date of the closing of the Merger, provided that the term shall automatically be extended for successive one-year periods unless it is terminated by either party with six months notice. The employment agreement provides for an annual base salary of $500,000, three special cash retention bonuses each in the amount of $313,750 (one of which has been paid), a variable cash incentive compensation opportunity of between 50% and 200% of base salary, and a grant of 663,604 Class B Units. In addition, we shall have the right to terminate the executive for cause (as defined in the employment agreement), in which case the executive shall only be entitled to receive base salary due to the executive through the date of termination. Furthermore, in the event of a termination of the executive’s employment by us other than for cause, or by the executive for good reason (as defined in the employment agreement), or by the executive due to the departure of Mr. Puzder following a change of control (as defined in the Partnership Agreement), or at the expiration of the term of the employment agreement following notice of non-renewal provided by us, we shall be obligated to pay the executive severance in the form of (i) a payment equal to three times base salary, (ii) a prorated cash bonus based on our performance through the date of termination, (iii) a payment equal to 50% of any unpaid retention bonus, with the potential to receive the full 100% of any unpaid retention bonus under certain circumstances as set forth in the employment agreement, (iv) continuation of all employee benefits (except equity compensation) for the remainder of the term, and (v) customary outplacement services in an amount not to exceed $25,000.
Executive Compensation Risk Considerations
As discussed above, we design our executive compensation programs with the overall objectives of encouraging our executives to be committed to us, help us achieve outstanding financial performance, and ultimately create value for our stockholder. We recognize that the pursuit of goals that lead to the payment of incentive compensation, including the cash and equity incentive bonus opportunities discussed above, could cause our executive officers (or other employees at the direction of our executive officers) to focus on individual enrichment rather than our overall welfare, and, as a result, to take actions intended to achieve the financial performance goals necessary for payment of the incentive compensation, but that expose us to undue risk. However, while we recognize that there are inherent risks in any incentive compensation program, we do not believe that risks arising from our compensation policies and practices, including the compensation programs for our executive officers described above, are reasonably likely to have a material adverse effect on us primarily because they:
| • | contain elements that we believe effectively link the payment of performance-based compensation to meaningful financial goals for us that are designed to promote the creation of stockholder value; |
| • | contain elements that we believe create appropriate and effective incentives for the executive officers, whom we believe are significant assets to us and will play a vital role in creating long-term value for our stockholder, to remain in our employ over a period of years; |
130
Table of Contents
| • | include an overall mix of compensation elements for those individuals who are best positioned to have an impact on our financial performance (e.g., our named executive officers) that is appropriately balanced between short-term and long-term incentives, such that it does not encourage the taking of short-term risks at the expense of long-term results or vice-versa; |
| • | include equity-based compensation for our executive officers that aligns their interests with those of our stockholder, by providing them with an incentive to achieve financial results that enhance the value of their equity-based compensation, but that discourages them from excessive risk-taking that could reduce the value of their equity-based compensation; and |
| • | provide our Compensation Committee with discretion to establish and modify performance goals under our cash and equity incentive compensation programs from year to year, thereby giving our Compensation Committee the ability to change the incentive and retentive qualities of the incentive compensation programs as it deems appropriate in light of our compensation philosophy. |
Fiscal 2012 Executive Compensation
SUMMARY COMPENSATION TABLE
| Name and Principal Position |
Fiscal Year |
Salary ($) |
Bonus ($)(1) |
Stock Awards ($)(2) |
Option Awards ($)(2) |
Cash Incentive Plan Compensation ($)(3) |
Change in Pension Value and Nonqualified Deferred Compensation Earnings ($)(4) |
All
Other Compensation ($)(5) |
Total ($) |
|||||||||||||||||||||||||||
| Andrew F. Puzder |
2012 | 1,070,000 | 1,255,000 | — | — | 1,985,844 | — | 174,211 | 4,485,055 | |||||||||||||||||||||||||||
| Chief Executive Officer |
2011 | 1,090,577 | (6) | — | 7,041,715 | — | 1,676,709 | — | 308,350 | 10,117,351 | ||||||||||||||||||||||||||
| 2010 | 1,070,000 | — | 3,192,000 | — | 2,675,000 | — | 351,188 | 7,288,188 | ||||||||||||||||||||||||||||
| E. Michael Murphy |
2012 | 636,750 | 313,750 | — | — | 1,071,924 | — | 95,740 | 2,118,164 | |||||||||||||||||||||||||||
| President and Chief Legal Officer |
2011 | 648,996 | (6) | — | 2,332,568 | — | 920,184 | — | 102,989 | 4,004,737 | ||||||||||||||||||||||||||
| 2010 | 636,750 | — | 798,000 | — | 1,400,850 | — | 102,990 | 2,938,590 | ||||||||||||||||||||||||||||
| Theodore Abajian |
2012 | 500,000 | 313,750 | — | — | 784,215 | — | 58,698 | 1,656,663 | |||||||||||||||||||||||||||
| Executive Vice |
2011 | 488,731 | (6) | — | 2,332,568 | — | 681,932 | — | 136,470 | 3,639,701 | ||||||||||||||||||||||||||
| President and Chief Financial Officer |
2010 | 454,750 | — | 798,000 | — | 909,500 | — | 138,701 | 2,300,951 | |||||||||||||||||||||||||||
| Bradford R. Haley |
2012 | 350,012 | 300,000 | — | — | — | — | 32,213 | 682,225 | |||||||||||||||||||||||||||
| Chief Marketing Officer |
2011 | 356,743 | (6) | 250,000 | 616,144 | — | — | — | 41,815 | 1,264,702 | ||||||||||||||||||||||||||
| 2010 | 350,012 | 300,000 | 14,088 | 59,600 | — | — | 43,041 | 766,741 | ||||||||||||||||||||||||||||
| Robert J. Starke | 2012 | 325,000 | 450,000 | — | — | — | — | 26,705 | 801,705 |
|||||||||||||||||||||||||||
| Executive Vice |
2011 | 319,712 | (6) | 425,000 | 616,144 | — | — | — | 29,065 | 1,389,921 | ||||||||||||||||||||||||||
| President, Hardee’s Operations |
2010 | 275,000 | 325,000 | 14,088 | 59,600 | — | — | 32,014 | 705,702 | |||||||||||||||||||||||||||
| (1) | The amounts set forth in this column for Messrs. Puzder, Murphy and Abajian represent the payment of retention bonuses to each of them in fiscal 2012. For additional information, please refer to the discussion under “—Compensation Discussion and Analysis for Fiscal 2012—Elements of Executive Compensation—Retention Bonuses” above. The amounts set forth in this column for Messrs. Haley and Starke represent the payment of bonuses to these named executive officers that were subject to the discretion of our Chief Executive Officer. As such, these amounts have been disclosed as a discretionary bonus rather than cash incentive plan compensation. |
| (2) | The amounts set forth in these columns reflect the aggregate grant date fair value of the Predecessor stock and option awards and Successor Class B Units computed in accordance with the Financial Accounting Standards Board Accounting Standards Codification Topic 718. During fiscal 2012, there were no stock awards or option awards granted to our named executive officers. In accordance with SEC rules, for awards that are subject to performance conditions, the amounts reflect the full grant date fair value of the awards based upon the probable outcome of the performance conditions. Certain assumptions used in the calculation of the amounts are included in Note 18 of our Notes to Consolidated Financial Statements. |
131
Table of Contents
| (3) | The amounts set forth in this column represent the dollar amount of the cash incentive compensation earned by each of our named executive officers. For additional information about the terms of the cash incentive compensation program and the calculation of the cash bonuses paid with respect to fiscal 2012, please refer to the discussion under “—Compensation Discussion and Analysis for Fiscal 2012—Elements of Executive Compensation—Cash Incentive Compensation” above. |
| (4) | We do not sponsor any pension plans on behalf of our named executive officers or other management personnel. In addition, none of our named executive officers have realized any above-market earnings on nonqualified deferred compensation. |
| (5) | The amounts set forth in this column represent the dollar amount of compensation earned by each of our named executive officers which is not reported in any of the columns to the left of this column. Please refer to the All Other Compensation Table below for additional information about the amounts disclosed in this column for fiscal 2012. |
| (6) | This amount represents the base salary earned by each of our named executive officers for fiscal 2011, which included one additional week in our fourth quarter. |
ALL OTHER COMPENSATION TABLE
| Name |
Perquisites ($)(1) |
Trip and Other Awards ($) |
Insurance Premiums ($)(2) |
Company Matching Contributions to ESPP ($)(3) |
Total ($)(4) |
|||||||||||||||
| Andrew F. Puzder |
125,036 | — | 24,483 | 24,692 | 174,211 | |||||||||||||||
| E. Michael Murphy |
69,283 | 2,912 | 23,545 | — | 95,740 | |||||||||||||||
| Theodore Abajian |
25,995 | — | 22,209 | 10,494 | 58,698 | |||||||||||||||
| Bradford R. Haley |
8,080 | — | 22,518 | 1,615 | 32,213 | |||||||||||||||
| Robert J. Starke |
13,143 | 802 | 12,760 | — | 26,705 | |||||||||||||||
| (1) | The amounts set forth in this column represent the aggregate dollar amount of perquisites earned by each of our named executive officers in fiscal 2012. The determinations of the particular payments which qualify as “perquisites” were made in accordance with SEC rules. See the Perquisites Table below for a more detailed explanation of the various perquisites earned by each of our named executive officers, which comprise the aggregate perquisite amounts disclosed in this column. |
| (2) | The amounts set forth in this column represent our contributions for premiums for group life, medical, dental, vision, and long-term disability insurance for each of our named executive officers in fiscal 2012. |
| (3) | The amounts set forth in this column represent the dollar amount of our cash contributions made to each of our named executive officers under our Predecessor ESPP in fiscal 2012. Please refer to the discussion under “—Compensation Discussion and Analysis for Fiscal 2012—Elements of Executive Compensation—Predecessor Employee Stock Purchase Plan” above. |
| (4) | The amounts set forth in this column represent the sum of each of the columns to the left of this column and are equivalent to the amounts set forth in the “All Other Compensation” column of the Summary Compensation Table above. |
132
Table of Contents
PERQUISITES TABLE
| Name |
Car Allowance ($) |
Wireless Payments ($) |
Personal Use of Company Aircraft ($)(1) |
Reimbursements for Medical and Dental Costs ($) |
Tax/ Financial Planning Assistance ($) |
Club Memberships and Dues ($) |
Total Perquisites ($)(2) |
|||||||||||||||||||||
| Andrew F. Puzder |
9,769 | 2,134 | 49,569 | 47,927 | 13,525 | 2,112 | 125,036 | |||||||||||||||||||||
| E. Michael Murphy |
9,769 | 2,246 | 22,959 | 27,128 | 2,995 | 4,186 | 69,283 | |||||||||||||||||||||
| Theodore Abajian |
8,585 | 2,132 | 377 | 8,789 | 120 | 5,992 | 25,995 | |||||||||||||||||||||
| Bradford R. Haley |
5,801 | 2,279 | — | — | — | — | 8,080 | |||||||||||||||||||||
| Robert J. Starke |
177 | 4,344 | — | 8,622 | — | — | 13,143 | |||||||||||||||||||||
| (1) | The amounts set forth in this column represent the incremental cost to us from the personal use of our aircraft by each of our named executive officers, and were calculated in accordance with SEC rules. |
| (2) | The amounts set forth in this column for each of our named executive officers represent the sum of each of the columns to the left of this column and are equivalent to the amounts set forth in the “Perquisites” column of the All Other Compensation Table above. |
GRANTS OF PLAN BASED AWARDS TABLE
| Estimated Future
Payouts Under Cash Incentive Plan Awards(1) |
Estimated Future
Payouts Under Equity Incentive Plan Awards |
All Other Stock Awards: Number of Securities Underlying Options (#) |
All Other Unit Awards: Number of Units (#) |
Exercise or Base Price of Option Awards ($/Sh) |
Grant Date Fair Value of Unit Awards ($) |
|||||||||||||||||||||||||||||||||||||||
| Name |
Grant Date |
Threshold ($) |
Target ($) |
Maximum ($) |
Threshold (#) |
Target (#) |
Maximum (#) |
|||||||||||||||||||||||||||||||||||||
| Andrew F. Puzder |
— | 535,000 | 1,070,000 | 2,675,000 | — | — | — | — | — | — | — | |||||||||||||||||||||||||||||||||
| E. Michael Murphy |
— | 318,375 | 636,750 | 1,400,850 | — | — | — | — | — | — | — | |||||||||||||||||||||||||||||||||
| Theodore Abajian |
— | 250,000 | 500,000 | 1,000,000 | — | — | — | — | — | — | — | |||||||||||||||||||||||||||||||||
| Bradford R. Haley |
— | — | — | — | — | — | — | — | — | — | — | |||||||||||||||||||||||||||||||||
| Robert J. Starke |
— | — | — | — | — | — | — | — | — | — | — | |||||||||||||||||||||||||||||||||
| (1) | The “Threshold,” “Target” and “Maximum” amounts of non-equity incentive plan awards set forth in these columns are derived from the terms of the employment agreements entered into by and between us and each of Messrs. Puzder, Murphy and Abajian. Additional information regarding the calculation of the potential cash bonus payments set forth in these columns, as well as the determination of the actual cash bonuses paid to these named executive officers with respect to fiscal 2012, is set forth under “—Compensation Discussion and Analysis for Fiscal 2012—Executive Compensation Elements—Cash Incentive Compensation” above. Messrs. Starke and Haley are eligible to receive discretionary bonuses as disclosed in the Summary Compensation Table above. |
133
Table of Contents
OUTSTANDING EQUITY AWARDS AT FISCAL YEAR END TABLE(1)
| Option Awards | Class B Unit Awards | |||||||||||||||||||||||||||||||
| Name |
Number of Securities Underlying Unexercised Options (#) Exercisable |
Number of Securities Underlying Unexercised Options (#) Unexercisable |
Option Exercise Price ($) |
Option Expiration Date |
Number of Time Vesting Units That Have Not Vested (#)(2) |
Market Value of Time Vesting Units That Have Not Vested ($)(3) |
Equity Incentive Plan Awards: Number of Unearned Performance Vesting Units That Have Not Vested (#)(4) |
Equity Incentive Plan Awards: Market or Payout Value of Unearned Performance Vesting Units That Have Not Vested ($)(5) |
||||||||||||||||||||||||
| Andrew F. Puzder |
— | — | — | — | 751,250 | 2,640,644 | 1,001,666 | 3,520,856 | ||||||||||||||||||||||||
| E. Michael Murphy |
— | — | — | — | 248,851 | 874,711 | 331,802 | 1,166,284 | ||||||||||||||||||||||||
| Theodore Abajian |
— | — | — | — | 248,851 | 874,711 | 331,802 | 1,166,284 | ||||||||||||||||||||||||
| Bradford R. Haley |
— | — | — | — | 65,734 | 231,055 | 87,645 | 308,072 | ||||||||||||||||||||||||
| Robert J. Starke |
— | — | — | — | 65,734 | 231,055 | 87,645 | 308,072 | ||||||||||||||||||||||||
| (1) | Upon the completion of this offering, each Class B Unit will represent an indirect ownership of shares of our common stock. |
| (2) | The amounts set forth in this column represent the number of Time Vesting Units that were granted to our named executive officers pursuant to the Partnership Agreement, but which have not vested as of January 31, 2012. Additional information regarding the Time Vesting Units, including the vesting of such awards, is set forth under “—Compensation Discussion and Analysis for Fiscal 2012—Executive Compensation Elements—Equity Incentive Compensation” above. |
| (3) | The amounts set forth in this column represent the value of the Time Vesting Units, which have not vested as of January 31, 2012, calculated by multiplying the number of Time Vesting Units by the grant date fair value of $3.52 per unit. The actual value of the Time Vesting Units as of any relevant valuation date could be significantly higher or lower than the per unit value we have assumed for purposes of preparing this table. |
| (4) | The amounts set forth in this column represent the number of Performance Vesting Units that were granted to our named executive officers pursuant to the Partnership Agreement but which have not vested as of January 31, 2012. Additional information regarding the Performance Vesting Units, including the vesting of such awards, is set forth under “—Compensation Discussion and Analysis for Fiscal 2012—Executive Compensation Elements—Equity Incentive Compensation” above. |
| (5) | The amounts set forth in this column represent the value of the Performance Vesting Units, which have not vested as of January 31, 2012, calculated by multiplying the number of Performance Vesting Units by the grant date fair value of $3.52 per unit. The actual value of the Performance Vesting Units as of any relevant valuation date could be significantly higher or lower than the per unit value we have assumed for purposes of preparing this table. |
134
Table of Contents
OPTION EXERCISES AND STOCK VESTED TABLE(1)
| Option Awards | Class B Unit Awards | |||||||||||||||
| Name |
Number of Shares Acquired on Exercise (#) |
Value Realized on Exercise ($) |
Number of Shares Acquired on Vesting (#)(2) |
Value Realized on Vesting ($)(3) |
||||||||||||
| Andrew F. Puzder |
— | — | 250,417 | 880,216 | ||||||||||||
| E. Michael Murphy |
— | — | 82,951 | 291,573 | ||||||||||||
| Theodore Abajian |
— | — | 82,951 | 291,573 | ||||||||||||
| Bradford R. Haley |
— | — | 21,911 | 77,017 | ||||||||||||
| Robert J. Starke |
— | — | 21,911 | 77,017 | ||||||||||||
| (1) | Upon the completion of this offering, each Class B Unit will represent an indirect ownership of shares of our common stock. |
| (2) | The amounts set forth in this column represent the number of Time Vesting Units that vested during fiscal 2012. The Time Vesting Units vest in four equal annual installments from the date of grant, which was July 12, 2010. As a result, one fourth of the Time Vesting Units vested on July 12, 2011 and the remaining Time Vesting Units will vest in three equal installments on the second, third and fourth anniversaries of the date of grant. |
| (3) | The amounts set forth in this column represent the value of the Time Vesting Units that vested during fiscal 2012, calculated by multiplying the number of Time Vesting Units in the column immediately to the left by the grant date fair value of $3.52 per unit. The actual value of the Time Vesting Units as of any relevant valuation date could be significantly higher or lower than the per unit value we have assumed for purposes of preparing this table. |
POTENTIAL PAYMENTS UPON TERMINATION OR CHANGE OF CONTROL
The information set forth in the table below describes the compensation that would become payable under our existing compensation programs and policies, including the relevant provisions of the Partnership Agreement and the employment agreements that we have entered into with each of Messrs. Puzder, Murphy and Abajian, if each named executive officer’s employment had terminated effective as of January 31, 2012, the last day of fiscal 2012.
The table assumes that each named executive officer’s salary and service levels will be the same on the date of termination as they were on the last day of our fiscal year. The amounts set forth for insurance, health benefits and similar policies also assume the continued availability of such policies on terms which are equivalent to those in effect as of the last day of fiscal 2012. The compensation amounts set forth in the table exclude benefits that accrued prior to January 31, 2012 and are in addition to benefits generally available to salaried employees, such as subsidized medical benefits and disability benefits.
The table does not attempt to set forth the compensation that is payable to the named executive officers upon the occurrence of any particular change of control transaction. Because the disclosures in the table assume the occurrence of a termination or change of control as of a particular date and under a particular set of circumstances and therefore make a number of important assumptions, the actual amounts to be paid to each of our named executive officers upon a termination or change of control may vary significantly from the amounts included in this prospectus. Factors that could affect these amounts include the timing during the year of any such event, the continued availability of benefit policies at similar prices, and the type of termination event that occurs (as set forth in the first column in the table below).
Additional information regarding our severance and change of control policies is set forth under “—Compensation Discussion and Analysis for Fiscal 2012—Elements of Executive Compensation—Severance and Change of Control Arrangements” above.
135
Table of Contents
POTENTIAL PAYMENTS UPON TERMINATION OR CHANGE OF CONTROL TABLE
| Name |
Salary ($)(1) |
Other
Cash Payments ($)(2) |
Accelerated Vesting of Outstanding Units ($)(3) |
Other Benefits ($)(4) |
Excise Tax (including gross-up) ($)(5) |
|||||||||||||||
| Andrew F. Puzder |
||||||||||||||||||||
| Retirement, Resignation or Voluntary Termination |
— | — | — | — | — | |||||||||||||||
| Termination by the Company for Cause |
— | — | — | — | — | |||||||||||||||
| Termination by the Executive for Good Reason(6) |
6,420,000 | 1,225,000 | — | 249,875 | 1,000,000 | |||||||||||||||
| Termination by the Company Without Cause |
6,420,000 | 1,225,000 | — | 249,875 | 1,000,000 | |||||||||||||||
| Termination Upon a Change of Control(6) |
6,420,000 | 1,225,000 | 2,640,644 | (8) | 249,875 | 1,000,000 | ||||||||||||||
| Termination Upon Death or Disability(7) |
1,070,000 | — | 880,216 | — | — | |||||||||||||||
| E. Michael Murphy |
||||||||||||||||||||
| Retirement, Resignation or Voluntary Termination |
— | — | — | — | — | |||||||||||||||
| Termination by the Company for Cause |
— | — | — | — | — | |||||||||||||||
| Termination by the Executive for Good Reason(6) |
1,910,250 | 1,385,674 | — | 174,673 | — | |||||||||||||||
| Termination by the Company Without Cause |
1,910,250 | 1,385,674 | — | 174,673 | — | |||||||||||||||
| Termination Upon a Change of Control(6) |
1,910,250 | 1,385,674 | 874,711 | (8) | 174,673 | — | ||||||||||||||
| Termination Upon Death or Disability(7) |
636,750 | — | 291,573 | — | — | |||||||||||||||
| Theodore Abajian |
||||||||||||||||||||
| Retirement, Resignation or Voluntary Termination |
— | — | — | — | — | |||||||||||||||
| Termination by the Company for Cause |
— | — | — | — | — | |||||||||||||||
| Termination by the Executive for Good Reason(6) |
1,500,000 | 1,097,965 | — | 119,568 | — | |||||||||||||||
| Termination by the Company Without Cause |
1,500,000 | 1,097,965 | — | 119,568 | — | |||||||||||||||
| Termination Upon a Change of Control(6) |
1,500,000 | 1,097,965 | 874,711 | (8) | 119,568 | — | ||||||||||||||
| Termination Upon Death or Disability(7) |
500,000 | — | 291,573 | — | — | |||||||||||||||
| Bradford R. Haley |
||||||||||||||||||||
| Retirement, Resignation or Voluntary Termination |
— | — | — | — | — | |||||||||||||||
| Termination by the Company for Cause |
— | — | — | — | — | |||||||||||||||
| Termination by the Executive for Good Reason |
— | — | — | — | — | |||||||||||||||
| Termination by the Company Without Cause |
— | — | — | — | — | |||||||||||||||
| Termination Upon a Change of Control | — | — | 231,051(8) | — | — | |||||||||||||||
| Termination Upon Death or Disability(7) |
— | — | 77,021 | — | — | |||||||||||||||
| Robert J. Starke |
||||||||||||||||||||
| Retirement, Resignation or Voluntary Termination |
— | — | — | — | — | |||||||||||||||
| Termination by the Company for Cause |
— | — | — | — | — | |||||||||||||||
| Termination by the Executive for Good Reason |
— | — | — | — | — | |||||||||||||||
| Termination by the Company Without Cause |
— | — | — | — | — | |||||||||||||||
| Termination Upon a Change of Control |
— | — | 231,051 | (8) | — | — | ||||||||||||||
| Termination Upon Death or Disability(7) |
— | — | 77,021 | — | — | |||||||||||||||
| (1) | In the event of a termination under specified circumstances as detailed in their respective employment agreements, Mr. Puzder is entitled to a severance amount equal to his base annual salary in effect as of the date of termination multiplied by the number six and each of Messrs. Murphy and Abajian are entitled to a severance amount equal to his base annual salary in effect as of the date of termination multiplied by the number three. |
| (2) | In the event of a termination under specified circumstances, as detailed in their respective employment agreements, Messrs. Puzder, Murphy and Abajian are entitled to receive 50% of any unpaid special retention bonus. Additionally, Messrs. Murphy and Abajian are entitled, pursuant to the terms of their respective employment agreements, to receive the annual cash bonus that would have been paid to the executive in respect of the fiscal year in which the employee’s termination of employment occurs. |
136
Table of Contents
| (3) | The amounts set forth in this column represent the value which would be realized by each of our named executive officers upon the accelerated vesting of unvested Class B Units. These amounts have been calculated using the grant date fair value of the Class B Units, which was $3.52, multiplied by the number of unvested Class B Units held by each named executive officer on that date. The actual value of the Class B Units as of any relevant valuation date could be significantly higher or lower than the per unit value we have assumed for purposes of preparing this table. As a result, the aggregate value that may be realized by our named executive officers with respect to the accelerated vesting of Class B Units held by them could be significantly different from the amounts included in the table. |
| (4) | Each of our named executive officers are entitled to the continuation of the various employee benefit plans and programs under which they were entitled to participate prior to termination in the event of a termination of their employment under specified circumstances, as detailed in their respective employment agreements. Each of Messrs. Puzder, Murphy and Abajian are entitled to continued participation until the end of their employment term, which is through July 12, 2014, based upon the employment agreements in effect as of January 31, 2012. The amounts set forth in this column are estimates of the benefit payments to be made on each executive officer’s behalf in connection with his termination, assuming that the cost to us of providing his current benefits remains the same. |
| (5) | We are not obligated to make any excise tax payments or related tax gross up payments on behalf of any of our named executive officers except for Mr. Puzder. If and to the extent that any payment to Mr. Puzder upon a termination upon a change of control would constitute an “excess parachute payment,” then Mr. Puzder shall be entitled to receive an excise tax gross-up payment not exceeding $1,000,000, in accordance with the provisions of his Employment Agreement. |
| (6) | Each of Messrs. Puzder, Murphy and Abajian are entitled to receive certain payments and benefits upon a termination of their respective employment agreements for “Good Reason.” “Good Reason” is defined in Mr. Puzder’s Employment Agreement to include the following events, without the Employee’s consent, (i) a material failure by the Company to pay any compensation owed to the Employee, (ii) a material reduction in the Employee’s base salary or target bonus percentage, (iii) a material diminution in the Employee’s responsibilities or authority, (iv) a relocation of the Employee’s principal place of employment outside the city limits of either Carpinteria or Santa Barbara, California, or (v) the occurrence of a change of control. “Good Reason” is defined in the employment agreements for Messrs. Murphy and Abajian to include the following events, without the Employee’s consent, (i) a material failure by the Company to pay any compensation owed to the Employee, (ii) a material reduction in the Employee’s base salary or target bonus percentage, (iii) a material diminution in the Employee’s responsibilities or authority, or (iv) the voluntary resignation of Mr. Puzder as Chief Executive Officer during the period between 90 and 365 days following the occurrence of a change of control. Additional information regarding the payments and benefits to be received by our named executive officers upon a termination of their employment for “Good Reason” (including, in some cases, relating to a change of control) is discussed under the heading “Employment Agreements” in the Compensation Discussion and Analysis section above. |
| (7) | In the event a named executive officer’s employment is terminated due to his death or disability, he (or his successors) would be entitled to continue to receive the base salary in effect as of the date of the death or disability for a period of one year. Additionally, in the event of the death or disability of one of our named executive officers, the number of Time Vesting Units that would vest during the one year period following the termination of employment on account of such death or disability shall be treated as vested Class B Units and any unvested Performance Vesting Units shall remain outstanding for the one year period following such termination on account of such death or disability. |
| (8) | The value is based on the minimum number of Class B Units that would accrue to each of our named executive officers from the vesting of Time Vesting Units upon a change of control as detailed in the Partnership Agreement. Each of our named executive officers have the opportunity for additional Class B Units to accrue to them from the vesting of Performance Vesting Units upon the occurrence of a change of control, however, certain criteria must be satisfied as detailed in the Partnership Agreement. Additional information regarding the vesting of the Time Vesting Units and the Performance Vesting Units upon the occurrence of a change of control is discussed under “—Compensation Discussion and Analysis for Fiscal 2012—Elements of Executive Compensation—Severance and Change of Control Arrangements” above and in the Partnership Agreement. |
137
Table of Contents
Director Compensation for Fiscal 2012
Non-employee directors of CKE Restaurants receive an annual retainer of $50,000, plus $2,000 for each board meeting and committee meeting they attend in person or $1,000 for each board meeting or committee meeting attended telephonically. Our directors are also reimbursed for out-of-pocket expenses incurred in connection with their duties as directors. In addition, upon joining the board of directors, certain of our non-employee directors received a grant of 20,000 Class B Units, which vest in four equal installments on each of the first four anniversaries of the grant date, provided that such director continues to serve as a member of our board of directors on each applicable vesting date. Compensation due to Peter P. Copses and Lance A. Milken for their services as directors will be paid or issued, as applicable, to affiliates of Apollo Management.
The compensation earned by the non-management directors of CKE Restaurants in fiscal 2012 is set forth in the table below:
| Name |
Fees Earned or Paid in Cash ($) |
Unit Awards(1) ($) |
Option Awards ($) |
Non-Equity Incentive Plan Compensation ($) |
Change in Pension Value and Nonqualified Deferred Compensation Earnings ($) |
All Other Compensation ($) |
Total ($) |
|||||||||||||||||||||
| Peter P. Copses(2) |
68,000 | — | — | — | — | — | 68,000 | |||||||||||||||||||||
| Robert J. DiNicola |
59,000 | — | — | — | — | — | 59,000 | |||||||||||||||||||||
| George G. Golleher |
58,000 | — | — | — | — | — | 58,000 | |||||||||||||||||||||
| Lance A. Milken(2) |
68,000 | — | — | — | — | — | 68,000 | |||||||||||||||||||||
| Daniel E. Ponder Jr. |
58,000 | — | — | — | — | — | 58,000 | |||||||||||||||||||||
| Jerold H. Rubinstein |
67,000 | — | — | — | — | — | 67,000 | |||||||||||||||||||||
| C. Thomas Thompson |
58,000 | — | — | — | — | — | 58,000 | |||||||||||||||||||||
| (1) | During fiscal 2012, no Unit Awards were issued to our non-management directors. As of January 31, 2012, Messrs. DiNicola, Golleher, Ponder, Rubinstein and Thompson each had 15,000 unvested and outstanding Time Vesting Units. |
| (2) | Fees earned or paid to Peter P. Copses and Lance A. Milken for their services as directors were paid to affiliates of Apollo Management. |
Stock Incentive Plan
Background
The board of directors believes that attracting and retaining board members, executives and other key employees of high quality has been and will continue to be essential to our growth and success. Consistent with this view, on , 2012, the board of directors adopted, and our stockholder approved, the CKE Inc. 2012 Equity and Incentive Compensation Plan (the “Stock Incentive Plan”). The Stock Incentive Plan will enable us to formulate and implement a compensation program that will attract, motivate and retain experienced, highly-qualified directors and employees who will contribute to our financial success, and will align the interests of our directors and employees with those of our stockholders through the ability to grant a variety of stock-based and cash-based awards. The Stock Incentive Plan will serve as the umbrella plan for our stock-based and cash-based incentive compensation programs for our directors, officers and other key employees.
No grants have been made under the Stock Incentive Plan as of the date of this prospectus.
138
Table of Contents
Potential Dilution
The aggregate number of shares of common stock that may be issued to employees and directors under the Stock Incentive Plan will not exceed million. As discussed below, shares issued pursuant to grants of “full value awards” are counted against this limit on a 1 for 2 basis, and therefore use of these types of awards will more quickly exhaust the available share reserve. Shares subject to awards granted under the Stock Incentive Plan which are subsequently forfeited, expire unexercised or are otherwise not issued will not be treated as having been issued for purposes of the share limitation.
Description of the Stock Incentive Plan
The following is a brief description of the material features of the Stock Incentive Plan. This description is qualified in its entirety by reference to the full text of the Stock Incentive Plan, a copy of which is filed as an exhibit to the registration statement of which this prospectus forms a part.
Administration. The Compensation and Corporate Governance Committee (or another committee appointed by the our board of directors and generally consisting of persons who are “non-employee directors,” as defined under Rule 16b-3 under the Exchange Act, “outside directors,” within the meaning of Internal Revenue Code Section 162(m) and “independent directors” under New York Stock Exchange’s rules) (in either case, the “Committee”) will administer the Stock Incentive Plan. The Committee will have the authority to select award recipients, determine the type, size and other terms and conditions of awards, and make all other decisions and determinations as may be required under the terms of the Stock Incentive Plan or as the Committee may deem necessary or advisable for the administration of the Stock Incentive Plan. The Committee will be permitted to delegate to one or more of our senior executives the authority to make grants of awards to officers (other than executive officers) and employees and such other administrative responsibilities as the Committee may deem necessary or advisable, to the extent such delegation is consistent with applicable law and the applicable stock exchange rules.
Eligibility. Officers, employees and non-employee directors of CKE and its subsidiaries and other individuals who provide services for CKE or any subsidiary are eligible to be selected as award recipients.
Type of Awards. The Committee is authorized to grant awards payable in either our shares or cash, including options to purchase shares, restricted shares, bonus shares, stock appreciation rights, restricted stock units, performance units and dividend equivalents. Awards may be granted alone or in combination with any other award granted under the Stock Incentive Plan or any other plan.
Terms and Conditions of Awards. The Committee will determine the size of each award to be granted (including, where applicable, the number of shares to which an award will relate), and all other terms and conditions of each award (including any exercise price, grant price, or purchase price, any restrictions or conditions relating to transferability, forfeiture, exercisability, or settlement of an award, and any schedule or performance conditions for the lapse of such restrictions or conditions, and accelerations or modifications of such restrictions or conditions); provided that (i) no award will expire more than ten years from the date of grant; (ii) except with respect to Substitute Awards (as defined below), awards granted as stock options or stock appreciation rights may not have an exercise price that is less than the fair market value of the shares on the date of grant; (iii) dividend equivalents will not be paid with respect to any other unvested performance shares or units (provided that dividend equivalents may accrue on such unvested awards, and be paid to the extent the shares vest); and (iv) no dividend equivalents may be granted with respect to stock options or stock appreciation rights. The types of awards that may be granted under the Stock Incentive Plan include the following:
| • | Stock Options and Stock Appreciation Rights. A stock option is a right to purchase a specified number of shares of our common stock at an exercise price established at the date of grant. Stock options granted may be either non-qualified stock options or incentive stock options (which are intended to qualify as “incentive stock options” within Section 422 of the Internal Revenue Code). The exercise |
139
Table of Contents
| price of any stock option granted may not be less than the fair market value of our common stock on the date of grant. A stock appreciation right (SAR) entitles the recipient to receive, upon surrender of the SAR, an amount of cash or number of shares of our common stock having a fair market value equal to the positive difference, if any, between the fair market value of one share of common stock on the date of exercise and the exercise price of the SAR (which exercise price shall not be less than the fair market value of our common stock on the date of grant). The Committee will specify at the time an option or SAR is granted, when, and in what proportions, an option or SAR becomes vested and exercisable. |
| • | Restricted Stock and Restricted Stock Units. An award of restricted stock is an issuance of shares of our common stock that is subject to certain restrictions established by the Committee and to forfeiture if the holder does not satisfy certain requirements (including, for example, continued employment with us for a specified period of time). Recipients of restricted stock do not receive the stock until the restrictions are satisfied but may be entitled to vote the restricted stock and to exercise other shareholder rights. Thus, upon grant, the shares may be included in our total number of shares outstanding and accrue and pay dividends. An award of restricted stock units entitles the recipient to receive shares of our common stock at some later date once the holder has satisfied certain requirements. At that time (and not before), the shares will be delivered and the recipient will be entitled to all stockholder rights. Thus, upon grant, the shares of common stock covered by the restricted stock units are not considered issued and are not included in the our total number of shares outstanding until all conditions have been satisfied. Dividend equivalents may accrue, or be paid, on restricted stock units at the discretion of the Committee. |
| • | Performance-Based Awards. The Committee may grant performance awards, which may be cash- or stock-based. Generally, performance awards require satisfaction of pre-established performance goals, consisting of one or more business criteria and a targeted performance level with respect to such criteria as a condition of awards being granted, becoming exercisable or settleable, or as a condition to accelerating the timing of such events. The Committee will set the performance goals used to determine the amount payable pursuant to a performance award. |
| • | Aggregate Limitation on Stock-Based Awards. The aggregate number of shares that may be issued under the Stock Incentive Plan during the life of the Stock Incentive Plan will not exceed million. For each share that is actually delivered pursuant to a stock-based award other than a stock option or SAR (a full value award), the aggregate share limit under the Stock Incentive Plan will be reduced by two shares and for each share that is actually delivered pursuant to a stock option or SAR, the aggregate share limit under the Stock Incentive Plan will be reduced by one share. Additionally, upon the exercise of each stock-settled SAR, the aggregate share limit under the Stock Incentive Plan will be reduced further by the number of shares having a fair market value equal to the base price or exercise price for the number of shares so exercised, and for each stock option or stock-settled SAR, each share withheld to satisfy the exercise price or withholding taxes with respect to any such award, will reduce the aggregate share limit by one share. To the extent that any shares are forfeited and returned to us for no consideration, or are repurchased by us for the price paid by the participant for such shares, the aggregate share limit under the Stock Incentive Plan will be increased to the same extent that the aggregate share limit was decreased upon the issuance the shares based on the ratios above. Shares withheld to satisfy the withholding obligations for any stock-based awards other than stock options or SARs will not be treated as having been issued under the Stock Incentive Plan. Shares delivered under the Plan may be newly issued shares, reacquired shares, including shares acquired on the market, or treasury shares. In the event of our acquisition of any company, outstanding equity grants with respect to stock of the acquired company may be assumed or replaced with awards under the Stock Incentive Plan. Outstanding awards that are assumed or replaced by awards under the Stock Incentive Plan in connection with an acquisition (“Substitute Awards”) will not reduce the Stock Incentive Plan’s aggregate share limit. The terms of any such Substitute Award will be determined by the Committee and may include exercise prices or base prices that are different from those otherwise described in the |
140
Table of Contents
| Stock Incentive Plan. If we assume a stockholder approved equity plan from an acquired company, any shares of common stock available under the assumed plan (after appropriate adjustments, as required to reflect the transaction) may be issued pursuant to awards under the Stock Incentive Plan and will not reduce the Stock Incentive Plan’s aggregate share limit. |
Adjustments. In the event of a large, special or non-recurring dividend or distribution, recapitalization, stock dividend, reorganization, business combination, or other similar corporate transaction or event affecting the Company’s common stock, the Committee may adjust the number and kind of shares subject to the aggregate and individual share limitations described above. The Committee may also adjust outstanding awards upon occurrence of these events in order to preserve the award without enhancing the value of the award. These adjustments may include changes to the number of shares subject to an award, the exercise price or share price referenced in the award terms, and other terms of the award. The Committee will make such substitutions or adjustments, including as described above, as it deems fair and equitable as a result of any share dividend or split declared by us. The Committee is also authorized to adjust performance conditions and other terms of awards in response to these kinds of events or to changes in applicable laws, regulations, or accounting principles.
Restrictions on Repricing. The Stock Incentive Plan includes a restriction that we may not reprice stock options or SARs previously granted under the Stock Incentive Plan or cancel stock options or SARs in exchange for a cash payment or another award, nor may the board of directors amend the Stock Incentive Plan to permit such repricing or cancellation of stock options or SARs, in each case, unless otherwise approved by the company’s stockholders. The term “repricing” is defined under the New York Stock Exchange rules and refers to amendments designed to reduce the exercise price of outstanding stock options or the base amount of outstanding SARs or the cancellation of outstanding stock options or SARs in exchange for other awards or stock options or SARs with an exercise price or base amount, as applicable, that is less than the exercise price or base amount, as applicable, of the original award. Adjustments to the exercise price or number of shares subject to a stock option or SAR to reflect the effects of a stock split or other extraordinary corporate transaction generally will not constitute a “repricing.”
Clawback Policy. All awards made under the Stock Incentive Plan shall be subject to the applicable provisions of our clawback or recoupment policies, share trading policies and other policies that may be implemented and approved by the board of directors, as such policy may be in effect from time to time.
Amendment, Termination. The board of directors may amend, suspend, discontinue, or terminate the Stock Incentive Plan or the Committee’s authority to grant awards under the Stock Incentive Plan without stockholder approval, provided that stockholder approval will be required for any amendment that will (i) materially modify the terms of the Stock Incentive Plan or (ii) require stockholder approval as a matter of law or regulation or under the stock exchange rules. Unless earlier terminated, the Stock Incentive Plan will terminate ten years after its approval by stockholders.
Federal Income Tax Implications of the Stock Incentive Plan
The federal income tax consequences arising with respect to awards granted under the Stock Incentive Plan will depend on the type of award. From the recipients’ standpoint, as a general rule, ordinary income will be recognized at the time of payment of cash, or delivery of actual shares. Future appreciation on shares held beyond the ordinary income recognition event will be taxable at capital gains rates when the shares are sold. We, as a general rule, will be entitled to a tax deduction that corresponds in time and amount to the ordinary income recognized by the recipient, and we will not be entitled to any tax deduction in respect of capital gain income recognized by the recipient. Exceptions to these general rules may arise under the following circumstances: (i) if shares, when delivered, are subject to a substantial risk of forfeiture by reason of failure to satisfy any employment or performance-related condition, ordinary income taxation and our tax deduction will be delayed until the risk of forfeiture lapses (unless the recipient makes a special election to ignore the risk of forfeiture); (ii) if an employee is granted a stock option that qualifies as “incentive stock option,” no ordinary income will be
141
Table of Contents
recognized, and we will not be entitled to any tax deduction, if shares acquired upon exercise of such option are held more than the longer of one year from the date of exercise and two years from the date of grant; (iii) for awards granted after a specified transition period, we will not be entitled to a tax deduction for compensation attributable to awards granted to one of our covered employees, if and to the extent such compensation does not qualify as “performance-based” compensation Internal Revenue Code Section 162(m), and such compensation, along with any other non-performance-based compensation paid in the same calendar year, exceeds $1 million; and (iv) an award may be taxable at 20 percentage points above ordinary income tax rates at the time it becomes vested, even if that is prior to the delivery of the cash or stock in settlement of the award, if the award constitutes “deferred compensation” under Internal Revenue Code Section 409A, and the requirements of Code Section 409A are not satisfied. The foregoing provides only a general description of the application of federal income tax laws to certain awards under the Stock Incentive Plan, and is not intended as tax guidance to participants in the Stock Incentive Plan, as the tax consequences may vary with the types of awards made, the identity of the recipients and the method of payment or settlement. This summary does not address the effects of other federal taxes (including possible “golden parachute” excise taxes) or taxes imposed under state, local, or foreign tax laws.
142
Table of Contents
PRINCIPAL AND SELLING STOCKHOLDERS
The following table provides certain information regarding the beneficial ownership of our outstanding capital stock as of May 15, 2012, and after giving effect to the offering, for:
| • | the selling stockholder; |
| • | each other person or group who beneficially owns more than 5% of our capital stock on a fully diluted basis; and |
| • | each of our directors, each of the named executive officers in the Summary Compensation Table and all of our current executive officers and directors as a group. |
Beneficial ownership of shares is determined under the rules of the SEC and generally includes any shares over which a person exercises sole or shared voting or investment power. Except as indicated by footnote, and subject to applicable community property laws, each person identified in the table possesses sole voting and investment power with respect to all shares of common stock held by them. Unless otherwise noted, the business address for each director and executive officer is c/o CKE Inc., 6307 Carpinteria Ave., Ste. A., Carpinteria, California, 93013.
| Before the Offering | After the Offering | |||||||||
| Name of Beneficial Owner |
Shares | Percentage | Shares | Percentage | ||||||
| Selling stockholder: |
||||||||||
| CH Restaurant Holdings, LLC(1) |
100 | % | ||||||||
| Directors, named executive officers and all executive officers and directors as a group: |
||||||||||
| Andrew F. Puzder(2) |
— | |||||||||
| E. Michael Murphy(2) |
— | |||||||||
| Theodore Abajian(2) |
— | |||||||||
| Bradford R. Haley(2) |
— | |||||||||
| Robert J. Starke(2) |
— | |||||||||
| Peter P. Copses(3) |
— | |||||||||
| Robert J. DiNicola(2) |
— | |||||||||
| George G. Golleher(2) |
— | |||||||||
| Lance A. Milken(3) |
— | |||||||||
| Daniel E. Ponder, Jr.(2) |
— | |||||||||
| Jerold H. Rubinstein(2) |
— | |||||||||
| C. Thomas Thompson(2) |
— | |||||||||
| All executive officers and directors as a group |
— | |||||||||
| (1) | CH Restaurant Holdings, LLC, the selling stockholder in this offering. The number of shares reported as beneficially owned by CH Restaurant Holdings, LLC represents all of the shares of our common stock that were outstanding prior to this offering, all of which are held of record by CH Restaurant Holdings, LLC. Apollo CKE Holdings, L.P. is the sole member of CH Restaurant Holdings, LLC. Apollo CKE Holdings GP, LLC is the general partner of Apollo CKE Holdings, L.P. Apollo CKE Investors, L.P. is the sole member and manager of Apollo CKE Holdings GP, LLC. Apollo Management VII, L.P. is the manager of Apollo CKE Investors, L.P. AIF VII Management, LLC is the general partner of Apollo Management VII, L.P., and Apollo Management, L.P. is the sole member and manager of AIF VII Management, LLC. Apollo Management GP, LLC is the general partner of Apollo Management, L.P., Apollo Management Holdings, L.P. is the sole member and manager of Apollo Management GP, LLC, and Apollo Management Holdings GP, LLC is the general partner of Apollo Management Holdings, L.P. Leon Black, Joshua Harris and Marc Rowan are the managers, as well as principal executive officers, of Apollo Management Holdings GP, LLC. The address of CH Restaurant Holdings, LLC, Apollo CKE Holdings, L.P., Apollo CKE Holdings GP, LLC |
143
Table of Contents
| and Apollo CKE Investors, L.P. is One Manhattanville Road, Suite 201, Purchase, New York 10577. The address of Apollo Management VII, L.P., AIF VII Management, LLC, Apollo Management, L.P., Apollo Management GP, LLC, Apollo Management Holdings, L.P. and Apollo Management Holdings GP, LLC, and Messrs. Black, Harris and Rowan, is 9 West 57th Street, 43rd Floor, New York, New York 10019. |
| (2) | Messrs. Puzder, Murphy, Abajian, Haley, Starke, DiNicola and Golleher own the following Class A Units of Apollo CKE Holdings, L.P.: 674,000, 152,500, 220,000, 40,000, 8,200, 25,000 and 50,000, respectively. Messrs. Puzder, Murphy, Abajian, Haley, Starke, DiNicola, Golleher, Ponder, Rubinstein and Thompson have 250,417, 82,951, 82,951, 21,911, 21,911, 30,000, 55,000, 5,000, 5,000 and 5,000 vested Class B Units of Apollo CKE Holdings, L.P., respectively. The following Time Vesting Units for Messrs. Puzder, Murphy, Abajian, Haley, Starke, DiNicola and Golleher are expected to vest on July 12, 2012: 250,417, 82,951, 82,951, 21,911, 21,911, 5,000 and 5,000, respectively. In addition, the following Time Vesting Units for Messrs. Ponder, Rubinstein and Thompson are expected to vest on August 10, 2012: 5,000, 5,000 and 5,000, respectively. Upon the completion of this offering, each Class A Unit will represent an indirect ownership of shares of common stock and each Class B Unit will represent, subject to its terms, an indirect ownership of shares of common stock. |
| (3) | Messrs. Copses and Milken are both associated with Apollo and its affiliated investment managers, however, each expressly disclaims beneficial ownership of the shares of our common stock that may be deemed beneficially owned by Apollo or any other Apollo affiliate, except to the extent of any pecuniary interest therein. The address of Messrs. Copses and Milken is c/o Apollo Management, L.P., 9 West 57th Street, New York, New York 10019. |
144
Table of Contents
CERTAIN RELATIONSHIPS AND RELATED PARTY TRANSACTIONS
Management Services Fee
In connection with the Merger, we entered into a management services agreement with Apollo Management, dated as of July 12, 2010 (the “Management Services Agreement”). Under the Management Services Agreement, Apollo Management agreed to provide to us certain advisory services on an ongoing basis for a fee of $2.5 million per year, which Apollo Management may increase in its sole discretion at any time up to an amount equal to 2% of our annual EBITDA (as defined under our Credit Facility). During fiscal 2012, we made aggregate payments of $2.5 million to Apollo Management for management fees under the Management Services Agreement.
Pursuant to the Management Services Agreement, Apollo Management also agreed to provide to us certain financial advisory and investment banking services from time to time in connection with major financial transactions that may be undertaken by us or our subsidiaries in exchange for fees customary for such services after taking into account Apollo Management’s expertise and relationships within the business and financial community. In exchange, we agreed to provide customary indemnification to Apollo Management under the Management Services Agreement. In addition, in connection with the Merger, we agreed to pay a transaction fee of $10.0 million (plus reimbursement of expenses) to Apollo Management for financial advisory services rendered in connection with the Merger and related transactions. These services included: (i) assisting us in structuring the Merger and related transactions; (ii) taking into account tax considerations and optimal access to financing; and (iii) assisting in the negotiation of our material agreements and financing arrangements in connection with the Merger and related transactions.
The Management Services Agreement terminates on the tenth anniversary of the date of the agreement. However, upon the consummation of this offering, we and Apollo Management and its affiliates intend to terminate the Management Services Agreement, and in connection with the termination Apollo Management or its affiliates will receive $ million (plus any unreimbursed expenses) from us. Such payment corresponds to the present value of the aggregate annual fees that would have been payable during the remainder of the term of the Management Services Agreement (assuming a ten year term from the date of such agreement) using a discount rate of 10%.
Management Limited Partnership Agreement
In connection with the Merger, certain affiliates of the Apollo Funds, our directors and certain members of our senior management entered into the Partnership Agreement. All executive officers and directors investing in Class A Units and receiving awards of Class B Units were required to execute the Partnership Agreement and become limited partners of Apollo CKE Holdings, L.P. Under the Partnership Agreement, the Class A Units and Class B Units purchased or held are subject to (or have the benefit of) customary transfer restrictions, tag-along rights, drag-along rights and repurchase rights. The Partnership Agreement was amended in January 2012. See “Executive Compensation—Compensation Discussion and Analysis for Fiscal 2012—Elements of Executive Compensation—Equity Incentive Compensation” above for a more detailed discussion of the Class A Units and Class B Units.
Director Relationships
Certain members of our board of directors are or were also our franchisees. These franchisees regularly purchase equipment and other products from us and pay us various fees on the same terms and conditions as our other franchisees. These transactions are described below.
Related Transactions with Board of Directors
Daniel E. Ponder, Jr. Daniel E. Ponder, Jr. is a member of our board of directors. Mr. Ponder is President and Chairman of the board of directors of Ponder Enterprises, Inc. (“PEI”). PEI is a franchisee of Hardee’s and
145
Table of Contents
operated 24 Hardee’s restaurants during the sixteen weeks ended May 21, 2012, fiscal 2012 and fiscal 2011, and 23 Hardee’s restaurants during fiscal 2010. In connection with the operation of its Hardee’s restaurants, PEI made the following payments to us during the sixteen weeks ended May 21, 2012, fiscal 2012, fiscal 2011 and fiscal 2010, respectively: $10,200, $0, $5,150 and $45,700 in franchise and development fees; $35,762, $463,670, $380,234 and $219,215 for the purchase of equipment from us; $378,533, $1,038,645, $832,223 and $665,210 in royalty fees; $382,243, $1,231,725, $1,032,282 and $931,069 in advertising and promotional fees; and $55,872, $167,616, $162,209 and $163,207 for rental and other property-related payments for certain of their restaurant properties that were leased and/or subleased from us. Additionally, during the sixteen weeks ended May 21, 2012, fiscal 2012, fiscal 2011 and fiscal 2010, PEI made payments to us of $16,572, $52,609, $54,078 and $63,659, respectively, for other miscellaneous fees and charges.
C. Thomas Thompson. C. Thomas Thompson is a member of our board of directors and is the Managing General Partner of TWM Industries, L.P., a member of Manteca Star, LLC, a member of Modesto Restaurant Group, LLC, a member of The Chowchilla Connection, LLC, a Managing Member of TWM/Fresno, LLC, and a General Partner of TWM Industries/VFR (collectively, the “Thompson Entities”). The Thompson Entities are each franchisees of Carl’s Jr. and collectively operated a total of 60 Carl’s Jr. and Carl’s Jr./Green Burrito dual-branded restaurants during the sixteen weeks ended May 21, 2012, fiscal 2012, fiscal 2011 and fiscal 2010. In connection with the operation of their Carl’s Jr. and Carl’s Jr./Green Burrito restaurants, the Thompson Entities collectively paid us the following amounts during the sixteen weeks ended May 21, 2012, fiscal 2012, fiscal 2011 and fiscal 2010, respectively: $20,750, $84,313, $46,000 and $11,000 in franchise and development fees; $835,835, $2,711,900, $2,766,186 and $2,800,323 in royalty fees; $1,121,767, $3,562,847, $3,682,990 and $3,721,230 in advertising and promotional fees; and $687,085, $2,351,200, $2,289,478 and $2,318,865 for rental and other property-related payments for certain of their restaurant properties that were leased and/or subleased from us. During the sixteen weeks ended May 21, 2012 and fiscal 2012, the Thompson Entities paid us $49,040 and $88,741, respectively, for the purchase of equipment. During fiscal 2011 and 2010, the Thompson Entities paid us $8,541,293 and $19,009,360, respectively, for the purchase of food, equipment and other products. Additionally, during the sixteen weeks ended May 21, 2012, fiscal 2012, fiscal 2011 and fiscal 2010, the Thompson Entities made payments to us of $104,580, $301,403, $298,390 and $359,508, respectively, for other miscellaneous fees and charges.
Registration Rights Agreement
We intend to enter into a registration rights agreement with our stockholder, and certain persons who own an indirect interest in our common stock and who may become our stockholders, including certain Apollo Funds and members of our management (the “Registration Rights Agreement”). Under the terms of the Registration Rights Agreement, we will agree to register shares of our common stock upon the written request of our stockholder or a request on behalf of the Apollo Funds. In addition, the other stockholders party to the Registration Rights Agreement will have customary piggy-back registration rights. The Registration Rights Agreement will be subject to customary cutbacks, and our right to defer registration by up to 90 days if our board of directors determines the filing of a registration statement would be materially adverse to us.
Nominating Agreement
We intend to enter into an agreement with Apollo Management pursuant to which Apollo Management will have the right, at any time until Apollo no longer beneficially owns at least 50.1% of our outstanding common stock, to require us to increase the size of our board of directors by such number that, when added to the number of directors designated by Apollo Management, would constitute a majority of our board of directors, and to fill those vacancies with directors nominated by Apollo Management. Until such time as Apollo no longer beneficially owns at least 50.1% of our outstanding common stock, Apollo Management will have the right to nominate four designees to our board of directors. After Apollo no longer beneficially owns at least 50.1% of our outstanding common stock, but until such time as Apollo no longer beneficially owns at least 33 1/3% of our outstanding common stock, Apollo Management will have the right to nominate three designees to our board of
146
Table of Contents
directors. In addition, under our bylaws, until such time as Apollo no longer beneficially owns at least 33 1/3% of our outstanding common stock, certain important matters will require the approval of a majority of the directors nominated by Apollo Management voting on such matters. See “Management—Apollo Approval of Certain Matters and Rights to Nominate Certain Directors.”
147
Table of Contents
Upon completion of the offering, our authorized capital stock will consist of shares of common stock and shares of preferred stock, the rights and preferences of which may be designated by the board of directors. As of , 2012, there were shares of common stock issued and outstanding and no shares of preferred stock issued and outstanding. As of , 2012, there was one holder of record of our common stock, CH Restaurant Holdings, LLC.
The discussion below describes the most important terms of our capital stock, certificate of incorporation and bylaws as will be in effect upon completion of this offering. Because it is only a summary, it does not contain all the information that may be important to you. For a complete description refer to our certificate of incorporation and bylaws, copies of which have been filed as exhibits to the registration statement of which the prospectus is a part.
Common Stock
Voting Rights. The holders of our common stock will be entitled to one vote per share on all matters submitted for action by the stockholders. There will be no provision for cumulative voting with respect to the election of directors. Accordingly, a holder of more than 50% of the shares of our common stock will be able to, if it so chooses, elect all of our directors. In that event, the holders of the remaining shares will not be able to elect any directors.
Dividend Rights. All shares of our common stock will be entitled to share equally in any dividends our board of directors may declare from legally available sources, subject to the terms of any outstanding preferred stock. Our senior secured credit facilities and other debt instruments may impose restrictions on our ability to declare dividends with respect to our common stock.
Liquidation Rights. Upon liquidation or dissolution of our company, whether voluntary or involuntary, all shares of our common stock will be entitled to share equally in the assets available for distribution to stockholders after payment of all of our prior obligations, including any then-outstanding preferred stock.
Registration Rights. Under the terms of the Registration Rights Agreements that we intend to enter into, we will agree to register shares of our common stock owned by certain stockholders under certain circumstances. See “Certain Relationships and Related Party Transactions—Registration Rights Agreements” for more detail regarding these registration rights.
Other Matters. The holders of our common stock will have no preemptive or conversion rights, and our common stock will not be subject to further calls or assessments by us. There are no redemption or sinking fund provisions applicable to our common stock.
Preferred Stock
Our board of directors, without further stockholder approval, will be able to issue, from time to time, up to an aggregate of shares of preferred stock in one or more series and to fix or alter the designations, preferences, rights and any qualifications, limitations or restrictions of the shares of each such series thereof, including the dividend rights, dividend rates, conversion rights, voting rights, terms of redemption (including sinking fund provisions), redemption prices, liquidation preferences and the number of shares constituting any series or designations of such series. Our board of directors may authorize the issuance of preferred stock with voting or conversion rights that could adversely affect the voting power or other rights of the holders of common stock. The issuance of preferred stock, while providing flexibility in connection with possible future financings and acquisitions and other corporate purposes could, under certain circumstances, have the effect of delaying, deferring or preventing a change in control of us and might affect the market price of our common stock. See “—Certain Anti-Takeover, Limited Liability and Indemnification Provisions.”
148
Table of Contents
Certain Anti-Takeover, Limited Liability and Indemnification Provisions
We are governed by the Delaware General Corporation Law (the “DGCL”). Our certificate of incorporation and bylaws will contain provisions that could make more difficult the acquisition of us by means of a tender offer, a proxy contest or otherwise, or to remove or replace our current management.
“Blank Check” Preferred Stock. Our certificate of incorporation will authorize the issuance of “blank check” preferred stock that could be issued by our board of directors to increase the number of outstanding shares or establish a stockholders rights plan making a takeover more difficult and expensive.
Classified Board. Our board of directors will be divided into three classes. The members of each class will serve staggered, three-year terms (other than with respect to the initial terms of the Class I and Class II directors, which will be one and two years, respectively). Upon the expiration of the term of a class of directors, directors in that class will be elected for three-year terms at the annual meeting of stockholders in the year in which their term expires. See “Management—Composition of Board of Directors.”
Removal of Directors; Vacancies. Our stockholders will be able to remove directors only for cause upon the affirmative vote of the holders of a majority of the outstanding shares of our capital stock entitled to vote in the election of directors. Vacancies on our board of directors may be filled only by a majority of our board of directors. Until Apollo no longer beneficially owns at least 50.1% of our outstanding common stock, certain vacancies caused by an increase in the size of the board of directors must be filled by the directors nominated by Apollo Management then in office. In addition, until Apollo no longer owns at least 33 1/3% of our outstanding common stock, the removal of a director nominated by Apollo Management must be filled by the directors nominated by Apollo Management then in office. See “Certain Relationships and Related Party Transactions—Nominating Agreement.”
No Cumulative Voting. Our certificate of incorporation will provide that stockholders do not have the right to cumulative votes in the election of directors.
No Stockholder Action by Written Consent; Calling of Special Meetings of Stockholders. Our certificate of incorporation will not permit stockholder action without a meeting by consent if less than 50.1% of our outstanding common stock is beneficially owned by Apollo. It also will provide that if less than 50.1% of our outstanding common stock is beneficially owned by Apollo, special meetings of our stockholders may be called only by our board of directors or the chairman of the board of directors.
Advance Notice Requirements for Stockholder Proposals and Director Nominations. Our bylaws will provide that stockholders seeking to bring business before an annual meeting of stockholders, or to nominate candidates for election as directors at an annual meeting of stockholders, must provide timely notice thereof in writing. To be timely, a stockholder’s notice generally must be delivered to and received at our principal executive offices not less than 120 days nor more than 150 days prior to the first anniversary of the preceding year’s annual meeting; provided, that in the event that the date of such meeting is advanced more than 30 days prior to, or delayed by more than 70 days after, the anniversary of the preceding year’s annual meeting of our stockholders, a stockholder’s notice to be timely must be so delivered not earlier than the close of business on the 150th day prior to such meeting and not later than the close of business on the later of the 120th day prior to such meeting or the 10th day following the day on which public announcement of the date of such meeting is first made. Our bylaws also specify certain requirements as to the form and content of a stockholder’s notice. These provisions may preclude stockholders from bringing matters before an annual meeting of stockholders or from making nominations for directors at an annual meeting of stockholders. These provisions generally do not apply to nominations of directors by Apollo.
Board of Directors. If Apollo or its affiliates beneficially own at least 50.1% of our common stock, Apollo Management will have the right to require the board of directors to be expanded and the directors nominated by Apollo Management then in office will have the right to nominate directors to fill these vacant seats. See “Certain Relationships and Related Party Transactions—Nominating Agreement.”
149
Table of Contents
Apollo Approval Rights. Until such time as Apollo no longer beneficially owns at least 33 1/3% of the total number of shares of our common stock outstanding at any time, the approval of a majority of a quorum of the members of our board of directors, which must include the approval of the majority of the directors nominated by Apollo Management voting on the matter, will be required for a consolidation or merger with or into any other entity, or a transfer (by lease, assignment, sale or otherwise) of all or substantially all of our assets to another entity and other business combinations and to approve certain other matters. See “Management—Apollo Approval of Certain Matters and Rights to Nominate Certain Directors.”
Delaware Takeover Statute. Our certificate of incorporation provides that we are not governed by Section 203 of the DGCL which, in the absence of such provisions, would have imposed additional requirements regarding mergers and other business combinations.
Limitation of Officer and Director Liability and Indemnification Arrangements. Our certificate of incorporation limits the liability of our officers and directors to the maximum extent permitted by Delaware law. Delaware law provides that directors will not be personally liable for monetary damages for breach of their fiduciary duties as directors, except liability for:
| • | any breach of their duty of loyalty to the corporation or its stockholders; |
| • | acts or omissions not in good faith or which involve intentional misconduct or a knowing violation of law; |
| • | unlawful payments of dividends or unlawful stock repurchases or redemptions; or |
| • | any transaction from which the director derived an improper personal benefit. |
This certificate of incorporation provision has no effect on any non-monetary remedies that may be available to us or our stockholders, nor does it relieve us or our officers or directors from compliance with federal or state securities laws. The certificate and bylaws also generally provide that we shall indemnify, to the fullest extent permitted by law, any person who was or is a party or is threatened to be made a party to any threatened, pending or completed action, suit, investigation, administrative hearing or any other proceeding by reason of the fact that he is or was a director or officer of ours, or is or was serving at our request as a director, officer, employee or agent of another entity, against expenses incurred by him in connection with such proceeding. An officer or director shall not be entitled to indemnification by us if:
| • | the officer or director did not act in good faith and in a manner reasonably believed to be in, or not opposed to, our best interests; or |
| • | with respect to any criminal action or proceeding, the officer or director had reasonable cause to believe his conduct was unlawful. |
We currently maintain liability insurance for our directors and officers. In addition, certain of our directors are also insured under Apollo’s professional liability insurance policies and may be indemnified under Apollo’s bylaws or other constitutive documents.
Our certificate of incorporation and bylaw provisions and provisions of Delaware law may have the effect of delaying, deterring or preventing a change in control of CKE.
As permitted by the DGCL, our certificate of incorporation and bylaws provide that:
| • | we will indemnify our current and former directors and officers and anyone who is or was serving at our request as the director or officer of, or our legal representative in, another entity, and may indemnify our current or former employees and other agents, to the fullest extent permitted by the DGCL, subject to limited exceptions; and |
| • | we may purchase and maintain insurance on behalf of our current or former directors, officers, employees or agents against any liability asserted against them and incurred by them in any such capacity, or arising out of their status as such. |
150
Table of Contents
Our certificate of incorporation will require us to advance expenses to our directors and officers in connection with a legal proceeding, subject to receiving an undertaking from such director or officer to repay advanced amounts if it is determined he or she is not entitled to indemnification. Our bylaws will provide that we may advance expenses to our employees and other agents, upon such terms and conditions, if any, as we deem appropriate.
We intend to enter into separate indemnification agreements with each of our directors and executive officers, which may be broader than the specific indemnification provisions contained in the DGCL. These indemnification agreements may require us, among other things, to indemnify our directors and officers against liabilities that may arise by reason of their status or service as directors or officers, other than liabilities arising from willful misconduct. These indemnification agreements may also require us to advance any expenses incurred by the directors or officers as a result of any proceeding against them as to which they could be indemnified and to obtain directors’ and officers’ insurance, if available on reasonable terms.
Currently, to our knowledge, there is no pending litigation or proceeding involving any of our directors, officers, employees or agents in which indemnification by us is sought, nor are we aware of any threatened litigation or proceeding that may result in a claim for indemnification.
Insofar as indemnification for liabilities arising under the Securities Act may be permitted for our directors, officers and controlling persons under the foregoing provisions or otherwise, we have been informed that, in the opinion of the SEC, such indemnification is against public policy as expressed in the Securities Act and is, therefore, unenforceable.
Corporate Opportunity
Our certificate of incorporation will provide that we expressly renounce any interest or expectancy in any business opportunity, transaction or other matter in which Apollo Management or any of its members, directors, employees or other affiliates (the “Apollo Group”) participates or desires or seeks to participate in, even if the opportunity is one that we would reasonably be deemed to have pursued if given the opportunity to do so. The renouncement does not apply to any business opportunities that are presented to an Apollo Group member solely in such person’s capacity as a member of our board of directors and with respect to which no other member of the Apollo Group independently receives notice or otherwise identifies such business opportunity prior to us becoming aware of it, or if the business opportunity is initially identified by the Apollo Group solely through the disclosure of information by or on behalf of us.
Forum Selection
Our certificate of incorporation will provide that unless we consent in writing to the selection of an alternative forum, the Court of Chancery of the State of Delaware shall be the sole and exclusive forum for any derivative action or proceeding brought on our behalf, any action asserting a claim of breach of a fiduciary duty owed by any director, officer, employee or agent of ours to us or to our stockholders, any action asserting a claim arising pursuant to any provision of the DGCL, or any action asserting a claim governed by the internal affairs doctrine, in each such case subject to the Court of Chancery having personal jurisdiction over the indispensable parties named as defendants therein. Any person or entity purchasing or otherwise acquiring any interest in our capital stock will be deemed to have notice of and consent to this forum selection provision.
Transfer Agent and Registrar
is the transfer agent and registrar for our common stock.
Listing
We intend to apply to list the common stock on the New York Stock Exchange under the symbol “CK.”
151
Table of Contents
We summarize below the principal terms of the agreements that govern certain of our existing indebtedness. This summary is not a complete description of all of the terms of the agreements and we urge you to read the entirety of the agreements that govern our indebtedness because it is those agreements in their entirety and not these summaries that govern our indebtedness.
Credit Facility
Our Credit Facility provides for senior secured revolving facility loans, swingline loans and letters of credit, in an aggregate amount of up to $100.0 million. The Credit Facility bears interest at a rate equal to, at our option, either: (1) the higher of Morgan Stanley’s “prime rate” plus 2.75% or the federal funds rate, as defined in our Credit Facility, plus 3.25%, or (2) the LIBOR plus 3.75%. The Credit Facility matures on July 12, 2015, at which time all outstanding revolving facility loans and accrued and unpaid interest must be repaid. As of May 21, 2012, we had no outstanding loan borrowings, $30.9 million of outstanding letters of credit, and remaining availability of $69.1 million under our Credit Facility.
All obligations under the Credit Facility are unconditionally guaranteed by CKE and by CKE Restaurants’ existing and future wholly-owned domestic subsidiaries. In addition, all obligations are secured by CKE Restaurants’ common stock, substantially all of CKE Restaurants’ material owned assets and substantially all of the material owned assets of the subsidiary guarantors.
Pursuant to the terms of our Credit Facility, during each fiscal year, the capital expenditures of CKE Restaurants and its consolidated subsidiaries cannot exceed the sum of (1) the greater of (i) $100.0 million and (ii) 8.5% of CKE Restaurants’ consolidated gross total tangible assets as of the end of such fiscal year plus, without duplication, (2) 10% of certain assets acquired in permitted acquisitions during such fiscal year (the “Acquired Assets Amount”) and (3) 5% of the Acquired Assets Amount for the preceding fiscal year, calculated on a cumulative basis. In addition, the annual base amount of permitted capital expenditures may be increased by an amount equal to any cumulative credit (as defined in the Credit Facility) which we elect to apply for this purpose and may be carried-back and/or carried-forward subject to the terms set forth in the Credit Facility.
The Credit Facility contains covenants that restrict the ability of CKE Restaurants and its consolidated subsidiaries to: incur additional indebtedness; pay dividends on its capital stock or redeem, repurchase or retire its capital stock or indebtedness; make investments, loans, advances and acquisitions; create restrictions on the payment of dividends or other amounts to us from our subsidiaries; sell assets, including capital stock of our subsidiaries; consolidate or merge; create liens; enter into sale and leaseback transactions; amend, modify or permit the amendment or modification of any senior secured second lien note documents; engage in certain transactions with our affiliates; issue capital stock; create subsidiaries; and change the business conducted by CKE Restaurants or its subsidiaries.
The terms of our Credit Facility also include financial performance covenants applicable to CKE Restaurants and its consolidated subsidiaries, which include a maximum secured leverage ratio and a specified minimum interest coverage ratio. Our Credit Facility defines CKE Restaurants’ consolidated secured leverage ratio as the ratio of its: (1) Total Secured Debt plus eight times Net Rent less Unrestricted Cash and Permitted Investments; over (2) Adjusted EBITDAR, each as defined in our Credit Facility. In determining CKE Restaurants’ consolidated Total Secured Debt for the purpose of these financial covenants, we include the Senior Secured Notes and its other long-term secured debt, capital lease obligations and the portion of the proceeds from financing method sale-leaseback transactions equal to the net book value of the associated properties. As of May 21, 2012, the net book value of the assets associated with financing method sale-leaseback transactions was $71.6 million. See “—Sale-Leaseback Transactions” below and Note 5 of Notes to Condensed Consolidated Financial Statements included elsewhere in this prospectus for further discussion of these sale-leaseback transactions. Our Credit Facility defines CKE Restaurants’ consolidated interest coverage ratio as the ratio of its Adjusted
152
Table of Contents
EBITDA to its Cash Interest Expense, each as defined in our Credit Facility. As of May 21, 2012, these financial performance covenants did not limit our ability to draw on the remaining availability of $69.1 million under our Credit Facility.
We are currently in compliance with the covenants of our Credit Facility.
The terms of our Credit Facility are not impacted by any changes in our credit rating. We believe the key company-specific factors affecting our ability to maintain our existing debt financing relationships and to access such capital in the future are our present and expected levels of profitability, cash flows from operations, capital expenditures, asset collateral bases and the level of our Adjusted EBITDA relative to our debt obligations. In addition, as noted above, our Credit Facility includes significant restrictions on future financings including, among others, limits on the amount of indebtedness CKE Restaurants and its consolidated subsidiaries may incur or which may be secured by any of the assets of CKE Restaurants and its consolidated subsidiaries.
Senior Secured Second Lien Notes
In connection with the Merger, on July 12, 2010, CKE Restaurants issued $600.0 million aggregate principal amount of the Senior Secured Notes in a private placement to qualified institutional buyers. These Senior Secured Notes were exchanged in December 2010 for substantially identical Senior Secured Notes that were registered with the SEC. The Senior Secured Notes are guaranteed by each domestic subsidiary of CKE Restaurants and are secured by a second priority lien on all assets of CKE Restaurants and its subsidiaries that secure the Credit Facility. During fiscal 2012, we extinguished through redemptions (in accordance with the terms of the indenture governing the Senior Secured Notes) and an open market purchase a total of $67.9 million of the principal amount of the Senior Secured Notes for cash payments of $69.7 million, plus $1.3 million of accrued and unpaid interest. As of May 21, 2012, the aggregate principal amount of the Senior Secured Notes outstanding was $532.1 million. The Senior Secured Notes bear interest at a rate of 11.375% per annum, payable semi-annually in arrears on January 15 and July 15. As of May 21, 2012, the carrying value of the Senior Secured Notes was $523.5 million, which is presented net of the remaining unamortized original issue discount of $8.6 million. The Senior Secured Notes mature on July 15, 2018.
The indenture governing the Senior Secured Notes contains restrictive covenants that limit CKE Restaurants’ and its guarantor subsidiaries’ ability to, among other things: incur or guarantee additional debt or issue certain preferred equity; pay dividends, make capital stock distributions or other restricted payments; make certain investments; sell certain assets; create or incur liens on certain assets to secure debt; consolidate, merge, sell or otherwise dispose of all or substantially all of their assets; enter into certain transactions with affiliates; and designate subsidiaries as unrestricted subsidiaries. Failure to comply with these covenants constitutes a default and may lead to the acceleration of the principal amount and accrued but unpaid interest on the Senior Secured Notes.
We are currently in compliance with the covenants included in the indenture governing Senior Secured Notes.
On June 15, 2012, the holders of the Senior Secured Notes were notified that we will redeem $60.0 million aggregate principal amount of Senior Secured Notes outstanding on July 16, 2012, at a redemption price of 103% of the principal amount of the Senior Secured Notes being redeemed, pursuant to the terms of the indenture governing the Senior Secured Notes.
Additionally, in accordance with the indenture governing the Senior Secured Notes, we are required to make offers to repurchase a portion of the Senior Secured Notes at a price of 103% of the principal amount of the Senior Secured Notes with a portion of the net proceeds received from sale-leaseback transactions. Pursuant to these requirements, on December 1, 2011, we commenced a tender offer to purchase up to $27.9 million of the principal amount of the Senior Secured Notes, which tender offer expired on December 29, 2011, with no Senior
153
Table of Contents
Secured Notes tendered. As a result of further sale-leaseback transactions completed since the December 2011 tender offer and expected to be completed during the second quarter of fiscal 2013, we expect we will be required to commence a second tender offer to purchase Senior Secured Notes. However, this requirement is dependent upon the completion of future sale-leaseback transactions, which may or may not be completed.
We may make further redemptions of the Senior Secured Notes prior to the maturity date in the following circumstances: (1) on or prior to July 15, 2013, we may redeem up to 35% of the original aggregate principal amount of the Senior Secured Notes (provided at least 65% of the original aggregate principal amount of the Senior Secured Notes remains outstanding after such redemption) with the proceeds of certain equity offerings, including this offering, at a redemption price of 111.375% of the aggregate principal amount of the Senior Secured Notes being redeemed plus accrued and unpaid interest, (2) during the 12-month period beginning July 15, 2013, we may elect to redeem up to $60.0 million of the aggregate principal amount of the Senior Secured Notes at a redemption price of 103% of the aggregate principal amount of the Senior Secured Notes being redeemed plus accrued and unpaid interest, (3) on or after July 15, 2014, we may redeem all or any portion of the Senior Secured Notes during the 12-month periods commencing July 15, 2014, July 15, 2015, July 15, 2016 and July 15, 2017 and thereafter at redemption prices of 105.688%, 102.844%, 101.422% and 100%, respectively, of the aggregate principal amount of the Senior Secured Notes being redeemed plus accrued and unpaid interest, and (4) prior to July 15, 2014, we may redeem all or any portion of the Senior Secured Notes at a price equal to 100% of the aggregate principal amount of the Senior Secured Notes being redeemed plus a make-whole premium and accrued and unpaid interest. Upon a change in control, the holders of the Senior Secured Notes each have the right to require us to redeem their Senior Secured Notes at a redemption price of 101% of the aggregate principal amount of the Senior Secured Notes being redeemed plus accrued and unpaid interest.
Senior Unsecured PIK Toggle Notes
On March 14, 2011, CKE issued $200.0 million aggregate principal amount of the Toggle Notes. The net proceeds, after payment of offering expenses, were distributed to our corporate parent. The Toggle Notes were issued with an original issue discount of 1.885%, or $3.8 million. The interest on the Toggle Notes, which is payable semi-annually on March 15 and September 15 of each year, can, at CKE’s option, be paid (1) entirely in cash, at a rate of 10.50% (“Cash Interest”), (2) entirely by increasing the principal amount of the Toggle Notes or by issuing new Toggle Notes for the entire amount of the interest payment, at a rate per annum equal to the cash interest rate of 10.50% plus 0.75% (“PIK Interest”) or (3) with a 25%/75%, 50%/50% or 75%/25% combination of Cash Interest and PIK Interest. The Toggle Notes (and PIK Interest thereon) mature on March 14, 2016.
During the sixteen weeks ended May 21, 2012 and fiscal 2012, we made our March 15, 2012 and September 15, 2011 interest payments on the Toggle Notes, each in the amount of $11.3 million entirely in PIK Interest. We have also elected to pay the September 15, 2012, interest payment entirely in PIK Interest. In addition, CKE Restaurants purchased, in open market transactions, a total of $9.9 million principal amount of the Toggle Notes (the “Purchased Toggle Notes”) for $8.4 million during fiscal 2012. For accounting purposes, the Purchased Toggle Notes were constructively retired at the time of purchase. As of May 21, 2012, the aggregate principal amount of the Toggle Notes outstanding was $212.7 million.
The indenture governing the Toggle Notes contains restrictive covenants that limit our and our subsidiaries’ ability to, among other things: incur or guarantee additional debt or issue certain preferred equity; pay dividends, make capital distributions or other restricted payments; make certain investments; sell certain assets; create or incur liens on certain assets to secure debt; consolidate, merge, sell or otherwise dispose of all or substantially all of our assets; enter into certain transactions with affiliates; and designate subsidiaries as unrestricted subsidiaries. Failure to comply with these covenants constitutes a default and may lead to acceleration of the principal amount and accrued but unpaid interest on the Toggle Notes.
We are currently in compliance with the covenants included in the indenture governing the Toggle Notes.
154
Table of Contents
We may redeem the Toggle Notes prior to the maturity date in the following circumstances: (1) prior to March 14, 2013, we may redeem up to 35% of the original aggregate principal amount of the Toggle Notes with the proceeds of certain equity offerings, including this offering, at a redemption price of 110.500% of the aggregate principal amount of the Toggle Notes being redeemed plus accrued and unpaid interest, (2) on or after March 14, 2013, we may redeem all or a portion of the Toggle Notes during the 12-month periods commencing March 14, 2013, March 14, 2014 and March 14, 2015 and thereafter at redemption prices of 105.250%, 102.625%, and 100%, respectively, of the aggregate principal amount of the Toggle Notes being redeemed plus accrued and unpaid interest, and (3) prior to March 14, 2013, we may redeem all or a portion of the Toggle Notes at a price equal to 100% of the aggregate principal amount of the Toggle Notes being redeemed plus a make-whole premium and accrued and unpaid interest. Upon a change of control, the holders of the Toggle Notes have the right to require us to redeem their Toggle Notes at a redemption price of 101% of the aggregate principal amount of the Toggle Notes being purchased plus accrued and unpaid interest.
Sale-Leaseback Transactions
During the sixteen weeks ended May 21, 2012 and fiscal 2012, we entered into agreements with independent third parties under which we sold and leased back 20 and 47 restaurant properties, respectively. The initial minimum lease terms are 20 years, and the leases include renewal options and right of first offer provisions that, for accounting purposes, constitute continuing involvement with the associated restaurant properties. Due to this continuing involvement, these sale-leaseback transactions are accounted for under the financing method, rather than as completed sales. Under the financing method, we include the sales proceeds received in other long-term liabilities until our continuing involvement with the properties is terminated, report the associated property as owned assets, continue to depreciate the assets over their remaining useful lives, and record the rental payments as interest expense. Closing costs and other fees related to these sale-leaseback transactions are recorded as deferred financing costs and amortized to interest expense over the initial minimum lease term. When and if our continuing involvement with a property terminates and the sale of that property is recognized for accounting purposes, we expect to record a gain equal to the excess of the proceeds received over the remaining net book value of the associated restaurant property and any unamortized deferred financing costs.
During the sixteen weeks ended May 21, 2012 and fiscal 2012, we received proceeds of $29.9 million and $67.5 million, respectively, in connection with these transactions. The cumulative proceeds received in connection with financing method sale-leaseback transactions of $97.4 million and $67.5 million are included in other long-term liabilities in our Condensed Consolidated Balance Sheets as of May 21, 2012 and January 31, 2012, respectively. The net book value of the associated assets, which is included in property and equipment, net of accumulated depreciation and amortization in our Condensed Consolidated Balance Sheets, was $71.6 million and $48.7 million, respectively, as of May 21, 2012 and January 31, 2012.
We expect that we will sell and leaseback additional restaurant properties in the future; however, there can be no assurance as to the number of transactions we will be able to complete, the amount of proceeds we will generate or whether we will be able to complete additional sale-leaseback transactions at all. See Note 5 of Notes to Condensed Consolidated Financial Statements included elsewhere in this prospectus for further discussion.
155
Table of Contents
SHARES ELIGIBLE FOR FUTURE SALE
Prior to this offering, there has been no public market for our common stock, and no predictions can be made about the effect, if any, that market sales of shares of our common stock or the availability of such shares for sale will have on the market price prevailing from time to time. Nevertheless, the actual sale of, or the perceived potential for the sale of, our common stock in the public market may have an adverse effect on the market price for our common stock and could impair our ability to raise capital through future sales of our securities. See “Risk Factors—Risks Related to This Offering—Future sales or the possibility of future sales of a substantial amount of our common stock may depress the price of shares of our common stock.”
Sale of Restricted Shares
Upon completion of this offering, we will have an aggregate of shares of our common stock outstanding. Of these shares, the shares of our common stock to be sold in this offering will be freely tradable without restriction or further registration under the Securities Act, except for any shares which may be acquired by any of our “affiliates” as that term is defined in Rule 144 under the Securities Act, which will be subject to the resale limitations of Rule 144. The remaining shares of our common stock outstanding will be restricted securities, as that term is defined in Rule 144, and may in the future be sold pursuant to an effective registration statement or under the Securities Act to the extent permitted by Rule 144 or any other available exemption under the Securities Act.
Stock Incentive Plan
Following the completion of this offering, we intend to file a registration statement on Form S-8 under the Securities Act with the SEC to register shares of our common stock issued or reserved for issuance under our Stock Incentive Plan. Subject to the expiration of any lock-up restrictions as described below and following the completion of any vesting periods, shares of our common stock issued under the Stock Incentive Plan, issuable upon the exercise of options granted or to be granted under the plan, will be freely tradable without restriction under the Securities Act, unless such shares are held by any of our affiliates.
Lock-up Agreements
Executive officers, directors and our stockholder have agreed not to sell or transfer any shares of our common stock for a period of days from the date of this prospectus, subject to certain exceptions. See “Underwriting—No Sales of Similar Securities” for a description of these lock-up provisions.
Rule 144
In general, under Rule 144 under the Securities Act, a person who is not deemed to have been an affiliate of ours at any time during the three months preceding a sale, and who has beneficially owned restricted securities within the meaning of Rule 144 for at least six months (including any period of consecutive ownership of preceding non-affiliated holders) would be entitled to sell those shares, subject only to the availability of current public information about us. A non-affiliated person who has beneficially owned restricted securities within the meaning of Rule 144 for at least one year would be entitled to sell those shares without regard to the provisions of Rule 144.
All of our outstanding common stock before this offering is held by an affiliate. A person who is deemed to be an affiliate of ours and who has beneficially owned restricted securities within the meaning of Rule 144 for at least six months would be entitled to sell within any three-month period a number of shares (when aggregated with sales by certain related parties) that does not exceed the greater of one percent of the then outstanding shares of our common stock ( shares following this offering) or the average weekly trading volume of our
156
Table of Contents
common stock reported through the New York Stock Exchange during the four calendar weeks preceding such sale. Such sales are also subject to certain manner of sale provisions, notice requirements and the availability of current public information about us.
Registration Rights
Pursuant to the Registration Rights Agreements we intend to enter into, we will grant certain direct and indirect stockholders, demand registration rights and/or incidental registration rights, in each case, with respect to certain shares of common stock owned by them. See “Certain Relationships and Related Party Transactions—Registration Rights Agreement.”
157
Table of Contents
MATERIAL UNITED STATES FEDERAL INCOME TAX CONSIDERATIONS
FOR NON-U.S. HOLDERS OF COMMON STOCK
The following is a general discussion of certain material U.S. federal income tax considerations with respect to the acquisition, ownership and disposition of our common stock applicable to non-U.S. holders (as defined below) who purchase our common stock pursuant to this offering. This discussion is based on current provisions of the Internal Revenue Code of 1986, as amended (the “Code”), existing and proposed U.S. Treasury regulations promulgated thereunder, and administrative rulings and court decisions in effect as of the date hereof, all of which are subject to change at any time, possibly with retroactive effect. No ruling has been or will be sought from the Internal Revenue Service, or IRS, with respect to the matters discussed below, and there can be no assurance the IRS will not take a contrary position regarding the tax consequences of the acquisition, ownership or disposition of our common stock, or that any such contrary position would not be sustained by a court.
For the purposes of this discussion, the term “non-U.S. holder” means a beneficial owner of our common stock that is not for U.S. federal income tax purposes any of the following:
| • | an individual who is a citizen or resident of the United States; |
| • | a corporation, or other entity treated as a corporation for U.S. federal income tax purposes, or a partnership (or any entity treated as a partnership for U.S. federal income tax purposes), created or organized in or under the laws of the United States, any state thereof or the District of Columbia; |
| • | an estate, the income of which is includible in gross income for U.S. federal income tax purposes regardless of its source; or |
| • | a trust if (1) a court within the United States is able to exercise primary supervision over the administration of the trust and one or more U.S. persons have the authority to control all substantial decisions of the trust, or (2) it has a valid election in effect under applicable U.S. Treasury regulations to be treated as a U.S. person. |
It is assumed in this discussion that a non-U.S. holder holds shares of our common stock as a capital asset within the meaning of Section 1221 of the Code (generally, property held for investment). This discussion does not address all aspects of U.S. federal income taxation that may be important to a non-U.S. holder in light of such holder’s particular circumstances or that may be applicable to holders subject to special treatment under U.S. federal income tax laws (including, for example, financial institutions, dealers in securities, traders in securities that elect mark-to-market treatment, insurance companies, tax-exempt entities, holders who acquired our common stock pursuant to the exercise of employee stock options or otherwise as compensation, controlled foreign corporations, passive foreign investment companies, entities or arrangements treated as partnerships for U.S. federal income tax purposes, holders subject to the alternative minimum tax, certain former citizens or former long-term residents of the United States, holders deemed to sell our common stock under the constructive sale provisions of the Code and holders who hold our common stock as part of a straddle, hedge, synthetic security, constructive sale or conversion transaction). In addition, except to the extent provided below, this discussion does not address U.S. federal tax laws other than those pertaining to the U.S. federal income tax, nor does it address any aspects of U.S. state, local or non-U.S. taxes. Accordingly, prospective investors are encouraged to consult with their own tax advisors regarding the U.S. federal, state, local, non-U.S. income and other tax considerations of acquiring, holding and disposing of shares of our common stock.
If an entity or arrangement treated as a partnership for U.S. federal income tax purposes holds shares of our common stock, the tax treatment of a partner generally will depend on the status of the partner and the activities of the partnership. Partnerships holding our common stock and partners in such partnerships are urged to consult their tax advisors as to the particular U.S. federal income tax consequences of acquiring, holding and disposing of our common stock.
158
Table of Contents
THIS SUMMARY IS NOT INTENDED TO CONSTITUTE A COMPLETE DESCRIPTION OF ALL TAX CONSEQUENCES RELATING TO THE ACQUISITION, OWNERSHIP AND DISPOSITION OF OUR COMMON STOCK. HOLDERS OF OUR COMMON STOCK ARE ENCOURAGED TO CONSULT WITH THEIR TAX ADVISORS REGARDING THE TAX CONSEQUENCES TO THEM (INCLUDING THE APPLICATION AND EFFECT OF ANY STATE, LOCAL, NON-U.S. INCOME AND OTHER TAX LAWS) OF THE ACQUISITION, OWNERSHIP AND DISPOSITION OF OUR COMMON STOCK.
Information Reporting and Backup Withholding
As discussed above, we currently have no plans to pay regular dividends on our common stock. In the event that we do pay dividends, generally we must report annually to the Internal Revenue Service (the “IRS”) and to each non-U.S. holder the amount of dividends paid to, and the tax withheld with respect to, each non-U.S. holder. These reporting requirements apply regardless of whether withholding was reduced or eliminated. Copies of this information also may be made available under the provisions of a specific treaty or agreement with the tax authorities in the country in which the non-U.S. holder resides or is established.
U.S. backup withholding (currently at a rate of 28%, but scheduled to increase to 31% commencing in 2013) is imposed on certain payments to persons that fail to furnish the information required under the U.S. information reporting requirements. Dividends paid to a non-U.S. holder of our common stock generally will be exempt from backup withholding if the non-U.S. holder provides to us or our paying agent a properly executed IRS Form W-8BEN or W-8ECI (as applicable) or otherwise establishes an exemption.
Under U.S. Treasury regulations, the payment of proceeds from the disposition of our common stock by a non-U.S. holder effected at a U.S. office of a broker generally will be subject to information reporting and backup withholding, unless the beneficial owner, under penalties of perjury, certifies, among other things, its status as a non-U.S. holder or otherwise establishes an exemption. The certification procedures described in the above paragraph will satisfy these certification requirements as well. The payment of proceeds from the disposition of our common stock by a non-U.S. holder effected at a non-U.S. office of a broker generally will not be subject to backup withholding and information reporting, except that information reporting (but generally not backup withholding) may apply to payments if the broker is:
| • | a U.S. person; |
| • | a “controlled foreign corporation” for U.S. federal income tax purposes; |
| • | a foreign person, 50% or more of whose gross income from certain periods is effectively connected with a U.S. trade or business; or |
| • | a foreign partnership if at any time during its tax year (a) one or more of its partners are U.S. persons who, in the aggregate, hold more than 50% of the income or capital interests of the partnership or (b) the foreign partnership is engaged in a U.S. trade or business. |
Backup withholding is not an additional tax. Any amounts withheld under the backup withholding rules from a payment to a non-U.S. holder can be credited against the non-U.S. holder’s U.S. federal income tax liability, if any, and any excess refunded, provided that the required information is furnished to the IRS in a timely manner.
Recent Legislation Relating to Foreign Accounts
Recently enacted rules require the reporting to the IRS of direct and indirect ownership of foreign financial accounts and certain foreign entities by U.S. persons. Failure to provide this required information can result in a thirty percent (30%) withholding tax on certain payments made after December 31, 2012 (subject to certain transition rules), including U.S.-source dividends and gross proceeds from the sale or other disposition of stock issued by U.S. persons such as the Company. The new withholding tax will apply even if the payment would otherwise not be subject to U.S. nonresident withholding tax (e.g., because it is capital gain treated as foreign source income under the Code).
159
Table of Contents
Although these rules currently apply to applicable payments made after December 31, 2012, IRS guidance issued in 2011 provides that regulations implementing this legislation will defer this withholding obligation until January 1, 2014 for payments of interest and dividends and until January 1, 2015 for gross proceeds from dispositions of stock and debt. Recently proposed Treasury regulations elaborate on, and in certain cases modify the application of, these rules. Because the IRS has not yet issued final regulations with respect to these new rules, their scope remains unclear and potentially subject to material change. Prospective Non-U.S. Holders are encouraged to consult their tax advisors regarding this new reporting and withholding regime in light of their particular circumstances.
Dividends
As discussed above, we currently have no plans to make distributions of cash or other property on our common stock. In the event that we do make distributions of cash or other property on our common stock, generally such distributions will constitute dividends for U.S. federal income tax purposes to the extent paid from current and accumulated earnings and profits, as determined for U.S. federal income tax purposes. Amounts not treated as dividends for U.S. federal income tax purposes will constitute a return of capital and will first reduce a non-U.S. holder’s adjusted basis in our common stock, but not below zero. Any excess will be treated as capital gain from the sale of our common stock in the manner described under “Gain on Sale or Other Disposition of Our Common Stock” below.
In general, dividends, if any, paid by us to a non-U.S. holder will be subject to U.S. withholding tax at a rate of 30% of the gross amount (or a reduced rate prescribed by an applicable income tax treaty) unless the dividends are effectively connected with a trade or business carried on by the non-U.S. holder within the United States and, if required by an applicable income tax treaty, are attributable to a permanent establishment of the non-U.S. holder within the United States. Dividends effectively connected with this U.S. trade or business, and, if required by an applicable income tax treaty, attributable to such a permanent establishment of a non-U.S. holder, generally will not be subject to U.S. withholding tax if the non-U.S. holder provides us or our paying agent with certain forms, including IRS Form W-8ECI (or any successor form), and generally will be subject to U.S. federal income tax on a net income basis, in the same manner as if the non-U.S. holder were a U.S. person. A non-U.S. holder that is a corporation and receives effectively connected dividends may also be subject to an additional “branch profits tax” imposed at a 30% rate (or lower treaty rate).
Under applicable U.S. Treasury regulations, a non-U.S. holder is required to satisfy certain certification requirements in order to claim a reduced rate of withholding pursuant to an applicable income tax treaty (including providing us or our paying agent with an IRS Form W-8BEN certifying such non-U.S. holder’s entitlement to benefits under a treaty). Non-U.S. holders that do not timely provide the required certification, but that qualify for a reduced treaty rate, may obtain a refund of any excess amounts withheld by timely filing an appropriate claim for refund with the IRS. Non-U.S. holders should consult their tax advisors regarding their entitlement to benefits under an applicable income tax treaty.
Gain on Sale or Other Disposition of Our Common Stock
In general, a non-U.S. holder will not be subject to U.S. federal income tax on any gain realized upon the sale or other disposition of our common stock unless:
| • | the gain is effectively connected with a trade or business carried on by the non-U.S. holder within the United States (in which case the branch profits tax discussed above may also apply if the non-U.S. holder is a corporation) and, if required by an applicable income tax treaty, the gain is attributable to a permanent establishment of the non-U.S. holder maintained in the United States; |
| • | the non-U.S. holder is an individual and is present in the United States for 183 days or more in the taxable year of disposition and certain other conditions are satisfied; or |
160
Table of Contents
| • | we are or have been a U.S. real property holding corporation (a “USRPHC”) for U.S. federal income tax purposes at any time within the shorter of the five-year period preceding the disposition and the non-U.S. holder’s holding period. |
Gain described in the first bullet point above will be subject to U.S. federal income tax on a net income basis at the regular graduated U.S. federal income tax rates in much the same manner as if such holder were a resident of the United States. A non-U.S. holder that is a corporation may also be subject to an additional branch profits tax equal to 30% (or such lower rate specified by an applicable income tax treaty) of its effectively connected earnings and profits for the taxable year, as adjusted for certain items. Non-U.S. holders should consult any applicable income tax treaties that may provide for different rules.
Gain recognized by an individual described in the second bullet point above will be subject to U.S. federal income tax at a flat 30% rate (or such lower rate specified by an applicable income tax treaty), but may be offset by U.S. source capital losses (even though the individual is not considered a resident of the United States), provided that the non-U.S. holder has timely filed U.S. federal income tax returns with respect to such losses.
With respect to the third bullet point above, we believe that we currently are not, and do not anticipate becoming, a USRPHC. Because the determination of whether we are a USRPHC depends on the fair market value of our interests in real property located within the United States relative to the fair market value of our interests in real property located outside the United States and our other business assets, however, there can be no assurance that we will not become a USRPHC in the future. Even if we were or were to become a USRPHC at any time during this period, generally gains realized upon a disposition of shares of our common stock by a non-U.S. holder that did not directly or indirectly own more than 5% of our common stock during this period would not be subject to U.S. federal income tax, provided that our common stock is “regularly traded on an established securities market” (within the meaning of Section 897(c)(3) of the Code). We expect our common stock to be “regularly traded” on an established securities market, although we cannot guarantee it will be so traded.
161
Table of Contents
Under the terms and subject to the conditions in an underwriting agreement dated the date of this prospectus, the underwriters named below, for whom Morgan Stanley & Co. LLC, Citigroup Global Markets Inc. and Goldman, Sachs & Co. are acting as representatives, have severally agreed to purchase, and we and the selling stockholder have agreed to sell to them, severally, the number of shares indicated below:
| Name |
Number of Shares | |
| Morgan Stanley & Co. LLC |
||
| Citigroup Global Markets Inc. |
||
| Goldman, Sachs & Co. |
||
| Barclays Capital Inc. |
||
| Credit Suisse Securities (USA) LLC |
||
| RBC Capital Markets, LLC |
||
| Apollo Global Securities, LLC |
||
|
| ||
| Total |
||
|
|
The underwriters and the representatives are collectively referred to as the “underwriters” and the “representatives,” respectively. The underwriters are offering the shares of common stock subject to their acceptance of the shares from us and the selling stockholder and subject to prior sale. The underwriting agreement provides that the obligations of the several underwriters to pay for and accept delivery of the shares of common stock offered by this prospectus are subject to the approval of certain legal matters by their counsel and to certain other conditions. The underwriters are obligated to take and pay for all of the shares of common stock offered by this prospectus if any such shares are taken. However, the underwriters are not required to take or pay for the shares covered by the underwriters’ option to purchase additional shares, as described below.
The underwriters initially propose to offer part of the shares of common stock directly to the public at the offering price listed on the cover page of this prospectus and part to certain dealers. After the initial offering of the shares of common stock, the offering price and other selling terms may from time to time be varied by the representatives. The offering of the shares by the underwriters is subject to receipt and acceptance and subject to the underwriters’ right to reject any order in whole or in part.
We have granted to the underwriters an option, exercisable for 30 days from the date of this prospectus, to purchase up to additional shares of common stock at the public offering price listed on the cover page of this prospectus, less underwriting discounts and commissions and the per share amount, if any, of dividends declared by us and payable on the shares purchased by them from us other than by exercise of their option to purchase additional shares but not payable on the shares that are subject to that option.
To the extent the option is exercised, each underwriter will become obligated, subject to certain conditions, to purchase about the same percentage of the additional shares of common stock as the number listed next to the underwriter’s name in the preceding table bears to the total number of shares of common stock listed next to the names of all underwriters in the preceding table.
The following table shows the per share and total public offering price, underwriting discounts and commissions, and proceeds before expenses to us and the selling stockholder. These amounts are shown assuming both no exercise and full exercise of the underwriters’ option to purchase up to an additional shares of common stock.
| Total | ||||||||||||
| Per Share | No Exercise | Full Exercise | ||||||||||
| Public offering price |
$ | $ | $ | |||||||||
| Underwriting discounts and commissions to be paid by: |
||||||||||||
| Us |
$ | $ | $ | |||||||||
| The selling stockholder |
$ | $ | $ | |||||||||
| Proceeds, before expenses, to us |
$ | $ | $ | |||||||||
| Proceeds, before expenses, to selling stockholder |
$ | $ | $ | |||||||||
162
Table of Contents
The estimated offering expenses payable by us, exclusive of the underwriting discounts and commissions, are approximately $ .
The underwriters have informed us that they do not intend sales to discretionary accounts to exceed 5% of the total number of shares of common stock offered by them.
We intend to apply to have our common stock listed on the New York Stock Exchange under the trading symbol “CK”.
We, the selling stockholder and all of our directors and officers have agreed that, without the prior written consent of Morgan Stanley & Co. LLC, Citigroup Global Markets Inc. and Goldman, Sachs & Co. on behalf of the underwriters, we and they will not, during the period ending 180 days after the date of this prospectus:
| • | offer, pledge, sell, contract to sell, sell any option or contract to purchase, purchase any option or contract to sell, grant any option, right or warrant to purchase lend or otherwise transfer or dispose of, directly or indirectly, any shares of common stock or any securities convertible into or exercisable or exchangeable for shares of common stock; |
| • | file any registration statement with the Securities and Exchange Commission relating to the offering of any shares of common stock or any securities convertible into or exercisable or exchangeable for common stock; or |
| • | enter into any swap or other arrangement that transfers to another, in whole or in part, any of the economic consequences of ownership of the common stock, |
whether any such transaction described above is to be settled by delivery of common stock or such other securities, in cash or otherwise. In addition, we and each such person agrees that, without the prior written consent of Morgan Stanley & Co. LLC, Citigroup Global Markets Inc. and Goldman, Sachs & Co. on behalf of the underwriters, it will not, during the period ending 180 days after the date of this prospectus, make any demand for, or exercise any right with respect to, the registration of any shares of common stock or any security convertible into or exercisable or exchangeable for common stock.
The restrictions described in the immediately preceding paragraph to do not apply to the sale of shares to the underwriters and is subject to other customary exceptions.
The 180 day restricted period described in the preceding paragraph will be extended if:
| • | during the last 17 days of the 180 day restricted period we issue an earnings release or material news event relating to us occurs, or |
| • | prior to the expiration of the 180 day restricted period, we announce that we will release earnings results during the 16 day period beginning on the last day of the 180 day period, |
in which case the restrictions described in the preceding paragraph will continue to apply until the expiration of the 18 day period beginning on the issuance of the earnings release or the occurrence of the material news or material event.
In order to facilitate the offering of the common stock, the underwriters may engage in transactions that stabilize, maintain or otherwise affect the price of the common stock. Specifically, the underwriters may sell more shares than they are obligated to purchase under the underwriting agreement, creating a short position. A short sale is covered if the short position is no greater than the number of shares available for purchase by the underwriters under their option to purchase additional shares. The underwriters can close out a covered short sale by exercising their option to purchase additional shares or purchasing shares in the open market. In determining the source of shares to close out a covered short sale, the underwriters will consider, among other things, the open market price of shares compared to the price available under their option to purchase additional shares. The underwriters may also sell shares in excess of their option, to purchase additional shares creating a naked short position. The underwriters must close out any naked short position by purchasing shares in the open market.
163
Table of Contents
A naked short position is more likely to be created if the underwriters are concerned that there may be downward pressure on the price of the common stock in the open market after pricing that could adversely affect investors who purchase in this offering. As an additional means of facilitating this offering, the underwriters may bid for, and purchase, shares of common stock in the open market to stabilize the price of the common stock. These activities may raise or maintain the market price of the common stock above independent market levels or prevent or retard a decline in the market price of the common stock. The underwriters are not required to engage in these activities and may end any of these activities at any time.
The underwriters may also impose a penalty bid. This occurs when a particular underwriter repays to the underwriters a portion of the underwriting discount received by it because the representatives have repurchased shares sold by or for the account of such underwriter in stabilizing or short covering transactions. We and the selling stockholders have agreed to indemnify the several underwriters, including their controlling persons, against certain liabilities, including liabilities under the Securities Act.
A prospectus in electronic format may be made available on websites maintained by one or more underwriters, or selling group members, if any, participating in this offering. The representatives may agree to allocate a number of shares of common stock to underwriters for sale to their online brokerage account holders. Internet distributions will be allocated by the representatives to underwriters that may make Internet distributions on the same basis as other allocations.
Pricing of the Offering
Prior to this offering, there has been no public market for our common stock. The initial public offering price was determined by negotiations between us, the selling stockholder and the representatives. Among the factors considered in determining the initial public offering price were our future prospects and those of our industry in general, our sales, earnings and certain other financial and operating information in recent periods, and the price-earnings ratios, price-sales ratios, market prices of securities and certain financial and operating information of companies engaged in activities similar to ours.
Directed Share Program
At our request, the underwriters have reserved five percent of the shares of common stock to be issued by the Company and offered by this prospectus for sale, at the initial public offering price, to directors, officers, employees, business associates and related persons of CKE Inc. If purchased by these persons, these shares will be subject to a 180-day lock-up restriction. The number of shares of common stock available for sale to the general public will be reduced to the extent these individuals purchase such reserved shares. Any reserved shares that are not so purchased will be offered by the underwriters to the general public on the same basis as the other shares offered by this prospectus.
Selling Restrictions
European Economic Area
In relation to each Member State of the European Economic Area which has implemented the Prospectus Directive (each, a “Relevant Member State”) an offer to the public of any shares of our common stock may not be made in that Relevant Member State, except that an offer to the public in that Relevant Member State of any shares of our common stock may be made at any time under the following exemptions under the Prospectus Directive, if they have been implemented in that Relevant Member State:
| (a) | to any legal entity that is a qualified investor as defined in the Prospectus Directive; |
| (b) | to fewer than 100 or, if the Relevant Member State has implemented the relevant provision of the 2010 PD Amending Directive, 150, natural or legal persons (other than qualified investors as defined in the Prospectus Directive), as permitted under the Prospectus Directive, subject to obtaining the prior consent of the representatives for any such offer; or |
| (c) | in any other circumstances falling within Article 3(2) of the Prospectus Directive, provided that no such offer of shares of our common stock shall result in a requirement for the publication by us or any underwriter of a prospectus pursuant to Article 3 of the Prospectus Directive. |
164
Table of Contents
For the purposes of this provision, (1) the expression an “offer to the public” in relation to any shares of our common stock in any Relevant Member State means the communication in any form and by any means of sufficient information on the terms of the offer and any shares of our common stock to be offered so as to enable an investor to decide to purchase any shares of our common stock, as the same may be varied in that Member State by any measure implementing the Prospectus Directive in that Member State, (2) the expression “Prospectus Directive” means Directive 2003/71/EC (and amendments thereto, including the 2010 PD Amending Directive, to the extent implemented in the Relevant Member State), and includes any relevant implementing measure in the Relevant Member State, and (3) the expression “2010 PD Amending Directive” means Directive 2010/73/EU.
United Kingdom
Each underwriter has represented and agreed that:
| (a) | it has only communicated or caused to be communicated and will only communicate or cause to be communicated an invitation or inducement to engage in investment activity (within the meaning of Section 21 of the FSMA) received by it in connection with the issue or sale of the shares of our common stock in circumstances in which Section 21(1) of the FSMA does not apply to us; and |
| (b) | it has complied and will comply with all applicable provisions of the FSMA with respect to anything done by it in relation to the shares of our common stock in, from or otherwise involving the United Kingdom. |
Hong Kong
The shares may not be offered or sold by means of any document other than (i) in circumstances which do not constitute an offer to the public within the meaning of the Companies Ordinance (Cap.32, Laws of Hong Kong), or (ii) to “professional investors” within the meaning of the Securities and Futures Ordinance (Cap.571, Laws of Hong Kong) and any rules made thereunder, or (iii) in other circumstances which do not result in the document being a “prospectus” within the meaning of the Companies Ordinance (Cap.32, Laws of Hong Kong), and no advertisement, invitation or document relating to the shares may be issued or may be in the possession of any person for the purpose of issue (in each case whether in Hong Kong or elsewhere), which is directed at, or the contents of which are likely to be accessed or read by, the public in Hong Kong (except if permitted to do so under the laws of Hong Kong) other than with respect to shares which are or are intended to be disposed of only to persons outside Hong Kong or only to “professional investors” within the meaning of the Securities and Futures Ordinance (Cap. 571, Laws of Hong Kong) and any rules made thereunder.
Singapore
This prospectus has not been registered as a prospectus with the Monetary Authority of Singapore. Accordingly, this prospectus and any other document or material in connection with the offer or sale, or invitation for subscription or purchase, of the shares may not be circulated or distributed, nor may the shares be offered or sold, or be made the subject of an invitation for subscription or purchase, whether directly or indirectly, to persons in Singapore other than (i) to an institutional investor under Section 274 of the Securities and Futures Act, Chapter 289 of Singapore (the “SFA”), (ii) to a relevant person, or any person pursuant to Section 275(1A), and in accordance with the conditions, specified in Section 275 of the SFA or (iii) otherwise pursuant to, and in accordance with the conditions of, any other applicable provision of the SFA.
Where the shares are subscribed or purchased under Section 275 by a relevant person which is: (a) a corporation (which is not an accredited investor) the sole business of which is to hold investments and the entire share capital of which is owned by one or more individuals, each of whom is an accredited investor; or (b) a trust (where the trustee is not an accredited investor) whose sole purpose is to hold investments and each beneficiary is an accredited investor, shares, debentures and units of shares and debentures of that corporation or the
165
Table of Contents
beneficiaries’ rights and interest in that trust shall not be transferable for 6 months after that corporation or that trust has acquired the shares under Section 275 except: (1) to an institutional investor under Section 274 of the SFA or to a relevant person, or any person pursuant to Section 275(1A), and in accordance with the conditions, specified in Section 275 of the SFA; (2) where no consideration is given for the transfer; or (3) by operation of law.
Japan
The securities have not been and will not be registered under the Financial Instruments and Exchange Law of Japan (the Financial Instruments and Exchange Law) and each underwriter has agreed that it will not offer or sell any securities, directly or indirectly, in Japan or to, or for the benefit of, any resident of Japan (which term as used herein means any person resident in Japan, including any corporation or other entity organized under the laws of Japan), or to others for re-offering or resale, directly or indirectly, in Japan or to a resident of Japan, except pursuant to an exemption from the registration requirements of, and otherwise in compliance with, the Financial Instruments and Exchange Law and any other applicable laws, regulations and ministerial guidelines of Japan.
Affiliations
The underwriters and their respective affiliates are full service financial institutions engaged in various activities, which may include securities trading, commercial and investment banking, financial advisory, investment management, investment research, principal investment, hedging, financing and brokerage activities and other financial and non-financial activities and services. Certain of the underwriters and their respective affiliates have, from time to time, performed, and may in the future perform, various financial advisory and investment banking services for us, for which they have received or may receive customary fees and expenses. Certain of the underwriters or their affiliates may have an indirect ownership interest in us through various private equity funds, including funds of Apollo or its affiliates.
In the ordinary course of business, the underwriters and their respective affiliates may make or hold a broad array of investments, including serving as counterparties to certain derivative and hedging arrangements and actively trade debt and equity securities (or related derivative securities) and financial instruments (including bank loans) for their own account or for the accounts of their customers, and such investment and securities activities may involve or relate to assets, securities or instruments of the issuer (directly, as collateral securing other obligations or otherwise) or persons and entities with relationships with the issuer. The underwriters and their respective affiliates may also make investment recommendations, market color or trading ideas or publish or express independent research views in respect of such securities or instruments and may at any time hold, or recommend to clients that they acquire, long or short positions in such assets, securities and instruments.
Conflicts of Interest
Apollo Global Securities, LLC, an underwriter of this offering, is an affiliate of Apollo, our controlling stockholder. Since Apollo beneficially owns more than 10% of our outstanding common stock, a “conflict of interest” is deemed to exist under Rule 5121(f)(5)(B) of the Conduct Rules of the Financial Industry Regulatory Authority (“FINRA”). Accordingly, this offering will be made in compliance with the applicable provisions of Rule 5121. As such, any underwriter that has a conflict of interest pursuant to Rule 5121 will not confirm sales to accounts in which it exercises discretionary authority without the prior written consent of the customer. Pursuant to Rule 5121, a “qualified independent underwriter” (as defined in Rule 5121) must participate in the preparation of the prospectus and perform its usual standard of due diligence with respect to the registration statement and this prospectus. has agreed to act as qualified independent underwriter for the offering.
166
Table of Contents
The validity of the shares of common stock offered hereby will be passed upon for us by our counsel, Morgan, Lewis & Bockius LLP, New York, New York. Certain legal matters in connection with this offering will be passed upon for the underwriters by Latham & Watkins LLP, Los Angeles, California.
The consolidated financial statements of CKE Inc. and subsidiaries (the “Successor”) as of January 31, 2012 and 2011, and for the year ended January 31, 2012 and the twenty-nine weeks ended January 31, 2011, the consolidated financial statements of CKE Restaurants, Inc. and subsidiaries (the “Predecessor”) for the twenty-four weeks ended July 12, 2010 and the year ended January 31, 2010, and financial statement Schedule I of CKE Inc., have been included herein and in the registration statement in reliance upon the report of KPMG LLP, independent registered public accounting firm, appearing elsewhere herein, and upon the authority of said firm as experts in accounting and auditing.
The audit report covering the consolidated financial statements of the Successor and Predecessor referred to above contains an explanatory paragraph that states that the Predecessor was acquired through a merger on July 12, 2010. As a result of the merger, the consolidated financial information for periods after the acquisition is presented on a different cost basis than that for the periods before the acquisition and, therefore, is not comparable.
WHERE YOU CAN FIND ADDITIONAL INFORMATION
We have filed with the Securities and Exchange Commission a registration statement under the Securities Act of 1933, as amended, referred to as the Securities Act, with respect to the shares of our common stock offered by this prospectus. This prospectus, filed as a part of the registration statement, does not contain all of the information set forth in the registration statement or the exhibits and schedules thereto as permitted by the rules and regulations of the SEC. For further information about us and our common stock, you should refer to the registration statement. This prospectus summarizes provisions that we consider material of certain contracts and other documents to which we refer you. You should review the full text of those documents. We have included copies of those documents as exhibits to the registration statement.
CKE Restaurants, our wholly-owned subsidiary, files reports with the SEC, on a voluntary basis, pursuant to Section 13(a) of the Securities Exchange Act of 1934, as amended. Such reports are filed in accordance with the terms of the indenture governing the Senior Secured Notes issued by CKE Restaurants. Such periodic reports are not incorporated into this prospectus by reference.
The registration statement and the exhibits thereto and our periodic reports filed with the SEC may be inspected, without charge, and copies may be obtained at prescribed rates, at the public reference facility maintained by the SEC at 100 F Street, N.E., Washington, D.C. 20549. You may obtain information on the operation of the SEC’s public reference facility by calling 1-800-SEC-0330. The registration statement and other information filed by us with the SEC are also available at the SEC’s website at http://www.sec.gov. You may request copies of the filing, at no cost, by telephone at (805) 745-7500 or by mail at 6307 Carpinteria Ave., Ste A., Carpinteria, CA 93013.
As a result of the offering, we and our stockholders will become subject to the proxy solicitation rules, annual and periodic reporting requirements and other requirements of the Exchange Act. We will furnish our stockholders with annual reports containing audited financial statements certified by an independent registered public accounting firm and quarterly reports containing unaudited financial statements for the first three quarters of each fiscal year.
167
Table of Contents
We also maintain an Internet site at http://www.ckr.com. We will, as soon as reasonably practicable after the electronic filing of our annual report on Form 10-K, quarterly reports on Form 10-Q, current reports on Form 8-K and amendments to those reports if applicable, make available such reports free of charge on our website. Our website and the information contained therein or accessible therefrom shall not be deemed to be incorporated into this prospectus or the registration statement of which this prospectus forms a part, and you should not rely on any such information in making your decision whether to purchase our securities.
168
Table of Contents
CKE INC. AND SUBSIDIARIES
INDEX TO CONSOLIDATED FINANCIAL STATEMENTS
| Page | ||||
| Consolidated Financial Statements: |
||||
| F-2 | ||||
| F-3 | ||||
| F-4 | ||||
| F-5 | ||||
| F-6 | ||||
| F-7 | ||||
| Financial Statement Schedules: |
||||
| F-48 | ||||
All financial statement schedules, with the exception of Schedule I, have been omitted since the required information is included in the Consolidated Financial Statements or the notes thereto, or the omitted schedules are not required.
| Condensed Consolidated Financial Statements (Unaudited): |
||||
| F-53 | ||||
| F-54 | ||||
| F-55 | ||||
| F-56 |
F-1
Table of Contents
REPORT OF INDEPENDENT REGISTERED PUBLIC ACCOUNTING FIRM
The Board of Directors and Stockholders
CKE Inc.:
We have audited the accompanying consolidated balance sheets of CKE Inc. and subsidiaries (the “Successor”) as of January 31, 2012 and 2011, and the related consolidated statements of operations, stockholders’ equity, and cash flows for the year ended January 31, 2012 and the twenty-nine weeks ended January 31, 2011. We also have audited the consolidated statements of operations, stockholders’ equity, and cash flows of CKE Restaurants, Inc. and subsidiaries (the “Predecessor”) for the twenty-four weeks ended July 12, 2010 and the year ended January 31, 2010. In connection with our audits of the consolidated financial statements, we also have audited financial statement Schedule I as listed in the accompanying index. These consolidated financial statements and financial statement schedule are the responsibility of CKE Inc.’s management. Our responsibility is to express an opinion on these consolidated financial statements and financial statement schedule based on our audits.
We conducted our audits in accordance with the standards of the Public Company Accounting Oversight Board (United States). Those standards require that we plan and perform the audit to obtain reasonable assurance about whether the financial statements are free of material misstatement. An audit includes examining, on a test basis, evidence supporting the amounts and disclosures in the financial statements. An audit also includes assessing the accounting principles used and significant estimates made by management, as well as evaluating the overall financial statement presentation. We believe that our audits provide a reasonable basis for our opinion.
In our opinion, the consolidated financial statements referred to above present fairly, in all material respects, the financial position of the Successor as of January 31, 2012 and 2011, and the results of their operations and their cash flows for the year ended January 31, 2012 and the twenty-nine weeks ended January 31, 2011 and the results of operations and cash flows of the Predecessor for the twenty-four weeks ended July 12, 2010 and the year ended January 31, 2010, in conformity with U.S. generally accepted accounting principles. Also in our opinion, the related financial statement schedule, when considered in relation to the basic consolidated financial statements taken as a whole, presents fairly, in all material respects, the information set forth therein.
As discussed in notes 1 and 2 to the consolidated financial statements, the Predecessor was acquired through a merger on July 12, 2010. As a result of the merger, the consolidated financial information for periods after the acquisition is presented on a different cost basis than that for the periods before the acquisition and, therefore, is not comparable.
/s/ KPMG LLP
Irvine, California
May 17, 2012
F-2
Table of Contents
CONSOLIDATED BALANCE SHEETS
(In thousands, except shares and par values)
| Successor | ||||||||
| January 31, 2012 | January 31, 2011 | |||||||
| ASSETS |
||||||||
| Current assets: |
||||||||
| Cash and cash equivalents |
$ | 64,585 | $ | 42,586 | ||||
| Accounts receivable, net |
24,099 | 27,533 | ||||||
| Related party trade receivables |
252 | 216 | ||||||
| Inventories |
16,144 | 14,526 | ||||||
| Prepaid expenses |
15,897 | 14,219 | ||||||
| Advertising fund assets, restricted |
18,407 | 18,464 | ||||||
| Deferred income tax assets, net |
17,843 | 17,079 | ||||||
| Other current assets |
3,695 | 4,261 | ||||||
|
|
|
|
|
|||||
| Total current assets |
160,922 | 138,884 | ||||||
| Notes receivable, net |
— | 172 | ||||||
| Property and equipment, net |
645,552 | 676,350 | ||||||
| Goodwill |
208,885 | 207,817 | ||||||
| Intangible assets, net |
433,139 | 448,499 | ||||||
| Other assets, net |
29,589 | 24,444 | ||||||
|
|
|
|
|
|||||
| Total assets |
$ | 1,478,087 | $ | 1,496,166 | ||||
|
|
|
|
|
|||||
| LIABILITIES AND STOCKHOLDER’S EQUITY |
||||||||
| Current liabilities: |
||||||||
| Current portion of long-term debt |
$ | 3 | $ | 29 | ||||
| Current portion of capital lease obligations |
7,988 | 7,434 | ||||||
| Accounts payable |
40,790 | 41,442 | ||||||
| Advertising fund liabilities |
18,407 | 18,464 | ||||||
| Other current liabilities |
84,510 | 81,958 | ||||||
|
|
|
|
|
|||||
| Total current liabilities |
151,698 | 149,327 | ||||||
| Long-term debt, less current portion |
721,731 | 589,987 | ||||||
| Capital lease obligations, less current portion |
34,981 | 41,082 | ||||||
| Deferred income tax liabilities, net |
143,489 | 151,828 | ||||||
| Other long-term liabilities |
206,293 | 139,173 | ||||||
|
|
|
|
|
|||||
| Total liabilities |
1,258,192 | 1,071,397 | ||||||
|
|
|
|
|
|||||
| Commitments and contingencies (Notes 6, 9, 10, 11, 15, 20 and 21) |
||||||||
| Stockholder’s equity: |
||||||||
| Common stock, $0.01 par value; 100 shares authorized, issued and outstanding as of January 31, 2012 and 2011 |
— | — | ||||||
| Additional paid-in capital |
457,252 | 452,659 | ||||||
| Accumulated deficit |
(237,357 | ) | (27,890 | ) | ||||
|
|
|
|
|
|||||
| Total stockholder’s equity |
219,895 | 424,769 | ||||||
|
|
|
|
|
|||||
| Total liabilities and stockholder’s equity |
$ | 1,478,087 | $ | 1,496,166 | ||||
|
|
|
|
|
|||||
See Accompanying Notes to Consolidated Financial Statements
F-3
Table of Contents
CKE INC. AND SUBSIDIARIES
CONSOLIDATED STATEMENTS OF OPERATIONS
(In thousands, except shares and per share amounts)
| Successor | Predecessor | |||||||||||||||
| Fiscal 2012 |
Twenty-Nine Weeks Ended January 31, 2011 |
Twenty-Four Weeks Ended July 12, 2010 |
Fiscal 2010 |
|||||||||||||
| Revenue: |
||||||||||||||||
| Company-operated restaurants |
$ | 1,122,430 | $ | 598,753 | $ | 500,531 | $ | 1,084,474 | ||||||||
| Franchised restaurants and other |
157,897 | 80,355 | 151,588 | 334,259 | ||||||||||||
|
|
|
|
|
|
|
|
|
|||||||||
| Total revenue |
1,280,327 | 679,108 | 652,119 | 1,418,733 | ||||||||||||
|
|
|
|
|
|
|
|
|
|||||||||
| Operating costs and expenses: |
||||||||||||||||
| Restaurant operating costs: |
||||||||||||||||
| Food and packaging |
344,394 | 176,310 | 148,642 | 309,728 | ||||||||||||
| Payroll and other employee benefits |
325,890 | 173,717 | 147,391 | 313,368 | ||||||||||||
| Occupancy and other |
269,331 | 145,882 | 118,138 | 258,301 | ||||||||||||
|
|
|
|
|
|
|
|
|
|||||||||
| Total restaurant operating costs |
939,615 | 495,909 | 414,171 | 881,397 | ||||||||||||
| Franchised restaurants and other |
81,372 | 39,464 | 115,120 | 254,124 | ||||||||||||
| Advertising |
65,061 | 34,481 | 29,647 | 64,443 | ||||||||||||
| General and administrative |
130,858 | 84,833 | 59,859 | 134,579 | ||||||||||||
| Facility action charges, net |
(6,018 | ) | 1,683 | 590 | 4,695 | |||||||||||
| Other operating expenses, net |
545 | 20,003 | 10,249 | — | ||||||||||||
|
|
|
|
|
|
|
|
|
|||||||||
| Total operating costs and expenses |
1,211,433 | 676,373 | 629,636 | 1,339,238 | ||||||||||||
|
|
|
|
|
|
|
|
|
|||||||||
| Operating income |
68,894 | 2,735 | 22,483 | 79,495 | ||||||||||||
| Interest expense |
(98,124 | ) | (43,681 | ) | (8,617 | ) | (19,254 | ) | ||||||||
| Other (expense) income, net |
(1,658 | ) | 1,645 | (13,609 | ) | 2,935 | ||||||||||
|
|
|
|
|
|
|
|
|
|||||||||
| (Loss) income before income taxes |
(30,888 | ) | (39,301 | ) | 257 | 63,176 | ||||||||||
| Income tax (benefit) expense |
(11,609 | ) | (11,411 | ) | 7,772 | 14,978 | ||||||||||
|
|
|
|
|
|
|
|
|
|||||||||
| Net (loss) income |
$ | (19,279 | ) | $ | (27,890 | ) | $ | (7,515 | ) | $ | 48,198 | |||||
|
|
|
|
|
|
|
|
|
|||||||||
| Basic loss per common share |
$ | (192,790 | ) | $ | (278,900 | ) | ||||||||||
|
|
|
|
|
|||||||||||||
| Dividends per common share |
$ | 1,901,880 | $ | — | ||||||||||||
|
|
|
|
|
|||||||||||||
| Weighted-average common shares outstanding |
100 | 100 | ||||||||||||||
|
|
|
|
|
|||||||||||||
See Accompanying Notes to Consolidated Financial Statements
F-4
Table of Contents
CKE INC. AND SUBSIDIARIES
CONSOLIDATED STATEMENTS OF STOCKHOLDERS’ EQUITY
(In thousands, except shares)
| Common Stock | Additional Paid-In Capital |
Accumulated Deficit |
Total Stockholders’ Equity |
|||||||||||||||||
| Shares | Amount | |||||||||||||||||||
| Predecessor: |
||||||||||||||||||||
| Balance as of January 31, 2009 |
54,652,983 | $ | 546 | $ | 276,068 | $ | (82,338 | ) | $ | 194,276 | ||||||||||
| Cash dividends declared |
— | — | — | (13,142 | ) | (13,142 | ) | |||||||||||||
| Issuance of restricted stock awards, net of forfeitures |
637,719 | 7 | (7 | ) | — | — | ||||||||||||||
| Exercise of stock options |
190,986 | 2 | 836 | — | 838 | |||||||||||||||
| Net tax deficiency from exercise of stock options and vesting of restricted stock awards |
— | — | (391 | ) | — | (391 | ) | |||||||||||||
| Share-based compensation expense |
— | — | 8,120 | — | 8,120 | |||||||||||||||
| Repurchase and retirement of common stock |
(191,062 | ) | (2 | ) | (1,722 | ) | — | (1,724 | ) | |||||||||||
| Net income |
— | — | — | 48,198 | 48,198 | |||||||||||||||
|
|
|
|
|
|
|
|
|
|
|
|||||||||||
| Balance as of January 31, 2010 |
55,290,626 | 553 | 282,904 | (47,282 | ) | 236,175 | ||||||||||||||
| Forfeitures of restricted stock awards |
(78,484 | ) | (1 | ) | 1 | — | — | |||||||||||||
| Exercise of stock options |
154,317 | 2 | 1,061 | — | 1,063 | |||||||||||||||
| Share-based compensation expense |
— | — | 4,710 | — | 4,710 | |||||||||||||||
| Repurchase and retirement of common stock |
(178,800 | ) | (2 | ) | (2,070 | ) | — | (2,072 | ) | |||||||||||
| Net loss |
— | — | — | (7,515 | ) | (7,515 | ) | |||||||||||||
|
|
|
|
|
|
|
|
|
|
|
|||||||||||
| Balance as of July 12, 2010 |
55,187,659 | $ | 552 | $ | 286,606 | $ | (54,797 | ) | $ | 232,361 | ||||||||||
|
|
|
|
|
|
|
|
|
|
|
|||||||||||
| Common Stock | Additional Paid-In Capital |
Accumulated Deficit |
Total Stockholder’s Equity |
|||||||||||||||||
| Shares | Amount | |||||||||||||||||||
| Successor: |
||||||||||||||||||||
| Equity contribution |
100 | $ | — | $ | 450,000 | $ | — | $ | 450,000 | |||||||||||
| Share-based compensation expense |
— | — | 2,659 | — | 2,659 | |||||||||||||||
| Net loss |
— | — | — | (27,890 | ) | (27,890 | ) | |||||||||||||
|
|
|
|
|
|
|
|
|
|
|
|||||||||||
| Balance as of January 31, 2011 |
100 | — | 452,659 | (27,890 | ) | 424,769 | ||||||||||||||
| Share-based compensation expense |
— | — | 4,593 | — | 4,593 | |||||||||||||||
| Cash dividends declared |
— | — | — | (190,188 | ) | (190,188 | ) | |||||||||||||
| Net loss |
— | — | — | (19,279 | ) | (19,279 | ) | |||||||||||||
|
|
|
|
|
|
|
|
|
|
|
|||||||||||
| Balance as of January 31, 2012 |
100 | $ | — | $ | 457,252 | $ | (237,357 | ) | $ | 219,895 | ||||||||||
|
|
|
|
|
|
|
|
|
|
|
|||||||||||
See Accompanying Notes to Consolidated Financial Statements
F-5
Table of Contents
CKE INC. AND SUBSIDIARIES
CONSOLIDATED STATEMENTS OF CASH FLOWS
(In thousands)
| Successor | Predecessor | |||||||||||||||
| Fiscal 2012 |
Twenty-Nine Weeks Ended January 31, 2011 |
Twenty-Four Weeks Ended July 12, 2010 |
Fiscal 2010 |
|||||||||||||
| Cash flows from operating activities: |
||||||||||||||||
| Net (loss) income |
$ | (19,279 | ) | $ | (27,890 | ) | $ | (7,515 | ) | $ | 48,198 | |||||
| Adjustments to reconcile net (loss) income to net cash provided by (used in) operating activities: |
||||||||||||||||
| Depreciation and amortization |
82,044 | 41,881 | 33,703 | 71,064 | ||||||||||||
| Amortization of deferred financing costs and discount on notes |
4,821 | 2,089 | 522 | 1,035 | ||||||||||||
| Interest expense converted to long-term debt |
11,313 | — | — | — | ||||||||||||
| Loss on early extinguishment of notes |
2,976 | — | — | — | ||||||||||||
| Share-based compensation expense |
4,593 | 2,659 | 4,710 | 8,120 | ||||||||||||
| Provision for (recovery of) losses on accounts and notes receivable |
129 | 127 | (100 | ) | (212 | ) | ||||||||||
| Loss (gain) on disposal of property and equipment |
1,570 | 4,220 | (1,857 | ) | 1,730 | |||||||||||
| Deferred income taxes |
(9,103 | ) | (10,835 | ) | 8,241 | 11,797 | ||||||||||
| Other non-cash charges |
1,783 | 591 | 317 | 3,529 | ||||||||||||
| Net changes in operating assets and liabilities: |
||||||||||||||||
| Receivables, inventories, prepaid expenses and other current and non-current assets |
(1,632 | ) | 7,594 | 4,747 | 1,766 | |||||||||||
| Estimated liability for closed restaurants and estimated liability for self-insurance |
587 | (107 | ) | (1,697 | ) | (2,111 | ) | |||||||||
| Accounts payable and other current and long-term liabilities |
15,539 | (31,722 | ) | 4,579 | 4,850 | |||||||||||
|
|
|
|
|
|
|
|
|
|||||||||
| Net cash provided by (used in) operating activities |
95,341 | (11,393 | ) | 45,650 | 149,766 | |||||||||||
|
|
|
|
|
|
|
|
|
|||||||||
| Cash flows from investing activities: |
||||||||||||||||
| Purchases of property and equipment |
(52,423 | ) | (29,360 | ) | (33,738 | ) | (102,306 | ) | ||||||||
| Acquisition of Predecessor |
— | (693,478 | ) | — | — | |||||||||||
| Proceeds from sale of property and equipment |
1,985 | 1,283 | 1,011 | 4,457 | ||||||||||||
| Proceeds from sale of distribution center assets |
— | 1,992 | 19,203 | — | ||||||||||||
| Collections of non-trade notes receivable |
749 | 312 | 673 | 3,399 | ||||||||||||
| Acquisition of restaurants, net of cash received |
— | — | — | (1,041 | ) | |||||||||||
| Other investing activities |
184 | 95 | (284 | ) | 135 | |||||||||||
|
|
|
|
|
|
|
|
|
|||||||||
| Net cash used in investing activities |
(49,505 | ) | (719,156 | ) | (13,135 | ) | (95,356 | ) | ||||||||
|
|
|
|
|
|
|
|
|
|||||||||
| Cash flows from financing activities: |
||||||||||||||||
| Net change in bank overdraft |
(729 | ) | 1,030 | (7,364 | ) | 3,295 | ||||||||||
| Borrowings under revolving credit facilities |
— | — | 138,500 | 122,000 | ||||||||||||
| Repayments of borrowings under revolving credit facilities |
— | (34,000 | ) | (134,500 | ) | (154,000 | ) | |||||||||
| Repayments of Predecessor senior credit facility term loan |
— | (236,487 | ) | (10,945 | ) | (4,303 | ) | |||||||||
| Proceeds from issuance of notes, net of original issue discount |
196,230 | 588,510 | — | — | ||||||||||||
| Proceeds from financing method sale-leaseback transactions |
67,454 | — | — | — | ||||||||||||
| Payment of deferred financing costs |
(9,930 | ) | (19,981 | ) | — | — | ||||||||||
| Payment for early extinguishment of notes |
(78,047 | ) | — | — | — | |||||||||||
| Repayments of other long-term debt |
(616 | ) | (14 | ) | (13 | ) | (21 | ) | ||||||||
| Repayments of capital lease obligations |
(8,011 | ) | (4,288 | ) | (3,748 | ) | (7,277 | ) | ||||||||
| Repurchase of common stock |
— | — | (2,072 | ) | (1,724 | ) | ||||||||||
| Exercise of stock options |
— | — | 1,063 | 838 | ||||||||||||
| Tax impact of stock option and restricted stock award transactions |
— | — | — | 299 | ||||||||||||
| Dividends paid on common stock |
(190,188 | ) | — | (3,317 | ) | (13,140 | ) | |||||||||
| Net advances from (to) affiliates of Apollo Management VII, L.P. |
— | 2,641 | (2,641 | ) | — | |||||||||||
| Equity contribution |
— | 450,000 | — | — | ||||||||||||
|
|
|
|
|
|
|
|
|
|||||||||
| Net cash (used in) provided by financing activities |
(23,837 | ) | 747,411 | (25,037 | ) | (54,033 | ) | |||||||||
|
|
|
|
|
|
|
|
|
|||||||||
| Net increase in cash and cash equivalents |
21,999 | 16,862 | 7,478 | 377 | ||||||||||||
| Cash and cash equivalents at beginning of period |
42,586 | 25,724 | 18,246 | 17,869 | ||||||||||||
|
|
|
|
|
|
|
|
|
|||||||||
| Cash and cash equivalents at end of period |
$ | 64,585 | $ | 42,586 | $ | 25,724 | $ | 18,246 | ||||||||
|
|
|
|
|
|
|
|
|
|||||||||
See Accompanying Notes to Consolidated Financial Statements
F-6
Table of Contents
CKE INC. AND SUBSIDIARIES
NOTES TO CONSOLIDATED FINANCIAL STATEMENTS
(Dollars in thousands, except per share and per unit amounts)
NOTE 1—ORGANIZATION AND SIGNIFICANT ACCOUNTING POLICIES
Description of Business
CKE Inc.® (“CKE”), through its wholly-owned subsidiaries, owns, operates and franchises the Carl’s Jr. ®, Hardee’s®, Green Burrito® and Red Burrito® concepts. CKE was formed on April 15, 2010 and is indirectly controlled by investment funds managed by Apollo Management VII, L.P. and its affiliates. There was no business activity at CKE prior to the date of the Merger, which is discussed below in the section entitled “Merger and Related Transactions.”
Domestic Carl’s Jr. restaurants are predominately located in the Western United States, primarily in California, with a growing presence in Texas. International Carl’s Jr. restaurants are located primarily in Mexico, with a growing presence in Russia and the Asia. Hardee’s restaurants are primarily located throughout the Southeastern and Midwestern United States with a growing international presence in the Middle East. Green Burrito restaurants are primarily located in dual-branded Carl’s Jr. restaurants. The Red Burrito concept is located in dual-branded Hardee’s restaurants. As of January 31, 2012, the system-wide restaurant portfolio of CKE and its consolidated subsidiaries consisted of:
| Carl’s Jr. | Hardee’s | Other | Total | |||||||||||||
| Company-operated |
423 | 469 | — | 892 | ||||||||||||
| Domestic franchised |
693 | 1,226 | 9 | 1,928 | ||||||||||||
| International franchised |
197 | 226 | — | 423 | ||||||||||||
|
|
|
|
|
|
|
|
|
|||||||||
| Total |
1,313 | 1,921 | 9 | 3,243 | ||||||||||||
|
|
|
|
|
|
|
|
|
|||||||||
As of January 31, 2012, 258 of the 423 company-operated Carl’s Jr. restaurants were dual-branded with Green Burrito and 219 of the 469 company-operated Hardee’s restaurants were dual-branded with Red Burrito.
Merger and Related Transactions
On July 12, 2010, CKE Restaurants, Inc. (“CKE Restaurants”) completed a merger with Columbia Lake Acquisition Corp. (“Merger Sub”), a Delaware corporation and wholly-owned subsidiary of CKE, providing for the merger of Merger Sub with and into CKE Restaurants (the “Merger”), with CKE Restaurants surviving the Merger as a wholly-owned subsidiary of CKE, pursuant to the Agreement and Plan of Merger, dated April 18, 2010 (“Merger Agreement”).
The aggregate consideration for all equity securities of CKE Restaurants was $704,065, including $10,587 of post-combination share-based compensation expense, and the total debt assumed and refinanced in connection with the Merger was $270,487. The Merger was funded by (i) equity contributions from certain funds managed by Apollo Management VII, L.P. of $436,645, (ii) equity contributions from our senior management of $13,355, and (iii) proceeds of $588,510 from the issuance of $600,000 senior secured second lien notes (the “Senior Secured Notes”). In addition, CKE Restaurants entered into a $100,000 senior secured revolving credit facility (the “Credit Facility”), which was undrawn at closing.
The aforementioned transactions, including the Merger and payment of costs related to these transactions, are collectively referred to as the “Transactions.”
F-7
Table of Contents
CKE INC. AND SUBSIDIARIES
NOTES TO CONSOLIDATED FINANCIAL STATEMENTS (Continued)
Basis of Presentation and Fiscal Year
For periods subsequent to the Merger, the Consolidated Financial Statements include the accounts of CKE, its consolidated subsidiaries and its consolidated variable interest entities (“VIE”). Since CKE did not have any operating activity prior to the Merger, for comparative purposes we have included the Consolidated Financial Statements of CKE Restaurants, its consolidated subsidiaries and its consolidated VIEs for periods prior to the Merger. The Consolidated Financial Statements have been prepared in accordance with accounting principles generally accepted in the United States (“GAAP”). All significant intercompany transactions are eliminated.
For the purposes of presentation and disclosure, all references to “Successor” relate to CKE and its consolidated subsidiaries for periods subsequent to the Merger. All references to “Predecessor” relate to CKE Restaurants and its consolidated subsidiaries for periods prior to the Merger. References to “we”, “us”, “our” and the “Company” relate to the Predecessor for the periods prior to the Merger and to the Successor for periods subsequent to the Merger.
We operate on a retail accounting calendar. For clarity of presentation, we generally label all years presented as if the fiscal year ended January 31. The fiscal year ended January 30, 2012 is referred to herein as fiscal 2012 or the fiscal year ended January 31, 2012. The fiscal year ended January 31, 2011 includes the combined Successor twenty-nine weeks ended January 31, 2011 and Predecessor twenty-four weeks ended July 12, 2010 and is referred to herein as fiscal 2011. The fiscal year ended January 25, 2010 is referred to herein as fiscal 2010 or the fiscal year ended January 31, 2010. The first quarter of our fiscal year has four periods, or 16 weeks. All other quarters generally have three periods, or 12 weeks. Our fiscal year ended January 31, 2011 contained 53 weeks, whereby the one additional week was included in our fourth quarter.
During the fourth quarter of fiscal 2012, we identified and corrected an immaterial error, which relates to and arose during periods prior to fiscal 2010, that impacted our previously reported estimated liability for self-insurance in our Hardee’s operating segment. Our previously reported self-insured workers’ compensation claims reserves were understated as a result of inaccurate claims reserve data provided by an external claims administrator that handles a population of 15 workers’ compensation claims, all of which relate to injuries that occurred between 1991 and 1996. Management assessed the materiality of the out-of-period correction on both a quantitative and qualitative basis and concluded that it was immaterial to our Consolidated Financial Statements for fiscal 2012, the Successor twenty-nine weeks ended January 31, 2011, the Predecessor twenty-four weeks ended July 12, 2010 and fiscal 2010. As a result, during the fourth quarter of fiscal 2012, we increased our estimated liability for self-insurance by $1,976 (“Insurance Reserve Adjustment”), resulting in a corresponding increase of $1,976 in payroll and other employee benefits expense.
Certain prior year amounts in the Consolidated Financial Statements have been reclassified to conform with the current year presentation.
Variable Interest Entities
We consolidate one national and approximately 80 local co-operative advertising funds (the “Hardee’s Funds”) as we have concluded that they are VIEs for which we are the primary beneficiary. We have included $18,407 and $18,464 of advertising fund assets, restricted, and advertising fund liabilities in our Consolidated Balance Sheets as of January 31, 2012 and January 31, 2011, respectively. Consolidation of the Hardee’s Funds had no impact on our accompanying Consolidated Statements of Operations and Cash Flows. We have no rights to the assets, nor do we have any obligation with respect to the liabilities, of the Hardee’s Funds, and none of our assets serve as collateral for the creditors of these VIEs.
F-8
Table of Contents
CKE INC. AND SUBSIDIARIES
NOTES TO CONSOLIDATED FINANCIAL STATEMENTS (Continued)
In addition to the Hardee’s Funds, we have variable interests in certain of our franchisees, primarily as a result of leasing activities and notes receivable. We do not maintain ownership interests in our franchisees, and none of our assets serve as collateral for the creditors of our franchisees. We have reviewed these franchise entities in accordance with authoritative accounting guidance and concluded that consolidation is not required.
Estimations
The preparation of financial statements in conformity with GAAP requires management to make estimates and assumptions that affect the reported amounts of assets and liabilities and disclosure of contingent assets and liabilities at the date of the financial statements and the reported amounts of revenue and expenses during the reporting period. Actual results could differ from those estimates.
Our most significant areas of estimation are:
| • | estimation of future cash flows used to assess the recoverability of long-lived assets, including intangible assets and goodwill, and to establish the estimated liability for closed restaurants and subsidizing lease payments of franchisees; |
| • | estimation, using actuarially determined methods, of our self-insured claim losses under our workers’ compensation, general and auto liability insurance programs; |
| • | determination of appropriate estimated liabilities for loss contingencies; |
| • | determination of appropriate assumptions to use in evaluating leases for capital versus operating lease treatment, establishing depreciable lives for leasehold improvements and establishing straight-line rent expense periods; |
| • | estimation of the appropriate allowances associated with franchise and other receivables; |
| • | determination of the appropriate assumptions to use to estimate the fair value of share-based compensation; |
| • | estimation of our deferred income tax asset valuation allowance, liabilities related to uncertain tax positions and effective tax rate; and |
| • | estimation of the fair value allocation of the purchase price to assets acquired and liabilities assumed in connection with the acquisition accounting and the useful lives assigned to amortizing assets and liabilities in connection with the Merger. |
Cash and Cash Equivalents
For purposes of reporting cash and cash equivalents, highly liquid investments purchased with original maturities of three months or less are considered cash equivalents.
Inventories
Inventories are stated at the lower of cost (on a first-in, first-out basis) or market and consist primarily of restaurant food, packaging, equipment and supplies.
Assets Held For Sale
Assets held for sale consist of surplus restaurant properties and company-operated restaurants that we expect to sell within one year. We no longer depreciate assets once classified as held for sale. As of January 31, 2012,
F-9
Table of Contents
CKE INC. AND SUBSIDIARIES
NOTES TO CONSOLIDATED FINANCIAL STATEMENTS (Continued)
we did not have any assets classified as held for sale. As of January 31, 2011, total assets held for sale were $196 and were comprised of one surplus property in our Hardee’s operating segment. Assets held for sale are included within other current assets within the accompanying Consolidated Balance Sheet as of January 31, 2011.
Property and Equipment
Property and equipment are recorded at cost, less accumulated depreciation and amortization. Depreciation is computed using the straight-line method based on the assets’ estimated useful lives, which generally range from three to 40 years.
Leasehold improvements are amortized on a straight-line basis over the shorter of the estimated useful lives of the assets or the related lease terms. The amortization period for leasehold improvements includes renewal option periods only in instances in which the exercise of the renewal option is reasonably assured at the acquisition date because failure to exercise such option would result in an economic penalty.
Leases
At the inception of each lease, we perform an evaluation to determine whether the lease is an operating or capital lease. The lease term used for this evaluation includes renewal option periods only in instances in which the exercise of the renewal option can be reasonably assured because failure to exercise such option would result in an economic penalty. Such economic penalty would typically result from our having to abandon buildings and other non-detachable improvements with remaining economic value upon vacating the property.
We enter into leases that contain provisions for scheduled rent increases, rent concessions and leasehold improvement incentives. The impacts of such lease provisions are recorded to rent expense on a straight-line basis over the term of the lease. The lease term used for straight-line rent expense is calculated from the date we are given control of the leased premises through the end of the lease term, which may include a rent holiday period prior to our opening the restaurant on the leased premises. The lease term used for this evaluation also provides the basis for establishing depreciable lives for buildings subject to lease and leasehold improvements. Contingent rentals are generally based on revenue in excess of stipulated amounts, and thus are not considered minimum lease payments and are included in rent expense as they are incurred.
Capitalized Costs
We capitalize direct costs and interest costs associated with construction projects that have a future benefit. If we subsequently make a determination that a site for which development costs have been capitalized will not be acquired or developed, any previously capitalized development costs are expensed and included in general and administrative expenses.
Goodwill and Intangible Assets
We test goodwill for impairment on an annual basis, or more frequently if events and/or circumstances indicate that goodwill might be impaired. We perform our annual goodwill impairment test on the last day of the first accounting period in our fiscal fourth quarter, which was on December 5, 2011 during fiscal 2012. The impairment test is performed at the reporting unit level, and an impairment loss is recognized to the extent that the carrying amount of goodwill exceeds the fair value. We consider the reporting unit level to be the brand level as the components (e.g., restaurants) within each brand have similar economic characteristics, including products and services, production processes, types or classes of customers and distribution methods.
F-10
Table of Contents
CKE INC. AND SUBSIDIARIES
NOTES TO CONSOLIDATED FINANCIAL STATEMENTS (Continued)
In accordance with the authoritative accounting guidance, we use a two-step test to identify the potential impairment and to measure the amount of goodwill impairment, if any. We first identify any potential impairment by comparing the estimated fair value of the reporting unit with its carrying amount, including goodwill. If the estimated fair value of the reporting unit exceeds its carrying amount, there is no impairment and the second step is not required. If step two is required, we measure impairment by comparing the implied fair value of the reporting unit goodwill with the carrying amount of goodwill.
As of January 31, 2012, our goodwill consisted of $199,166 for our Carl’s Jr. reporting unit and $9,719 for our Hardee’s reporting unit. The goodwill for both reporting units primarily resulted from the Merger on July 12, 2010. During the fourth quarter of fiscal 2012, we performed our goodwill impairment test for our Carl’s Jr. and Hardee’s reporting units. As of the date of the annual impairment test, the fair values of both the Carl’s Jr. and Hardee’s reporting units exceeded their respective carrying values by more than 20%. The excess of the fair value as compared to the carrying value is attributed primarily to the general improvement in financial markets between the date of the acquisition and the date of the impairment test, and improvements in operating results and cash flows. However, future declines in market conditions and the actual future performance of our reporting units could negatively impact the results of future impairment tests.
Our indefinite-lived intangible assets consist of trademarks/tradenames. We test trademarks/tradenames for impairment on an annual basis or more frequently if events or changes in circumstances indicate that the carrying amount of the intangible asset may not be recoverable. During the fourth quarter of fiscal 2012, we performed our impairment test for trademarks/tradenames and concluded that no impairment charge was required.
Our definite-lived intangible assets are amortized utilizing a straight-line basis over their estimated useful lives and are tested for impairment when events or circumstances indicate the carrying value may be impaired. Refer to discussion of facility action charges for a discussion of impairment of restaurant-level long-lived assets.
Bank Overdraft
Bank overdraft liabilities are included within accounts payable in our accompanying Consolidated Balance Sheets. As of January 31, 2012 and 2011, our bank overdraft liability was $13,871 and $14,601, respectively. We classify changes in bank overdraft balances as a financing activity in our accompanying Consolidated Statements of Cash Flows.
Deferred Financing Costs
Deferred financing costs are capitalized and amortized, utilizing the effective interest method, as a component of interest expense over the terms of the respective financing arrangements. These deferred costs are included in other assets, net in our accompanying Consolidated Balance Sheets.
Revenue Recognition
Company-operated restaurants revenue is recognized upon the sale of food or beverage to a customer in the restaurant. Franchised restaurants and other revenue includes continuing rent and service fees, initial fees and royalties. Continuing fees and royalties are recognized in the period earned. Initial fees are recognized upon the opening of a restaurant, which is when we have performed substantially all initial services required by the franchise agreement. Renewal fees are recognized when a renewal agreement becomes effective. Rental revenue is recognized in the period earned. Sales of equipment (and Predecessor sales of food, packaging, and supplies) to franchisees are recognized at the time of delivery to the franchisees. Our accounting policy is to present the taxes collected from customers and remitted to government authorities on a net basis.
F-11
Table of Contents
CKE INC. AND SUBSIDIARIES
NOTES TO CONSOLIDATED FINANCIAL STATEMENTS (Continued)
Franchise Operations
Franchise agreements set out the terms of our arrangements with our domestic and international franchisees. Our franchise agreements require the franchisee to pay an initial, non-refundable fee and continuing fees based upon a percentage of sales. Subject to our approval and payment of a renewal fee, a franchisee may generally renew the franchise agreement upon its expiration.
We incur expenses that benefit our franchisee community. These expenses, along with other costs of sales and servicing of franchise agreements, are charged to franchised restaurants and other expense as incurred.
Franchised restaurants and other revenue also includes rental revenue from leasing or subleasing restaurants to franchisees. The related occupancy costs are included in franchised restaurants and other expense. If we sublease restaurants to a franchisee on terms that result in a probable loss over the term of the lease, a lease subsidy allowance is established at inception and charged to facility action charges, net. (See accounting policy for Facility Action Charges—Store Closure Costs, below.)
Each quarter, we perform an analysis to estimate bad debts for each franchisee, compare the aggregate result of that analysis to the allowances for doubtful accounts and adjust the allowances as appropriate. Additionally, we cease accruing royalties and rental revenue from franchisees during the fiscal quarter in which we determine that collectibility of such amounts is not reasonably assured. Over time, our assessment of individual franchisees may change. For instance, we have had some franchisees, who in the past we had determined required an estimated loss equal to the total amount of the receivable, which have paid us in full or established a consistent record of payments (generally six months) such that we determined an allowance was no longer required.
Depending on the facts and circumstances, there are a number of different actions we and/or our franchisees may take to resolve franchise collections issues. These actions may include the purchase of franchise restaurants by us or by other franchisees, a modification of the franchise agreement (which may include a provision to defer certain royalty payments or reduce royalty rates in the future), a restructuring of the franchisee’s business and/or finances (including the restructuring of subleases for which we are the primary obligee to the landlord—see further discussion below) or, if necessary, the termination of the franchise agreement. The allowance established is based on our assessment of the most likely outcome.
Advertising
Company-operated and franchised restaurants share in the cost of various advertising and marketing programs for our brands. Advertising and marketing contributions for both company-operated and franchised restaurants are generally determined based on a percentage of revenues and contributed ratably throughout the year. We utilize a single advertising fund (the “Carl’s Jr. Fund”) to administer our Carl’s Jr. advertising programs and the Hardee’s Funds to administer our Hardee’s advertising programs. We consolidate the Hardee’s Funds in our accompanying Consolidated Balance Sheets.
We charge Carl’s Jr. advertising and marketing costs to expense ratably in relation to revenues over the year in which incurred and, in the case of advertising production costs, when the commercial is first aired. To the extent that contributions to the Carl’s Jr. Fund exceed advertising and promotional expenditures, the unspent contributions are recorded as a liability included in other current liabilities in our accompanying Consolidated Balance Sheets. Our contributions to the Hardee’s Funds are expensed as incurred. Since we act solely as an agent with respect to franchisee contributions, we do not reflect franchisee contributions to the Carl’s Jr. Fund or the Hardee’s Funds in our Consolidated Statements of Operations and Cash Flows.
F-12
Table of Contents
CKE INC. AND SUBSIDIARIES
NOTES TO CONSOLIDATED FINANCIAL STATEMENTS (Continued)
Share-Based Compensation
We issue equity-based awards to our executive management team, certain key employees, and directors under our equity-based compensation plans. Under the fair value recognition provisions of the authoritative guidance for equity-based compensation awards, we measure the fair value of equity-based awards at the grant date and the fair value is recognized as expense over the requisite service period.
Our Successor equity-based compensation structure includes time vesting profit sharing interests (“Units”) and performance vesting Units. We recognize compensation expense relating to the time vesting Units ratably over the requisite service period for the entire award. The performance vesting Units can vest either through meeting a performance and service condition or meeting a service, market and performance condition. We record compensation expense for performance vesting Units when we deem the achievement of the performance goals to be probable. We recognize compensation expense for each separately vesting portion of the performance vesting Units over the requisite service period that is determined to be the most likely outcome.
Our share-based compensation structure in effect as of January 31, 2012 is described more fully in Note 18.
Loss Contingencies
We routinely assess loss contingencies to develop estimates of likelihood of loss and range of possible settlement. Those loss contingencies that are deemed to be probable, and for which the amount of expected loss is reasonably estimable, are accrued in our accompanying Consolidated Financial Statements. We do not record liabilities for losses we believe are only reasonably possible to result in an adverse outcome. See Note 15 for further discussion.
Self-Insurance
We are self-insured for a portion of our current and prior years’ losses related to workers’ compensation, general and auto liability insurance programs. We generally have stop-loss insurance for individual workers’ compensation and general liability claims over $500 and auto liability claims over $250; however, our retained risk is substantially higher for a small number of older claims. Accrued liabilities for self-insurance are recorded based on the present value of actuarial estimates of the amounts of incurred and unpaid losses, based on an estimated risk-free interest rate of 2.75% as of January 31, 2012. In determining our estimated liability, management, with the assistance of our actuary, develops assumptions based on the average historical losses on claims we have incurred, actuarial observations of historical claim loss development, and our actuary’s estimate of unpaid losses for each loss category. As of January 31, 2012 and 2011, our estimated liability for self-insured workers’ compensation, general and auto liability losses was $41,466 and $39,581, respectively.
Facility Action Charges
From time to time, we identify under-performing restaurants that have carrying values in excess of their fair values and, as a result, we may record impairment charges. We may also close or refranchise these or other restaurants and lease or sublease the restaurant property to a franchisee or to a business other than one of our restaurant concepts. The financial statement impact resulting from these and similar actions are recorded in our accompanying Consolidated Statements of Operations as facility action charges, net and include:
| (i) | impairment of restaurant-level long-lived assets for under-performing restaurants to be disposed of or held and used; |
| (ii) | store closure costs, including subleasing of closed facilities at amounts below our primary lease obligations; and |
| (iii) | gain or loss on the sale of restaurants and refranchising transactions. |
F-13
Table of Contents
CKE INC. AND SUBSIDIARIES
NOTES TO CONSOLIDATED FINANCIAL STATEMENTS (Continued)
Considerable management judgment is necessary to estimate future cash flows, including cash flows from continuing use, terminal value, closure costs, expected sublease income and refranchising proceeds. Accordingly, actual results could vary significantly from our estimates.
(i) Impairment of Restaurant-Level Long-Lived Assets
During the second and fourth quarter of each fiscal year, and whenever events or circumstances indicate that the carrying value of assets may be impaired, we evaluate our restaurant-level long-lived assets for impairment.
For purposes of impairment testing, assets are grouped at the lowest level for which identifiable cash flows are largely independent of the cash flows of other assets and liabilities, which is generally the individual restaurant level for fixed assets, capital lease assets and favorable leases. For each asset group, we evaluate whether there are indicators of impairment such as sequential annual cash flow losses or adverse changes in the physical condition or expected use of the asset group. When indicators of impairment exist, we evaluate whether the assets are recoverable by comparing the undiscounted future cash flows that we expect to generate from their use and disposal to their carrying value. Restaurant-level assets that are not deemed to be recoverable are written down to their estimated fair value, which is determined by assessing the highest and best use of the assets and the amounts that would be received for such assets in an orderly transaction between market participants.
In connection with our impairment analyses, we make certain estimates and assumptions, including estimates of future cash flows, assumptions of future same-store sales and projected operating expenses for each of our restaurants over their estimated useful life in order to evaluate recoverability and estimate fair value. Future cash flows are estimated based upon experience gained, current intentions about refranchising restaurants and closures, recent and expected sales trends, internal plans, the period of time since the restaurant was opened or remodeled, the maturity of the related market and other relevant information. We generally estimate the useful life of restaurants on owned property to be 20 to 40 years and estimate the useful life of restaurants subject to leases to range from the end of the lease term then in effect to the end of such lease term including option periods. If our future cash flows or same-store sales do not meet or exceed our forecasted levels, or if restaurant operating cost increases exceed our forecast and we are unable to recover such costs through price increases, the carrying value of certain of our restaurants may prove to be unrecoverable, and we may incur additional impairment charges in the future.
(ii) Store Closure Costs
We typically make decisions to close restaurants based on prospects for estimated future profitability. However, sometimes we are forced to close restaurants due to circumstances beyond our control (e.g., a landlord’s refusal to negotiate a new lease). When restaurants continue to perform poorly, we consider a number of factors, including the demographics of the location and the likelihood of being able to improve an unprofitable restaurant. Based on the operators’ judgment and a financial review, we estimate the future cash flows. If we determine that the restaurant will not, within a reasonable period of time, operate at break-even cash flow or be profitable, and we are not contractually obligated to continue operating the restaurant, we may decide to close the restaurant.
The estimated liability for closed restaurants is based on the future lease payments and other contractual obligations for such properties until the lease has been abated. The amount of the estimated liability established is the present value of these estimated future payments, net of the present value of expected sublease income. The interest rate used to calculate the present value of these liabilities is based on an estimated credit-adjusted risk-free rate at the time the liability is established. This estimated credit-adjusted risk-free rate was 10.0% as of January 31, 2012. We amortize the discount over the expected term of the lease and record the discount
F-14
Table of Contents
CKE INC. AND SUBSIDIARIES
NOTES TO CONSOLIDATED FINANCIAL STATEMENTS (Continued)
amortization within facility action charges, net in our accompanying Consolidated Statements of Operations. Subsequent adjustments to the liability as a result of changes in estimates of sublease income, lease cancellations and other changes are recorded to expense in the period incurred.
(iii) Gain or Loss on the Sale of Restaurants
We record gains and losses on the sale of restaurants as the difference between the net proceeds received and net carrying values of the net assets of the restaurants sold.
Income Taxes
Our current provision for income taxes is based on our estimated taxable income in each of the jurisdictions in which we operate, after considering the impact on our taxable income of temporary differences resulting from disparate treatment of items, such as depreciation, estimated liabilities for closed restaurants, estimated liabilities for self-insurance, tax credits and net operating losses (“NOL”) for tax and financial reporting purposes. We record deferred income taxes for the estimated future income tax effect of temporary differences between the financial and tax bases of assets and liabilities using the asset and liability method. Deferred income tax assets are also recorded for NOL and income tax credit carryforwards. A valuation allowance to reduce the carrying amount of deferred income tax assets is established when it is more likely than not that we will not realize some portion or all of the tax benefit of our deferred income tax assets. We evaluate, on a quarterly basis, whether it is more likely than not that our deferred income tax assets are realizable. In performing this analysis, we consider all available evidence, both positive and negative, including historical operating results, the estimated timing of future reversals of existing taxable temporary differences, estimated future taxable income exclusive of reversing temporary differences and carryforwards and potential tax planning strategies that may be employed to prevent operating loss or tax credit carryforwards from expiring unused. Deferred income tax assets and liabilities are measured using enacted tax rates expected to apply to taxable income in the years in which those temporary differences are expected to be recovered or settled. The effect on deferred income tax assets and liabilities of a change in tax rates is recognized in income in the period that includes the enactment date.
From time to time, we may take positions for filing our tax returns which may differ from the treatment of the same item for financial reporting purposes. The ultimate outcome of these items will not be known until the Internal Revenue Service (“IRS”), or similar state taxing authority, has completed its examination or until the statute of limitations has expired.
We maintain a liability for underpayment of income taxes and related interest and penalties, if any, related to uncertain income tax positions. The tax benefit from an uncertain tax position is recognized either upon expiration of the statutory audit period or when it is more likely than not that the position will be sustained upon examination, including resolutions of any related appeals or litigation processes, based on the technical merits. Our policy on the classification of interest and penalties related to the underpayment of income taxes and uncertain tax positions is to record interest in interest expense, and to record penalties, if any, in general and administrative expense, in our accompanying Consolidated Statements of Operations. Accrued interest and penalties are included in our liability for uncertain tax positions.
F-15
Table of Contents
CKE INC. AND SUBSIDIARIES
NOTES TO CONSOLIDATED FINANCIAL STATEMENTS (Continued)
Income or Loss Per Share
Basic income or loss per common share represents the income or loss attributable to common stockholders divided by the weighted-average common shares outstanding. Diluted income or loss per common share is not presented, as we had no potentially dilutive securities during either the Successor twenty-nine weeks ended January 31, 2011 or fiscal 2012. The following table represents the calculations of basic loss per share:
| Successor | ||||||||
| Fiscal 2012 | Twenty-Nine Weeks Ended January 31, 2011 |
|||||||
| Net loss attributable to common stockholders |
$ | (19,279 | ) | $ | (27,890 | ) | ||
|
|
|
|
|
|||||
| Weighted-average common shares outstanding |
100 | 100 | ||||||
|
|
|
|
|
|||||
| Basic loss per common share |
$ | (192,790 | ) | $ | (278,900 | ) | ||
|
|
|
|
|
|||||
Derivative Financial Instruments
We do not use derivative instruments for trading purposes. As of January 31, 2012, we did not have any derivative instruments. For periods prior to the Merger, we had interest rate swap agreements with various counterparties.
We recognized all derivative instruments at fair value as either assets or liabilities on our balance sheet. The fair value of the derivative financial instruments was determined using valuation models that were based on the net present value of estimated future cash flows and incorporated market data inputs. We did not designate our interest rate swap agreements as hedging instruments. Accordingly, the gain or loss as a result of the change in fair value was recognized in our results of operations immediately. See Note 9 for a discussion of our use of interest rate swap agreements.
Credit Risks
Accounts receivable consists primarily of amounts due from franchisees for initial and continuing fees. In addition, we have notes and lease receivables from certain of our franchisees. The financial condition of these franchisees is largely dependent upon the underlying business trends of our brands. This concentration of credit risk is mitigated, in part, by the large number of franchisees of each brand and the short-term nature of the franchise fee receivables.
Distributor Concentration Risk
We currently rely on Meadowbrook Meat Company, Inc. (“MBM”) to distribute food, packing and supplies to our Carl’s Jr. and Hardee’s restaurants. Although we could use alternative distributors, a change in distributor, could cause a delay in receipt of food, packaging or supplies and possibly result in loss of sales, which could adversely impact our results of operations.
Comprehensive Income
We did not have any items of other comprehensive income during fiscal 2012, the Successor twenty-nine weeks ended January 31, 2011, the Predecessor twenty-four weeks ended July 12, 2010 and fiscal 2010.
F-16
Table of Contents
CKE INC. AND SUBSIDIARIES
NOTES TO CONSOLIDATED FINANCIAL STATEMENTS (Continued)
Segment Information
Operating segments are defined as components of an enterprise for which separate financial information is available that is evaluated regularly by the chief operating decision maker in deciding how to allocate resources and in assessing performance. Our segments are determined at the brand level (see Note 22).
Financial Statement Misstatement Evaluation
We apply the provisions of Staff Accounting Bulletin (“SAB”) 108, Considering the Effects of Prior Year Misstatements when Quantifying Misstatements in Current Year Financial Statements. SAB 108 provides interpretive guidance on how the effects of the carryover or reversal of prior year misstatements should be considered in quantifying a current year misstatement for the purpose of the materiality assessment.
Subsequent Events
Subsequent events have been evaluated up through May 17, 2012, the date that these consolidated financial statements were issued.
NOTE 2—ACQUISITION OF PREDECESSOR
The acquisition of Predecessor was accounted for as a business combination using the acquisition method of accounting, whereby the purchase price was allocated to tangible and intangible assets acquired and liabilities assumed, based on their estimated fair market values. Fair-value measurements were applied based on assumptions that market participants would have used in the pricing of the asset or liability. During the second quarter of fiscal 2012, we completed our accounting for the acquisition of Predecessor. The following table summarizes the fair values assigned to the net assets acquired as of the July 12, 2010 acquisition date:
| Total consideration: |
||||
| Cash paid to shareholders |
$ | 704,065 | ||
| Less: post-combination share-based compensation expense (see Note 18) |
(10,587 | ) | ||
|
|
|
|||
| Total purchase price consideration |
693,478 | |||
|
|
|
|||
| Fair value of assets acquired and liabilities assumed: |
||||
| Cash and cash equivalents |
25,724 | |||
| Accounts receivable(1) |
39,762 | |||
| Inventories |
13,956 | |||
| Deferred income tax assets, net—current |
19,872 | |||
| Other current assets |
36,372 | |||
| Notes receivable—current and long-term(2) |
2,311 | |||
| Property and equipment(3) |
694,205 | |||
| Intangible assets |
457,001 | |||
| Other assets |
5,363 | |||
| Long-term debt—current and long-term |
(271,505 | ) | ||
| Capital lease obligations—current and long-term |
(52,922 | ) | ||
| Accounts payable |
(54,811 | ) | ||
| Deferred income tax liabilities, net—long-term |
(165,456 | ) | ||
| Unfavorable lease obligations |
(96,356 | ) | ||
| Other liabilities—current and long-term(4) |
(167,855 | ) | ||
|
|
|
|||
| Net assets acquired |
485,661 | |||
|
|
|
|||
| Excess purchase price attributed to goodwill acquired |
$ | 207,817 | ||
|
|
|
F-17
Table of Contents
CKE INC. AND SUBSIDIARIES
NOTES TO CONSOLIDATED FINANCIAL STATEMENTS (Continued)
| (1) | The gross amount due under accounts receivable acquired is $40,081, of which $319 was expected to be uncollectible. |
| (2) | The gross amount due under notes receivable acquired is $5,947, of which $3,636 was expected to be uncollectible. |
| (3) | The estimated fair value of property and equipment acquired consisted of $231,916 of land, $87,709 of leasehold improvements, $223,751 of buildings and improvements, $111,091 of equipment, furniture and fixtures, and $39,738 of capital leases. |
| (4) | Litigation reserves of $2,305 are included within other current liabilities. Since the acquisition date fair value of these contingent liabilities could not be determined during the measurement period, we recorded an accrued liability for litigation contingencies with a probable likelihood of loss and for which the range of loss was reasonably estimable. |
At the time of the Merger, the Company believed its market position and future growth potential for both company-operated and franchised restaurants were the primary factors that contributed to a total purchase price that resulted in the recognition of goodwill. There was $45,939 of goodwill recognized in connection with the Merger that had carryover basis from previous acquisitions and was expected to be deductible for federal income tax purposes.
Transaction Costs
We recorded $545, $20,003 and $13,691 in transaction-related costs for accounting, investment banking, legal and other costs in connection with the Transactions within other operating expenses, net in our accompanying Consolidated Statements of Operations for fiscal 2012, the Successor twenty-nine weeks ended January 31, 2011 and the Predecessor twenty-four weeks ended July 12, 2010, respectively. Additionally, we recorded a termination fee for a prior merger agreement (“Prior Merger Agreement”) of $9,283 and $5,000 in reimbursable costs within other (expense) income, net in our accompanying Consolidated Statement of Operations for the Predecessor twenty-four weeks ended July 12, 2010.
Pro Forma Financial Information (Unaudited)
The following unaudited pro forma results of operations assume that the Transactions had occurred on February 1, 2010 for fiscal 2011, after giving effect to acquisition accounting adjustments relating to depreciation and amortization of the revalued assets, interest expense associated with the Credit Facility and the Senior Secured Notes, and other acquisition-related adjustments in connection with the Transactions. These unaudited pro forma results exclude transaction-related costs and share-based compensation expense related to the acceleration of stock options and restricted stock awards in connection with the Merger. Additionally, the following unaudited pro forma results of operations do not give effect to the sale of our Carl’s Jr. distribution center assets on July 2, 2010. This unaudited pro forma information should not be relied upon as necessarily being indicative of the historical results that would have been obtained if the Transactions had actually occurred on those dates, nor of the results that may be obtained in the future.
| Pro Forma Fiscal 2011 |
||||
| Total revenue |
$ | 1,332,802 | ||
| Net loss |
(7,075 | ) | ||
F-18
Table of Contents
CKE INC. AND SUBSIDIARIES
NOTES TO CONSOLIDATED FINANCIAL STATEMENTS (Continued)
NOTE 3—ACCOUNTING PRONOUNCEMENTS NOT YET ADOPTED AND ADOPTION OF NEW ACCOUNTING PRONOUNCEMENTS
In January 2010, the Financial Accounting Standards Board (“FASB”) issued new authoritative guidance to require additional disclosures for fair value measurements including the following: (1) amounts transferred in and out of Level 1 and 2 fair value measurements, which is effective for interim and annual reporting periods beginning after December 15, 2009 (“Part I”), and (2) activities in Level 3 fair value measurements including purchases, sales, issuances and settlements, which is effective for interim and annual reporting periods beginning after December 15, 2010 (“Part II”). Our adoption of Part I and II of the revised guidance for fair value measurements disclosures as of the beginning of fiscal 2011 and fiscal 2012, respectively, did not have a material effect on our Consolidated Financial Statements.
In May 2011, the FASB issued new authoritative guidance to provide a consistent definition of fair value and ensure that fair value measurements and disclosure requirements are similar between GAAP and International Financial Reporting Standards. This guidance changes certain fair value measurement principles and enhances the disclosure requirements for fair value measurements. This guidance is effective for interim and annual periods beginning after December 15, 2011 and is applied prospectively. We do not expect that the adoption of this guidance will have a material impact on our Consolidated Financial Statements.
In September 2011, the FASB updated its guidance on the annual testing of goodwill for impairment to allow companies to first assess qualitative factors to determine whether it is necessary to perform the two-step goodwill impairment test. If an entity determines, based on qualitative factors, that it is not more likely than not that a reporting unit’s fair value is less than its carrying amount, then it is not required to perform the quantitative two-step goodwill impairment test. This guidance is effective for annual and interim goodwill impairment tests performed for fiscal years beginning after December 15, 2011 with early adoption permitted. The provisions of this guidance will apply to CKE beginning in fiscal 2013 since we did not early adopt this guidance. We do not expect that the adoption of this guidance will have a material impact on our Consolidated Financial Statements.
NOTE 4—ACCOUNTS RECEIVABLE, NET AND NOTES RECEIVABLE, NET
Accounts receivable, net, as of January 31, 2012 and 2011 consisted of the following:
| Successor | ||||||||
| 2012 | 2011 | |||||||
| Trade receivables |
$ | 21,824 | $ | 20,524 | ||||
| Taxes receivable |
406 | 2,415 | ||||||
| Notes receivable, current portion |
1,698 | 4,509 | ||||||
| Other |
209 | 177 | ||||||
| Allowance for doubtful accounts |
(38 | ) | (92 | ) | ||||
|
|
|
|
|
|||||
| $ | 24,099 | $ | 27,533 | |||||
|
|
|
|
|
|||||
The long-term portion of notes receivable, net, as of January 31, 2012 and 2011 consisted of the following:
| Successor | ||||||||
| 2012 | 2011 | |||||||
| Notes receivable |
$ | 20 | $ | 172 | ||||
| Allowance for doubtful accounts |
(20 | ) | — | |||||
|
|
|
|
|
|||||
| $ | — | $ | 172 | |||||
|
|
|
|
|
|||||
F-19
Table of Contents
CKE INC. AND SUBSIDIARIES
NOTES TO CONSOLIDATED FINANCIAL STATEMENTS (Continued)
The following table summarizes the activity in the allowances for doubtful accounts:
| Accounts Receivable |
Notes Receivable |
Total | ||||||||||
| Predecessor: |
||||||||||||
| Balance as of January 31, 2009 |
$ | 720 | $ | 529 | $ | 1,249 | ||||||
| Recovery of provision |
(62 | ) | (150 | ) | (212 | ) | ||||||
| Charge-offs |
(300 | ) | — | (300 | ) | |||||||
|
|
|
|
|
|
|
|||||||
| Balance as of January 31, 2010 |
358 | 379 | 737 | |||||||||
| Recovery of provision |
(77 | ) | (23 | ) | (100 | ) | ||||||
| Charge-offs |
(84 | ) | — | (84 | ) | |||||||
|
|
|
|
|
|
|
|||||||
| Balance as of July 12, 2010(1) |
$ | 197 | $ | 356 | $ | 553 | ||||||
|
|
|
|
|
|
|
|||||||
| Successor: |
||||||||||||
| Opening balance(1) |
$ | — | $ | — | $ | — | ||||||
| Provision |
127 | — | 127 | |||||||||
| Charge-offs |
(35 | ) | — | (35 | ) | |||||||
|
|
|
|
|
|
|
|||||||
| Balance as of January 31, 2011 |
92 | — | 92 | |||||||||
| Provision |
109 | 20 | 129 | |||||||||
| Charge-offs |
(163 | ) | — | (163 | ) | |||||||
|
|
|
|
|
|
|
|||||||
| Balance as of January 31, 2012 |
$ | 38 | $ | 20 | $ | 58 | ||||||
|
|
|
|
|
|
|
|||||||
| (1) | In acquisition accounting, we adjusted our accounts and notes receivable to fair value resulting in the elimination of historical allowances for doubtful accounts. |
NOTE 5—PROPERTY AND EQUIPMENT, NET
Property and equipment, net, consisted of the following as of January 31, 2012 and 2011:
| Successor | ||||||||||||
| Estimated Useful Life |
2012 | 2011 | ||||||||||
| Land |
$ | 230,797 | $ | 231,601 | ||||||||
| Leasehold improvements |
3-25 years | 114,156 | 97,645 | |||||||||
| Buildings and improvements |
3-40 years | 232,373 | 230,136 | |||||||||
| Equipment, furniture and fixtures |
3-10 years | 143,899 | 117,154 | |||||||||
| Capital leases |
3-33 years | 41,337 | 39,794 | |||||||||
|
|
|
|
|
|||||||||
| 762,562 | 716,330 | |||||||||||
| Less: accumulated depreciation and amortization(1) |
(117,010 | ) | (39,980 | ) | ||||||||
|
|
|
|
|
|||||||||
| $ | 645,552 | $ | 676,350 | |||||||||
|
|
|
|
|
|||||||||
| (1) | The accumulated amortization related to capital leases was $9,893 and $3,638, as of January 31, 2012 and 2011, respectively. |
Depreciation and amortization expense related to property and equipment for fiscal 2012, the Successor twenty-nine weeks ended January 31, 2011, the Predecessor twenty-four weeks ended July 12, 2010 and fiscal 2010 was $78,989, $40,220, $33,673 and $71,086, respectively. Amortization of property under capital leases is included within depreciation and amortization expense.
F-20
Table of Contents
CKE INC. AND SUBSIDIARIES
NOTES TO CONSOLIDATED FINANCIAL STATEMENTS (Continued)
During fiscal 2012, the Successor twenty-nine weeks ended January 31, 2011, the Predecessor twenty-four weeks ended July 12, 2010 and fiscal 2010, we capitalized interest costs in the amounts of $461, $414, $282 and $766, respectively.
During the Successor twenty-nine weeks ended January 31, 2011, we wrote off capitalized software costs of $3,501, which is included in general and administrative expense in our accompanying Consolidated Statement of Operations.
NOTE 6—PURCHASE AND SALE OF ASSETS
Purchase of Restaurant Assets
During fiscal 2012, we purchased three Hardee’s restaurants from one of our franchisees for the aggregate purchase price consideration of $1,500, which was reduced by the settlement of certain pre-existing liabilities, resulting in a net purchase price consideration of $1,207. As a result of this transaction, we recorded property and equipment (including capital lease assets) of $109, identifiable intangible assets of $85 and capital lease obligations of $55, resulting in $1,068 of additional goodwill in our Hardee’s operating segment.
During fiscal 2010, we purchased two Carl’s Jr. restaurants from two of our franchisees for $1,041. As a result of these transactions, we recorded inventories of $15, property and equipment of $122, identifiable intangible assets of $3, and goodwill of $901 in our Carl’s Jr. operating segment.
Sale of Assets
On July 2, 2010, pursuant to an Asset Purchase Agreement (“APA”) with MBM, we sold to MBM our Carl’s Jr. distribution center assets located in Ontario, California and Manteca, California. In connection with the APA, we received total consideration of $21,195 from MBM for the Carl’s Jr. distribution center assets, which included inventory, fixed assets, real property in Manteca, California, and other related assets. Additionally, we entered into sublease agreements with MBM to sublease the facility in Ontario, California, as well as certain leased vehicles and equipment. We will remain principally liable for the lease obligations. We also remain liable for all liabilities incurred prior to the sale, which include workers’ compensation claims, employment related matters and litigation, and other liabilities. As a result of the transaction, we recorded a gain of $3,442, which is included in other operating expenses, net in our accompanying Consolidated Statement of Operations for the Predecessor twenty-four weeks ended July 12, 2010.
On July 2, 2010, we and our franchisees entered into distribution agreements with MBM to provide distribution services to our Carl’s Jr. and Hardee’s restaurants through June 30, 2017.
Related Party Transactions
During fiscal 2010, we sold three company-operated Carl’s Jr. restaurants and related real property with a net book value of $965 to a former executive and new franchisee. In connection with this transaction, we received aggregate consideration of $1,300, including $100 in initial franchise fees, which is included in franchised restaurants and other revenue, and we recognized a net gain of $233, which is included in facility action charges, net, in our accompanying Consolidated Statement of Operations for fiscal 2010, in our Carl’s Jr. operating segment. As part of this transaction, the franchisee acquired the real property and/or subleasehold interest in the real property related to the restaurant locations.
F-21
Table of Contents
CKE INC. AND SUBSIDIARIES
NOTES TO CONSOLIDATED FINANCIAL STATEMENTS (Continued)
NOTE 7—GOODWILL AND INTANGIBLE ASSETS, NET
The following table sets forth changes in our goodwill during fiscal 2012:
| Carl’s Jr. | Hardee’s | Total | ||||||||||
| Successor: |
||||||||||||
| Balance at January 31, 2011(1) |
$ | 199,166 | $ | 8,651 | $ | 207,817 | ||||||
| Additions |
— | 1,068 | 1,068 | |||||||||
|
|
|
|
|
|
|
|||||||
| Balance at January 31, 2012 |
$ | 199,166 | $ | 9,719 | $ | 208,885 | ||||||
|
|
|
|
|
|
|
|||||||
| (1) | There were no accumulated goodwill impairment losses for the Carl’s Jr. or Hardee’s reporting units as of January 31, 2011. |
The table below presents our intangible assets as of January 31, 2012 and 2011:
| Successor | ||||||||||||||||||||||||||||
| 2012 | 2011 | |||||||||||||||||||||||||||
| Weighted Average Life (Years) |
Gross Carrying Amount |
Accumulated Amortization |
Net Carrying Amount |
Gross Carrying Amount |
Accumulated Amortization |
Net Carrying Amount |
||||||||||||||||||||||
| Trademarks/ Tradenames |
Indefinite | $ | 278,000 | $ | — | $ | 278,000 | $ | 278,000 | $ | — | $ | 278,000 | |||||||||||||||
| Favorable lease agreements |
13 | 88,299 | (14,472 | ) | 73,827 | 90,181 | (5,313 | ) | 84,868 | |||||||||||||||||||
| Franchise agreements |
20 | 88,085 | (6,773 | ) | 81,312 | 88,000 | (2,369 | ) | 85,631 | |||||||||||||||||||
|
|
|
|
|
|
|
|
|
|
|
|
|
|||||||||||||||||
| $ | 454,384 | $ | (21,245 | ) | $ | 433,139 | $ | 456,181 | $ | (7,682 | ) | $ | 448,499 | |||||||||||||||
|
|
|
|
|
|
|
|
|
|
|
|
|
|||||||||||||||||
Amortization expense related to these intangible assets for fiscal 2012, the Successor twenty-nine weeks ended January 31, 2011, the Predecessor twenty-four weeks ended July 12, 2010 and fiscal 2010 was $14,335, $7,724, $116 and $216, respectively. Our estimated future amortization expense related to these intangible assets is set forth as follows:
| Fiscal: |
||||
| 2013 |
$ | 13,569 | ||
| 2014 |
12,649 | |||
| 2015 |
11,559 | |||
| 2016 |
10,977 | |||
| 2017 |
10,523 | |||
| Thereafter |
95,862 | |||
|
|
|
|||
| $ | 155,139 | |||
|
|
|
F-22
Table of Contents
CKE INC. AND SUBSIDIARIES
NOTES TO CONSOLIDATED FINANCIAL STATEMENTS (Continued)
NOTE 8—OTHER CURRENT LIABILITIES
Other current liabilities as of January 31, 2012 and 2011 consisted of the following:
| Successor | ||||||||
| 2012 | 2011 | |||||||
| Salaries, wages and other benefits |
$ | 32,019 | $ | 29,923 | ||||
| Estimated liability for self-insurance, current portion |
12,057 | 11,582 | ||||||
| State sales taxes |
6,399 | 6,712 | ||||||
| Accrued property taxes |
6,088 | 5,684 | ||||||
| Gift card liabilities |
5,549 | 5,023 | ||||||
| Accrued utilities |
3,029 | 3,259 | ||||||
| Accrued interest |
2,650 | 3,147 | ||||||
| Estimated liability for litigation |
2,409 | 2,405 | ||||||
| Estimated liability for closed restaurants, current portion |
1,604 | 2,023 | ||||||
| Deferred franchise and development fees |
1,064 | 355 | ||||||
| Other accrued liabilities |
11,642 | 11,845 | ||||||
|
|
|
|
|
|||||
| $ | 84,510 | $ | 81,958 | |||||
|
|
|
|
|
|||||
NOTE 9—LONG-TERM DEBT
Long-term debt as of January 31, 2012 and 2011 consisted of the following:
| Successor | ||||||||
| 2012 | 2011 | |||||||
| Borrowings under senior secured revolving credit facility (Credit Facility) |
$ | — | $ | — | ||||
| Senior secured second lien notes due 2018 (Senior Secured Notes)(1) |
523,252 | 589,011 | ||||||
| Senior unsecured PIK toggle notes due 2016 (Toggle Notes)(2) |
198,093 | — | ||||||
| Other long-term debt |
389 | 1,005 | ||||||
|
|
|
|
|
|||||
| Long-term debt |
721,734 | 590,016 | ||||||
| Less current portion |
(3 | ) | (29 | ) | ||||
|
|
|
|
|
|||||
| Long-term debt, less current portion |
$ | 721,731 | $ | 589,987 | ||||
|
|
|
|
|
|||||
| (1) | As of January 31, 2012 and 2011, the outstanding principal amount of the Senior Secured Notes of $532,122 and $600,000, respectively, is presented net of the unamortized discount on the Senior Secured Notes of $8,870 and $10,989, respectively. |
| (2) | As of January 31, 2012, the outstanding principal amount of the Toggle Notes of $201,365 is presented net of the unamortized discount on the Toggle Notes of $3,272. |
F-23
Table of Contents
CKE INC. AND SUBSIDIARIES
NOTES TO CONSOLIDATED FINANCIAL STATEMENTS (Continued)
The aggregate maturities of our long-term debt, excluding the effects of discount accretion, are as follows:
| Fiscal: |
||||
| 2013 |
$ | 3 | ||
| 2014 |
4 | |||
| 2015 |
4 | |||
| 2016 |
4 | |||
|
2017(1) |
329,526 | |||
| Thereafter |
532,491 | |||
|
|
|
|||
| $ | 862,032 | |||
|
|
|
| (1) | The aggregate maturities for fiscal 2017 include the Toggle Notes. For the purposes of this table, we have assumed that all future interest payments on the Toggle Notes will be paid entirely in PIK Interest, resulting in all interest being added to the principal amount of the Toggle Notes and due at maturity on March 14, 2016. |
Senior Secured Credit Facility
On July 12, 2010, CKE Restaurants entered into the Credit Facility, which provides for senior secured revolving facility loans, swingline loans and letters of credit, in an aggregate amount of up to $100,000. The Credit Facility bears interest at a rate equal to, at our option, either: (1) the higher of Morgan Stanley’s “prime rate” plus 2.75% or the federal funds rate, as defined in our Credit Facility, plus 3.25%, or (2) the London Interbank Offered Rate (“LIBOR”) plus 3.75%. Our Credit Facility requires us to pay a commitment fee of 0.75% per annum for unused commitments. The Credit Facility matures on July 12, 2015, at which time all outstanding revolving facility loans and accrued and unpaid interest must be repaid. As of January 31, 2012, we had no outstanding loan borrowings, $30,913 of outstanding letters of credit, and remaining availability of $69,087 under our Credit Facility.
All obligations under the Credit Facility are unconditionally guaranteed by CKE, and by CKE Restaurants’ existing and future wholly-owned domestic subsidiaries. In addition, all obligations are secured by (1) CKE Restaurants’ common stock, and (2) substantially all of CKE Restaurants’ material owned assets and the material owned assets of the subsidiary guarantors.
Pursuant to the terms of our Credit Facility, during each fiscal year the capital expenditures of CKE Restaurants and its consolidated subsidiaries cannot exceed the sum of (1) the greater of (i) $100,000 and (ii) 8.5% of the consolidated gross total tangible assets of CKE Restaurants and its consolidated subsidiaries as of the end of such fiscal year plus, without duplication, (2) 10% of certain assets acquired in permitted acquisitions during such fiscal year (the “Acquired Assets Amount”) and, (3) 5% of the Acquired Assets Amount for the preceding fiscal year, calculated on a cumulative basis. In addition, the annual base amount of permitted capital expenditures may be increased by an amount equal to any cumulative credit (as defined in the Credit Facility) which we elect to apply for this purpose and may be carried-back and/or carried-forward subject to the terms set forth in the Credit Facility.
The terms of our Credit Facility also include financial performance covenants applicable to CKE Restaurants and its consolidated subsidiaries, which include a maximum secured leverage ratio and a specified minimum interest coverage ratio. As of January 31, 2012, the financial performance covenants contained in the Credit Facility did not limit our ability to draw on the remaining availability of $69,087 under our Credit Facility.
The Credit Facility also contains covenants that restrict the ability of CKE Restaurants and its consolidated subsidiaries to: incur additional indebtedness; pay dividends on CKE Restaurants’ capital stock or redeem,
F-24
Table of Contents
CKE INC. AND SUBSIDIARIES
NOTES TO CONSOLIDATED FINANCIAL STATEMENTS (Continued)
repurchase or retire CKE Restaurants’ capital stock or indebtedness; make investments, loans, advances and acquisitions; create restrictions on the payment of dividends or other amounts to CKE Restaurants from its subsidiaries; sell assets, including capital stock of CKE Restaurants’ subsidiaries; consolidate or merge; create liens; enter into sale and leaseback transactions; amend, modify or permit the amendment or modification of any senior secured second lien note documents; engage in certain transactions with CKE Restaurants’ affiliates; issue capital stock; create subsidiaries; and change the business conducted by CKE Restaurants or its subsidiaries.
Senior Secured Second Lien Notes
In connection with the Merger, on July 12, 2010, CKE Restaurants issued $600,000 aggregate principal amount of senior secured second lien notes in a private placement to qualified institutional buyers, which Senior Secured Notes were exchanged in December 2010 for substantially identical Senior Secured Notes that were registered with the United States Securities and Exchange Commission (“SEC”). The Senior Secured Notes bear interest at a rate of 11.375% per annum, payable semi-annually in arrears on January 15 and July 15. The Senior Secured Notes were issued with an original issue discount of 1.915%, or $11,490, and are recorded as long-term debt, net of original issue discount, in our Consolidated Balance Sheets as of January 31, 2012 and January 31, 2011. The original issue discount and deferred financing costs associated with the issuance of the Senior Secured Notes are amortized to interest expense over the term of the Senior Secured Notes. The Senior Secured Notes mature on July 15, 2018.
Each of CKE Restaurants’ wholly-owned domestic subsidiaries that guarantee the obligations under the Credit Facility also guarantee the performance and punctual payment when due, whether at stated maturity, by acceleration or otherwise, of all obligations under the Senior Secured Notes. CKE Restaurants’ obligations and the obligations of the guarantors are secured by a second-priority lien on the assets that secure CKE Restaurants’ and its subsidiary guarantors’ obligations under our Credit Facility, subject to certain exceptions and permitted liens.
The indenture governing the Senior Secured Notes contains restrictive covenants that limit CKE Restaurants’ and its guarantor subsidiaries’ ability to, among other things: incur or guarantee additional debt or issue certain preferred equity; pay dividends, make capital stock distributions or other restricted payments; make certain investments; sell certain assets; create or incur liens on certain assets to secure debt; consolidate, merge, sell or otherwise dispose of all or substantially all of the assets of CKE Restaurants and its subsidiaries; enter into certain transactions with affiliates; and designate subsidiaries as unrestricted subsidiaries. Failure to comply with these covenants constitutes a default and may lead to the acceleration of the principal amount and accrued but unpaid interest on the Senior Secured Notes.
We may redeem the Senior Secured Notes prior to the maturity date based upon the following conditions: (1) prior to July 15, 2013, we may redeem up to 35% of the original aggregate principal amount of the Senior Secured Notes with the proceeds of certain equity offerings at a redemption price of 111.375% of the aggregate principal amount of the Senior Secured Notes being redeemed plus accrued and unpaid interest, (2) during each of the 12-month periods beginning July 15, 2012 and July 15, 2013, we may redeem up to $60,000 of the aggregate principal amount of the Senior Secured Notes at a redemption price of 103% of the aggregate principal amount of the Senior Secured Notes being redeemed plus accrued and unpaid interest, (3) on or after July 15, 2014, we may redeem all or any portion of the Senior Secured Notes during the 12-month periods commencing July 15, 2014, July 15, 2015, July 15, 2016 and July 15, 2017 and thereafter at redemption prices of 105.688%, 102.844%, 101.422% and 100%, respectively, of the aggregate principal amount of the Senior Secured Notes being redeemed plus accrued and unpaid interest, and (4) prior to July 15, 2014, we may redeem all or any portion of the Senior Secured Notes at a price equal to 100% of the aggregate principal amount of the Senior Secured Notes being redeemed plus a make-whole premium and accrued and unpaid interest. Upon a change in
F-25
Table of Contents
CKE INC. AND SUBSIDIARIES
NOTES TO CONSOLIDATED FINANCIAL STATEMENTS (Continued)
control, the holders of the Senior Secured Notes each have the right to require us to redeem their Senior Secured Notes at a redemption price of 101% of the aggregate principal amount of the notes being redeemed plus accrued and unpaid interest.
During fiscal 2012, we extinguished through redemptions (in accordance with the terms of the indenture governing the Senior Secured Notes) and an open market purchase a total of $67,878 of the principal amount of the Senior Secured Notes for cash payments of $69,685, plus $1,264 of accrued and unpaid interest. As a result of these transactions, we recognized a loss of $4,188 on the early extinguishment of the Senior Secured Notes during fiscal 2012. Subsequent to the redemptions and purchase of the Senior Secured Notes, and as of January 31, 2012, the principal amount of the Senior Secured Notes outstanding was $532,122.
In accordance with the indenture governing the Senior Secured Notes, we may be required to make offers to repurchase our Senior Secured Notes with a portion of the net proceeds received from sale-leaseback transactions by CKE Restaurants and its consolidated subsidiaries. Pursuant to these requirements, on December 1, 2011, we commenced a tender offer to purchase up to $27,871 of the principal amount of our Senior Secured Notes (“Tender Offer”) at a redemption price of 103%. The Tender Offer expired on December 29, 2011, with no Senior Secured Notes tendered.
Senior Unsecured PIK Toggle Notes
On March 14, 2011, CKE issued $200,000 aggregate principal amount of senior unsecured PIK toggle notes due March 14, 2016 (the “Toggle Notes”). The net proceeds, after payment of offering expenses, were distributed to our corporate parent. The Toggle Notes were issued with an original issue discount of 1.885%, or $3,770. The interest on the Toggle Notes, which is payable semi-annually on March 15 and September 15 of each year, can be paid (1) entirely in cash, at a rate of 10.50% (“Cash Interest”), (2) entirely by increasing the principal amount of the Toggle Notes or by issuing new Toggle Notes for the entire amount of the interest payment, at a rate per annum equal to the cash interest rate of 10.50% plus 0.75% (“PIK Interest”) or (3) with a 25%/75%, 50%/50% or 75%/25% combination of Cash Interest and PIK Interest.
During fiscal 2012, we made our September 15, 2011 interest payment on the Toggle Notes, in the amount of $11,313 entirely in PIK Interest. In addition, CKE Restaurants purchased, in open market transactions, a total of $9,948 principal amount of the Toggle Notes (the “Purchased Toggle Notes”) for $8,362, which represents a weighted average price of 84.06% of the principal amount of the Purchased Toggle Notes, during fiscal 2012. For accounting purposes, the Purchased Toggle Notes were constructively retired at the time of purchase, and we recognized a gain of $1,212 as a result of these transactions. As of January 31, 2012, the remaining aggregate principal amount of the Toggle Notes outstanding was $201,365. We paid the March 15, 2012 and will pay the September 15, 2012 interest payments entirely in PIK Interest.
The indenture governing the Toggle Notes contains restrictive covenants that limit our and our subsidiaries’ ability to, among other things: incur or guarantee additional debt or issue certain preferred equity; pay dividends, make capital distributions or other restricted payments; make certain investments; sell certain assets; create or incur liens on certain assets to secure debt; consolidate, merge, sell or otherwise dispose of all or substantially all of our assets; enter into certain transactions with affiliates; and designate subsidiaries as unrestricted subsidiaries. Failure to comply with these covenants constitutes a default and may lead to acceleration of the principal amount and accrued but unpaid interest on the Toggle Notes.
We may redeem the Toggle Notes prior to the maturity date based upon the following conditions: (1) prior to March 14, 2013, we may redeem up to 35% of the original aggregate principal amount of the Toggle Notes with the proceeds of certain equity offerings at a redemption price of 110.500% of the aggregate principal amount of the Toggle Notes being redeemed plus accrued and unpaid interest, (2) on or after March 14, 2013, we
F-26
Table of Contents
CKE INC. AND SUBSIDIARIES
NOTES TO CONSOLIDATED FINANCIAL STATEMENTS (Continued)
may redeem all or a portion of the Toggle Notes during the 12-month periods commencing March 14, 2013, March 14, 2014 and March 14, 2015 and thereafter at redemption prices of 105.250%, 102.625%, and 100%, respectively, of the aggregate principal amount of the Toggle Notes being redeemed plus accrued and unpaid interest, and (3) prior to March 14, 2013, we may redeem all or a portion of the Toggle Notes at a price equal to 100% of the aggregate principal amount of the Toggle Notes being redeemed plus a make-whole premium and accrued and unpaid interest. Upon a change of control, the holders of the Toggle Notes have the right to require us to redeem their Toggle Notes at a redemption price of 101% of the aggregate principal amount of the Toggle Notes being purchased plus accrued and unpaid interest.
Repayment of Debt and Interest Rate Swap Agreements
In connection with the Merger, we repaid at closing the total principal outstanding balance of the term loan portion of our senior credit facility (“Predecessor Facility”) of $236,487 and the total outstanding borrowings on the revolving portion of our Predecessor Facility of $34,000, as well as all incurred and unpaid interest on our Predecessor Facility. In connection with the Merger, the deferred financing costs related to the Predecessor Facility were removed from our Consolidated Balance Sheet through acquisition accounting. All outstanding letters of credit under the Predecessor Facility were terminated on July 12, 2010.
In connection with the Merger, we settled and paid in full all obligations related to our fixed rate interest rate swap agreements, which totaled $14,844. During the Predecessor twenty-four weeks ended July 12, 2010 and fiscal 2010, we recorded interest expense of $3,113 and $6,803, respectively, under these interest rate swap agreements to adjust their carrying value to fair value. During the Predecessor twenty-four weeks ended July 12, 2010 and fiscal 2010, we paid $3,750 and $8,912, respectively, for net settlements under our interest rate swap agreements.
Interest Expense
Interest expense consisted of the following:
| Successor | Predecessor | |||||||||||||||
| Fiscal 2012 |
Twenty-Nine Weeks Ended January 31, 2011 |
Twenty-Four Weeks Ended July 12, 2010 |
Fiscal 2010 |
|||||||||||||
| Senior secured revolving credit facility |
$ | — | $ | — | $ | — | $ | — | ||||||||
| Senior secured second lien notes |
65,131 | 37,710 | — | — | ||||||||||||
| Senior unsecured PIK toggle notes |
19,898 | — | — | — | ||||||||||||
| Predecessor senior credit facility |
— | — | 2,338 | 5,174 | ||||||||||||
| Amortization of deferred financing costs and discount on notes |
4,821 | 2,089 | 488 | 1,016 | ||||||||||||
| Interest rate swap agreements |
— | — | 3,113 | 6,803 | ||||||||||||
| Capital lease obligations |
4,755 | 3,039 | 2,318 | 5,380 | ||||||||||||
| Financing method sale-leaseback transactions(1) |
1,917 | — | — | — | ||||||||||||
| Letter of credit fees and other |
1,602 | 843 | 360 | 881 | ||||||||||||
|
|
|
|
|
|
|
|
|
|||||||||
| Total interest expense |
$ | 98,124 | $ | 43,681 | $ | 8,617 | $ | 19,254 | ||||||||
|
|
|
|
|
|
|
|
|
|||||||||
| (1) | See Note 11. |
F-27
Table of Contents
CKE INC. AND SUBSIDIARIES
NOTES TO CONSOLIDATED FINANCIAL STATEMENTS (Continued)
NOTE 10—LEASES
We occupy land and buildings under lease agreements expiring on various dates through fiscal 2036. Many leases provide for future rent escalations and renewal options. In addition, contingent rentals, determined as a percentage of revenue in excess of specified levels, are often required. Most leases obligate us to pay costs of maintenance, insurance and property taxes.
We sublease to our franchisees some of our property under capital leases. These assets are recorded as lease receivables and are included in other current assets and other assets instead of property under capital leases.
Net leases receivable consisted of the following as of January 31, 2012 and 2011:
| Successor | ||||||||
| 2012 | 2011 | |||||||
| Lease payments receivable |
$ | 5,468 | $ | 4,707 | ||||
| Less: unearned income |
(2,408 | ) | (2,015 | ) | ||||
|
|
|
|
|
|||||
| 3,060 | 2,692 | |||||||
| Less: leases receivable in accounts receivable, net |
(209 | ) | (177 | ) | ||||
|
|
|
|
|
|||||
| Net leases receivable in other assets, net |
$ | 2,851 | $ | 2,515 | ||||
|
|
|
|
|
|||||
We have leased and subleased land and buildings to others, primarily as a result of the refranchising of certain restaurants. Many of these leases provide for fixed payments, while others provide for contingent rent when revenue exceeds certain levels, or for monthly rentals based on a percentage of revenue. Lessees generally bear the cost of maintenance, insurance and property taxes. The carrying values of assets leased to others as of January 31, 2012 and 2011 was as follows:
| Successor | ||||||||
| 2012 | 2011 | |||||||
| Land |
$ | 34,567 | $ | 36,021 | ||||
| Leasehold improvements |
250 | 294 | ||||||
| Buildings and improvements |
33,665 | 34,706 | ||||||
|
|
|
|
|
|||||
| 68,482 | 71,021 | |||||||
| Less: accumulated depreciation and amortization |
(4,695 | ) | (1,786 | ) | ||||
|
|
|
|
|
|||||
| $ | 63,787 | $ | 69,235 | |||||
|
|
|
|
|
|||||
F-28
Table of Contents
CKE INC. AND SUBSIDIARIES
NOTES TO CONSOLIDATED FINANCIAL STATEMENTS (Continued)
Minimum lease payments for all leases, including those in the estimated liability for closed restaurants, and the present value of net minimum lease payments for capital leases as of January 31, 2012 are as follows:
| Capital | Operating | |||||||
| Fiscal: |
||||||||
| 2013 |
$ | 12,007 | $ | 89,779 | ||||
| 2014 |
10,599 | 84,728 | ||||||
| 2015 |
8,050 | 78,512 | ||||||
| 2016 |
7,663 | 68,170 | ||||||
| 2017 |
7,370 | 61,395 | ||||||
| Thereafter |
14,125 | 326,525 | ||||||
|
|
|
|
|
|||||
| Total minimum lease payments |
59,814 | $ | 709,109 | |||||
|
|
|
|||||||
| Less: amount representing interest |
(16,845 | ) | ||||||
|
|
|
|||||||
| Present value of minimum lease payments (interest rates primarily ranging from 5% to 11%) |
42,969 | |||||||
| Less: current portion |
(7,988 | ) | ||||||
|
|
|
|||||||
| Capital lease obligations, excluding current portion |
$ | 34,981 | ||||||
|
|
|
|||||||
The minimum lease payments reflected above have not been reduced for future minimum sublease rentals expected to be received. As of January 31, 2012, future minimum lease and sublease rental revenue expected to be received including amounts reducing the estimated liability for closed restaurants but not including contingent rentals (which may be received under certain leases), are as follows:
| Capital Subleases |
Operating Leases or Subleases |
|||||||
| Fiscal: |
||||||||
| 2013 |
$ | 517 | $ | 31,441 | ||||
| 2014 |
525 | 29,364 | ||||||
| 2015 |
466 | 26,157 | ||||||
| 2016 |
466 | 23,122 | ||||||
| 2017 |
484 | 19,694 | ||||||
| Thereafter |
3,010 | 83,250 | ||||||
|
|
|
|
|
|||||
| Total future minimum lease and sublease rental revenue |
$ | 5,468 | $ | 213,028 | ||||
|
|
|
|
|
|||||
Net rent expense under non-cancelable operating leases was as follows:
| Successor | Predecessor | |||||||||||||||
| Fiscal 2012 |
Twenty-Nine Weeks Ended January 31, 2011 |
Twenty-Four Weeks Ended July 12, 2010 |
Fiscal 2010 |
|||||||||||||
| Minimum rentals |
$ | 92,425 | $ | 50,905 | $ | 40,884 | $ | 86,460 | ||||||||
| Contingent rentals |
2,574 | 1,380 | 1,337 | 4,718 | ||||||||||||
|
|
|
|
|
|
|
|
|
|||||||||
| Gross rent expense |
94,999 | 52,285 | 42,221 | 91,178 | ||||||||||||
| Less: minimum sublease rentals |
(33,200 | ) | (18,813 | ) | (14,478 | ) | (32,401 | ) | ||||||||
| Less: contingent sublease rentals |
(2,872 | ) | (1,891 | ) | (1,018 | ) | (3,476 | ) | ||||||||
|
|
|
|
|
|
|
|
|
|||||||||
| $ | 58,927 | $ | 31,581 | $ | 26,725 | $ | 55,301 | |||||||||
|
|
|
|
|
|
|
|
|
|||||||||
F-29
Table of Contents
CKE INC. AND SUBSIDIARIES
NOTES TO CONSOLIDATED FINANCIAL STATEMENTS (Continued)
NOTE 11—SALE-LEASEBACK TRANSACTIONS
During fiscal 2012, we entered into agreements with independent third parties under which we sold and leased back 9 Carl’s Jr. and 38 Hardee’s restaurant properties. The initial minimum lease terms are 20 years, and the leases include renewal options and right of first offer provisions that, for accounting purposes, constitute continuing involvement with the associated restaurant properties. Due to this continuing involvement, these sale-leaseback transactions are accounted for under the financing method, rather than as completed sales. Under the financing method, we include the sales proceeds received in other long-term liabilities until our continuing involvement with the properties is terminated, report the associated property as owned assets, continue to depreciate the assets over their remaining useful lives, and record the rental payments as interest expense. Closing costs and other fees related to these sale-leaseback transactions are recorded as deferred financing costs and amortized to interest expense over the initial minimum lease term. When and if our continuing involvement with a property terminates and the sale of that property is recognized for accounting purposes, we expect to record a gain equal to the excess of the proceeds received over the remaining net book value of the associated restaurant property and any unamortized deferred financing costs.
During fiscal 2012, we received proceeds of $67,454 in connection with these transactions, which are included in other long-term liabilities in our accompanying Consolidated Balance Sheet as of January 31, 2012. In connection with these transactions, we capitalized deferred financing costs of $3,872 during fiscal 2012. The net book value of the associated assets, which is included in property and equipment, net of accumulated depreciation and amortization in our accompanying Consolidated Balance Sheet, was $48,722 as of January 31, 2012.
As of January 31, 2012, our future minimum cash obligations associated with these transactions is as follows:
| Fiscal: |
||||
| 2013 |
$ | 4,794 | ||
| 2014 |
4,794 | |||
| 2015 |
4,794 | |||
| 2016 |
4,794 | |||
| 2017 |
4,967 | |||
| Thereafter |
85,363 | |||
|
|
|
|||
| Total future minimum cash obligations |
$ | 109,506 | ||
|
|
|
NOTE 12—OTHER LONG-TERM LIABILITIES
Other long-term liabilities as of January 31, 2012 and 2011 consisted of the following:
| Successor | ||||||||
| 2012 | 2011 | |||||||
| Unfavorable lease agreements |
$ | 77,583 | $ | 89,874 | ||||
| Financing method sale-leaseback liability |
67,454 | — | ||||||
| Estimated liability for self-insurance |
29,409 | 27,999 | ||||||
| Accrued interest |
8,526 | — | ||||||
| Estimated liability for deferred rent |
4,805 | 1,820 | ||||||
| Estimated liability for closed restaurants |
2,308 | 3,187 | ||||||
| Deferred development fees |
3,814 | 1,073 | ||||||
| Other |
12,394 | 15,220 | ||||||
|
|
|
|
|
|||||
| $ | 206,293 | $ | 139,173 | |||||
|
|
|
|
|
|||||
F-30
Table of Contents
CKE INC. AND SUBSIDIARIES
NOTES TO CONSOLIDATED FINANCIAL STATEMENTS (Continued)
NOTE 13—STOCKHOLDERS’ EQUITY
CKE has a total of 100 shares of $0.01 par value common stock authorized and issued. Each share of common stock entitles the shareholder to one vote per share and is eligible to receive dividend payments when declared. Our ability to declare dividends is restricted by certain covenants contained in the Credit Facility, Senior Secured Notes and Toggle Notes. CKE’s common stock is not currently traded on any stock exchange or any organized market.
NOTE 14—FAIR VALUE MEASUREMENTS
The following table presents information on our financial instruments as of January 31, 2012 and 2011:
| Successor | ||||||||||||||||
| 2012 | 2011 | |||||||||||||||
| Carrying Amount |
Estimated Fair Value |
Carrying Amount |
Estimated Fair Value |
|||||||||||||
| Financial assets: |
||||||||||||||||
| Cash and cash equivalents |
$ | 64,585 | $ | 64,585 | $ | 42,586 | $ | 42,586 | ||||||||
| Notes receivable |
1,696 | 2,050 | 4,681 | 4,619 | ||||||||||||
| Financial liabilities: |
||||||||||||||||
| Long-term debt, including current portion |
721,734 | 800,392 | 590,016 | 676,005 | ||||||||||||
The fair value of cash and cash equivalents approximates its carrying amount due to its short maturity. The estimated fair value of notes receivable was determined by discounting future cash flows using current rates at which similar loans might be made to borrowers with similar credit ratings. The estimated fair value of the Senior Secured Notes and Toggle Notes was determined by using estimated market prices of the outstanding notes. For all other long-term debt, the estimated fair value was determined by discounting future cash flows using rates currently available to us for debt with similar terms and remaining maturities.
Fair value is defined as the exchange price that would be received for an asset or paid to transfer a liability (an exit price) in the principal or most advantageous market for the asset or liability in an orderly transaction between market participants on the measurement date. Entities are required to maximize the use of observable inputs and minimize the use of unobservable inputs when measuring fair value based on the following fair value hierarchy:
| Level 1 – | Quoted prices in active markets for identical assets or liabilities; |
| Level 2 – | Observable inputs other than Level 1 prices, such as quoted prices for similar assets or liabilities; quoted prices in markets that are not active; or other inputs that are observable or can be corroborated by observable market data for substantially the full term of the assets or liabilities; and |
| Level 3 – | Unobservable inputs that are supported by little or no market activity and that are significant to the fair value of the assets or liabilities. |
Our non-financial assets, which include long-lived assets, including goodwill, intangible assets and property and equipment, are reported at carrying value and are not required to be measured at fair value on a recurring basis. However, on a periodic basis, or whenever events or changes in circumstances indicate that their carrying value may not be recoverable, we assess our long-lived assets for impairment. When impairment has occurred, such long-lived assets are written down to fair value. See Note 1 for further discussion of our significant accounting policies.
F-31
Table of Contents
CKE INC. AND SUBSIDIARIES
NOTES TO CONSOLIDATED FINANCIAL STATEMENTS (Continued)
In connection with our impairment analyses for restaurant-level long-lived assets, we impaired certain of our restaurant-level long-lived assets down to their fair value using measurements with significant unobservable inputs (Level 3), which include estimates of future cash flows, assumptions of future same-store sales and projected operating expenses. During fiscal 2012, the Successor twenty-nine weeks ended January 31, 2011 and the Predecessor twenty-four weeks ended July 12, 2010, property and equipment with carrying values of $1,321, $568 and $1,154, respectively, were written down to fair value, resulting in impairment charges of $766, $364, and $317, respectively. These impairment charges were recorded to facility action charges, net in our accompanying Consolidated Statements of Operations (see Note 17).
NOTE 15—COMMITMENTS AND CONTINGENT LIABILITIES
Lease Commitments
Under various refranchising programs, we have sold restaurants to franchisees, some of which were on leased sites. We entered into sublease agreements with these franchisees but remained principally liable for the lease obligations. We account for the sublease payments received as franchising rental income in franchised restaurants and other revenue, and the payments on the leases as rental expense in franchised restaurants and other expense, in our accompanying Consolidated Statements of Operations. As of January 31, 2012, the present value of the lease obligations under the remaining master leases’ primary terms is $126,305. Franchisees may, from time to time, experience financial hardship and may cease payment on their sublease obligations to us. The present value of the exposure to us from franchisees characterized as under financial hardship is $2,482.
Letters of Credit
Pursuant to our Credit Facility, we may borrow up to $100,000 for senior secured revolving facility loans, swingline loans and letters of credit (see Note 9). We have several standby letters of credit outstanding under our Credit Facility, which primarily secure our potential workers’ compensation, general and auto liability obligations. We are required to provide letters of credit each year, or set aside a comparable amount of cash or investment securities in a trust account, based on our existing claims experience. As of January 31, 2012, we had outstanding letters of credit of $30,913, expiring at various dates through August 2012.
Unconditional Purchase Obligations
As of January 31, 2012, we had unconditional purchase obligations in the amount of $87,168, which consisted primarily of contracts for goods and services related to restaurant operations and contractual commitments for marketing and sponsorship arrangements. Our unconditional purchase obligations for fiscal 2013, 2014, 2015, 2016, 2017 and thereafter are estimated to be $75,063, $4,918, $2,512, $1,520, $864 and $2,291, respectively.
Employment Agreements
We have entered into employment agreements with certain of our key executives (the “Employment Agreements”). Pursuant to the terms of the Employment Agreements, each executive is entitled to receive certain retention bonus payments that will be paid out in October 2012 and 2013, in accordance with such executive’s Employment Agreement. In addition, each executive will be entitled to payments that may be triggered by the termination of employment under certain circumstances, as set forth in each Employment Agreement. If certain provisions are triggered, our Chief Executive Officer shall be entitled to receive an amount equal to his minimum base salary multiplied by six and our President and Chief Legal Officer and our Chief Financial Officer shall each be entitled to receive an amount equal to his respective minimum base salary multiplied by three plus a pro-rata portion of his then-current year bonus. The affected executive may also be entitled to receive a portion
F-32
Table of Contents
CKE INC. AND SUBSIDIARIES
NOTES TO CONSOLIDATED FINANCIAL STATEMENTS (Continued)
of his retention bonus. If all payment provisions of the Employment Agreements had been triggered as of January 31, 2012, we would have been required to make cash payments of approximately $13,569.
Litigation
We are currently involved in legal disputes related to employment claims, real estate claims and other business disputes. As of January 31, 2012, our accrued liability for litigation contingencies with a probable likelihood of loss was $2,409, with an expected range of losses from $2,409 to $5,753. With respect to employment matters, our most significant legal disputes relate to employee meal and rest break disputes, and wage and hour disputes. Several potential class action lawsuits have been filed in the State of California, regarding such employment matters, each of which is seeking injunctive relief and monetary compensation on behalf of current and former employees. The Company intends to vigorously defend against all claims in these lawsuits; however, we are presently unable to predict the ultimate outcome of these actions. As of January 31, 2012, we estimated the contingent liability of those losses related to litigation claims that are not accrued, but that we believe are reasonably possible to result in an adverse outcome and for which a range of loss can be reasonably estimated, to be in the range of $2,135 to $10,425. In addition, we are involved in legal matters where the likelihood of loss has been judged to be reasonably possible, but for which a range of the potential loss cannot be reasonably estimated based on current facts and circumstances.
NOTE 16—FRANCHISE OPERATIONS
Franchise arrangements generally provide for initial fees and continuing royalty payments to us based upon a percentage of revenue. We generally charge an initial franchise fee for each new franchised restaurant that is added to our system, and in some cases, an area development fee, which grants exclusive rights to develop a specified number of restaurants in a designated geographic area within a specified time period. Similar fees are charged in connection with our international licensing operations. These fees are recognized ratably when substantially all the services required of us are complete and the restaurants covered by these agreements commence operations.
Certain franchisees purchase equipment from us. Prior to the sale of our Carl’s Jr. distribution center assets on July 2, 2010, certain franchisees also purchased food, packaging, and supplies from us. Additionally, franchisees may be obligated to remit lease payments for the use of restaurant facilities owned or leased by us, generally for periods up to 20 years. Under the terms of these leases, franchisees are generally required to pay related occupancy costs, which include maintenance, insurance and property taxes.
Franchised restaurants and other revenue consisted of the following:
| Successor | Predecessor | |||||||||||||||
| Fiscal 2012 |
Twenty-Nine Weeks Ended January 31, 2011 |
Twenty-Four Weeks Ended July 12, 2010 |
Fiscal 2010 |
|||||||||||||
| Royalties |
$ | 93,776 | $ | 49,482 | $ | 40,007 | $ | 84,447 | ||||||||
| Distribution centers—food, packaging and supplies |
— | — | 86,891 | 192,188 | ||||||||||||
| Distribution centers—equipment |
24,927 | 9,664 | 9,220 | 21,630 | ||||||||||||
| Rent and other occupancy |
35,611 | 20,303 | 14,616 | 33,596 | ||||||||||||
| Franchise fees |
3,583 | 906 | 854 | 2,398 | ||||||||||||
|
|
|
|
|
|
|
|
|
|||||||||
| $ | 157,897 | $ | 80,355 | $ | 151,588 | $ | 334,259 | |||||||||
|
|
|
|
|
|
|
|
|
|||||||||
F-33
Table of Contents
CKE INC. AND SUBSIDIARIES
NOTES TO CONSOLIDATED FINANCIAL STATEMENTS (Continued)
Franchised restaurants and other expense consisted of the following:
| Successor | Predecessor | |||||||||||||||
| Fiscal 2012 |
Twenty-Nine Weeks Ended January 31, 2011 |
Twenty-Four Weeks Ended July 12, 2010 |
Fiscal 2010 |
|||||||||||||
| Distribution centers—food, packaging and supplies |
$ | — | $ | — | $ | 86,170 | $ | 189,346 | ||||||||
| Distribution centers—equipment |
24,937 | 9,854 | 9,206 | 21,199 | ||||||||||||
| Rent and other occupancy |
32,239 | 17,945 | 12,524 | 27,719 | ||||||||||||
| Other operating expenses |
24,196 | 11,665 | 7,220 | 15,860 | ||||||||||||
|
|
|
|
|
|
|
|
|
|||||||||
| $ | 81,372 | $ | 39,464 | $ | 115,120 | $ | 254,124 | |||||||||
|
|
|
|
|
|
|
|
|
|||||||||
Termination of Franchise Agreements
During the Successor twenty-nine weeks ended January 31, 2011, we terminated our franchise agreement with one Carl’s Jr. and one Hardee’s franchisee that operated 59 and 60 franchised restaurants, respectively, as a result of their inability to remedy, on a timely basis, certain defaults under the terms of their respective agreements. We entered into workout agreements with these franchisees, under which these franchisees were permitted to operate under temporary license agreements. As of January 31, 2012, 32 of these Carl’s Jr. restaurants continue to operate under temporary license agreements.
During the third quarter of fiscal 2010, we terminated our franchise agreement with a Hardee’s franchisee that operated six franchised restaurants as a result of its inability to remedy, on a timely basis, certain defaults under the terms of the agreements and allowed the franchisee to continue to operate under a temporary license agreement while it attempted to sell its restaurants. A new franchisee purchased the six restaurants from the former franchisee during the fourth quarter of fiscal 2011.
NOTE 17—FACILITY ACTION CHARGES, NET
The components of facility action charges, net, were as follows:
| Successor | Predecessor | |||||||||||||||
| Fiscal 2012 |
Twenty-Nine Weeks Ended January 31, 2011 |
Twenty-Four Weeks Ended July 12, 2010 |
Fiscal 2010 |
|||||||||||||
| Estimated liability for new restaurant closures |
$ | 133 | $ | 99 | $ | 363 | $ | 525 | ||||||||
| Adjustments to estimated liability for closed restaurants |
311 | 870 | 35 | 393 | ||||||||||||
| Impairment of assets to be disposed of |
— | — | 104 | — | ||||||||||||
| Impairment of assets to be held and used |
766 | 364 | 213 | 3,480 | ||||||||||||
| Gain on disposal of property and equipment |
(231 | ) | (164 | ) | (531 | ) | (611 | ) | ||||||||
| Other (gains) losses |
(7,476 | ) | 242 | 208 | 516 | |||||||||||
| Amortization of discount related to estimated liability for closed restaurants |
479 | 272 | 198 | 392 | ||||||||||||
|
|
|
|
|
|
|
|
|
|||||||||
| $ | (6,018 | ) | $ | 1,683 | $ | 590 | $ | 4,695 | ||||||||
|
|
|
|
|
|
|
|
|
|||||||||
F-34
Table of Contents
CKE INC. AND SUBSIDIARIES
NOTES TO CONSOLIDATED FINANCIAL STATEMENTS (Continued)
During fiscal 2012, we recorded a gain of $6,595 in connection with an agreement to terminate a restaurant lease and a gain of $1,024 in connection with an eminent domain transaction related to one of our company-operated restaurants. During the Successor twenty-nine weeks ended January 31, 2011, we recorded a gain of $284 in connection with the termination of a lease related to a closed restaurant.
We evaluate our restaurant-level long-lived assets for impairment whenever events or circumstances indicate that the carrying value of assets may be impaired. We determine whether the assets are recoverable by comparing the undiscounted future cash flows that we expect to generate from their use and disposal to their carrying value. Restaurant-level assets that are not deemed to be recoverable are written down to their estimated fair value, which is determined by assessing the highest and best use of the assets and the amounts that would be received for such assets in an orderly transaction between market participants. The determination of fair value is dependent upon level 3 significant unobservable inputs.
Impairment charges recognized in facility action charges, net were recorded against the following asset category:
| Successor | Predecessor | |||||||||||||||
| Fiscal 2012 |
Twenty-Nine Weeks Ended January 31, 2011 |
Twenty-Four Weeks Ended July 12, 2010 |
Fiscal 2010 |
|||||||||||||
| Property and equipment: |
||||||||||||||||
| Carl’s Jr. |
$ | — | $ | — | $ | 63 | $ | 2,042 | ||||||||
| Hardee’s |
766 | 364 | 254 | 1,438 | ||||||||||||
|
|
|
|
|
|
|
|
|
|||||||||
| $ | 766 | $ | 364 | $ | 317 | $ | 3,480 | |||||||||
|
|
|
|
|
|
|
|
|
|||||||||
F-35
Table of Contents
CKE INC. AND SUBSIDIARIES
NOTES TO CONSOLIDATED FINANCIAL STATEMENTS (Continued)
The following table summarizes the activity in our estimated liability for closed restaurants:
| Carl’s Jr. | Hardee’s | Other | Total | |||||||||||||
| Predecessor: |
||||||||||||||||
| Balance as of January 31, 2009 |
$ | 2,227 | $ | 7,373 | $ | — | $ | 9,600 | ||||||||
| Estimated liability for new restaurant closures |
284 | 241 | — | 525 | ||||||||||||
| Usage |
(803 | ) | (2,834 | ) | — | (3,637 | ) | |||||||||
| Adjustments to estimated liability for closed restaurants |
104 | 289 | — | 393 | ||||||||||||
| Amortization of discount |
91 | 301 | — | 392 | ||||||||||||
|
|
|
|
|
|
|
|
|
|||||||||
| Balance as of January 31, 2010 |
1,903 | 5,370 | — | 7,273 | ||||||||||||
| Estimated liability for new restaurant closures |
— | 363 | — | 363 | ||||||||||||
| Usage |
(390 | ) | (1,190 | ) | (22 | ) | (1,602 | ) | ||||||||
| Adjustments to estimated liability for closed restaurants |
(26 | ) | 8 | 53 | 35 | |||||||||||
| Amortization of discount |
38 | 160 | — | 198 | ||||||||||||
|
|
|
|
|
|
|
|
|
|||||||||
| Balance as of July 12, 2010(1) |
$ | 1,525 | $ | 4,711 | $ | 31 | $ | 6,267 | ||||||||
|
|
|
|
|
|
|
|
|
|||||||||
| Successor: |
||||||||||||||||
| Opening balance(1) |
$ | 1,469 | $ | 4,387 | $ | 31 | $ | 5,887 | ||||||||
| Estimated liability for new restaurant closures |
— | 99 | — | 99 | ||||||||||||
| Usage |
(413 | ) | (1,488 | ) | (17 | ) | (1,918 | ) | ||||||||
| Adjustments to estimated liability for closed restaurants |
290 | 579 | 1 | 870 | ||||||||||||
| Amortization of discount |
42 | 230 | — | 272 | ||||||||||||
|
|
|
|
|
|
|
|
|
|||||||||
| Balance as of January 31, 2011 |
1,388 | 3,807 | 15 | 5,210 | ||||||||||||
| Estimated liability for new restaurant closures |
133 | — | — | 133 | ||||||||||||
| Usage |
(565 | ) | (1,638 | ) | (18 | ) | (2,221 | ) | ||||||||
| Adjustments to estimated liability for closed restaurants |
342 | (34 | ) | 3 | 311 | |||||||||||
| Amortization of discount |
142 | 337 | — | 479 | ||||||||||||
|
|
|
|
|
|
|
|
|
|||||||||
| Balance as of January 31, 2012 |
1,440 | 2,472 | — | 3,912 | ||||||||||||
| Less: current portion, included in other current liabilities |
483 | 1,121 | — | 1,604 | ||||||||||||
|
|
|
|
|
|
|
|
|
|||||||||
| Long-term portion, included in other long-term liabilities |
$ | 957 | $ | 1,351 | $ | — | $ | 2,308 | ||||||||
|
|
|
|
|
|
|
|
|
|||||||||
| (1) | In acquisition accounting, we adjusted our estimated liability for closed restaurants. |
F-36
Table of Contents
CKE INC. AND SUBSIDIARIES
NOTES TO CONSOLIDATED FINANCIAL STATEMENTS (Continued)
NOTE 18—SHARE-BASED COMPENSATION
Total share-based compensation expense and associated tax benefits recognized were as follows:
| Successor | Predecessor | |||||||||||||||
| Fiscal 2012 |
Twenty-Nine Weeks Ended January 31, 2011 |
Twenty-Four Weeks Ended July 12, 2010 |
Fiscal 2010 |
|||||||||||||
| Share-based compensation expense related to restricted stock awards that contain market or performance conditions |
$ | — | $ | — | $ | 717 | $ | 2,163 | ||||||||
| Share-based compensation expense related to the acceleration of vesting of stock options and awards in connection with Merger |
— | 10,587 | 1,521 | — | ||||||||||||
| Share-based compensation expense related to Units that contain performance conditions |
2,357 | 1,390 | — | — | ||||||||||||
| All other share-based compensation expense |
2,236 | 1,269 | 2,472 | 5,993 | ||||||||||||
|
|
|
|
|
|
|
|
|
|||||||||
| Total share-based compensation expense |
$ | 4,593 | $ | 13,246 | $ | 4,710 | $ | 8,156 | ||||||||
|
|
|
|
|
|
|
|
|
|||||||||
| Associated tax benefits |
$ | — | $ | — | $ | 1,804 | $ | 2,681 | ||||||||
|
|
|
|
|
|
|
|
|
|||||||||
Share-Based Compensation Arrangements
Successor
In connection with the Merger, certain funds managed by Apollo Management VII, L.P., certain members of our senior management team and our board of directors formed Apollo CKE Holdings, L.P., a limited partnership (the “Partnership”) to fund the equity contribution to CKE. The Partnership also granted 5,108,333 profit sharing interests in the Partnership to certain of our senior management team and directors in the form of time vesting and performance vesting Units. Under certain circumstances, a portion of the Units may become subject to both performance and market conditions.
The time vesting Units vest in four equal annual installments from the date of grant. The performance vesting Units vest or convert to a time vesting schedule upon achievement of certain financial or investment targets. Prior to a change in control or qualified initial public offering (“IPO”), our performance against such targets is determined based upon a specified formula driven by our earnings before interest, income taxes, depreciation and amortization (“EBITDA”), subject to adjustments by the general partner of the Partnership. These performance criteria will be assessed on a quarterly basis beginning with the quarter ending August 13, 2012. Upon a change in control event or IPO, our performance against the specified targets will be based upon a formula driven by the proceeds generated from such transaction. We recognize share-based compensation expense related to the performance vesting Units when we deem the achievement of performance goals to be probable.
F-37
Table of Contents
CKE INC. AND SUBSIDIARIES
NOTES TO CONSOLIDATED FINANCIAL STATEMENTS (Continued)
The grant date fair value of the Units was estimated using the Black-Scholes option pricing model. The weighted-average assumptions used for Units granted in connection with the Merger were as follows:
| Successor | ||||
| Annual dividend yield |
— | |||
| Expected volatility |
57.00 | % | ||
| Risk-free interest rate (matched to the expected term of the Units) |
1.69 | % | ||
| Expected life (years) |
4.56 | |||
| Weighted-average grant date fair value (actual dollars per Unit) |
$ | 3.52 | ||
The following presents the time vesting and performance vesting Unit activity for fiscal 2012 and the Units outstanding as of January 31, 2012:
| Time Vesting Units |
Performance Vesting Units |
Total Units | Weighted Average Grant Date Fair Value |
|||||||||||||
| Unvested Units outstanding as of January 31, 2011 |
2,604,167 | 2,504,166 | 5,108,333 | $ | 3.52 | |||||||||||
| Vested Units |
(651,042 | ) | — | (651,042 | ) | 3.52 | ||||||||||
| Forfeited Units |
(65,734 | ) | (87,645 | ) | (153,379 | ) | 3.52 | |||||||||
|
|
|
|
|
|
|
|||||||||||
| Unvested Units outstanding as of January 31, 2012 |
1,887,391 | 2,416,521 | 4,303,912 | 3.52 | ||||||||||||
|
|
|
|
|
|
|
|||||||||||
| Vested Units as of January 31, 2012 |
651,042 | |||||||||||||||
|
|
|
|||||||||||||||
We recorded $4,593 and $2,659 of share-based compensation expense related to the Units during fiscal 2012 and the Successor twenty-nine weeks ended January 31, 2011, respectively. The maximum unrecognized compensation cost for the time and performance vesting Units was $10,164 as of January 31, 2012.
In connection with the Merger, the vesting of all outstanding unvested Predecessor options and restricted stock awards was accelerated immediately prior to closing. As a result of the acceleration, we recorded $10,587 in share-based compensation expense during the Successor twenty-nine weeks ended January 31, 2011 within general and administrative expense in our accompanying Consolidated Statement of Operations related to the post-Merger service period for certain stock options and awards (see also Predecessor below).
Predecessor
In connection with the Merger, all outstanding options became fully vested and exercisable immediately prior to closing, under our then existing stock incentive plans, which included the 2005 Omnibus Incentive Compensation Plan, 2001 Stock Incentive Plan, and 1999 Stock Incentive Plan (collectively the “Predecessor Plans”). To the extent that such stock options had an exercise price less than $12.55 per share, the holders of such stock options were paid an amount in cash equal to $12.55 less the exercise price of the stock option. In addition, all outstanding restricted stock awards became fully vested immediately prior to the closing and were treated as a share of our common stock for all purposes under the Merger Agreement. We recorded $1,521 in stock compensation expense related to the acceleration of options and restricted stock awards from Predecessor Plans during the Predecessor twenty-four weeks ended July 12, 2010.
F-38
Table of Contents
CKE INC. AND SUBSIDIARIES
NOTES TO CONSOLIDATED FINANCIAL STATEMENTS (Continued)
In general, options issued under the Predecessor Plans had a term of ten years and vested over a period of three years. We generally issued new shares of common stock for option exercises. The grant date fair value was calculated using a Black-Scholes option valuation model. There were no options issued during the Predecessor twenty-four weeks ended July 12, 2010. The weighted-average assumptions used for stock options granted during fiscal 2010 were as follows:
| Predecessor | ||||
| 2010 | ||||
| Annual dividend yield |
2.79 | % | ||
| Expected volatility |
46.17 | % | ||
| Risk-free interest rate (matched to the expected term of the outstanding option) |
3.01 | % | ||
| Expected life (years) |
6.29 | |||
| Weighted-average grant date fair value |
$ | 3.02 | ||
Excluding the options exercised in connection with the Merger, the total intrinsic value of stock options exercised during the Predecessor twenty-four weeks ended July 12, 2010 and fiscal 2010 was $809 and $878, respectively. The total intrinsic value of stock options accelerated and vested in connection with the Merger was $11,460.
During the Predecessor twenty-four weeks ended July 12, 2010, the employment agreements of certain key executives were amended, resulting in certain modifications to the restricted stock awards outstanding under the Predecessor Plans. These amendments reallocated certain restricted stock awards that contained performance conditions to time-based restricted stock awards. Additionally, the employment agreements amended the vesting criteria for restricted stock awards that contained market or performance conditions. The unvested restricted stock awards immediately preceding the Merger consisted of 579,730 restricted stock awards and 428,736 performance-based restricted stock awards. The total grant date fair value of restricted stock awards vested in connection with the Merger was $9,036. The total grant date fair value of restricted stock awards vested during fiscal 2010 was $5,532.
Employee Stock Purchase Plan
Under the terms of our Predecessor Employee Stock Purchase Plan (“ESPP”), eligible employees were able to voluntarily purchase, at current market prices, our common stock through payroll deductions. The ESPP was suspended on February 26, 2010 in connection with the Prior Merger Agreement and was subsequently terminated on July 12, 2010 in connection with the Merger. Pursuant to the ESPP, employees were able to contribute an amount between 3% and 15% of their base salaries. We contributed varying amounts, as specified in the ESPP. During the Predecessor twenty-four weeks ended July 12, 2010 and fiscal 2010, 16,039 and 359,414 shares, respectively, were purchased and allocated to employees, based upon their contributions, at an average price of $8.60 and $8.79 per share, respectively. During the Predecessor twenty-four weeks ended July 12, 2010 and fiscal 2010, we contributed $218 and $1,019, respectively, or an equivalent of 25,678 and 111,480 shares, respectively. Subsequent to the suspension of the ESPP, we made cash payments in lieu of ESPP matching contributions of $249, $379 and $515, during fiscal 2012, the Successor twenty-nine weeks ended January 31, 2011 and the Predecessor twenty-four weeks ended July 12, 2010, respectively.
NOTE 19—EMPLOYEE RETIREMENT PLAN
We sponsor a contributory plan (“401(k) Plan”) to provide retirement benefits under the provisions of Section 401(k) of the Internal Revenue Code (“IRC”) for eligible employees, except certain hourly operations
F-39
Table of Contents
CKE INC. AND SUBSIDIARIES
NOTES TO CONSOLIDATED FINANCIAL STATEMENTS (Continued)
employees and highly compensated employees. Participants may elect to contribute up to 25% of their annual salaries on a pre-tax basis to the 401(k) Plan, subject to the maximum contribution allowed by the IRC. Our matching contributions are determined at the discretion of our Board of Directors. During fiscal 2012, the Successor twenty-nine weeks ended January 31, 2011, the Predecessor twenty-four weeks ended July 12, 2010 and fiscal 2010, we did not make matching contributions to the 401(k) Plan.
NOTE 20—RELATED PARTY TRANSACTIONS
Transactions with Apollo Management VII, L.P.
In connection with the Merger, we entered into a management services agreement with Apollo Management VII, L.P. Pursuant to the management services agreement, Apollo Management VII, L.P. received on the closing date cash consideration of $10,020 for services and reimbursable expenses in connection with the Merger. We recorded $5,010 of these costs in other operating expenses, net in our accompanying Consolidated Statement of Operations for the Successor twenty-nine weeks ended January 31, 2011 and capitalized $5,010 in deferred financing costs.
In addition, pursuant to the management services agreement and in exchange for on-going investment banking, management, consulting, and financial planning services that will be provided to us by Apollo Management VII, L.P. and its affiliates, Apollo Management VII, L.P. will receive an aggregate annual management fee of $2,500, which may be increased at Apollo Management VII, L.P.’s sole discretion up to an amount equal to two percent of our Adjusted EBITDA, as defined in our Credit Facility. The management services agreement provides for a ten year term, which may be terminated earlier in the event of an IPO for fees remaining under the term of the agreement discounted at a 10% rate. We recorded $2,490 and $1,260 in management fees, which are included in general and administrative expense in our Consolidated Statements of Operations for fiscal 2012 and the Successor twenty-nine weeks ended January 31, 2011.
The management services agreement also provides that affiliates of Apollo Management VII, L.P. may receive future fees in connection with certain future financing and acquisition or disposition transactions. The management services agreement includes customary exculpation and indemnification provisions in favor of Apollo Management VII L.P. and its affiliates.
Transactions with Successor Board of Directors
Certain members of our Successor Board of Directors are also our franchisees. These franchisees regularly pay royalties and purchase equipment and other products from us on the same terms and conditions as our other franchisees. During fiscal 2012 and the Successor twenty-nine weeks ended January 31, 2011, total revenue generated from related party franchisees was $6,959 and $3,597, respectively, which is included in franchised restaurants and other revenue in our accompanying Consolidated Statements of Operations. As of January 31, 2012 and 2011, our related party trade receivables from franchisees were $252 and $216, respectively.
Transactions with Predecessor Board of Directors
Certain members of our Predecessor Board of Directors were also our franchisees. These franchisees regularly paid royalties and purchased food, equipment and other products from us on the same terms and conditions as our other franchisees. During the Predecessor twenty-four weeks ended July 12, 2010 and fiscal 2010, total revenue generated from related party franchisees was $36,775 and $78,839, respectively, which is included in franchised restaurants and other revenue in our accompanying Consolidated Statements of Operations.
F-40
Table of Contents
CKE INC. AND SUBSIDIARIES
NOTES TO CONSOLIDATED FINANCIAL STATEMENTS (Continued)
We leased various properties, including certain of our corporate offices and two restaurants from a Partnership and a Trust, both of which were related parties of a member of our Predecessor Board of Directors. Lease payments under these leases for the Predecessor twenty-four weeks ended July 12, 2010 and fiscal 2010 amounted to $90 and $1,824, respectively.
See Note 6 for a discussion of related party purchase and sale transactions.
NOTE 21—INCOME TAXES
Income tax (benefit) expense consisted of the following:
| Successor | Predecessor | |||||||||||||||
| Fiscal 2012 |
Twenty-Nine Weeks Ended January 31, 2011 |
Twenty-Four Weeks Ended July 12, 2010 |
Fiscal 2010 |
|||||||||||||
| Current: |
||||||||||||||||
| Federal |
$ | (5,252 | ) | $ | (1,480 | ) | $ | (1,042 | ) | $ | 534 | |||||
| State |
1,103 | 87 | (26 | ) | 1,617 | |||||||||||
| Foreign |
1,643 | 817 | 599 | 1,030 | ||||||||||||
|
|
|
|
|
|
|
|
|
|||||||||
| (2,506 | ) | (576 | ) | (469 | ) | 3,181 | ||||||||||
|
|
|
|
|
|
|
|
|
|||||||||
| Deferred: |
||||||||||||||||
| Federal |
(7,547 | ) | (9,477 | ) | 6,521 | 26,544 | ||||||||||
| State |
(1,556 | ) | (1,358 | ) | 1,720 | (14,747 | ) | |||||||||
|
|
|
|
|
|
|
|
|
|||||||||
| (9,103 | ) | (10,835 | ) | 8,241 | 11,797 | |||||||||||
|
|
|
|
|
|
|
|
|
|||||||||
| Total |
$ | (11,609 | ) | $ | (11,411 | ) | $ | 7,772 | $ | 14,978 | ||||||
|
|
|
|
|
|
|
|
|
|||||||||
The following is a reconciliation of income tax (benefit) expense at the federal statutory rate of 35% to our income tax (benefit) expense:
| Successor | Predecessor | |||||||||||||||
| Fiscal 2012 |
Twenty-Nine Weeks Ended January 31, 2011 |
Twenty-Four Weeks Ended July 12, 2010 |
Fiscal 2010 |
|||||||||||||
| Income tax (benefit) expense at statutory rate |
$ | (10,811 | ) | $ | (13,755 | ) | $ | 89 | $ | 22,112 | ||||||
| State income taxes, net of federal income tax effect |
(294 | ) | (826 | ) | 1,101 | (8,535 | ) | |||||||||
| Nondeductible compensation |
1,608 | 4,625 | — | 1,877 | ||||||||||||
| Nondeductible transaction costs |
17 | 1,284 | 7,091 | — | ||||||||||||
| General business credits |
(2,787 | ) | (1,477 | ) | (948 | ) | (1,168 | ) | ||||||||
| Other, net |
658 | (1,262 | ) | 439 | 692 | |||||||||||
|
|
|
|
|
|
|
|
|
|||||||||
| $ | (11,609 | ) | $ | (11,411 | ) | $ | 7,772 | $ | 14,978 | |||||||
|
|
|
|
|
|
|
|
|
|||||||||
F-41
Table of Contents
CKE INC. AND SUBSIDIARIES
NOTES TO CONSOLIDATED FINANCIAL STATEMENTS (Continued)
As of January 31, 2012 and 2011, temporary differences and carryforwards gave rise to a significant amount of deferred income tax assets and liabilities as follows:
| Successor | ||||||||
| 2012 | 2011 | |||||||
| Basis difference in property and equipment |
$ | (52,446 | ) | $ | (65,834 | ) | ||
| Capital lease assets and obligations |
1,248 | 1,701 | ||||||
| Goodwill and other intangible assets |
(158,854 | ) | (154,212 | ) | ||||
| Reserves and allowances |
26,899 | 31,281 | ||||||
| Net operating loss carryforwards |
27,992 | 33,309 | ||||||
| Federal and state tax credits |
31,929 | 22,916 | ||||||
| Other |
8,561 | 6,757 | ||||||
|
|
|
|
|
|||||
| (114,671 | ) | (124,082 | ) | |||||
| Valuation allowance |
(10,975 | ) | (10,667 | ) | ||||
|
|
|
|
|
|||||
| Net deferred income tax liability |
$ | (125,646 | ) | $ | (134,749 | ) | ||
|
|
|
|
|
|||||
As of January 31, 2011, we maintained a valuation allowance of $10,667 against a portion of our deferred income tax assets related to state NOL carryforwards and state income tax credits because we had concluded that realization of the tax benefit of such deferred income tax assets was not more likely than not. In evaluating the need for a valuation allowance, we consider all available evidence, positive and negative, including cumulative historical earnings in recent years, future reversals of existing temporary differences, estimated future taxable income exclusive of reversing temporary differences on a jurisdictional basis and statutory expiration dates of NOL and income tax credit carryforwards. During the fiscal year ended January 31, 2012, we increased our valuation allowance by $308.
As of January 31, 2012, the remaining valuation allowance of $10,975 relates to certain state NOL carryforwards and a portion of our state income tax credits. Realization of the tax benefit of such deferred income tax assets may remain uncertain for the foreseeable future, even if we generate consolidated taxable income, since certain deferred income tax assets are subject to various limitations and may only be used to offset income of certain entities and in certain jurisdictions.
As of January 31, 2012, we have federal NOL carryforwards of approximately $35,852, which would begin to expire, if unused, in fiscal 2031. As of January 31, 2012, we have federal alternative minimum tax (“AMT”) credit, general business tax credit and foreign tax credit carryforwards of approximately $26,274. Our AMT credits will be carried forward until utilized, and our general business tax credits and foreign tax credits would expire, if unused, in varying amounts in fiscal 2018 through 2032. As of January 31, 2012, we have state tax credit carryforwards of $9,526, which can be carried forward indefinitely but are subject to substantive limitations with regard to utilization. As of January 31, 2012, we have state NOL carryforwards in the amount of approximately $392,839, which expire in varying amounts in fiscal 2013 through 2032. As of January 31, 2012, we have recognized $1,493 of net deferred income tax assets related to our state income tax credit carryforwards and $12,296 of net deferred income tax assets related to our state NOL carryforwards, which represent our expected future tax savings from such carryforwards, after considering the impact of past ownership changes on our ability to utilize such carryforwards. The utilization of our NOL carryforwards to offset future taxable income may be subject to an annual limitation as a result of past or future ownership changes.
F-42
Table of Contents
CKE INC. AND SUBSIDIARIES
NOTES TO CONSOLIDATED FINANCIAL STATEMENTS (Continued)
The federal and state tax credits and the state NOL carryforwards reflected in our income tax returns, as filed, include the impact of uncertain tax positions taken in open years. Accordingly, they are larger than the tax credits and NOL carryforwards for which deferred income tax assets are recognized for financial statement purposes.
The following is a tabular reconciliation of the total amounts of unrecognized tax benefits:
| Successor | Predecessor | |||||||||||||||
| Fiscal 2012 |
Twenty-Nine Weeks Ended January 31, 2011 |
Twenty-Four Weeks Ended July 12, 2010 |
Fiscal 2010 |
|||||||||||||
| Unrecognized tax benefits, beginning of period |
$ | 14,176 | $ | 15,592 | $ | 15,905 | $ | 17,194 | ||||||||
| Gross increases related to tax positions taken in prior periods |
56 | — | — | 13 | ||||||||||||
| Gross decreases related to tax positions taken in prior periods |
(1,560 | ) | (65 | ) | (90 | ) | (320 | ) | ||||||||
| Gross increases related to tax positions taken in the current period |
1,750 | 149 | 63 | 341 | ||||||||||||
| Gross decreases related to tax positions taken in the current period |
— | — | (286 | ) | — | |||||||||||
| Reductions to tax positions due to settlements with taxing authorities and lapses of statutes of limitations |
(237 | ) | (1,500 | ) | — | (1,323 | ) | |||||||||
|
|
|
|
|
|
|
|
|
|||||||||
| Unrecognized tax benefits, end of period |
$ | 14,185 | $ | 14,176 | $ | 15,592 | $ | 15,905 | ||||||||
|
|
|
|
|
|
|
|
|
|||||||||
Included in the balance of unrecognized tax benefits as of January 31, 2012, are $2,977 of tax benefits that, if recognized, would affect the effective tax rate. Also included in the balance of unrecognized tax benefits as of January 31, 2012, are $11,208 of tax benefits that, if recognized, would result in adjustments to other tax accounts, primarily deferred income taxes, income taxes payable and valuation allowance. Amounts recorded for interest and penalties in connection with the unrecognized tax benefits noted above were not significant as of January 31, 2012 and 2011.
We believe that it is reasonably possible that decreases in unrecognized tax benefits of up to $1,642 may be necessary within the coming year as a result of statutes closing on such items. In addition, we believe that it is reasonably possible that our unrecognized tax benefits may increase as a result of tax positions that may be taken in fiscal 2013.
We file income tax returns in the U.S. federal jurisdiction and various states and foreign jurisdictions. We have carried forward various federal and state NOL and income tax credits to income tax years that remain open by statute. As a result, such NOL and income tax credit carryforwards remain subject to adjustment by the respective tax authorities. Our federal income tax returns from fiscal 2009 and subsequent years are open for examination. In addition, our state income tax returns generally have statutes of limitations ranging from three to four years from the filing date.
NOTE 22—SEGMENT INFORMATION
We are principally engaged in developing, operating, franchising and licensing our Carl’s Jr. and Hardee’s quick-service restaurant concepts, each of which is considered an operating segment that is managed and
F-43
Table of Contents
CKE INC. AND SUBSIDIARIES
NOTES TO CONSOLIDATED FINANCIAL STATEMENTS (Continued)
evaluated separately. In addition to using consolidated results in evaluating our financial results, a primary measure used by our executive management in assessing the performance of existing restaurant concepts is segment income. Segment income is defined as income from operations excluding general and administrative expenses, facility action charges, net, and other operating expenses, net. Our general and administrative expenses include allocations of corporate general and administrative expenses, such as share-based compensation expense, to each segment based on management’s analysis of the resources applied to each segment. Because facility action charges are associated with impaired, closed or subleased restaurants, these charges are excluded when assessing our ongoing operations. Other operating expenses, net consists of transaction-related costs and the gain on sale of our Carl’s Jr. distribution center assets, and are also excluded when assessing our ongoing operations. Interest expense has been allocated based on the use of funds. Certain amounts that we do not believe would be proper to allocate to the operating segments are included in “Other” (e.g., gains or losses on sales of long-term investments). Assets and capital expenditures are allocated to our operating segments when such assets are used solely by the operating segment. The accounting policies of the segments are the same as those described in our summary of significant accounting policies (see Note 1).
F-44
Table of Contents
CKE INC. AND SUBSIDIARIES
NOTES TO CONSOLIDATED FINANCIAL STATEMENTS (Continued)
| Successor | Predecessor | |||||||||||||||
| Fiscal 2012 |
Twenty-Nine Weeks Ended January 31, 2011 |
Twenty-Four Weeks Ended July 12, 2010 |
Fiscal 2010 |
|||||||||||||
| Revenue: |
||||||||||||||||
| Carl’s Jr. |
$ | 657,900 | $ | 353,492 | $ | 383,234 | $ | 852,479 | ||||||||
| Hardee’s |
621,782 | 325,213 | 268,523 | 565,462 | ||||||||||||
| Other |
645 | 403 | 362 | 792 | ||||||||||||
|
|
|
|
|
|
|
|
|
|||||||||
| Total |
$ | 1,280,327 | $ | 679,108 | $ | 652,119 | $ | 1,418,733 | ||||||||
|
|
|
|
|
|
|
|
|
|||||||||
| Segment income: |
||||||||||||||||
| Carl’s Jr. |
$ | 86,614 | $ | 50,776 | $ | 45,280 | $ | 118,678 | ||||||||
| Hardee’s(1) |
107,164 | 58,253 | 47,693 | 99,619 | ||||||||||||
| Other |
501 | 225 | 208 | 472 | ||||||||||||
|
|
|
|
|
|
|
|
|
|||||||||
| Total |
194,279 | 109,254 | 93,181 | 218,769 | ||||||||||||
|
|
|
|
|
|
|
|
|
|||||||||
| Less: General and administrative expense |
(130,858 | ) | (84,833 | ) | (59,859 | ) | (134,579 | ) | ||||||||
| Less: Facility action charges, net |
6,018 | (1,683 | ) | (590 | ) | (4,695 | ) | |||||||||
| Less: Other operating expenses, net |
(545 | ) | (20,003 | ) | (10,249 | ) | — | |||||||||
|
|
|
|
|
|
|
|
|
|||||||||
| Operating income |
68,894 | 2,735 | 22,483 | 79,495 | ||||||||||||
| Interest expense |
(98,124 | ) | (43,681 | ) | (8,617 | ) | (19,254 | ) | ||||||||
| Other (expense) income, net |
(1,658 | ) | 1,645 | (13,609 | ) | 2,935 | ||||||||||
|
|
|
|
|
|
|
|
|
|||||||||
| (Loss) income before income taxes |
$ | (30,888 | ) | $ | (39,301 | ) | $ | 257 | $ | 63,176 | ||||||
|
|
|
|
|
|
|
|
|
|||||||||
| Capital expenditures: |
||||||||||||||||
| Carl’s Jr. |
$ | 23,353 | $ | 12,528 | $ | 13,079 | $ | 42,368 | ||||||||
| Hardee’s |
27,784 | 16,291 | 20,307 | 50,335 | ||||||||||||
| Other |
1,286 | 541 | 352 | 9,725 | ||||||||||||
|
|
|
|
|
|
|
|
|
|||||||||
| Total |
$ | 52,423 | $ | 29,360 | $ | 33,738 | $ | 102,428 | ||||||||
|
|
|
|
|
|
|
|
|
|||||||||
| Depreciation and amortization: |
||||||||||||||||
| Depreciation and amortization included in segment income: |
||||||||||||||||
| Carl’s Jr. |
$ | 37,785 | $ | 19,637 | $ | 15,586 | $ | 33,002 | ||||||||
| Hardee’s |
40,888 | 20,379 | 16,214 | 33,224 | ||||||||||||
| Other |
— | — | — | — | ||||||||||||
| Other depreciation and amortization(2) |
3,371 | 1,865 | 1,903 | 4,838 | ||||||||||||
|
|
|
|
|
|
|
|
|
|||||||||
| Total depreciation and amortization |
$ | 82,044 | $ | 41,881 | $ | 33,703 | $ | 71,064 | ||||||||
|
|
|
|
|
|
|
|
|
|||||||||
| Successor | ||||||||||||||||
| January 31, 2012 |
January 31, 2011 |
|||||||||||||||
| Total assets: |
||||||||||||||||
| Carl’s Jr. |
$ | 779,970 | $ | 779,306 | ||||||||||||
| Hardee’s |
633,127 | 648,813 | ||||||||||||||
| Other |
64,990 | 68,047 | ||||||||||||||
|
|
|
|
|
|||||||||||||
| Total |
$ | 1,478,087 | $ | 1,496,166 | ||||||||||||
|
|
|
|
|
|||||||||||||
| (1) | Fiscal 2012 includes a charge of $1,976 related to the out-of-period Insurance Reserve Adjustment as described in more detail in Note 1. |
| (2) | Represents depreciation and amortization excluded from the computation of segment income. |
F-45
Table of Contents
CKE INC. AND SUBSIDIARIES
NOTES TO CONSOLIDATED FINANCIAL STATEMENTS (Continued)
NOTE 23—SUPPLEMENTAL CASH FLOW INFORMATION
The following table presents supplemental cash flow information:
| Successor | Predecessor | |||||||||||||||
| Fiscal 2012 |
Twenty-Nine Weeks Ended January 31, 2011 |
Twenty-Four Weeks Ended July 12, 2010 |
Fiscal 2010 |
|||||||||||||
| Cash paid for (received from): |
||||||||||||||||
| Interest, net of amounts capitalized(1) |
$ | 72,944 | $ | 53,374 | $ | 8,299 | $ | 19,590 | ||||||||
| Income taxes, net |
(3,228 | ) | (6,474 | ) | 530 | 7,747 | ||||||||||
| Non-cash investing and financing activities: |
||||||||||||||||
| Proceeds receivable from sale of distribution center assets |
— | — | 1,992 | — | ||||||||||||
| Dividends declared, not paid |
— | — | — | 3,317 | ||||||||||||
| Capital lease obligations incurred to acquire assets |
2,976 | 93 | 4,179 | 15,951 | ||||||||||||
| Accrued property and equipment purchases |
1,700 | 3,158 | 4,593 | 7,152 | ||||||||||||
| (1) | Cash paid for interest, net of amounts capitalized, includes $14,844, $3,750 and $8,912 of payments related to our fixed rate interest rate swap agreements during the Successor twenty-nine weeks ended January 31, 2011, the Predecessor twenty-four weeks ended July 12, 2010 and fiscal 2010, respectively. |
During fiscal 2012, we recorded a non-cash transaction to acquire three Hardee’s restaurants from one of our franchisees for an aggregate purchase price of $1,500. The entire purchase price was applied as a reduction of outstanding promissory notes due to the Company. See Note 6 for additional discussion.
NOTE 24—SELECTED QUARTERLY FINANCIAL DATA (UNAUDITED)
The following table presents our summarized quarterly results:
| Successor | ||||||||||||||||
| 1st Quarter |
2nd Quarter |
3rd Quarter |
4th Quarter |
|||||||||||||
| Fiscal 2012: |
||||||||||||||||
| Total revenue |
$ | 400,583 | $ | 299,729 | $ | 292,619 | $ | 287,396 | ||||||||
| Operating income |
19,573 | 17,486 | 14,007 | 17,828 | ||||||||||||
| Net loss |
(5,302 | ) | (5,340 | ) | (4,264 | ) | (4,373 | ) | ||||||||
| Basic loss per common share |
(53,020 | ) | (53,400 | ) | (42,640 | ) | (43,730 | ) | ||||||||
| Predecessor | Successor | |||||||||||||||||||
| 2nd Quarter | ||||||||||||||||||||
| 1st Quarter |
Eight Weeks Ended July 12, 2010 |
Four Weeks Ended August 9, 2010 |
3rd Quarter |
4th Quarter |
||||||||||||||||
| Fiscal 2011: |
||||||||||||||||||||
| Total revenue |
$ | 435,185 | $ | 216,934 | $ | 97,029 | $ | 284,787 | $ | 297,292 | ||||||||||
| Operating income (loss) |
13,546 | 8,937 | (22,810 | ) | 14,554 | 10,991 | ||||||||||||||
| Net (loss) income |
(3,093 | ) | (4,422 | ) | (22,888 | ) | 45 | (5,047 | ) | |||||||||||
| Basic (loss) income per common share |
(228,880 | ) | 450 | (50,470 | ) | |||||||||||||||
F-46
Table of Contents
CKE INC. AND SUBSIDIARIES
NOTES TO CONSOLIDATED FINANCIAL STATEMENTS (Continued)
Quarterly operating results are not necessarily representative of operations for a full year for various reasons, including the seasonal nature of the quick-service restaurant industry and unpredictable weather conditions, which may affect sales volume and food costs. In addition, the first quarter of our fiscal year is comprised of four four-week accounting periods and all other quarters have three four-week accounting periods, except our fourth quarter of fiscal 2011, which contains one additional week (see Note 1).
Fourth Quarter Adjustment
During the fourth quarter of fiscal 2012, we recorded the out-of-period Insurance Reserve Adjustment to correct our previously reported Hardee’s self-insured workers’ compensation claims reserves. As a result, we increased our estimated liability for self-insurance by $1,976, resulting in a corresponding increase of $1,976 in payroll and other employee benefits expense. See further discussion in Note 1.
F-47
Table of Contents
SCHEDULE I—CONDENSED FINANCIAL INFORMATION OF REGISTRANT
CKE INC. (PARENT COMPANY ONLY)
CONDENSED BALANCE SHEETS
(In thousands, except shares and par values)
| January 31, 2012 | January 31, 2011 | |||||||
| ASSETS |
||||||||
| Current Assets: |
||||||||
| Cash and cash equivalents |
$ | 30 | $ | — | ||||
|
|
|
|
|
|||||
| Total current assets |
30 | — | ||||||
| Investment in subsidiary |
423,101 | 424,769 | ||||||
| Other assets |
5,473 | — | ||||||
|
|
|
|
|
|||||
| Total assets |
$ | 428,604 | $ | 424,769 | ||||
|
|
|
|
|
|||||
| LIABILITIES AND STOCKHOLDER’S EQUITY |
||||||||
| Liabilities: |
||||||||
| Other current liabilities |
$ | 1 | $ | — | ||||
|
|
|
|
|
|||||
| Total current liabilities |
1 | — | ||||||
| Long-term debt |
207,879 | — | ||||||
| Other long-term liabilities |
8,947 | — | ||||||
|
|
|
|
|
|||||
| Total liabilities |
216,827 | — | ||||||
|
|
|
|
|
|||||
| Commitments and contingencies (Notes 3 and 4) |
||||||||
| Stockholder’s equity: |
||||||||
| Common stock, $0.01 par value; 100 shares authorized, issued and outstanding as of January 31, 2012 and 2011 |
— | — | ||||||
| Additional paid-in capital |
450,000 | 450,000 | ||||||
| Accumulated deficit |
(238,223 | ) | (25,231 | ) | ||||
|
|
|
|
|
|||||
| Total stockholder’s equity |
211,777 | 424,769 | ||||||
|
|
|
|
|
|||||
| Total liabilities and stockholder’s equity |
$ | 428,604 | $ | 424,769 | ||||
|
|
|
|
|
|||||
See Accompanying Notes to Condensed Financial Information.
F-48
Table of Contents
SCHEDULE I—CONDENSED FINANCIAL INFORMATION OF REGISTRANT
CKE INC. (PARENT COMPANY ONLY)
CONDENSED STATEMENTS OF OPERATIONS
(In thousands)
| Fiscal 2012 | Twenty-Nine Weeks Ended January 31, 2011 |
|||||||
| General and administrative expenses |
$ | 1 | $ | — | ||||
| Interest expense |
21,134 | — | ||||||
| Equity in loss of subsidiary |
1,668 | 25,231 | ||||||
|
|
|
|
|
|||||
| Loss before income taxes |
(22,803 | ) | (25,231 | ) | ||||
| Income tax expense |
1 | — | ||||||
|
|
|
|
|
|||||
| Net loss |
$ | (22,804 | ) | $ | (25,231 | ) | ||
|
|
|
|
|
|||||
See Accompanying Notes to Condensed Financial Information.
F-49
Table of Contents
SCHEDULE I—CONDENSED FINANCIAL INFORMATION OF REGISTRANT
CKE INC. (PARENT COMPANY ONLY)
CONDENSED STATEMENTS OF CASH FLOWS
(In thousands)
| Fiscal 2012 | Twenty-Nine Weeks Ended January 31, 2011 |
|||||||
| Cash flows from operating activities: |
||||||||
| Net loss |
$ | (22,804 | ) | $ | (25,231 | ) | ||
| Adjustments to reconcile net loss to net cash used in operating activities: |
||||||||
| Equity in loss of subsidiary |
1,668 | 25,231 | ||||||
| Interest expense converted to long-term debt |
11,313 | — | ||||||
| Amortization of deferred financing costs and discount on notes |
873 | — | ||||||
| Increase in other current and long-term liabilities |
8,948 | — | ||||||
|
|
|
|
|
|||||
| Net cash used in operating activities |
(2 | ) | — | |||||
|
|
|
|
|
|||||
| Cash flows from investing activities: |
||||||||
| Investment in subsidiary |
— | (450,000 | ) | |||||
|
|
|
|
|
|||||
| Net cash used in investing activities |
— | (450,000 | ) | |||||
|
|
|
|
|
|||||
| Cash flows from financing activities: |
||||||||
| Equity contribution |
— | 450,000 | ||||||
| Proceeds from issuance of notes, net of original issue discount |
196,230 | — | ||||||
| Payment of deferred financing costs |
(6,010 | ) | — | |||||
| Dividends paid on common stock |
(190,188 | ) | — | |||||
|
|
|
|
|
|||||
| Net cash provided by financing activities |
32 | 450,000 | ||||||
|
|
|
|
|
|||||
| Net increase in cash and cash equivalents |
30 | — | ||||||
| Cash and cash equivalents at beginning of period |
— | — | ||||||
|
|
|
|
|
|||||
| Cash and cash equivalents at end of period |
$ | 30 | $ | — | ||||
|
|
|
|
|
|||||
See Accompanying Notes to Condensed Financial Information.
F-50
Table of Contents
SCHEDULE I—CONDENSED FINANCIAL INFORMATION OF REGISTRANT
CKE INC. (PARENT COMPANY ONLY)
NOTES TO CONDENSED FINANCIAL INFORMATION
(In thousands)
NOTE 1—BASIS OF PRESENTATION
CKE Inc. (“CKE”) was formed on April 15, 2010. There was no business activity at CKE prior to the date of the Merger, which was July 12, 2010, as discussed further in Note 1 of Notes to Consolidated Financial Statements of CKE Inc. and subsidiaries included herein. As a result, this condensed parent company financial information of CKE includes the condensed balance sheets, results of operations and cash flows for periods after the date of the Merger.
The condensed parent company financial information of CKE has been provided in accordance with the rules and regulations of the Securities and Exchange Commission (“SEC”) and should be read in conjunction with the Consolidated Financial Statements of CKE Inc. and subsidiaries. Pursuant to the SEC rules and regulations, the condensed parent company financial information does not include all of the financial information and notes normally included with financial statements prepared in accordance with U.S. generally accepted accounting principles (“GAAP”).
The condensed parent company financial information has been prepared using the same accounting policies as described in Note 1 of Notes to Consolidated Financial Statements of CKE Inc. and subsidiaries included herein, except for the investment in subsidiary. For the purposes of this schedule, CKE’s investment in CKE Restaurants, Inc. (“CKE Restaurants”), its wholly-owned subsidiary, is presented based upon the proportionate share of the subsidiary’s net assets. As prescribed by SEC rules and regulations, the change in the net assets of the subsidiary is recorded as equity income/loss in subsidiary in the Condensed Statements of Operations of CKE. During fiscal 2012, for accounting purposes CKE Restaurants recorded a deemed dividend to CKE of $8,362 associated with the subsidiary’s purchase of CKE’s Toggle Notes, referred to as the Purchased Toggle Notes (See Note 9 of Notes to Consolidated Financial Statements of CKE Inc. and subsidiaries). The Purchased Toggle Notes are included in CKE’s long-term debt, and this dividend was not paid in cash to CKE. As a result, the deemed dividend was not reflected as a reduction of CKE’s investment in subsidiary during fiscal 2012 in the condensed parent company financial information.
NOTE 2—DIVIDENDS FROM SUBSIDIARY
CKE did not receive any dividends during fiscal 2012 or the twenty-nine weeks ended January 31, 2011.
NOTE 3—LONG-TERM DEBT
During fiscal 2012, CKE issued $200,000 aggregate principal amount of senior unsecured PIK toggle notes (the “Toggle Notes”). A summary of the terms, conditions and activity relating to the Toggle Notes is included within Note 9 of Notes to Consolidated Financial Statements of CKE Inc. and subsidiaries. The entire balance of the Toggle Notes of $345,801 will become due on March 14, 2016. In determining the amount due at maturity, we have assumed that all future interest payments on the Toggle Notes will be paid entirely in PIK Interest. In addition, the amount due at maturity includes the amounts due to CKE Restaurants for the Purchased Toggle Notes (See Note 9 of Notes to Consolidated Financial Statements of CKE Inc. and subsidiaries).
CKE has unconditionally guaranteed the obligations under CKE Restaurants’ Credit Facility. See further discussion in Note 9 of Notes to Consolidated Financial Statements of CKE Inc. and subsidiaries.
F-51
Table of Contents
SCHEDULE I—CONDENSED FINANCIAL INFORMATION OF REGISTRANT
CKE INC. (PARENT COMPANY ONLY)
NOTES TO CONDENSED FINANCIAL INFORMATION (Continued)
(In thousands)
NOTE 4—COMMITMENTS AND CONTINGENT LIABILITIES
See Note 15 of Notes to Consolidated Financial Statements of CKE Inc. and subsidiaries included herein.
Other than as discussed in Note 3 above, CKE did not have any separate material long-term obligations or guarantees as of January 31, 2012.
F-52
Table of Contents
CKE INC. AND SUBSIDIARIES
CONDENSED CONSOLIDATED BALANCE SHEETS
(In thousands, except shares and par values)
(Unaudited)
| May 21, 2012 | January 31, 2012 | |||||||
| ASSETS |
||||||||
| Current assets: |
||||||||
| Cash and cash equivalents |
$ | 125,447 | $ | 64,585 | ||||
| Accounts receivable, net of allowance for doubtful accounts of $24 as of May 21, 2012 and $38 as of January 31, 2012 |
22,351 | 24,099 | ||||||
| Related party trade receivables |
358 | 252 | ||||||
| Inventories |
15,728 | 16,144 | ||||||
| Prepaid expenses |
11,300 | 15,897 | ||||||
| Advertising fund assets, restricted |
18,822 | 18,407 | ||||||
| Deferred income tax assets, net |
19,173 | 17,843 | ||||||
| Other current assets |
4,290 | 3,695 | ||||||
|
|
|
|
|
|||||
| Total current assets |
217,469 | 160,922 | ||||||
| Property and equipment, net of accumulated depreciation and amortization of $140,738 as of May 21, 2012 and $117,010 as of January 31, 2012 |
636,240 | 645,552 | ||||||
| Goodwill |
208,885 | 208,885 | ||||||
| Intangible assets, net |
428,399 | 433,139 | ||||||
| Other assets, net |
30,531 | 29,589 | ||||||
|
|
|
|
|
|||||
| Total assets |
$ | 1,521,524 | $ | 1,478,087 | ||||
|
|
|
|
|
|||||
| LIABILITIES AND STOCKHOLDER’S EQUITY |
||||||||
| Current liabilities: |
||||||||
| Current portion of long-term debt |
$ | 3 | $ | 3 | ||||
| Current portion of capital lease obligations |
7,951 | 7,988 | ||||||
| Accounts payable |
28,179 | 40,790 | ||||||
| Advertising fund liabilities |
18,822 | 18,407 | ||||||
| Other current liabilities |
104,188 | 84,510 | ||||||
|
|
|
|
|
|||||
| Total current liabilities |
159,143 | 151,698 | ||||||
| Long-term debt, less current portion |
733,485 | 721,731 | ||||||
| Capital lease obligations, less current portion |
32,651 | 34,981 | ||||||
| Deferred income tax liabilities, net |
138,417 | 143,489 | ||||||
| Other long-term liabilities |
229,820 | 206,293 | ||||||
|
|
|
|
|
|||||
| Total liabilities |
1,293,516 | 1,258,192 | ||||||
|
|
|
|
|
|||||
| Commitments and contingencies (Notes 4, 5, 7 and 13) |
||||||||
| Stockholder’s equity: |
||||||||
| Common stock, $0.01 par value; 100 shares authorized, issued and outstanding as of May 21, 2012 and January 31, 2012 |
— | — | ||||||
| Additional paid-in capital |
458,669 | 457,252 | ||||||
| Accumulated deficit |
(230,661 | ) | (237,357 | ) | ||||
|
|
|
|
|
|||||
| Total stockholder’s equity |
228,008 | 219,895 | ||||||
|
|
|
|
|
|||||
| Total liabilities and stockholder’s equity |
$ | 1,521,524 | $ | 1,478,087 | ||||
|
|
|
|
|
|||||
See Accompanying Notes to Condensed Consolidated Financial Statements
F-53
Table of Contents
CKE INC. AND SUBSIDIARIES
CONDENSED CONSOLIDATED STATEMENTS OF OPERATIONS
(In thousands, except shares and per share amounts)
(Unaudited)
| Sixteen Weeks Ended |
Sixteen Weeks Ended |
|||||||
| May 21, 2012 | May 23, 2011 | |||||||
| Revenue: |
||||||||
| Company-operated restaurants |
$ | 361,466 | $ | 351,604 | ||||
| Franchised restaurants and other |
50,865 | 48,979 | ||||||
|
|
|
|
|
|||||
| Total revenue |
412,331 | 400,583 | ||||||
|
|
|
|
|
|||||
| Operating costs and expenses: |
||||||||
| Restaurant operating costs: |
||||||||
| Food and packaging |
108,502 | 108,902 | ||||||
| Payroll and other employee benefits |
102,765 | 101,663 | ||||||
| Occupancy and other |
81,485 | 82,683 | ||||||
|
|
|
|
|
|||||
| Total restaurant operating costs |
292,752 | 293,248 | ||||||
| Franchised restaurants and other |
25,629 | 25,878 | ||||||
| Advertising |
20,852 | 20,061 | ||||||
| General and administrative |
41,791 | 40,961 | ||||||
| Facility action charges, net |
401 | 511 | ||||||
| Other operating expenses |
— | 351 | ||||||
|
|
|
|
|
|||||
| Total operating costs and expenses |
381,425 | 381,010 | ||||||
|
|
|
|
|
|||||
| Operating income |
30,906 | 19,573 | ||||||
| Interest expense |
(31,310 | ) | (28,850 | ) | ||||
| Other income, net |
1,149 | 799 | ||||||
|
|
|
|
|
|||||
| Income (loss) before income taxes |
745 | (8,478 | ) | |||||
| Income tax benefit |
(5,951 | ) | (3,176 | ) | ||||
|
|
|
|
|
|||||
| Net income (loss) |
$ | 6,696 | $ | (5,302 | ) | |||
|
|
|
|
|
|||||
| Income (loss) per common share—basic and diluted |
$ | 66,960 | $ | (53,020 | ) | |||
|
|
|
|
|
|||||
| Dividends per common share |
$ | — | $ | 1,900,000 | ||||
|
|
|
|
|
|||||
| Weighted average shares outstanding—basic and diluted |
100 | 100 | ||||||
|
|
|
|
|
|||||
See Accompanying Notes to Condensed Consolidated Financial Statements
F-54
Table of Contents
CKE INC. AND SUBSIDIARIES
CONDENSED CONSOLIDATED STATEMENTS OF CASH FLOWS
(In thousands)
(Unaudited)
| Sixteen Weeks Ended |
Sixteen Weeks Ended |
|||||||
| May 21, 2012 | May 23, 2011 | |||||||
| Cash flows from operating activities: |
||||||||
| Net income (loss) |
$ | 6,696 | $ | (5,302 | ) | |||
| Adjustments to reconcile net income (loss) to net cash provided by operating activities: |
||||||||
| Depreciation and amortization |
25,467 | 24,938 | ||||||
| Amortization of deferred financing costs and discount on notes |
1,682 | 1,419 | ||||||
| Interest expense converted to long-term debt |
11,326 | — | ||||||
| Share-based compensation expense |
1,417 | 1,469 | ||||||
| (Recovery of) provision for losses on accounts and notes receivable |
(11 | ) | 71 | |||||
| (Gain) loss on disposal of property and equipment |
(13 | ) | 557 | |||||
| Deferred income taxes |
(6,402 | ) | (3,668 | ) | ||||
| Other non-cash charges (gains) |
297 | (55 | ) | |||||
| Net changes in operating assets and liabilities: |
||||||||
| Receivables, inventories, prepaid expenses and other current and non-current assets |
5,198 | 2,071 | ||||||
| Estimated liability for closed restaurants and estimated liability for self-insurance |
152 | 834 | ||||||
| Accounts payable and other current and long-term liabilities |
12,560 | 31,963 | ||||||
|
|
|
|
|
|||||
| Net cash provided by operating activities |
58,369 | 54,297 | ||||||
|
|
|
|
|
|||||
| Cash flows from investing activities: |
||||||||
| Purchases of property and equipment |
(15,725 | ) | (13,581 | ) | ||||
| Proceeds from sale of property and equipment |
350 | 947 | ||||||
| Collections of non-trade notes receivable |
841 | 572 | ||||||
| Other investing activities |
73 | 57 | ||||||
|
|
|
|
|
|||||
| Net cash used in investing activities |
(14,461 | ) | (12,005 | ) | ||||
|
|
|
|
|
|||||
| Cash flows from financing activities: |
||||||||
| Net change in bank overdraft |
(8,790 | ) | (6,382 | ) | ||||
| Proceeds from issuance of notes, net of original issue discount |
— | 196,230 | ||||||
| Proceeds from financing method sale-leaseback transactions |
29,946 | — | ||||||
| Payment of deferred financing costs |
(1,676 | ) | (6,054 | ) | ||||
| Repayments of other long-term debt |
(2 | ) | (9 | ) | ||||
| Repayments of capital lease obligations |
(2,524 | ) | (2,506 | ) | ||||
| Dividends paid on common stock |
— | (190,000 | ) | |||||
|
|
|
|
|
|||||
| Net cash provided by (used in) financing activities |
16,954 | (8,721 | ) | |||||
|
|
|
|
|
|||||
| Net increase in cash and cash equivalents |
60,862 | 33,571 | ||||||
| Cash and cash equivalents at beginning of period |
64,585 | 42,586 | ||||||
|
|
|
|
|
|||||
| Cash and cash equivalents at end of period |
$ | 125,447 | $ | 76,157 | ||||
|
|
|
|
|
|||||
See Accompanying Notes to Condensed Consolidated Financial Statements
F-55
Table of Contents
CKE INC. AND SUBSIDIARIES
NOTES TO CONDENSED CONSOLIDATED FINANCIAL STATEMENTS
(Dollars in thousands, except per share amounts)
(Unaudited)
NOTE 1 — BASIS OF PRESENTATION AND DESCRIPTION OF BUSINESS
Description of Business
CKE Inc. (“CKE”), through its wholly-owned subsidiaries, owns, operates and franchises the Carl’s Jr.®, Hardee’s®, Green Burrito® and Red Burrito® concepts. References to CKE and its consolidated subsidiaries (the “Company”) throughout these Notes to Condensed Consolidated Financial Statements are made using the first person notations of “we,” “us” and “our.”
Domestic Carl’s Jr. restaurants are predominately located in the Western United States, primarily in California, with a growing presence in Texas. International Carl’s Jr. restaurants are located primarily in Mexico, with a growing presence in the rest of Latin America, Russia and Asia. Hardee’s restaurants are primarily located throughout the Southeastern and Midwestern United States, with a growing international presence in the Middle East and Central Asia. Green Burrito restaurants are primarily located in dual-branded Carl’s Jr. restaurants. The Red Burrito concept is located in dual-branded Hardee’s restaurants. As of May 21, 2012, our system-wide restaurant portfolio consisted of:
| Carl’s Jr. | Hardee’s | Other | Total | |||||||||||||
| Company-operated |
424 | 468 | — | 892 | ||||||||||||
| Domestic franchised |
694 | 1,227 | 9 | 1,930 | ||||||||||||
| International franchised |
204 | 237 | — | 441 | ||||||||||||
|
|
|
|
|
|
|
|
|
|||||||||
| Total |
1,322 | 1,932 | 9 | 3,263 | ||||||||||||
|
|
|
|
|
|
|
|
|
|||||||||
As of May 21, 2012, 261 of our 424 company-operated Carl’s Jr. restaurants were dual-branded with Green Burrito and 242 of our 468 company-operated Hardee’s restaurants were dual-branded with Red Burrito.
Basis of Presentation and Fiscal Year
Our accompanying unaudited Condensed Consolidated Financial Statements include the accounts of CKE, its consolidated subsidiaries and its consolidated variable interest entities (“VIE”). These unaudited Condensed Consolidated Financial Statements have been prepared in accordance with accounting principles generally accepted in the United States (“GAAP”) and Article 10 of Regulation S-X. CKE does not have any non-controlling interests in other entities. These financial statements should be read in conjunction with the audited Consolidated Financial Statements for the fiscal year ended January 31, 2012 included elsewhere in this prospectus. In our opinion, all adjustments considered necessary for a fair presentation of financial position and results of operations for this interim period have been included. The results of operations for such interim period are not necessarily indicative of results for the full year or for any future period.
We operate on a retail accounting calendar. Our fiscal year ends on the last Monday in January and typically has 13 four-week accounting periods. For clarity of presentation, we generally label all fiscal year ends as if the fiscal year ended January 31. Accordingly, the fiscal year ended January 30, 2012 is referred to herein as the fiscal year ended January 31, 2012 or fiscal 2012, and the fiscal year ending January 28, 2013 is referred to herein as the fiscal year ending January 31, 2013 or fiscal 2013. The first quarter of our fiscal year has four periods, or 16 weeks. All other quarters generally have three periods, or 12 weeks.
Our restaurant sales, and therefore our profitability, are subject to seasonal fluctuations and are traditionally higher during the spring and summer months because of factors such as increased travel during school vacations and improved weather conditions, which affect the public’s dining habits.
F-56
Table of Contents
CKE INC. AND SUBSIDIARIES
NOTES TO CONDENSED CONSOLIDATED FINANCIAL STATEMENTS
(Dollars in thousands, except per share amounts)
(Unaudited)
Certain prior year amounts in these unaudited Condensed Consolidated Financial Statements have been reclassified to conform to the current year presentation.
Variable Interest Entities
We consolidate one national and approximately 80 local co-operative advertising funds (“Hardee’s Funds”) as we have concluded that they are VIEs for which we are the primary beneficiary. We have included $18,822 and $18,407 of advertising fund assets, restricted, and advertising fund liabilities in our accompanying unaudited Condensed Consolidated Balance Sheets as of May 21, 2012 and January 31, 2012, respectively. Consolidation of the Hardee’s Funds had no impact on our accompanying unaudited Condensed Consolidated Statements of Operations and Cash Flows. We have no rights to the assets, nor do we have any obligation with respect to the liabilities, of the Hardee’s Funds, and none of our assets serve as collateral for the creditors of these VIEs.
NOTE 2 —ACCOUNTING PRONOUNCEMENTS NOT YET ADOPTED AND ADOPTION OF NEW ACCOUNTING PRONOUNCEMENTS
In September 2011, the FASB updated its guidance on the annual testing of goodwill for impairment to allow companies to first assess qualitative factors to determine whether it is necessary to perform the two-step goodwill impairment test. If an entity determines, based on qualitative factors, that it is not more likely than not that a reporting unit’s fair value is less than its carrying amount, then it is not required to perform the quantitative two-step goodwill impairment test. This guidance is effective for annual and interim goodwill impairment tests performed for fiscal years beginning after December 15, 2011. The provisions of this guidance apply to CKE beginning in fiscal 2013. The adoption of this guidance has not had, and is not expected to have, a material impact on our Condensed Consolidated Financial Statements.
NOTE 3 — PURCHASE OF ASSETS
During the sixteen weeks ended May 23, 2011, we purchased three Hardee’s restaurants from one of our franchisees for the aggregate purchase price consideration of $1,500, which was reduced by the settlement of certain pre-existing liabilities, resulting in a net purchase price consideration of $1,207. As a result of this transaction, we recorded property and equipment (including capital lease assets) of $109, identifiable intangible assets of $85 and capital lease obligations of $55, resulting in $1,068 of additional goodwill in our Hardee’s operating segment.
We did not purchase any restaurants from franchisees during the sixteen weeks ended May 21, 2012.
NOTE 4 — INDEBTEDNESS AND INTEREST EXPENSE
CKE Restaurants, Inc. (“CKE Restaurants”), our wholly-owned subsidiary, has a senior secured revolving credit facility (the “Credit Facility”) that provides for senior secured revolving facility loans, swingline loans and letters of credit in an aggregate amount of up to $100,000. As of May 21, 2012, we had no outstanding loan borrowings, $30,913 of outstanding letters of credit and remaining availability of $69,087 under our Credit Facility. The Credit Facility bears interest at a rate equal to, at our option, either: (1) the higher of Morgan Stanley’s “prime rate” plus 2.75% or the federal funds rate, as defined in our Credit Facility, plus 3.25%, or (2) the London Interbank Offered Rate (“LIBOR”) plus 3.75%.
The terms of our Credit Facility include financial performance covenants applicable to CKE Restaurants and its consolidated subsidiaries, which include a maximum secured leverage ratio and a specified minimum interest
F-57
Table of Contents
CKE INC. AND SUBSIDIARIES
NOTES TO CONDENSED CONSOLIDATED FINANCIAL STATEMENTS
(Dollars in thousands, except per share amounts)
(Unaudited)
coverage ratio. As of May 21, 2012, the financial performance covenants contained in the Credit Facility did not limit our ability to draw on the remaining availability of $69,087 under our Credit Facility.
As of May 21, 2012, the carrying value of CKE Restaurants’ senior secured second lien notes (the “Senior Secured Notes”) was $523,544, which is presented net of the remaining unamortized portion of the original issue discount of $8,578 in our accompanying unaudited Condensed Consolidated Balance Sheet. The aggregate principal amount of the Senior Secured Notes outstanding was $532,122 as of May 21, 2012. The Senior Secured Notes bear interest at a rate of 11.375% per annum, payable semi-annually in arrears on January 15 and July 15.
On June 15, 2012, the holders of the Senior Secured Notes were notified that we will redeem $60,000 aggregate principal amount of Senior Secured Notes outstanding on July 16, 2012 at a redemption price of 103% of the aggregate principal amount of the Senior Secured Notes being redeemed pursuant to the terms of the indenture governing the Senior Secured Notes.
Each of CKE Restaurants’ wholly-owned domestic subsidiaries that guarantees the obligations under the Credit Facility also guarantees the performance and punctual payment when due, whether at stated maturity, by acceleration or otherwise, of all obligations under the Senior Secured Notes. CKE Restaurants’ obligations and the obligations of the guarantors are secured by a second-priority lien on the assets that secure CKE Restaurants’ and its subsidiary guarantors’ obligations under our Credit Facility, subject to certain exceptions and permitted liens.
As of May 21, 2012, the carrying value of CKE’s senior unsecured PIK toggle notes (the “Toggle Notes”) was $209,556, which is presented net of the remaining unamortized portion of the original issue discount of $3,135. The interest on the Toggle Notes, which is payable semi-annually on March 15 and September 15 of each year, can be paid (1) entirely in cash, at a rate of 10.50% (“Cash Interest”), (2) entirely by increasing the principal amount of the note or by issuing new notes for the entire amount of the interest payment, at a rate per annum equal to the cash interest rate of 10.50% plus 0.75% (“PIK Interest”) or (3) with a 25%/75%, 50%/50% or 75%/25% combination of Cash Interest and PIK Interest.
During the sixteen weeks ended May 21, 2012, we made our March 15, 2012 interest payment on the Toggle Notes, in the amount of $11,326 entirely in PIK Interest. As of May 21, 2012, the aggregate principal amount of the Toggle Notes outstanding was $212,691. We will pay the September 15, 2012 interest payment entirely in PIK Interest.
F-58
Table of Contents
CKE INC. AND SUBSIDIARIES
NOTES TO CONDENSED CONSOLIDATED FINANCIAL STATEMENTS
(Dollars in thousands, except per share amounts)
(Unaudited)
Interest Expense
Interest expense consisted of the following:
| Sixteen Weeks Ended |
Sixteen Weeks Ended |
|||||||
| May 21, 2012 | May 23, 2011 | |||||||
| Senior secured revolving credit facility |
$ | — | $ | — | ||||
| Senior secured second lien notes |
18,624 | 21,116 | ||||||
| Senior unsecured PIK toggle notes |
7,157 | 4,280 | ||||||
| Amortization of deferred financing costs and discount on notes |
1,682 | 1,419 | ||||||
| Capital lease obligations |
1,280 | 1,462 | ||||||
| Financing method sale-leaseback transactions(1) |
2,090 | — | ||||||
| Letter of credit fees and other |
477 | 573 | ||||||
|
|
|
|
|
|||||
| $ | 31,310 | $ | 28,850 | |||||
|
|
|
|
|
|||||
| (1) | See Note 5. |
As of May 21, 2012 and January 31, 2012, our current portion of accrued interest of $21,377 and $2,650, respectively, has been included within other current liabilities in our accompanying unaudited Condensed Consolidated Balance Sheets. As of May 21, 2012 and January 31, 2012, our long-term accrued interest of $4,356 and $8,526, respectively, has been included within other long-term liabilities in our accompanying unaudited Condensed Consolidated Balance Sheets.
NOTE 5 — SALE-LEASEBACK TRANSACTIONS
During the sixteen weeks ended May 21, 2012, we entered into agreements with independent third parties under which we sold and leased back 2 Carl’s Jr. and 18 Hardee’s restaurant properties. The initial minimum lease terms are 20 years, and the leases include renewal options and right of first offer provisions that, for accounting purposes, constitute continuing involvement with the associated restaurant properties. Due to this continuing involvement, these sale-leaseback transactions are accounted for under the financing method, rather than as completed sales. Under the financing method, we include the sales proceeds received in other long-term liabilities until our continuing involvement with the properties is terminated, report the associated property as owned assets, continue to depreciate the assets over their remaining useful lives, and record the rental payments as interest expense. Closing costs and other fees related to these sale-leaseback transactions are recorded as deferred financing costs and amortized to interest expense over the initial minimum lease term. When and if our continuing involvement with a property terminates and the sale of that property is recognized for accounting purposes, we expect to record a gain equal to the excess of the proceeds received over the remaining net book value of the associated restaurant property and any unamortized deferred financing costs. During the sixteen weeks ended May 21, 2012, we received proceeds of $29,946 and capitalized deferred financing costs of $1,766 in connection with these transactions.
The cumulative proceeds received in connection with financing method sale-leaseback transactions of $97,400 and $67,454 are included in other long-term liabilities in our accompanying unaudited Condensed Consolidated Balance Sheets as of May 21, 2012 and January 31, 2012, respectively. The net book value of the associated assets, which is included in property and equipment, net of accumulated depreciation and amortization in our accompanying unaudited Condensed Consolidated Balance Sheets, was $71,580 and $48,722 as of
F-59
Table of Contents
CKE INC. AND SUBSIDIARIES
NOTES TO CONDENSED CONSOLIDATED FINANCIAL STATEMENTS
(Dollars in thousands, except per share amounts)
(Unaudited)
May 21, 2012 and January 31, 2012, respectively. With respect to the financing method sale-leaseback transactions, our future minimum cash obligations as of May 21, 2012 are $4,647, $6,970, $6,970, $6,970, $7,144, $7,633 and $117,701 for the period from May 22, 2012 through January 31, 2013, for fiscal 2014, 2015, 2016, 2017, 2018 and thereafter, respectively.
NOTE 6 — FAIR VALUE OF FINANCIAL INSTRUMENTS
The following table presents information on our financial instruments as of:
| May 21, 2012 | January 31, 2012 | |||||||||||||||
| Carrying Amount |
Estimated Fair Value |
Carrying Amount |
Estimated Fair Value |
|||||||||||||
| Financial assets: |
||||||||||||||||
| Cash and cash equivalents |
$ | 125,447 | $ | 125,447 | $ | 64,585 | $ | 64,585 | ||||||||
| Notes receivable |
752 | 879 | 1,696 | 2,050 | ||||||||||||
| Financial liabilities: |
||||||||||||||||
| Bank indebtedness and other long-term debt, including current portion |
733,488 | 838,045 | 721,734 | 800,392 | ||||||||||||
The fair value of cash and cash equivalents approximates its carrying amount due to its short maturity. The estimated fair value of notes receivable was determined by discounting future cash flows using current rates at which similar loans might be made to borrowers with similar credit ratings. The estimated fair value of the Senior Secured Notes and the Toggle Notes was determined by using estimated market prices of the outstanding notes. For all other long-term debt, the estimated fair value was determined by discounting future cash flows using rates currently available to us for debt with similar terms and remaining maturities.
Our non-financial assets, which include long-lived assets, including goodwill, intangible assets and property and equipment, are reported at carrying value and are not required to be measured at fair value on a recurring basis. However, on a periodic basis, or whenever events or changes in circumstances indicate that their carrying value may not be recoverable, we assess our long-lived assets for impairment. When impairment has occurred, such long-lived assets are written down to fair value.
NOTE 7 — COMMITMENTS AND CONTINGENT LIABILITIES
Lease Commitments
Under various refranchising programs, we have sold restaurants to franchisees, some of which were on leased sites. We entered into sublease agreements with these franchisees but remained principally liable for the lease obligations. We account for the sublease payments received as franchising rental income in franchised restaurants and other revenue, and the payments on the leases as rental expense in franchised restaurants and other expense, in our accompanying unaudited Condensed Consolidated Statements of Operations. As of May 21, 2012, the present value of the lease obligations under the remaining master leases’ primary terms is $124,349. Franchisees may, from time to time, experience financial hardship and may cease payment on their sublease obligations to us. The present value of the exposure to us from franchisees characterized as under financial hardship is $2,513.
F-60
Table of Contents
CKE INC. AND SUBSIDIARIES
NOTES TO CONDENSED CONSOLIDATED FINANCIAL STATEMENTS
(Dollars in thousands, except per share amounts)
(Unaudited)
Letters of Credit
Pursuant to our Credit Facility, we may borrow up to $100,000 for senior secured revolving facility loans, swingline loans and letters of credit (see Note 4). We have several standby letters of credit outstanding under our Credit Facility, which primarily secure our potential workers’ compensation, general and auto liability obligations. We are required to provide letters of credit each year, or set aside a comparable amount of cash or investment securities in a trust account, based on our existing claims experience. As of May 21, 2012, we had outstanding letters of credit of $30,913, expiring at various dates through August 2012.
Unconditional Purchase Obligations
As of May 21, 2012, we had unconditional purchase obligations in the amount of $89,576, which consisted primarily of contracts for goods and services related to restaurant operations and contractual commitments for marketing and sponsorship arrangements.
Employment Agreements
We have entered into employment agreements with certain key executives (the “Employment Agreements”). Pursuant to the terms of the Employment Agreements, each executive is entitled to receive certain retention bonus payments that will be paid out in October 2012 and 2013, in accordance with such executive’s Employment Agreement. In addition, each executive will be entitled to payments that may be triggered by the termination of employment under certain circumstances, as set forth in each Employment Agreement. If certain provisions are triggered, our Chief Executive Officer shall be entitled to receive an amount equal to his minimum base salary multiplied by six and our President and Chief Legal Officer and our Chief Financial Officer shall each be entitled to receive an amount equal to his respective minimum base salary multiplied by three plus a pro-rata portion of his then-current year bonus. The affected executive may also be entitled to receive a portion of his retention bonus. If all payment provisions of the Employment Agreements had been triggered as of May 21, 2012, we would have been required to make cash payments of approximately $12,301.
Litigation
We are currently involved in legal disputes related to employment claims, real estate claims and other business disputes. As of May 21, 2012, our accrued liability for litigation contingencies with a probable likelihood of loss was $2,395, with an expected range of losses from $2,395 to $5,530. With respect to employment matters, our most significant legal disputes relate to employee meal and rest break disputes, and wage and hour disputes. Several potential class action lawsuits have been filed in the State of California, regarding such employment matters, each of which is seeking injunctive relief and monetary compensation on behalf of current and former employees. The Company intends to vigorously defend against all claims in these lawsuits; however, we are presently unable to predict the ultimate outcome of these actions. As of May 21, 2012, we estimated the contingent liability of those losses related to litigation claims that are not accrued, but that we believe are reasonably possible to result in an adverse outcome and for which a range of loss can be reasonably estimated, to be in the range of $2,135 to $10,425. In addition, we are involved in legal matters where the likelihood of loss has been judged to be reasonably possible, but for which a range of the potential loss cannot be reasonably estimated based on current facts and circumstances.
F-61
Table of Contents
CKE INC. AND SUBSIDIARIES
NOTES TO CONDENSED CONSOLIDATED FINANCIAL STATEMENTS
(Dollars in thousands, except per share amounts)
(Unaudited)
NOTE 8 — SHARE-BASED COMPENSATION
Total share-based compensation expense and associated tax benefits recognized were as follows:
| Sixteen Weeks Ended |
Sixteen Weeks Ended |
|||||||
| May 21, 2012 | May 23, 2011 | |||||||
| Share-based compensation expense related to Units that contain performance conditions |
$ | 740 | $ | 767 | ||||
| Share-based compensation expense related to all other Units |
677 | 702 | ||||||
|
|
|
|
|
|||||
| Total share-based compensation expense |
$ | 1,417 | $ | 1,469 | ||||
|
|
|
|
|
|||||
| Associated tax benefits |
$ | — | $ | — | ||||
|
|
|
|
|
|||||
Funds managed by Apollo Management VII, L.P., certain members of our senior management team and our board of directors formed Apollo CKE Holdings, L.P., a limited partnership (the “Partnership”) to fund the equity contribution to CKE. The Partnership granted profit sharing interests (“Units”) in the Partnership to certain of our senior management team and directors in the form of time vesting and performance vesting Units. Under certain circumstances, a portion of the Units may become subject to both performance and market conditions. The maximum unrecognized compensation cost for the time and performance vesting Units was $8,747 as of May 21, 2012.
NOTE 9 — FACILITY ACTION CHARGES, NET
The components of facility action charges, net are as follows:
| Sixteen Weeks Ended |
Sixteen Weeks Ended |
|||||||
| May 21, 2012 | May 23, 2011 | |||||||
| Estimated liability for new restaurant closures |
$ | — | $ | 133 | ||||
| Adjustments to estimated liability for closed restaurants |
4 | 466 | ||||||
| Impairment of assets to be held and used |
109 | 58 | ||||||
| Gain on disposal of property and equipment |
(234 | ) | (156 | ) | ||||
| Other losses (gains) |
396 | (116 | ) | |||||
| Amortization of discount related to estimated liability for closed restaurants |
126 | 126 | ||||||
|
|
|
|
|
|||||
| $ | 401 | $ | 511 | |||||
|
|
|
|
|
|||||
We evaluate our restaurant-level long-lived assets for impairment whenever events or circumstances indicate that the carrying value of assets may be impaired. We determine whether the assets are recoverable by comparing the undiscounted future cash flows that we expect to generate from their use and disposal to their carrying value. Restaurant-level assets that are not deemed to be recoverable are written down to their estimated fair value, which is determined by assessing the highest and best use of the assets and the amounts that would be received for such assets in an orderly transaction between market participants. The determination of fair value is dependent upon level 3 significant unobservable inputs.
F-62
Table of Contents
CKE INC. AND SUBSIDIARIES
NOTES TO CONDENSED CONSOLIDATED FINANCIAL STATEMENTS
(Dollars in thousands, except per share amounts)
(Unaudited)
Impairment charges recognized in facility action charges, net were recorded against the following asset category:
| Sixteen Weeks Ended |
Sixteen Weeks Ended |
|||||||
| May 21, 2012 | May 23, 2011 | |||||||
| Property and equipment: |
||||||||
| Carl’s Jr. |
$ | — | $ | — | ||||
| Hardee’s |
109 | 58 | ||||||
|
|
|
|
|
|||||
| $ | 109 | $ | 58 | |||||
|
|
|
|
|
|||||
NOTE 10 — INCOME TAXES
Income tax benefit consisted of the following:
| Sixteen Weeks Ended |
Sixteen Weeks Ended |
|||||||
| May 21, 2012 | May 23, 2011 | |||||||
| Federal and state income taxes |
$ | (6,590 | ) | $ | (3,667 | ) | ||
| Foreign income taxes |
639 | 491 | ||||||
|
|
|
|
|
|||||
| Income tax benefit |
$ | (5,951 | ) | $ | (3,176 | ) | ||
|
|
|
|
|
|||||
Our effective income tax rate for the sixteen weeks ended May 21, 2012 differs from the federal statutory rate primarily as a result of non-deductible share-based compensation expense, state income taxes, federal income tax credits and the release of $5,969 of valuation allowance on state income tax credit and net operating loss (“NOL”) carryforwards. After considering all available evidence, both positive and negative, including future reversals of existing taxable temporary differences and estimated future taxable income exclusive of reversing temporary differences on a jurisdictional basis and statutory expiration dates of NOL carryforwards, we concluded that we will more likely than not realize future tax benefits related to certain of our state income tax credit and NOL carryforwards, for which an income tax benefit has not previously been recognized. As of May 21, 2012, we maintained a valuation allowance of $5,006 for a portion of our state NOL and income tax credit carryforwards. Realization of the tax benefit of such deferred income tax assets may remain uncertain for the foreseeable future, even if we generate consolidated taxable income, since they are subject to various limitations and may only be used to offset income of certain entities or in certain jurisdictions.
Our effective income tax rate for the sixteen weeks ended May 23, 2011 differs from the federal statutory rate primarily as a result of non-deductible share-based compensation expense, state income taxes, federal income tax credits and the release of $328 of valuation allowance on state NOL and income tax credit carryforwards.
We had $2,977 of unrecognized tax benefits as of January 31, 2012 that, if recognized, would affect our effective income tax rate. There were no material changes in the unrecognized tax benefits during the sixteen weeks ended May 21, 2012. We believe that it is reasonably possible that decreases in unrecognized tax benefits of up to $1,642 may be necessary within twelve months as a result of statutes closing on such items. In addition, we believe that it is reasonably possible that our unrecognized tax benefits may increase as a result of tax positions that may be taken during the next twelve months.
F-63
Table of Contents
CKE INC. AND SUBSIDIARIES
NOTES TO CONDENSED CONSOLIDATED FINANCIAL STATEMENTS
(Dollars in thousands, except per share amounts)
(Unaudited)
NOTE 11 — INCOME OR LOSS PER SHARE
Basic income or loss per common share represents the income or loss attributable to common stockholders divided by the weighted-average common shares outstanding. Diluted income or loss per common share is not presented, as we had no potentially dilutive securities during either the sixteen weeks ended May 21, 2012 or May 23, 2011. The following table represents the calculations of basic income or loss per share:
| Sixteen Weeks Ended |
Sixteen Weeks Ended |
|||||||
| May 21, 2012 | May 23, 2011 | |||||||
| Net income (loss) attributable to common stockholders |
$ | 6,696 | $ | (5,302 | ) | |||
| Weighted-average common shares outstanding |
100 | 100 | ||||||
| Basic income (loss) per common share |
$ | 66,960 | $ | (53,020 | ) | |||
NOTE 12 — SEGMENT INFORMATION
We are principally engaged in developing, operating, franchising and licensing our Carl’s Jr. and Hardee’s quick-service restaurant concepts, each of which is considered an operating segment that is managed and evaluated separately. The accounting policies of the segments are the same as those described in our summary of significant accounting policies (see Note 1 of Notes to Consolidated Financial Statements for the fiscal year ended January 31, 2012 included elsewhere in this prospectus).
F-64
Table of Contents
CKE INC. AND SUBSIDIARIES
NOTES TO CONDENSED CONSOLIDATED FINANCIAL STATEMENTS
(Dollars in thousands, except per share amounts)
(Unaudited)
| Sixteen Weeks Ended |
Sixteen Weeks Ended |
|||||||
| May 21, 2012 | May 23, 2011 | |||||||
| Revenue: |
||||||||
| Carl’s Jr. |
$ | 211,524 | $ | 206,134 | ||||
| Hardee’s |
200,665 | 194,216 | ||||||
| Other |
142 | 233 | ||||||
|
|
|
|
|
|||||
| Total |
$ | 412,331 | $ | 400,583 | ||||
|
|
|
|
|
|||||
| Segment income: |
||||||||
| Carl’s Jr. |
$ | 32,764 | $ | 27,421 | ||||
| Hardee’s |
40,195 | 33,842 | ||||||
| Other |
139 | 133 | ||||||
|
|
|
|
|
|||||
| Total |
73,098 | 61,396 | ||||||
|
|
|
|
|
|||||
| Less: General and administrative expense |
(41,791 | ) | (40,961 | ) | ||||
| Less: Facility action charges, net |
(401 | ) | (511 | ) | ||||
| Less: Other operating expenses |
— | (351 | ) | |||||
| Operating income |
30,906 | 19,573 | ||||||
| Interest expense |
(31,310 | ) | (28,850 | ) | ||||
| Other income, net |
1,149 | 799 | ||||||
|
|
|
|
|
|||||
| Income (loss) before income taxes |
$ | 745 | $ | (8,478 | ) | |||
|
|
|
|
|
|||||
| Capital expenditures: |
||||||||
| Carl’s Jr. |
$ | 7,522 | $ | 4,101 | ||||
| Hardee’s |
7,742 | 9,271 | ||||||
| Other |
461 | 209 | ||||||
|
|
|
|
|
|||||
| Total |
$ | 15,725 | $ | 13,581 | ||||
|
|
|
|
|
|||||
| Depreciation and amortization: |
||||||||
| Depreciation and amortization included in segment income: |
||||||||
| Carl’s Jr. |
$ | 11,560 | $ | 11,924 | ||||
| Hardee’s |
12,822 | 12,055 | ||||||
| Other |
— | — | ||||||
| Other depreciation and amortization(1) |
1,085 | 959 | ||||||
|
|
|
|
|
|||||
| Total depreciation and amortization |
$ | 25,467 | $ | 24,938 | ||||
|
|
|
|
|
|||||
| May 21, 2012 | January 31, 2012 | |||||||
| Total assets: |
||||||||
| Carl’s Jr. |
$ | 827,571 | $ | 779,970 | ||||
| Hardee’s |
626,882 | 633,127 | ||||||
| Other |
67,071 | 64,990 | ||||||
|
|
|
|
|
|||||
| Total |
$ | 1,521,524 | $ | 1,478,087 | ||||
|
|
|
|
|
|||||
| (1) | Represents depreciation and amortization excluded from the computation of segment income. |
F-65
Table of Contents
CKE INC. AND SUBSIDIARIES
NOTES TO CONDENSED CONSOLIDATED FINANCIAL STATEMENTS
(Dollars in thousands, except per share amounts)
(Unaudited)
NOTE 13 — RELATED PARTY TRANSACTIONS
Transactions with Apollo Management VII, L.P.
Pursuant to our management services agreement with Apollo Management VII, L.P. and in exchange for on-going investment banking, management, consulting and financial planning services that will be provided to us, we are obligated to pay Apollo Management VII, L.P. an aggregate annual management fee of $2,500, which may be increased at Apollo Management VII, L.P.’s sole discretion up to an amount equal to two percent of our Adjusted EBITDA, as defined in our Credit Facility. We recorded $765 and $767 in management fees, which are included in general and administrative expense in our accompanying unaudited Condensed Consolidated Statements of Operations for the sixteen weeks ended May 21, 2012 and May 23, 2011, respectively.
Transactions with Board of Directors
Certain members of our Board of Directors are also our franchisees. These franchisees regularly pay royalties and purchase equipment and other products from us on the same terms and conditions as our other franchisees. During the sixteen weeks ended May 21, 2012 and May 23, 2011, total revenue generated from related party franchisees was $2,087 and $3,361, respectively, which is included in franchised restaurants and other revenue in our accompanying unaudited Condensed Consolidated Statement of Operations. As of May 21, 2012 and January 31, 2012, our related party trade receivables from franchisees were $358 and $252, respectively.
NOTE 14 — SUPPLEMENTAL CASH FLOW INFORMATION
| Sixteen Weeks Ended |
Sixteen Weeks Ended |
|||||||
| May 21, 2012 | May 23, 2011 | |||||||
| Cash paid for: |
||||||||
| Interest, net of amounts capitalized |
$ | 3,549 | $ | 1,656 | ||||
| Income taxes paid (received), net |
1,588 | (727 | ) | |||||
| Non-cash investing and financing activities: |
||||||||
| Capital lease obligations incurred to acquire assets |
576 | 1,665 | ||||||
| Accrued property and equipment purchases |
1,346 | 2,765 | ||||||
During the sixteen weeks ended May 23, 2011, we recorded a non-cash transaction to acquire three Hardee’s restaurants from one of our franchisees for an aggregate purchase price of $1,500. The entire purchase price was applied as a reduction of outstanding promissory notes due to the Company. See Note 3 for additional discussion.
F-66
Table of Contents
CKE INC.
Table of Contents
PART II
INFORMATION NOT REQUIRED IN THE PROSPECTUS
Item 13. Other Expenses of Issuance and Distribution
Set forth below is a table of the registration fee for the Securities and Exchange Commission, the filing fee for the National Association of Securities Dealers, Inc., the listing fee for the New York Stock Exchange and estimates of all other expenses to be incurred in connection with the issuance and distribution of the securities described in the registration statement, other than underwriting discounts and commissions:
| SEC registration fee |
$ | 11,460 | ||
| FINRA filing fee |
* | |||
| NYSE listing fee |
* | |||
| Printing and engraving expenses |
* | |||
| Legal and Accounting fees and expenses |
* | |||
| Transfer agent and registrar fees |
* | |||
| Miscellaneous expenses (including road show) |
* | |||
|
|
|
|||
| Total |
$ | * | ||
|
|
|
| * | To be completed by amendment. |
Item 14. Indemnification of Directors and Officers
CKE Inc. is incorporated under the laws of the State of Delaware. Reference is made to Section 102(b)(7) of the Delaware General Corporation Law (“DGCL”), which enables a corporation in its original certificate of incorporation or an amendment thereto to eliminate or limit the personal liability of a director for violations of the director’s fiduciary duty, except (1) for any breach of the director’s duty of loyalty to the corporation or its stockholders, (2) for acts or omissions not in good faith or which involve intentional misconduct or a knowing violation of law, (3) pursuant to Section 174 of the DGCL, which provides for liability of directors for unlawful payments of dividends of unlawful stock purchase or redemptions or (4) for any transaction from which a director derived an improper personal benefit.
Reference is also made to Section 145 of the DGCL, which provides that a corporation may indemnify any person, including an officer or director, who is, or is threatened to be made, party to any threatened, pending or completed legal action, suit or proceeding, whether civil, criminal, administrative or investigative, other than an action by or in the right of such corporation, by reason of the fact that such person was an officer, director, employee or agent of such corporation or is or was serving at the request of such corporation as a director, officer, employee or agent of another corporation or enterprise. The indemnity may include expenses (including attorneys’ fees), judgments, fines and amounts paid in settlement actually and reasonably incurred by such person in connection with such action, suit or proceeding, provided such officer, director, employee or agent acted in good faith and in a manner he reasonably believed to be in, or not opposed to, the corporation’s best interest and, for criminal proceedings, had no reasonable cause to believe that his conduct was unlawful. A Delaware corporation may indemnify any officer or director in an action by or in the right of the corporation under the same conditions, except that no indemnification is permitted without judicial approval if the officer or director is adjudged to be liable to the corporation. Where an officer or director is successful on the merits or otherwise in the defense of any action referred to above, the corporation must indemnify him against the expenses that such officer or director actually and reasonably incurred.
Our amended and restated by-laws provides for indemnification of the officers and directors to the full extent permitted by applicable law. The Underwriting Agreement provides for indemnification by the underwriters of the registrant and its officers and directors for certain liabilities arising under the Securities Act, or otherwise.
II-1
Table of Contents
Item 15. Recent Sales of Unregistered Securities
On April 15, 2010, in connection with its incorporation, the registrant issued 100 shares of its common stock to Apollo CKE Holdings, L.P. for $1.00 in cash. These shares were offered and sold in reliance on Section 4(2) of the Securities Act as the offering and sale of the shares of common stock did not involve a public offering.
Item 16. Exhibits and Financial Statement Schedules
(a) Exhibits
See the Exhibit Index immediately following the signature page hereto, which is incorporated by reference as if fully set forth herein.
(b) Financial Statement Schedules
All financial statement schedules, with the exception of Schedule I, have been omitted since the required information is included in the Consolidated Financial Statements or the notes thereto, or the omitted schedules are not required.
Item 17. Undertakings
The undersigned Registrant hereby undertakes to provide to the underwriters at the closing specified in the Underwriting Agreement certificates in such denominations and registered in such names as required by the underwriters to permit prompt delivery to each purchaser.
Insofar as indemnification for liabilities arising under the Securities Act of 1933 (the “Securities Act”) may be permitted to directors, officers and controlling persons of the Registrant pursuant to the foregoing provisions, or otherwise, the Registrant has been advised that in the opinion of the Securities and Exchange Commission such indemnification is against public policy as expressed in the Securities Act and is, therefore, unenforceable. In the event that a claim for indemnification against such liabilities (other than the payment by the Registrant of expenses incurred or paid by a director, officer or controlling person of the Registrant in the successful defense of any action, suit or proceeding) is asserted by such director, officer or controlling person in connection with the securities being registered, the Registrant will, unless in the opinion of its counsel the matter has been settled by controlling precedent, submit to a court of appropriate jurisdiction the question whether such indemnification by it is against public policy as expressed in the Securities Act and will be governed by the final adjudication of such issue.
The undersigned Registrant hereby undertakes that:
| (1) | For purposes of determining any liability under the Securities Act, the information omitted from the form of prospectus filed as part of this registration statement in reliance upon Rule 430A and contained in a form of prospectus filed by the Registrant pursuant to Rule 424(b)(1) or (4) or 497(h) under the Securities Act shall be deemed to be part of this registration statement as of the time it was declared effective. |
| (2) | For the purpose of determining any liability under the Securities Act, each post-effective amendment that contains a form of prospectus shall be deemed to be a new registration statement relating to the securities offered therein, and the offering of such securities at that time shall be deemed to be the initial bona fide offering thereof. |
II-2
Table of Contents
Signatures
Pursuant to the requirements of the Securities Act of 1933, as amended, the Registrant has duly caused this Amendment No. 1 to the registration statement to be signed on its behalf by the undersigned, thereunto duly authorized, in the City of Carpinteria, State of California on July 3, 2012.
| CKE INC. | ||
| By: | /s/ Andrew F. Puzder | |
| Name: | Andrew F. Puzder | |
| Title: | Chief Executive Officer (Principal Executive Officer) | |
Pursuant to the requirements of the Securities Act of 1933, this Amendment No. 1 to the registration statement has been signed by the following persons in the capacities and on the dates indicated.
| /s/ Andrew F. Puzder Andrew F. Puzder |
Chief Executive Officer (Principal Executive Officer) and Director |
July 3, 2012 | ||
| /s/ Theodore Abajian Theodore Abajian |
Executive Vice President and Chief Financial Officer (Principal Financial Officer) |
July 3, 2012 | ||
| /s/ Reese Stewart Reese Stewart |
Senior Vice President and Chief Accounting Officer (Principal Accounting Officer) |
July 3, 2012 | ||
| * Peter P. Copses |
Chairman of the Board | |||
| * Robert J. DiNicola |
Director | |||
| * George G. Golleher |
Director | |||
| * Lance A. Milken |
Director | |||
| * Daniel E. Ponder, Jr. |
Director | |||
| * Jerold H. Rubinstein |
Director | |||
| * C. Thomas Thompson |
Director | |||
| *By: | /s/ Andrew F. Puzder | July 3, 2012 | ||||||
| Andrew F. Puzder | ||||||||
| Attorney-in-Fact | ||||||||
S-1
Table of Contents
EXHIBIT INDEX
| 1.1 | Form of Underwriting Agreement (4) | |
| 2.1 | Agreement and Plan of Merger, dated as of April 18, 2010, by and among Columbia Lake Acquisition Holdings, Inc., Columbia Lake Acquisition Corp. and CKE Restaurants, Inc. (1) | |
| 3.1 | Amended and Restated Certificate of Incorporation of CKE Inc. (4) | |
| 3.2 | Amended and Restated Bylaws of CKE Inc. (4) | |
| 5.1 | Opinion of Morgan, Lewis & Bockius LLP (4) | |
| 10.1 | Senior Unsecured PIK Toggle Notes Indenture, dated March 14, 2011, between CKE Inc. and Wells Fargo Bank, National Association, as Trustee (5) | |
| 10.2 | Form of 10.50%/11.25% Senior Unsecured PIK Toggle Notes due 2016 (included in the indenture filed as Exhibit 10.1) (5) | |
| 10.3 | Senior Secured Second Lien Notes Indenture, dated as of July 12, 2010, between Columbia Lake Acquisition Corp. and Wells Fargo Bank, National Association, as Trustee (1) | |
| 10.4 | First Supplemental Indenture, dated as of July 12, 2010, by and among CKE Restaurants, Inc., the Guarantors party thereto and Wells Fargo Bank, National Association, as Trustee, to the Senior Secured Second Lien Notes Indenture, dated as of July 12, 2010, between Columbia Lake Acquisition Corp. and Wells Fargo Bank, National Association, as Trustee (1) | |
| 10.5 | Form of 11.375% Senior Secured Second Lien Notes due 2018 (included in the indenture filed as Exhibit 4.1 to the Registration Statement on Form S-4 (File No. 333-169977) by CKE Restaurants, Inc. on October 15, 2010) (1) | |
| 10.6 | Registration Rights Agreement, dated July 12, 2010, by and among Columbia Lake Acquisition Corp., CKE Restaurants, Inc, and the Guarantors party thereto and Morgan Stanley & Co. Incorporated, Citigroup Global Markets, Inc. and RBC Capital Markets Corporation, as Initial Purchasers (1) | |
| 10.7 | Credit Agreement, dated as of July 12, 2010, among Columbia Lake Acquisition Holdings, Inc., Columbia Lake Acquisition Corp. (merged with and into CKE Restaurants, Inc.), as Borrower, the Lenders party thereto, Morgan Stanley Senior Funding, Inc., as Administrative Agent and Collateral Agent, Citicorp North America, Inc. and Royal Bank of Canada, as Co-Syndication Agents, and Morgan Stanley Senior Funding, Inc., Citicorp Global Markers Inc. and RBC Capital Markets, as Joint Bookrunners and Joint-Lead Arrangers (1) | |
| 10.8 | Intercreditor Agreement, dated as of July 12, 2010, among Morgan Stanley Senior Funding, Inc., as Credit Agreement Agent, each Other First-Priority Lien Obligations Agent party thereto, Wells Fargo Bank, National Association, as Trustee, and each collateral agent for any Future Second Lien Indebtedness party thereto (1) | |
| 10.9 | Collateral Agreement, dated as of July 12, 2010, among Columbia Lake Acquisition Corp. (merged with and into CKE Restaurants, Inc.), as Issuer, each Guarantor identified therein, and Wells Fargo Bank, National Association, as Trustee and Collateral Agent (1) | |
| 10.10 | Guarantee and Pledge Agreement, dated as of July 12, 2010, between Columbia Lake Acquisition Holdings Corp. (merged with and into CKE Inc.) and Morgan Stanley Senior Funding, Inc., as Administrative Agent and Collateral Agent (2) | |
| 10.11 | Notes Copyright Security Agreement, dated as of July 12, 2010, among the Guarantors identified therein and Wells Fargo Bank, National Association, as Trustee and Collateral Agent (1) | |
| 10.12 | Copyright Security Agreement, dated as of July 12, 2010, among the Grantors identified therein, and Morgan Stanley Senior Funding, Inc., as Administrative Agent and Collateral Agent (2) | |
Table of Contents
| 10.13 | Notes Patent Security Agreement, dated as of July 12, 2010, among the Guarantors identified therein and Wells Fargo Bank, National Association, as Trustee and Collateral Agent (1) | |
| 10.14 | Patent Security Agreement, dated as of July 12, 2010, among the Grantors identified therein and Morgan Stanley Senior Funding, Inc., as Administrative Agent and Collateral Agent (2) | |
| 10.15 | Notes Trademark Security Agreement, dated as of July 12, 2010, among the Guarantors identified therein and Wells Fargo Bank, National Association, as Trustee and Collateral Agent (1) | |
| 10.16 | Trademark Security Agreement, dated as of July 12, 2010, among the Grantors identified therein and Morgan Stanley Senior Funding, Inc., as Administrative Agent and Collateral Agent (2) | |
| 10.17 | Management Services Agreement, dated as of July 12, 2010, among CKE Restaurants, Inc., CKE Inc., and Apollo Management VII, L.P. (1) | |
| 10.18 | Amended and Restated Limited Partnership Agreement of Apollo CKE Holdings, L.P., dated as of January 13, 2012, among Apollo CKE GP, LLC, as the General Partner, Apollo CKE Investors, L.P., as a Limited Partner, and the Management Limited Partners, each as a Limited Partner (3) | |
| 10.19 | Employment Agreement with Andrew F. Puzder (1) | |
| 10.20 | Employment Agreement with E. Michael Murphy (1) | |
| 10.21 | Employment Agreement with Theodore Abajian (1) | |
| 10.22 | CKE Inc. Stock Incentive Plan (4) | |
| 10.23 | Form of Nominating Agreement (4) | |
| 10.24 | Form of Indemnification Agreement between CKE Inc. and each of its directors and executive officers (4) | |
| 10.25 | Form of Registration Rights Agreement by and among CKE Inc. and the stockholders party thereto (4) | |
| 10.26 | Form of Hardee’s Restaurant Franchise Agreement (3) | |
| 10.27 | Form of Carl’s Jr. Restaurant Franchise Agreement (3) | |
| 21.1 | Subsidiaries of CKE Inc. (5) | |
| 23.1 | Consent of Independent Registered Public Accounting Firm (6) | |
| 23.2 | Consent of Morgan, Lewis & Bockius LLP (included in Exhibit 5.1) (4) | |
| 24.1 | Power of Attorney (5) | |
| (1) | Filed previously by CKE Restaurants, Inc. as an exhibit to the Registration Statement on Form S-4 (File No. 333-169977) on October 15, 2010. |
| (2) | Filed previously by CKE Restaurants, Inc. as an exhibit to its Annual Report on Form 10-K on April 15, 2011. |
| (3) | Filed previously by CKE Restaurants, Inc. as an exhibit to its Quarterly Report on Form 10-Q on June 27, 2012. |
| (4) | To be filed by amendment. |
| (5) | Previously filed. |
| (6) | Filed herewith. |